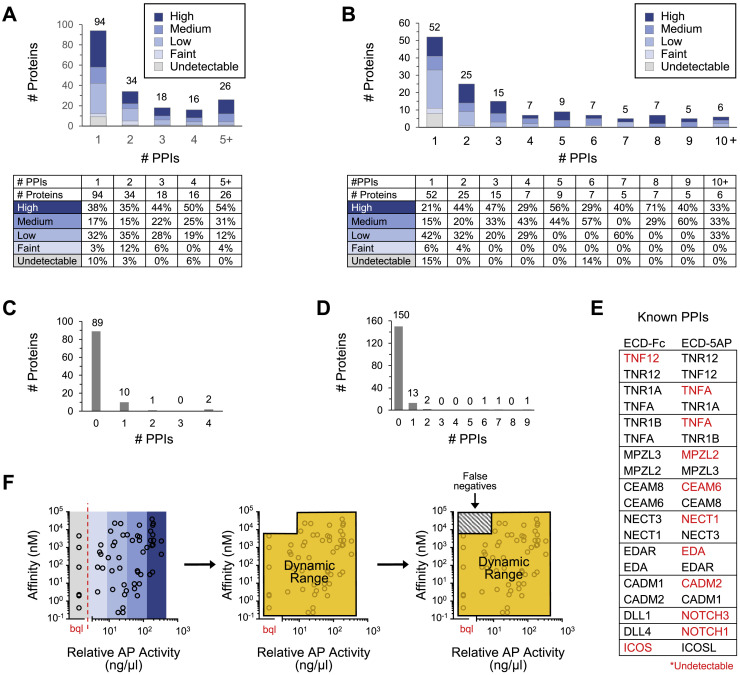
Figure S4.
Distribution of Bait and Prey Expression and Dynamic Range, Related to Data S3 and S4
(A) Number of bait proteins engaging in one to > 5 PPIs by qualitative expression level as assessed by western blot.
(B) Number of prey proteins engaging in one to > 10 PPIs by qualitative expression level as assessed by western blot.
(C) Number of PPIs involving bait proteins that were undetectable in conditioned media by western blot.
(D) Number of PPIs involving prey proteins that were undetectable in conditioned media by western blot and quantitative AP enzymatic assay.
(E) Known PPIs involving bait or prey proteins that were undetectable in conditioned media by western blot (bait and prey) and quantitative AP enzymatic assay (prey). PPIs listed are the only PPIs observed in the screen for these undetectable bait and prey proteins. Red font, undetectable protein.
(F) Relative AP activity (ng/μl) versus binding affinity (nM) for 34 known PPIs observed in the screen with published KD values to illustrate the dynamic range of apECIA. PPIs that fall outside the dynamic range (orange perimeter), which is determined by the combined effect of PPI affinity and bait and prey concentrations, will likely result in false negatives (box with gray slashes). Blue shaded bars (colors as in panels A and B) represent qualitative prey protein levels as determined by western blot. Red dotted line segregates prey that were both undetectable by Western and below the quantitation limit (bql) using the AP enzymatic assay. The break in the x axis is to emphasize that data points to the left of the break (bql) could not be quantitated and, as such, are all positioned vertically in the center of the gray bar.

