Supplemental Digital Content is available in the text
Keywords: gait disorders, movement disorders, neurological conditions, quantitative gait analysis
Abstract
To identify basic gait features and abnormal gait patterns that are common to different neurological or musculoskeletal conditions, such as cerebral stroke, Parkinsonian disorders, radiculopathy, and musculoskeletal pain.
In this retrospective study, temporal-spatial, kinematic, and kinetic gait parameters were analyzed in 424 patients with hemiplegia after stroke, 205 patients with Parkinsonian disorders, 216 patients with radiculopathy, 167 patients with musculoskeletal pain, and 316 normal controls (total, 1328 subjects). We assessed differences according to the condition and used a community detection algorithm to identify subgroups within each condition. Additionally, we developed a prediction model for subgroup classification according to gait speed and maximal hip extension in the stance phase.
The main findings can be summarized as follows. First, there was an asymmetric decrease of the knee/ankle flexion angles in hemiplegia and a marked reduction of the hip/knee range of motion with increased moment in Parkinsonian disorders. Second, three abnormal gait patterns, including fast gait speed with adequate maximal hip extension, fast gait speed with inadequate maximal hip extension, and slow gait speed, were found throughout the conditions examined. Third, our simple prediction model based on gait speed and maximal hip extension angle was characterized by a high degree of accuracy in predicting subgroups within a condition.
Our findings suggest the existence of specific gait patterns within and across conditions. Our novel subgrouping algorithm can be employed in routine clinical settings to classify abnormal gait patterns in various neurological disorders and guide the therapeutic approach and monitoring.
1. Introduction
Gait is one of most complex motor skills in humans. The control of gait relies on a coordinated network of multiple systems, including the central nervous system, peripheral nervous system, and musculoskeletal system.1,2 Since a gait disorder can result from a network disruption within any of these systems, its clinical presentation can be associated with heterogeneous and complex features.[3] Thus, the development of a method to classify gait disorders according to their common features is the first step for a clinical assessment aimed at improving gait.
There are several gait classifications that are based on different aspects. One of the most popular classifications categorizes gait disorders according to the main clinical features. However, this classification relies on the clinician's experience without incorporating objective gait characteristics.2,4,5 Snijder et al proposed a modified three-step classification of gait disorders in which a clinical diagnosis is established considering the possible gait disorder according to the clinical findings, identifying a probable diagnosis using clinical information, and defining the gait disorder according to histopathological findings.[2] Although Snijder et al's classification covers various aspects of gait disorders, it relies on the clinician's experience given that there are limited objective data on gait characteristics.2,6 Therefore, quantitative methods sampling temporal-spatial parameters, kinematics of limb movement (joint angles), and kinetics (reactive forces), have been developed to overcome these limitations.2,3,7,8
The first studies on gait using quantitative outcome measures were conducted in the 1960s, taking temporal-spatial parameters, kinematics of limb movement in three planes (joint angles), and kinetics (reactive forces) into account.2,3 Some previous studies have classified the gait pattern using quantitative gait analysis in patients with neurological disorders. Winters et al used sagittal plane kinematic data of quantitative gait analysis in adult hemiplegic cerebral palsy patients to classify them into four distinct groups with homogenous gait patterns.[9] Hullin et al followed this classification while collecting quantitative gait analysis data from 26 children with hemiplegic cerebral palsy; however, only one group corresponded to the groups by Winters et al.[10] One meta-analysis and the another study documented gait pattern in patients with neurological disorders according to quantitative gait analysis.11,12 However, classification studies based on quantitative gait analyses have had small sample sizes, and were potentially biased due to the inclusion of a few selected quantitative gait variables.9,10,11,12 A more critical issue is the lack of identification of common subgroups across various etiologies.9,10,11
The aim of this study was to compare the gait characteristics of neurological and musculoskeletal disorders that affect gait. A second aim was to identify subgroups within each disease using multiple quantitative gait parameters. Finally, we developed a model to predict which subgroup a patient would be assigned to, based on their data.
2. Methods
2.1. Participants
We retrospectively collected quantitative gait data and reviewed the primary physicians’ medical records of patients that had been examined between January 2000 and December 2016. A total of 3155 datasets were acquired. We excluded 184 datasets due to insufficient walking abilities and consequent poor recordings of gait parameters. The data were categorized based on the primary physicians’ diagnosis of the most likely cause of gait disorder, and included hemiplegia after stroke, quadriplegia due to stroke or traumatic brain injury, Parkinsonian disorders, myelopathy, radiculopathy, peripheral neuropathy other than radiculopathy, musculoskeletal pain, amputation, normal aging, and exposure to the herbicide Agent Orange.
We only included data from the first measurement session in case of multiple sessions (n = 887 datasets excluded). Due to the small number of cases and the possibility of bias due to imbalance, we excluded female subjects (n = 60), patients with traumatic brain injury (n = 20), myelopathy (n = 24), and peripheral neuropathy (n = 28). Individuals that had been exposed to Agent Orange (n = 298) were also excluded because their gait analysis data were linked to the national disability grade and could have therefore resulted in a potential bias (i.e., they might walk badly on purpose). Patients with lower limb amputation (n = 148) and quadriplegia (n = 161) were excluded because they did not fit the purpose of the present study. Seventeen subjects were excluded due to the absence of medical records. This resulted in a final total of 1012 patients with hemiplegia, Parkinsonian disorders, radiculopathy, and musculoskeletal pain, and 316 normal aging subjects (Fig. 1). This study has been approved by the local institutional review board and has been performed in accordance with the ethical standards laid down in the 1964 Declaration of Helsinki (approval no. 2016-02-015). The institutional review board committee waived the requirement for informed consent given the retrospective nature of the study.
Figure 1.
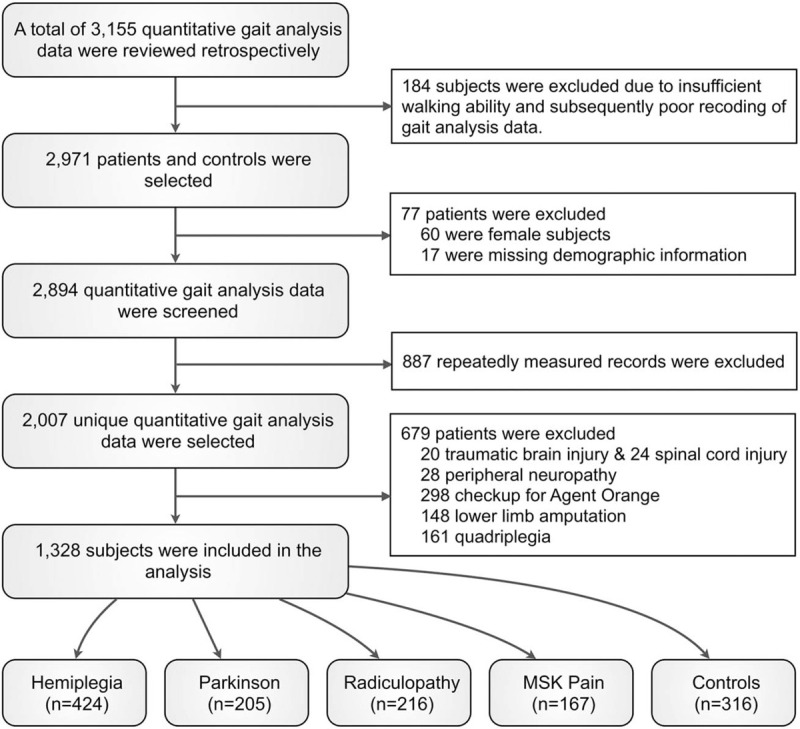
Study profile. We retrospectively collected quantitative gait data including 424 patients with hemiplegia, 205 patients with Parkinsonian disorders, 216 patients with radiculopathy, 167 patients with musculoskeletal pain (MSK), and 316 normal controls were included.
2.2. Gait data acquisition
Gait data were acquired using a three-dimensional motion analysis of lower extremities and external ground reaction forces. Before 2012, 833 datasets were included, recorded using a Vicon 370 with a five infrared, 60 Hz camera motion analysis system (Oxford Metrics Ltd., Oxford, UK) and two force plates (sampling rate 1200 Hz; Advanced Mechanical Technology Inc., Watertown, MA); from 2012, 495 datasets were included, recorded using a Motion Analysis with an eight infrared, 60 Hz camera motion analysis system (Motion Analysis Corp., Santa Rosa, CA) and three force plates (sampling rate 1200 Hz; Kistler Corp., Amherst, NY). Simultaneous recordings of temporal-spatial, lower extremity kinematics, and foot-floor contact patterns were made as patients walked six meters with bare feet at their self-selected speed. Joint kinematics and kinetics were calculated using the Vicon Workstation 512 (Oxford Metrics Ltd., Oxford, UK) or the Ottotrack (Motion Analysis Corporation, Santa Rosa, CA).
2.3. Data preparation
We selected a total of 36 gait variables corresponding to temporal-spatial, kinematic, and kinetic parameters. The temporal-spatial parameters were gait speed (cm/s), stride length (cm), step length (cm), cadence (steps/min), initial double support time (s), single support time (s), and terminal double support time (s). The kinematic parameters (degrees) were maximal hip extension, knee extension, and ankle flexion angle in the stance phase and maximal hip, knee, and ankle flexion angle in the swing phase. The kinetic parameters for hip, knee, and ankle joints were peak extension moment (Nm/kg) and peak power generation (W/kg, supplementary Figure 1). For kinematic and kinetic parameters, the limbs were set as affected or unaffected. The affected side in the hemiplegia group was identified according to medical records, and the affected side in all other groups was identified according to a shorter single support time.[13]
2.4. Patient-patient similarity matrix and subgroup identification
Similarity was evaluated for the 36 gait parameters between any two patients. For each group, we computed a patient–patient matrix using the Pearson's correlation coefficient. Then, a sparse similarity matrix was obtained by applying a threshold of corrected P < .05 using the Benjamini–Hochberg method.[14] Furthermore, we identified subgroups in each condition using a community detection algorithm (supplementary Figure 2).15,16 Subgroups that included less than ten patients were considered as outliers and excluded from further analyses. The Louvain community detection algorithm uses a heuristic approach to compute modularity, yielding slightly different communities run by run.[16] Therefore, we performed 1000 independent community detection processes and identified the subgroup that had the highest average value of normalized mutual information over all other optimization results, as described in a previous report.[17] Significant gait parameters that distinguished between subgroups were identified using the Cohen's effect size. We calculated effect sizes of all parameters between subgroups pairs (Fig. 2).
Figure 2.
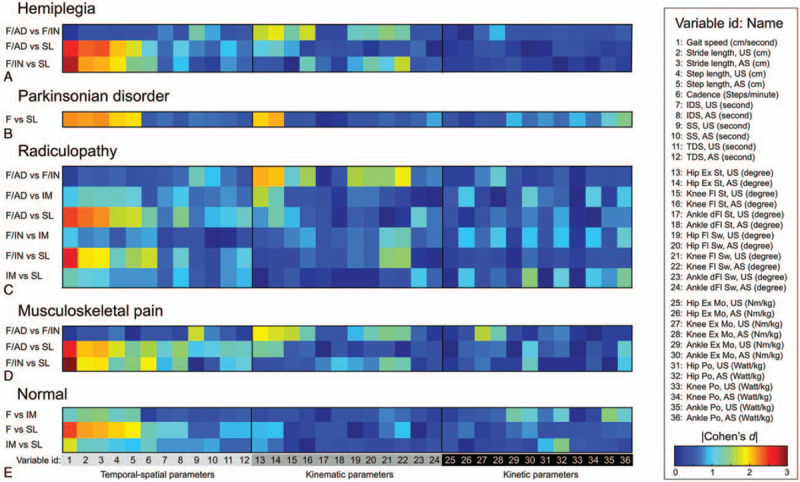
Cohen's effect size for each gait parameter computed between the subgroups. The color scale represents the Cohen's effect size for the pairwise post hoc analyses between subgroups for each neurological or musculoskeletal condition: (A) Hemiplegia, (B) Parkinsonian disorders, (C) Radiculopathy, (D) Musculoskeletal pain, and (E) Normal controls.
2.5. Validation of subgroups using speed and maximal hip extension angle
To test whether specific parameters selected based on the steps described above could identify subgroups, we computed the Euclidean distance between the mean values of gait variables in each subgroup and individual gait variables using the following equation:
 |
where m ik is the mean value of the k-th gait variable of the i-th subgroup, g ik is the k-th gait variable of the j-th participant, and Ω is the set of selected variables. Then, the subgroup membership of the j-th participant was determined using the minimum value of d ij. For example, if a participant (j) had Euclidean distances d 1j = 13.5, d 2j = 45.4, and d 3j = 54.7 with respect to three subgroups, then the participant (j) would be assigned to the subgroup 1 because the gait pattern for this participant shows the maximum similarity (i.e., minimum dissimilarity) with subgroup 1.
2.6. Statistical analysis
One-way analysis of variance (ANOVA) with Bonferroni correction was used to test group differences. For each group, we conducted an ANOVA to identify any subgroup effects. Since a total of 36 gait pattern variables were compared, a multiple comparison correction using the Benjamini–Hochberg procedure was applied.[14] Additionally, eta-squared (η 2), which is the most commonly reported estimate of effect size for the ANOVA, was computed using the sum of squares for the effect of interest divided by the total sum of squares. Significant gait variables were identified at an FDR-corrected threshold of P < .05 with large effect sizes (η 2 > 0.14).[18] Finally, pairwise post hoc comparisons among subgroups were conducted for the significant gait variables.
3. Results
3.1. Between-group differences
General characteristics are shown in Table 1. The hemiplegia group had a decrease in the affected knee/ankle flexion angle in the stance and swing phases as compared to the unaffected side. The Parkinsonian disorders group showed a marked reduction in maximal hip extension in the stance phase and increased extension moment in the hip/knee joints as compared to the other groups. The radiculopathy and musculoskeletal pain groups did not have statistical differences in any parameter (Table 1 and Fig. 3).
Table 1.
Quantitative gait analysis data in all groups.
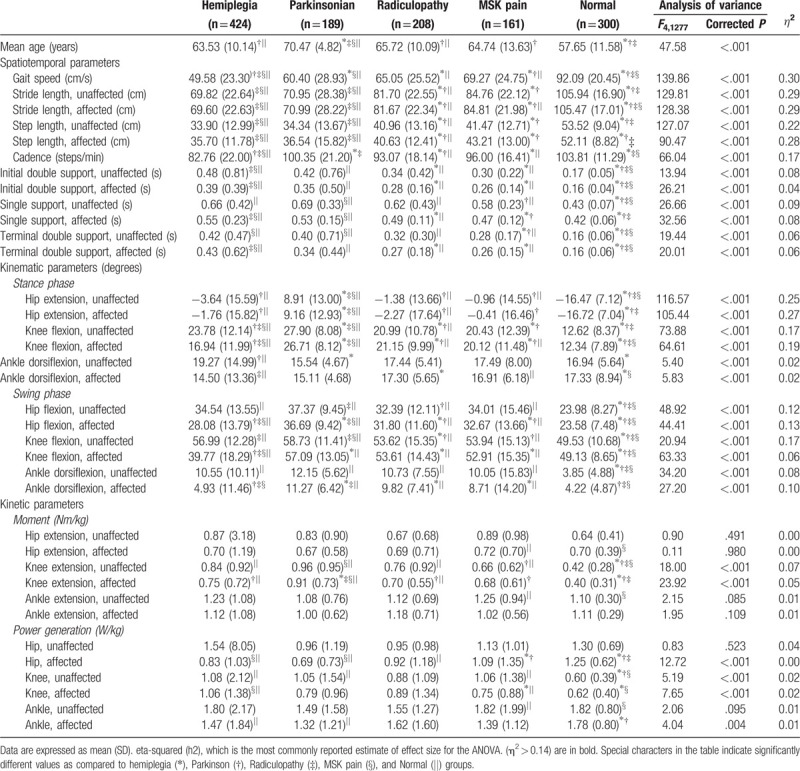
Figure 3.
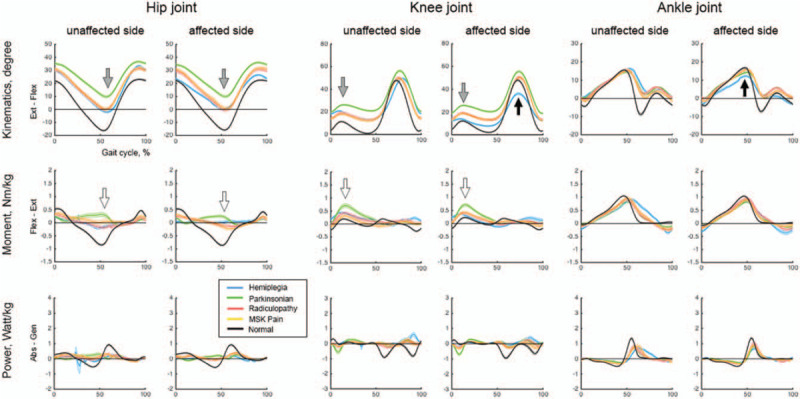
Kinematic and kinetic variables for various conditions. The kinematic and kinetic graph of hemiplegia showed an asymmetric decrease (black arrow). The graph of Parkinsonian disorders showed decreased joint movements (gray arrow) and increased extension moments (white arrow).
3.2. Nomenclature for subgroups within disease groups
Each group was classified into subgroups having similar gait patterns. According to the community detection algorithm, the following subjects failed to be categorized into a subgroup or were present in a subgroup of less than ten patients: 16 Parkinsonian, 8 radiculopathy, and 6 musculoskeletal pain patients, and 16 control subjects. Gait speed (temporal-spatial variable) and maximal hip extension angle (kinematic variable) were the measurements with the largest effect size for the ANOVA and therefore the most suited to distinguish between subgroups. There was no effective parameter for distinguishing between subgroups when looking at kinetic variables (Figs. 2 and 4). Subgroup labeling proceeded as follows. First, if the gait speed was significantly different between the subgroups, then the subgroups were named Fast (F), Intermediate (IM), and Slow (SL). Then, if the gait speed was not significantly different between two F subgroups within a group, then adequate (AD) or inadequate (IN) was added to the subgroups’ name according to the maximal hip extension angle in the stance phase within the normal range (defined as the mean ± 2 standard deviations from the maximal hip extension angle in the normal aging group).
Figure 4.
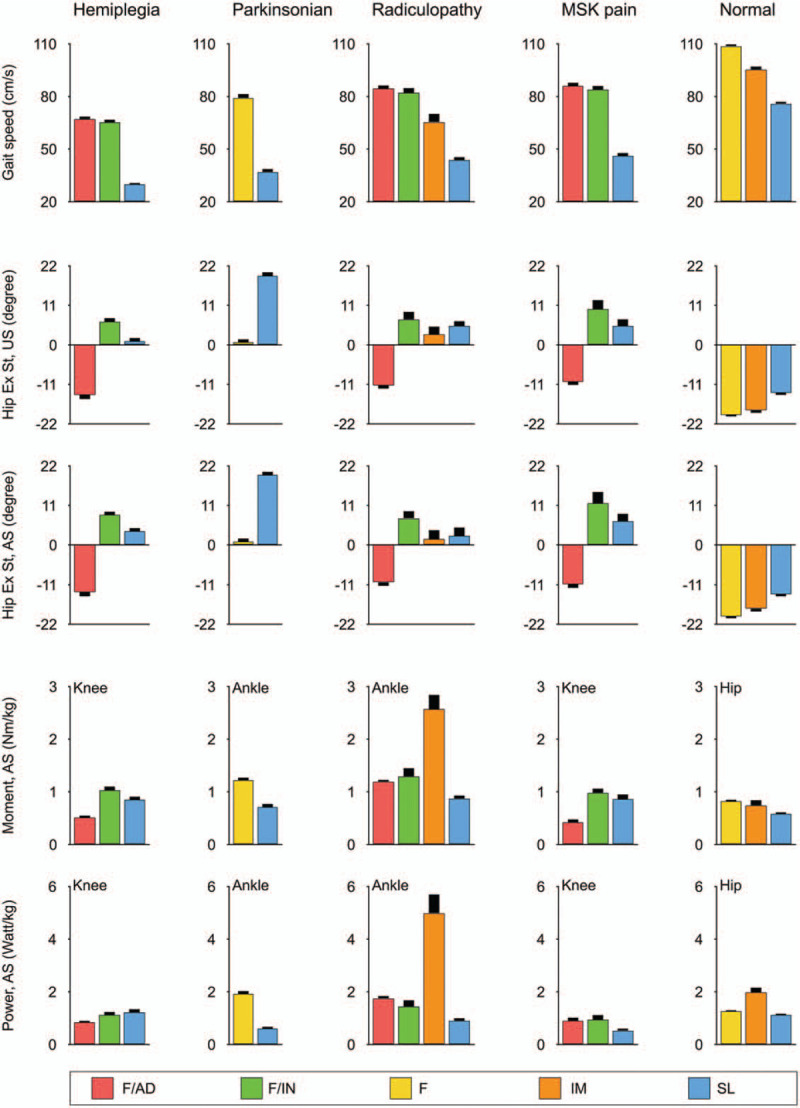
Key parameters for distinguishing subgroup identification. Gait speed, maximal hip extension in stance phase, maximal extension moment, and power generation are shown foe each subgroup.
3.3. Subgroup comparison within disease groups
We identified three common subgroups (F/AD, F/IN, and SL) within the hemiplegia, radiculopathy, and musculoskeletal pain groups. The F/AD subgroup had the fastest gait speed with close-to-normal kinematic and kinetic curves among the subgroups within the disease groups. The F/IN subgroup had increased hip flexion angle throughout the whole gait cycle with increased hip flexion moment in the loading response and increased knee flexion angle in the swing phase with increased knee extension moment (black arrow in Figs. 5A, 6A and B, and supplementary Table 1 - 4). The SL subgroup had a shortest stride length among subgroups with an absence of ankle push-off in the pre-swing phase. There was one more subgroup (IM) in the radiculopathy group. The IM subgroup had kinematic curves similar to those of the SL subgroup within the same disease group, but increased hip/ankle extension and knee flexion moment and power on the affected side (white arrow in Figure 6A and supplementary Table 3).
Figure 5.
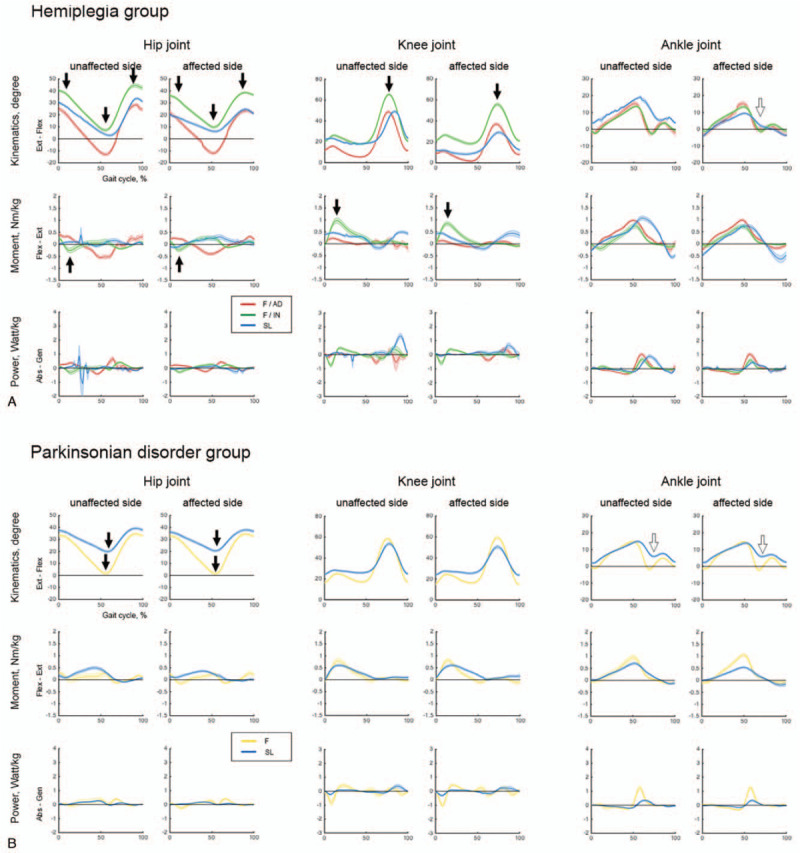
Kinematic and kinetic variables in subgroups within the hemiplegia and Parkinsonian disorders groups. (A) Hemiplegia. (B) Parkinsonian disorders.
Figure 6.
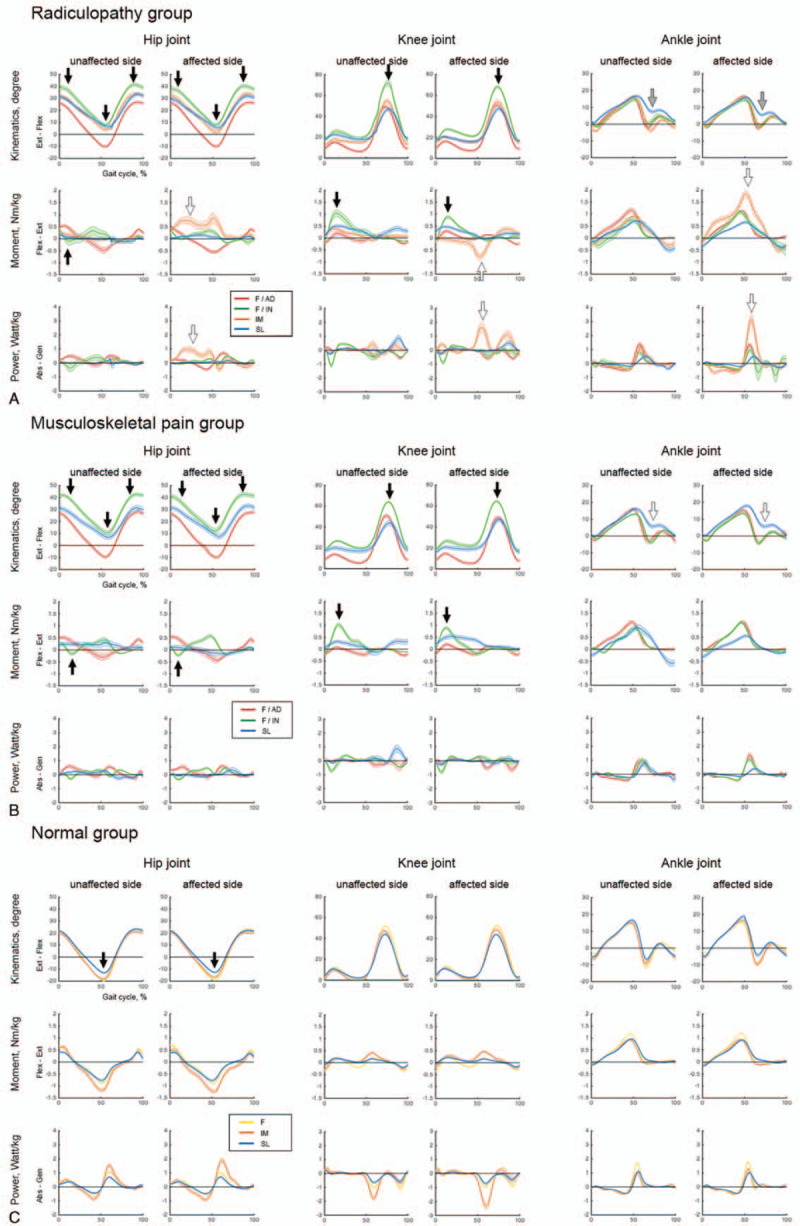
Kinematic and kinetic variables in subgroups within the radiculopathy, musculoskeletal pain, and normal groups. (A) Radiculopathy. (B) Musculoskeletal pain. (C) Normal controls.
We identified two subgroups (F and SL) in the Parkinsonian disorders group (Fig. 5B and supplementary Table 2). The F subgroup had better maximal hip extension than the SL subgroup. The SL subgroup had a short stride length with an absence of ankle push-off in the pre-swing phase, which means it shared similar characteristics with the common SL subgroup in hemiplegia, radiculopathy, and musculoskeletal pain groups (white arrow in Fig. 5B and supplementary Table 2). The control group was divided into three subgroups (F, IM, and SL) with significantly different gait speeds and adequate maximal hip extension angles (Fig. 6C and supplementary Table 5).
3.4. Validation of subgroups using selected gait parameters
The subjects were re-classified into subgroups according to the gait speed with maximal hip extension angle in the stance phase. The correct classification accuracy was 89.6%, 84.9%, 72.6%, 83.6%, and 70.4% for the hemiplegia, parkinsonism, radiculopathy, musculoskeletal pain, and control groups, respectively.
4. Discussion
The aim of this was
-
1.
to compare between disease groups especially each neurologic and/or musculoskeletal conditions (Fig. 3),
-
2.
to identify novel subgroups depending on gait patterns in each disease groups by using community detection methods.
There are too many variables in the quantitative gait analysis, so we could not divide the subgroup using it as a whole. Instead, 36 parameters representing gait characteristics in aspects of temporal-spatial, kinematic and kinetics were extracted and the subgroups were classified using the community detection method. Then, graphs were plotted in each subgroups, using the quantitative gait analysis data of the subgroups (Figs. 5 and 6). This study showed that two to four different subgroups identified and a common trend through the disease groups. From these different subgroups, two main factors were found to be differentiated. First, the gait speed characterizes the fast(F)/intermediate(IM)/slow(SL) subgroups. Second, the maximal hip extension in stance phase characterizes the adequate(AD)/inadequate (IN) subgroups.
4.1. Comparison between disease groups
Asymmetry was the main feature in hemiplegia due to stroke. Stroke causes damage to the nerve cells and the central nervous system pathways; this results in diminished muscle strength with spasticity, which is the main contributor to gait impairment.19,20 The hemiplegic group was characterized by an asymmetric decrease in motion on the affected side as compared to the unaffected side, mainly due to muscle weakness with extensor muscle spasticity.2,19,21
We found that the main feature in the Parkinsonian disorders was a resistance to joint movement. Although the underlying pathogenetic mechanisms can vary, basal ganglia dysfunction is the main process characterizing Parkinsonian disorders. Basal ganglia dysfunction results in a reduction in the range of joint movements and rigidity.2,22,23 The pattern we identified, that is reduced joint movements with increased joint moment, captures a fundamental pathogenetic aspect of this syndrome.
Radiculopathy group damaged with peripheral nervous system but musculoskeletal pain group mainly suffer joint pain of lower limb. Radiculopathy group results in reduced peripheral sensibility and/or motor impairments.24,25 The faster gait speed with longer stride length was shown in radiculopathy group than CNS lesion groups, but there is no significant difference in all variables compared with musculoskeletal pain group.
4.2. Subgroup comparison within disease group
The subgroups have features both common across disease groups and specific to a disease group. The subgroup with fast gait speed and inadequate maximal hip extension in this study represents a newly identified compensatory gait pattern. Hip extension moves the trunk segment forward over the stance foot, which contributes to the step length of the contralateral limb,13,26 and its reduction could directly lead to a slow gait speed.2,19,27 However, the F/AD and F/IN subgroups commonly had fast gait speeds and the main difference between them was in the maximal hip extension angle in terminal stance phase. The F/AD subgroups had normal kinematic and kinetic curves, which indicate good lower extremity function. The F/IN subgroup had decreased hip extension in the terminal stance, primarily due to the tightness of the hip flexor muscles, which indicates an increase in the hip flexion moment during the hip extension in the loading response. The decrease in hip extension compensated for the excessive flexion of the hip and knee joints in the swing phase and resulted in a relatively fast speed. The F/IN subgroup was common across several disease groups examined in this study. However, this subgroup has not been previously reported, likely due to the small proportion of this subgroup per disease (8.5–16.5%). Underlying conditions may be needed for this compensatory pattern to be implemented. One of these conditions may be a preserved ankle function in the gait cycle, which implies that kinematics and kinetics of the ankle joint are comparable to those of the F/AD subgroup. It is worth emphasizing that this was a common compensatory gait pattern in all the disease groups except for Parkinsonian disorders. In summary, an insufficient peak hip extension could be overcome by compensatory hip/knee movements in the swing phase, and an increase in the peak hip extension is not the only way to increase the gait speed.
The SL subgroup was another common subgroup among disease groups and was characterized by a decreased ankle push-off in the pre-swing phase. A decrease in the ankle plantar flexion power results in a shorter stride length and a slower speed because the ankle plantar flexor power at the push-off affects forward propulsion.[28] The ankle plantar flexor power is also the primary kinetic factor responsible for the short step length in older subjects.[29] Our participants were relatively old; thus, a starting point for the treatment of the SL subgroups might be to target the ankle plantar flexion.
Specific disease characteristics need to be considered to attain a proper understanding of the Parkinsonian and radiculopathy subgroups. All subgroups in the Parkinsonian disorders had inadequate maximal hip extension angles, due to the characteristic rigidity.[30] Therefore, an additional gait variable other than maximal hip extension in the stance phase may be needed to label the Parkinsonian gait disorder. Subgroups in Parkinsonian disorders may mirror disease progression. Specifically, the SL subgroup was characterized by a more limited range of motion at the hip than the F subgroup. Since the progression of Parkinsonian disorders is characterized by increased rigidity, the SL subgroup may correspond to a more advanced stage than the F subgroup. In contrast, the small fourth subgroup (IM) identified in the radiculopathy group was characterized by distinctive kinetic points. The main difference between the IM and SL subgroups of the radiculopathy group may be the weakness of the ankle dorsiflexor muscle, corresponding to an increased extension moment and power generation in the stance phase. The decrease in ankle strength was caused by the radiculopathy, which most commonly involved the L5 region,[31] and resulted in the compensatory increase in the hip/knee kinetic variables.
4.3. Identifying subgroups using gait speed and maximal hip extension
Identifying subgroups only based on the gait speed and maximal hip extension was the last and more challenging aim; nevertheless, our equation resulted in a relatively high accuracy. Gait speed is widely considered to be the most reliable indicator of the functional status in neurological conditions. However, it has limited usefulness for distinguishing between subgroups because it is universally decreased and not specifically associated to other gait imbalance features.12,32,33 The maximal hip extension angle in the stance phase reflects specific kinematic characteristics, and the maximal hip extension of the affected limb displays a compensatory decrease with disease severity.2,34 Although further research is required to consolidate our approach, we propose that our algorithmic decision tree could be applicable to patients with gait disorders in routine clinical settings to conduct a rapid evaluation and classification of abnormal gait patterns. The inertial sensor system for gait data collection is of easier access for clinician than the three-dimensional motion analysis system used in this study.[35] It is difficult for the clinician to identify the cause of gait disorder using quantitative gait analysis. However, our classification workflow can be exploited as a guide for therapeutic choices or prognostic purposes and treatment evaluation.
4.4. Limitations
This study presents some limitations. First, this was a retrospective study; there was limited information on disease onset. While most patients receive a routine evaluation within 1 to 2 years after disease onset in our facility, no precise information on this was collected. To minimize this bias, we only used data from the first quantitative gait data collection. Second, as the severity of the disease groups is heterogenous, comparative analysis would have shown limited results. Third, in the Parkinsonian disorders, radiculopathy, musculoskeletal pain, and normal control groups, we identified the “affected” limb according to the stance time. However, older patients (such as those in the present study) may have bilateral limb problems (e.g., osteoarthritis or bilateral radiculopathy), which may have resulted in biased results. Forth, anti-Parkinsonian drugs were not controlled prior to gait analysis. This could affect the results of gait analysis in Parkinsonian patients. Fifth, gait data were collected using two different acquisition systems. We made sure to use the same model for lower extremity kinematics/kinetics, and set the same anatomical landmarks across acquisition systems for the pelvis, thigh, knee, shank, and foot.[36] Furthermore, the reproducibility of the test results between systems was validated on healthy individuals. However, we could not ascertain whether this validation could be directly translated to pathological conditions. Fourth, only male patients were included due to our institutional characteristics (Veterans Hospital). Due to sex-related differences in gait characteristics, the generalizability of our results will require further investigation. Nevertheless, this is the first study drawing upon a large dataset including different primary underlying etiologies.
5. Conclusion
In conclusion, we have found three subgroups that can be commonly applied to several disease conditions. We also considered the method for identifying subgroups that can be applied with high accuracy and more easily than using three-dimensional motion analysis system data. A more diverse application of our classification seems to be needed for conditions that can cause gait disorders, including other disease groups with neurologic abnormalities.
Author contributions
Dae Hyun Kim and Sunghyon Kyeong conceived and designed the study. Sunghyon Kyeong conducted the statistical analyses and revised the manuscript. Dae Hyun Kim prepared the manuscript. Seungmin Kim and Suk Jung acquired and interpreted the data.
Dae Hyun Kim: 0000-0002-5065-4286.
Supplementary Material
Supplementary Material
Supplementary Material
Supplementary Material
Supplementary Material
Supplementary Material
Supplementary Material
Footnotes
Abbreviations: Abs = absorption, AD = adequate, Ankle dFl St = maximal ankle dorsiflexion angle in stance phase, Ankle dFl Sw = maximal ankle dorsiflexion angle in swing phase, Ankle Ex Mo = peak ankle extension moment, Ankle Po = peak ankle power generation, ANOVA = One-way analysis of variance, AS = affected side, Ext = extension, F = fast, Flex = flexion, Gen = generation, Hip Ex Mo = peak hip extension moment, Hip Ex St = maximal hip extension angle in stance phase, Hip Fl Sw = maximal hip flexion angle in swing phase, Hip Po = peak hip power generation, IDS = initial double support time, IM = intermediate, IN = inadequate, Knee Ex Mo = peak knee extension moment, Knee Fl St = maximal knee flexion angle in stance phase, Knee Fl Sw = maximal knee flexion angle in swing phase, Knee Po = peak knee power generation, Moment = peak extension moment, MSK = musculoskeletal pain group, Power = peak power generation, SL = slow, SS = single support time, TDS = terminal double support time, US = unaffected side.
How to cite this article: Kyeong S, Kim SM, Jung S, Kim DH. Gait pattern analysis and clinical subgroup identification: a retrospective observational study. Medicine. 2020;99:15(e19555).
This study was supported by a Veterans Health Service Medical Research Grant, Republic of Korea (VHSMC 16005). The study was supported by grants from the National Research Foundation of Korea, Government of Korea (MSIT) (No. 2017R1C1B1003132).
The authors have no conflicts of interest to disclose.
Supplemental Digital Content is available for this article.
References
- [1]. Bridenbaugh SA, Kressig RW. Quantitative gait disturbances in older adults with cognitive impairments. Curr Pharm Des 2014;20:3165–72. [DOI] [PubMed] [Google Scholar]
- [2]. Snijders AH, van de Warrenburg BP, Giladi N, et al. Neurological gait disorders in elderly people: clinical approach and classification. Lancet Neurol 2007;6:63–74. [DOI] [PubMed] [Google Scholar]
- [3]. Sudarsky L. Neurologic disorders of gait. Curr Neurol Neurosci Rep 2001;1:350–6. [DOI] [PubMed] [Google Scholar]
- [4]. Engel AG, Franzini-Armstrong C. Myology: Basic and Clinical. New York, NY: McGraw-Hill, Medical Pub. Division; 2004. [Google Scholar]
- [5]. Nutt JG, Marsden CD, Thompson PD. Human walking and higher-level gait disorders, particularly in the elderly. Neurology 1993;43:268–79. [DOI] [PubMed] [Google Scholar]
- [6]. Phinyomark A, Osis S, Hettinga BA, et al. Kinematic gait patterns in healthy runners: a hierarchical cluster analysis. J Biomech 2015;48:3897–904. [DOI] [PubMed] [Google Scholar]
- [7]. Selge C, Schoeberl F, Zwergal A, et al. Gait analysis in PSP and NPH: dual-task conditions make the difference. Neurology 2018;90:e1021–8. [DOI] [PubMed] [Google Scholar]
- [8]. Castagna A, Frittoli S, Ferrarin M, et al. Quantitative gait analysis in Parkin disease: possible role of dystonia. Mov Disord 2016;31:1720–8. [DOI] [PubMed] [Google Scholar]
- [9]. Winters TF, Jr, Gage JR, Hicks R. Gait patterns in spastic hemiplegia in children and young adults. J Bone Joint Surg Am 1987;69:437–41. [PubMed] [Google Scholar]
- [10]. Hullin MG, Robb JE, Loudon IR. Gait patterns in children with hemiplegic spastic cerebral palsy. J Pediatr Orthop B 1996;5:247–51. [DOI] [PubMed] [Google Scholar]
- [11]. De Quervain IA, Simon SR, Leurgans S, et al. Gait pattern in the early recovery period after stroke. J Bone Joint Surg Am 1996;78:1506–14. [DOI] [PubMed] [Google Scholar]
- [12]. Moon Y, Sung J, An R, et al. Gait variability in people with neurological disorders: a systematic review and meta-analysis. Hum Mov Sci 2016;47:197–208. [DOI] [PubMed] [Google Scholar]
- [13]. Perry J, Burnfield JM, Cabico LM. Gait Analysis Normal and Pathological Function. Thorofare, NJ: Slack; 2010. [Google Scholar]
- [14]. Benjamini Y, Hochberg Y. Controlling the false discovery rate: a practical and powerful approach to multiple testing. J R Stat Soc Ser B (Methodol) 1995;57:289–300. [Google Scholar]
- [15]. Rubinov M, Sporns O. Complex network measures of brain connectivity: uses and interpretations. NeuroImage 2010;52:1059–69. [DOI] [PubMed] [Google Scholar]
- [16]. Vincent DB, Jean-Loup G, Renaud L, et al. Fast unfolding of communities in large networks. J Stat Mech Theory Exp 2008;2008:10008. [Google Scholar]
- [17]. Kyeong S, Kim E, Park HJ, et al. Functional network organizations of two contrasting temperament groups in dimensions of novelty seeking and harm avoidance. Brain Res 2014;1575:33–44. [DOI] [PubMed] [Google Scholar]
- [18]. Cohen J. Eta-squared and partial eta-squared in fixed factor ANOVA designs. Educ Psychol Meas 1973;33:107–12. [Google Scholar]
- [19]. Olney SJ, Richards C. Hemiparetic gait following stroke. Part I: characteristics. Gait Posture 1996;4:136–48. [Google Scholar]
- [20]. Kim DH, Kyeong S, Do KH, et al. Brain mapping for long-term recovery of gait after supratentorial stroke: a retrospective cross-sectional study. Medicine 2018;97:e0453. [DOI] [PMC free article] [PubMed] [Google Scholar]
- [21]. Alexander LD, Black SE, Patterson KK, et al. Association between gait asymmetry and brain lesion location in stroke patients. Stroke 2009;40:537–44. [DOI] [PubMed] [Google Scholar]
- [22]. Morris ME, McGinley J, Huxham F, et al. Constraints on the kinetic, kinematic and spatiotemporal parameters of gait in Parkinson's disease. Hum Mov Sci 1999;18:461–83. [Google Scholar]
- [23]. Raccagni C, Gaßner H, Eschlboeck S, et al. Sensor-based gait analysis in atypical Parkinsonian disorders. Brain Behav 2018;8:e00977–1977. [DOI] [PMC free article] [PubMed] [Google Scholar]
- [24]. Wuehr M, Schniepp R, Schlick C, et al. Sensory loss and walking speed related factors for gait alterations in patients with peripheral neuropathy. Gait Posture 2014;39:852–8. [DOI] [PubMed] [Google Scholar]
- [25]. Allet L, Armand S, Golay A, et al. Gait characteristics of diabetic patients: a systematic review. Diabetes Metab Res Rev 2008;24:173–91. [DOI] [PubMed] [Google Scholar]
- [26]. Balaban B, Tok F. Gait disturbances in patients with stroke. PM R 2014;6:635–42. [DOI] [PubMed] [Google Scholar]
- [27]. Dettmann MA, Linder MT, Sepic SB. Relationships among walking performance, postural stability, and functional assessments of the hemiplegic patient. Am J Phys Med 1987;66:77–90. [PubMed] [Google Scholar]
- [28]. Watelain E, Barbier F, Allard P, et al. Gait pattern classification of healthy elderly men based on biomechanical data. Arch Phys Med Rehabil 2000;81:579–86. [DOI] [PubMed] [Google Scholar]
- [29]. Judge JO, Davis RB, 3rd, Ounpuu S. Step length reductions in advanced age: the role of ankle and hip kinetics. J Gerontol Ser A Biol Sci Med Sci 1996;51:M303–312. [DOI] [PubMed] [Google Scholar]
- [30]. Ebersbach G, Moreau C, Gandor F, et al. Clinical syndromes: Parkinsonian gait. Mov Disord 2013;28:1552–9. [DOI] [PubMed] [Google Scholar]
- [31]. Braddom's physical medicine & rehabilitation 4th ed. Philadelphia: Elsevier Saunders; 2016. [Google Scholar]
- [32]. Fritz S, Lusardi M. White paper: “walking speed: the sixth vital sign”. J Geriatr Phys Ther 2009;32:46–9. [PubMed] [Google Scholar]
- [33]. Ebersbach G, Sojer M, Valldeoriola F, et al. Comparative analysis of gait in Parkinson's disease, cerebellar ataxia and subcortical arteriosclerotic encephalopathy. Brain J Neurol 1999;122 (Pt 7):1349–55. [DOI] [PubMed] [Google Scholar]
- [34]. Jonkers I, Delp S, Patten C. Capacity to increase walking speed is limited by impaired hip and ankle power generation in lower functioning persons post-stroke. Gait Posture 2009;29:129–37. [DOI] [PMC free article] [PubMed] [Google Scholar]
- [35]. van der Straaten R, De Baets L, Jonkers I, et al. Mobile assessment of the lower limb kinematics in healthy persons and in persons with degenerative knee disorders: a systematic review. Gait Posture 2017;59:229–41. [DOI] [PubMed] [Google Scholar]
- [36]. Schache AG, Baker R, Vaughan CL. Differences in lower limb transverse plane joint moments during gait when expressed in two alternative reference frames. J Biomech 2007;40:9–19. [DOI] [PubMed] [Google Scholar]
Associated Data
This section collects any data citations, data availability statements, or supplementary materials included in this article.


