

Abstract
Introduction:
Little is known about the burden of illness in patients with tenosynovial giant cell tumors (TGCT), which are rare, typically benign, lesions of the synovial tissue including giant cell tumor of the tendon sheath (GCT-TS) and pigmented villonodular synovitis (PVNS). The objective of this study was to describe health care resource utilization and costs for patients with GCT-TS and PVNS.
Methods:
A retrospective cohort study design was used to analyze administrative claims for adult commercial and Medicare Advantage health plan enrollees with diagnosis codes for GCT-TS (ICD-9: 727.02) and PVNS (ICD-9: 719.2x) between 1/1/2006 and 3/31/2015. Patients were continuously enrolled for 12 months before (pre-index) and 12+ months after (post-index) the date of the first TGCT claim (index date). One-year pre/post-index measures were compared using chi-square and Wilcoxon tests to account for skewed cost data. Results were stratified by TGCT type.
Results:
The study identified 4,664 TGCT patients, 284 with GCT-TS and 4,380 with PVNS. Mean age (GCT-TS: 50 years; PVNS: 51 years) and sex distributions (GCT-TS: 60.2% female; PVNS: 59.5% female) were similar for each group. Approximately half of PVNS patients had a lower leg location on the index claim, and 2,133 (48.7%) had at least one post-index surgery versus 239 (84.2% of) GCT-TS patients. Mean total health care costs increased from $8,943 to $14,880 pre/post-index (p<0.001) for GCT-TS and from $13,221 to $17,728 pre/post-index (p<0.001) for PVNS. Pre-index to post-index ambulatory costs increased nearly 120% for GCT-TS patients ($4,340 to $9,570, p<0.001) and 50% for PVNS patients ($6,782 to $10,278, p<0.001), including costs for a significant increase in post-index physical therapy use (GCT-TS: 18% to 40%, p<0.001; PVNS: 38% to 60%, p<0.001).
Conclusions:
Higher post-index health care costs with large increases in ambulatory care including physical therapy use, suggest a high health care burden once TGCT is identified.
INTRODUCTION
Tenosynovial giant cell tumors (TGCTs) comprise a group of rare, usually benign but locally aggressive, soft tissue lesions characterized by inflammation of the synovial lining among joints and tendons. These neoplasms are thought to arise via overexpression of colony stimulating factor-1 receptor (CSF-1R) (Molena et al., 2011). The giant cell tumor of the tendon sheath (GCT-TS) and pigmented villonodular synovitis (PVNS) represent the localized and diffuse types of tumors, respectively. The localized type is most often found in hands and feet, whereas diffuse lesions include diffuse-type giant cell tumor and PVNS, which affect lower limb joints (DiGrazia et al., 2013) and tend to be more aggressive (Murphey et al., 2009).
Although TGCTs are rare, with an annual US incidence of approximately 1.8 cases per million for PVNS and 9.2 cases per million for GCT-TS (Myers and Masi, 1980), and rarely lethal, they can be disabling, and affect a patient’s quality of life via tumor-related limitations and surgical sequelae. The current standard of care for localized tumor is complete surgical resection of the tumor, aimed at reducing symptoms, improving function, and minimizing risk of recurrence (Ravi et al., 2011). However, surgical excision or amputation are commonly required in diffuse tumor cases (Verspoor et al., 2013). When the tumor infiltrates surrounding soft tissues, radiotherapy has been used (O’Sullivan, 1995), because relapse rates are high (Granowitz et al., 1976; Martin et al., 2000). However, no approved drug treatment targeting the CSF-1R is currently available, although treatment with tyrosine kinase inhibitors has been studied (Blay et al., 2008, Cassier et al., 2012).
As a rare type of tumors, TGCTs are likely underreported and underdiagnosed, and there is a paucity of literature describing patterns of care and burden of illness among affected patients. The purpose of this study was to advance the understanding of the patient characteristics, treatment patterns, and health care resource use and costs associated with TGCTs. These data will clarify the context in which varying treatment options may be pursued and developed for these patients, thus better informing researchers, clinicians, and payers.
METHODS
Study Design and Data Source
This was a retrospective cohort analysis using administrative claims from the Optum Research Database (ORD), which contains data regarding health care enrollment, and medical service use and costs covering the period from 1993 to the present. For 2014, data relating to approximately 12.3 million individuals with commercial medical and pharmacy benefit coverage and 2.1 million with Medicare Advantage plus prescription drug coverage (Medicare Part D), representing a geographically diverse and fairly representative sample of the U.S. population. Claims for pharmacy services are typically submitted electronically by the pharmacy at the time prescriptions are filled. Medical claims are collected from all available health care sites for virtually all types of provided services, coded as conforming with insurance industry standards. This study was conducted in accordance with the principles of the Declaration of Helsinki. Institutional Review Board approval was not required, as no identifiable protected health information was extracted or accessed.
Study Sample
The study sample included adult (18+ years) commercial and MAPD health plan enrollees with evidence of TGCT between 01 January 2006 and 30 September 2016 (identification period). Subjects were required to have ≥2 non-diagnostic or 1 non-diagnostic and 1 diagnostic claim, ≥30 days apart, for (1) GCT-TS (International Classification of Diseases, 9th Revision-Clinical Modification [ICD-9-CM] code 727.02) or (2) PVNS (ICD-9-CM code 719.2x). The index date was defined as the date of the first claim for either GCT-TS or PVNS during the identification period. Subjects were also required to be continuously enrolled in the health plan with both medical and pharmacy benefits for 12 months before (pre-index period) and at least 12 months after (post-index period) the index date. Subjects were excluded if they had claims for TGCT or a malignancy (ICD-9-CM: 140.xx-209.36, 209.70-209.79) in the primary position during the pre-index period. Subjects were assigned to either the GCT-TS cohort or PVNS cohort depending on their index TGCT claim. Subjects with both GCT-TS and PVNS codes were excluded from the analysis.
Subjects with a post-index surgical procedure were selected for a subgroup analysis to examine the events, medications, and costs that occurred immediately before and after this index surgical procedure. Subjects selected for the subgroup were required to be continuously enrolled for at least three months (90 days) before and after the index surgical procedure.
Measures
From enrollment data, demographic characteristics of the subjects were obtained, including age as of index date, sex, insurance type, and US geographic region. Based upon ICD-9-CM diagnosis codes, a pre-index Quan-Charlson comorbidity score was calculated (Quan et al., 2011; Bayliss et al., 2012) and the top 5 most prevalent comorbid conditions were identified, as defined by the Clinical Classifications Software managed by the Agency for Health care Research and Quality (AHRQ, 2016). In addition, the following pre-index clinical information was obtained from medical claims: location of the PVNS tumor; the presence of diagnosis codes for gout (ICD-9-CM 274.xx), hypertension, obesity, and type 2 diabetes (ICD-9-CM 250.xx).
Treatment regimens, patterns of care, and health care utilization and costs were measured in both the pre-index and post-index periods. The following treatment/management measures were obtained: the type of index surgery (amputation, arthrodesis, arthroplasty, arthroscopic excision, and excision) and surgeon specialty, and post-index medication, radiotherapy, or anti-neoplastic therapy (tyrosine kinase inhibitors, including imatinib, sunitinib, sorafenib, and nilotinib). In addition, pre- or post-index supplemental care (including occupational therapy, rehabilitation, or physical therapy) and type of diagnostic imaging (radiology, magnetic resonance imaging, computed tomography, or ultrasound) were noted. Concomitant medication use (antibiotic, anti-inflammatory, and opioid) was also identified.
All-cause health care utilization was categorized by type of service including ambulatory visits (physician office visits and outpatient hospital visits), inpatient hospitalizations, emergency department [ED] visits and outpatient pharmacy fills. Health care costs were calculated as the sum of health plan–paid and patient-paid amounts and were adjusted to 2015 US dollars using the annual medical care component of the Consumer Price Index to account for inflation (U.S. Dept Labor, 2016). Costs included ambulatory, inpatient, ED, and surgery-specific expenditures.
Analyses
All study variables, including demographics, clinical characteristics, and outcome measures, were analyzed descriptively. Numbers and percentages were computed for categorical variables. Means, medians, and standard deviations were calculated for continuous variables. One-year pre/post-index costs were compared using chi-square and Wilcoxon tests to account for skewed cost data. Results were stratified by TGCT type.
Statistical analyses were performed using SAS (version 9.4, SAS Institute, Cary, NC, USA).
RESULTS
Sample Description
A total of 4,664 subjects met the study criteria (GCT-TS: 284; PVNS:4,380) (Figure 1).
Figure 1.
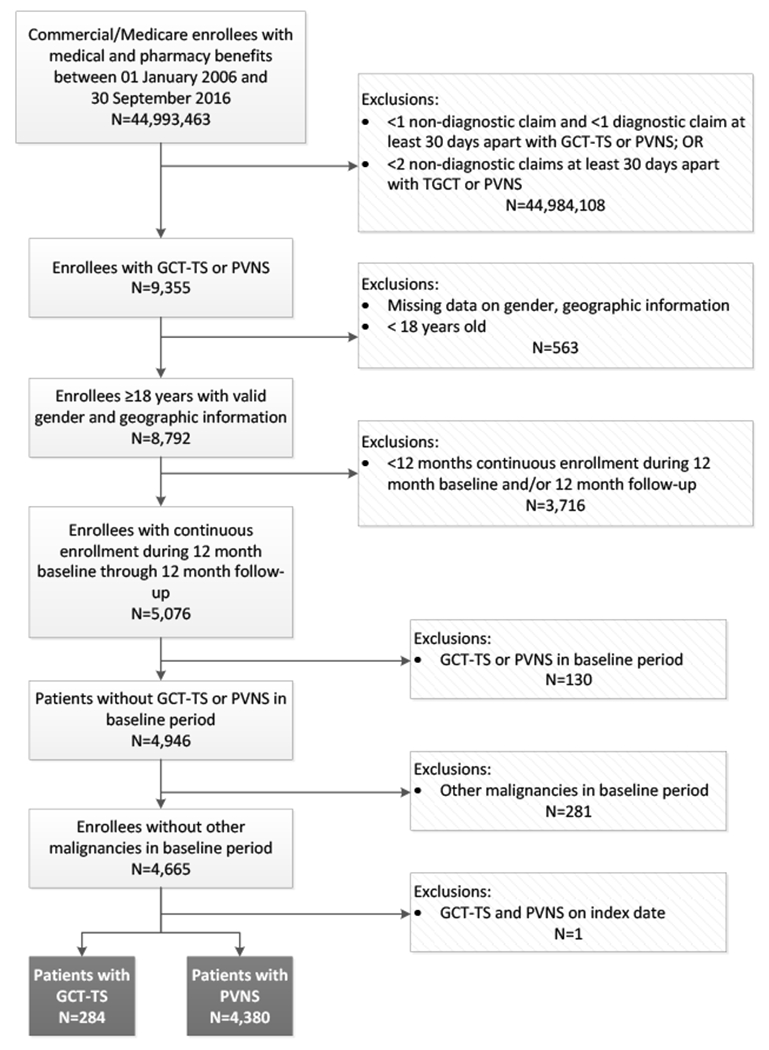
Sample selection and attrition
Note. GCT-TS=giant cell tumor of the tendon sheath; PVNS=pigmented villonodular synovitis.
The mean age (Total: 51 years; GCT-TS: 50 years; PVNS: 51 years) and sex distributions (Total: 60.0% female; GCT-TS: 60.2% female; PVNS: 59.5% female) were similar for each group (Table 1). The majority of subjects was commercially insured.
Table 1.
Demographic and Clinical Characteristics
| Characteristic | Total (N=4,664) |
GCT-TS (N=284) |
PVNS (N=4,380) |
|---|---|---|---|
| Age, mean (SD) years | 51.0 (14.7) | 50.1 (13.8) | 51.0 (14.8) |
| Female sex, n (%) | 2,775 (59.5) | 171 (60.2) | 2,604 (59.2) |
| Insurance Type, n(%) | |||
| Commercial | 4,071 (87.3) | 260 (91.6) | 3,811 (87.0) |
| MAPD | 593 (12.7) | 24 (8.5) | 569 (13.0) |
| Geographic Region, n (%) | |||
| Northeast | 858 (18.4) | 40 (14.0) | 818 (18.7) |
| Midwest | 689 (14.8) | 67 (23.6) | 622 (14.2) |
| South | 2,473 (53.0) | 119 (41.9) | 2,354 (53.7) |
| West | 644 (13.8) | 58 (20.4) | 586 (13.4) |
| Quan-Charlson score, mean (SD) | 0.43 (0.92) | 0.34 (0.71) | 0.44 (0.94) |
| Selected comorbidities, n (%) | |||
| Gout | 204 (4.4) | 1 (0.4) | 203 (4.6) |
| Hypertension | 1,789 (38.4) | 89 (31.3) | 1,700 (38.8) |
| Obesity | 387 (8.3) | 22 (7.8) | 365 (8.3) |
| Type 2 diabetes | 627 (13.4) | 24 (8.5) | 603 (13.8) |
| Top 5 AHRQ comorbidities, n (%) | |||
| Non-traumatic joint disorders | 3,517 (75.4) | 136 (47.9) | 3,381 (77.2) |
| Other connective tissue disease | 2,987 (64.0) | 183 (64.4) | 2,804 (64.0) |
| Disorders of lipid metabolism | 1,946 (41.7) | 102 (35.9) | 1,844 (42.1) |
| Respiratory infections | 1,710 (36.7) | 86 (30.3) | 1,624 (37.1) |
| Spondylosis, intervertebral disc disorders, other back problems | 1,599 (34.3) | 80 (28.2) | 1,519 (34.7) |
Note. AHRQ=Agency for Healthcare Research and Quality; GCT-TS=giant cell tumor of the tendon sheath; MAPD=Medicare Advantage with Part D; PVNS=pigmented villonodular synovitis; SD=standard deviation.
Among PVNS subjects, the most common sites for a PVNS tumor were lower leg (50.7%), ankle/foot (22.7%), shoulder (8.0%), hand (5.1%), pelvis/thigh (4.5%), and forearm (4.1%). The location of GCT-TS tumors was not available in the claims data.
Hypertension was present among approximately a third of subjects (Total 38.4%; GCT-TS 31.3%; PVNS 38.8%), and type 2 diabetes was present among 13.4% of all subjects, 8.5% of GCT-TS subjects, and 13.8% of PVNS subjects (Table 2). The most prevalent AHRQ-classified comorbidities included non-traumatic joint disorders (Total 75.4%; GCT-TS 47.9%; PVNS 77.2%) and other connective tissue disease (Total 64.0%; GCT-TS 64.4%; PVNS 64.0%), followed by disorders of lipid metabolism (Total 41.7%; GCT-TS 35.9%; PVNS 42.1%), and respiratory infections (Total 36.7%; GCT-TS 30.3%; PVNS 37.1%).
Table 2.
Treatment Modalities among GCT-TS and PVNS Subjects
| Total (N=4,664) |
GCT-TS (N=284) |
PVNS (N=4,380) |
|
|---|---|---|---|
| Treatment Modalities, n (%) | |||
| None | 2,265 (48.56) | 44 (15.49) | 2,221 (50.71) |
| Surgery | 2,372 (50.86) | 239 (84.15) | 2,033 (48.70) |
| - Surgery only | 2,324 (49.83) | 227 (79.93) | 2,097 (47.88) |
| - Surgery and radiation | 46 (0.99) | 11 (3.87) | 35 (0.80) |
| - Surgery and anti-neoplastic agents | 2 (0.04) | 1 (0.35) | 1 (0.02) |
| - Surgery, radiation, and anti-neoplastic agents | 0 (0.0) | 0 (0.0) | 0 (0.0) |
| Radiation only | 25 (0.54) | 1 (0.35) | 24 (0.55) |
| Radiation and anti-neoplastic agents | 0 (0.0) | 0 (0.0) | 0 (0.0) |
| Anti-neoplastic agents only | 2 (0.04) | 0 (0.0) | 2 (0.05) |
Note. GCT-TS=giant cell tumor of the tendon sheath; PVNS=pigmented villonodular synovitis.
Treatment Regimens
Approximately half (50.9%) of patients had surgery during the 12-month post-index period. The majority (84.2%) of GCT-TS subjects were treated with surgery, while only 15.5% had no treatment (Table 2). Among PVNS subjects, approximately half (48.7%) had surgery and half (50.7%) had no specified post-index treatment. Very few (Total 0.1%; 3.9% GCT-TS; 0.8% PVNS) had surgery and radiation. Use of anti-neoplastic agents was limited to imitanib, and was very rare, with only 1 in the GCT-TS cohort and 3 in the PVNS cohort with such treatment.
Among patients who had surgery (Total n=2,372; GCT-TS n=239; PVNS n=2,133), the median time to index surgery was 54 days for all subjects, 23 days for the GCT-TS cohort, and 61 days for the PVNS cohort. The most common index surgery for GCT-TS subjects was excision (94.6%), with a small percentage having arthroplasty (2.5%) and arthroscopic excision (2.1%). The most common index surgery for PVNS subjects was arthroscopic excision (69.3%), followed by excision (11.5%) and arthroplasty (11.4%). The majority (73.2% for GCT-TS and 83.0% for PVNS) of providers performing these procedures were orthopedic surgeons.
Among all subjects, post-index medication use was more frequent than pre-index use (Figure 2; p<0.05) except for anti-inflammatory use among GCT-TS patients, and opioid medications were the most commonly filled prescriptions. Plain radiology was the most common type of imaging for both cohorts, with 62% and 70% (p<0.05) of GCT-TS subjects having pre-index and post-index radiology, respectively, and 70% and 68% of PVNS subjects pre-index and post-index radiology, respectively. MRI was performed among 25% and 20% of GCT-TS patients in the pre-index and post-index periods, respectively, yet slightly more (38% pre-index and 34% post-index; p<0.05) PVNS subjects had MRI. Supplemental care was more common in the post-index period, with physical therapy being the most prevalent, at 40% of GCT-TS patients and 60% of PVNS subjects having post-index claims for such services, compared with 18% of GCT-TS and 38% and PVNS subjects, pre-index.
Figure 2.
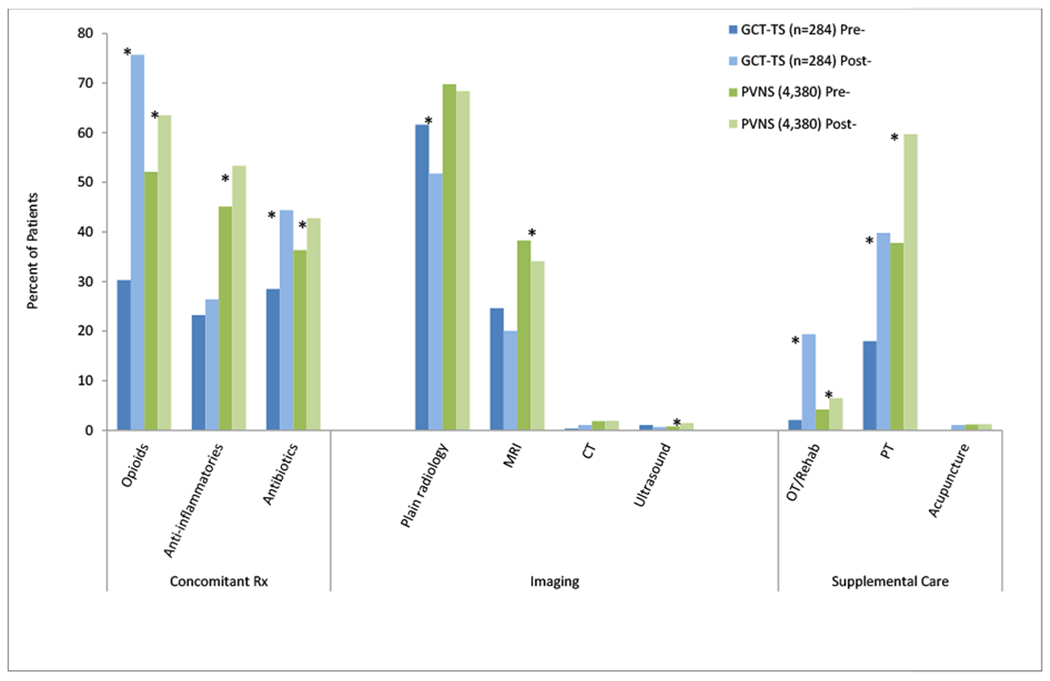
Fixed 12-month Pre-/Post-index Concomitant Medications, Imaging, and Supplemental Care
Note. *p<0.05. CT=computed tomography; GCT-TS=giant cell tumor of the tendon sheath; MRI=magnetic resonance imaging; OT=occupational therapy; PT=physical therapy; PVNS=pigmented villonodular synovitis; Rx=prescription.
Health Care Utilization and Costs
Fewer GCT-TS subjects (5.6% pre-index and 6.7% post-index) than PVNS subjects (11.1% pre-index and 12.6% post-index) had inpatient stays (HCRU data not shown). Fewer GCT-TS subjects (23.2% pre-index; 23.4% post-index) than PVNS subjects (34.8% pre-index; 32.4% post-index) had ER visits.
Among the cost categories presented in Figure 3, the post-index costs were higher than pre-index costs, with the largest component of costs in both periods being attributed to ambulatory care at 51.1% of total all-cause costs pre-index, and 58.3% of post-index care among all subjects (p<0.05). Pharmacy costs represented 18.6% of pre-index costs for all subjects, and 15.5% of post-index costs (p<0.05); inpatient costs were 23.5% of pre-index costs and 19.3% of post-index costs. The ER costs were very low in both time periods. Ambulatory, inpatient, and pharmacy costs were significantly higher post-index among PVNS subjects whereas for GCT-TS patients, only ambulatory care costs were significantly higher (p<0.05).
Figure 3.
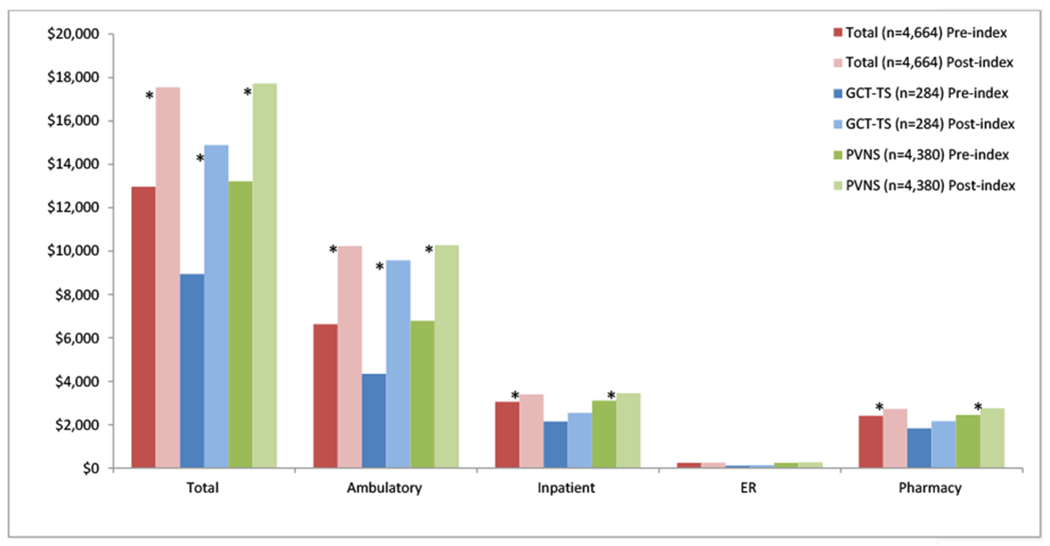
Fixed 12-month Pre-/Post-index All-cause Health Care Costs
Note. *p<0.05. ER=emergency room visits; GCT-TS=giant cell tumor of the tendon sheath; PVNS=pigmented villonodular synovitis.
For all procedures other than arthroscopic excisions, which were the most common procedures, the mean costs for index surgery was higher among PVNS subjects (all types of surgery $10,875) than GCT-TS subjects (all types of surgery $5,539). Among the total all-cause costs in the 12-month post-index period, surgery costs accounted for 58.9% of costs for all subjects; 37.2% of costs among GCT-TS subjects; and 61.3% among PVNS subjects.
DISCUSSION
Because TGCT is a rare disease, studies examining a large sample of affected subjects are extremely rare. Most studies published to date describe unique presentations and treatments among isolated cases. Thus, few published studies describe characteristics, treatment patterns, and outcomes overall, which would inform both clinicians and payers regarding the burden of illness associated with TGCT. Because this retrospective database study examined over 4,000 persons with GCT-TS and PVNS diagnoses over a nearly 10-year period, it creates a detailed picture of the experiences of patients throughout a year surrounding their initial diagnoses.
The mean age of the subjects observed was 51, with 60% being female. These proportions are consistent with previous retrospective studies (DiGrazia et al; 2013: 64 patients; Adams et al., 2012: 65 patients) of GCT-TS, and a study of overall TGCT by Griffin et al. (2012). Although it is notable that the age range for initial diagnoses is very broad across the lifespan, most patients are diagnosed between 30 and 50 years of age. The site of the PVNS tumor was most commonly lower leg, which is also consistent with prior studies (Griffin et al. 2012; Adams et al., 2012; Gelhorn et al., 2016). Although in this study the locations of GCT-TS were not available, the hand is the most common site reported (Adams et al., 2012; Suresh and Zaki, 2010; Bedir et al., 2014). The current study is the first to report on a large sample the comorbid conditions most frequently observed among patients with TGCT. Approximately one third of the study subjects had hypertension, 13% had hypertension, and the most prevalent AHRQ-classified comorbidities included non-traumatic joint disorders (75%) and other connective tissue disease (64%).
The current standard of care for TGCTs is surgical excision, which was also observed most often among treatment options in this study. However, most (84%) GCT-TS subjects had surgery in the post-index period, whereas only half (49%) of PVNS subjects had surgery evidenced within follow-up period: 12 months after the index diagnosis. This is understood based upon the median time from index diagnosis to surgery being much sooner (26 days) for GCT-TS subjects than PVNS subjects (1,388 days or 3.8 years). It is unclear whether the more rapid surgical approach for GCT-TS subjects had to do with the locations of the tumors, symptom complaints, or functional difficulties associated with use of the hands. Sluijmer et al. (2013) reported the most influential factors in determining pursuit of surgery for benign tumors of the upper extremities included location of the tumor and the specific diagnosis, also finding that surgeon influence affects the decision to pursue surgery more than patient factors. Interestingly, in the current study, radiotherapy was rare, despite evidence that radiotherapy may be indicated for preventing recurrence (Garg and Kotwall, 2012; Griffin et al., 2012). Even fewer study subjects received anti-neoplastic therapy, which has been proposed to prevent recurrence (Blay et al., 2008; Brahmi et al., 2016; Cassier et al., 2011). However, such an therapeutic approach is relatively new, and given the observation period for the current study extends from 2005 to 2015, it is possible that would have been an option for few cases.
In addition to the main treatment approach of surgery, in this study, unique data are provided regarding adjunct therapies and supplemental care. Among all study subjects, post-index use of medications was higher than pre-index use. Opioid medications were the most commonly filled prescriptions post-index, among the medications examined. Most (84%) GCT-TS subjects had surgery in the post-index period, whereas only half (49%) of PVNS subjects had post-index surgery, thus the higher rate of opioid prescription fills is not unexpected. Supplemental care was more common in the post-index period, with physical therapy being the most prevalent, at 40% of GCT-TS and 60% of PVNS subjects having post-index claims for such services. The post-index use of occupational therapy was higher among those with GCT-TS, which may have been influenced by the location of the tumor, although this cannot be verified.
Finally, this is the first study to provide data on health care utilization and costs pre- and post-index diagnoses, including costs associated with surgery. Because there are no comparable studies HCRU/costs for GCT-TS and PVNS, studies regarding rheumatoid arthritis (RA) and gout represent the most similar conditions for providing context. In the current study, ambulatory care was the most prevalent resource use, with nearly all study subjects having office and outpatient visits before and after the index diagnosis, yet the count of visits was slightly higher among those with PVNS than those with GCT-TS. Use of ER and inpatient resources was consistent throughout the cohorts and time periods. Overall, costs were higher post-index among all subjects, driven somewhat by ambulatory costs. The costs associated with ambulatory visits increased from $6634 before diagnosis, to $10,235 (a factor of 1.5) after diagnosis and the average annual count of visits increased from 21.1 to 28.4 (a factor of 1.3) after diagnosis. By comparison, in a 2014 study of patients with RA, the costs and frequency of ambulatory visits increased by 2.8 and 1.7, respectively, although that was over an 8-year pre-diagnosis period (Lai et al, 2014). It is possible by the time the patients in the current study were within the pre-diagnosis period, they were already using ambulatory care quite frequently.
However, among the total all-cause costs in the 12-month post-index period, surgery costs accounted for 58.9% of costs for all subjects; 37.2% of costs among GCT-TS subjects; and 61.3% among PVNS subjects. This would be surprising based only on the fact that a greater percentage of GCT-TS patients had surgery during follow-up than PVNS subjects, yet the mean costs for all types of index surgery combined was higher among PVNS subjects ($10,875) than GCT-TS subjects ($5,539). Notably, arthroscopic excisions, which were the most common procedures, were associated with a higher cost among GCT-TS patients ($12,597) than PVNS subjects ($8,220). It would be of interest to determine what factors may influence this difference in cost associated with this procedure.
Limitations
Health care claims data provide extremely valuable information regarding treatment patterns, health care utilization and costs, yet they do have certain limitations which should be considered in the interpretation of results. Primarily, this is due to the fact that claims are collected for the purpose of payment, rather than research. Retrospective data such as ICD diagnosis codes are limited because they are not necessarily proof of disease, and do not always have the level of detail desirable for certain analyses. For example, no ICD-9 codes were available to identify location of GCT-TS tumors. Also, histological, laboratory, and staging data are not available among claims. Also, it is unclear why, but among all of the enrolled patients in the dataset for this study, the prevalence rate was 97.3 cases per million for PVNS and 6.3 cases per million for GCT-TS. However, the most cited annual US incidence is approximately 1.8 cases per million for PVNS and 9.2 cases per million for GCT-TS (Myers and Masi, 1980).
Finally, the generalizability of these results are limited by the sample: a commercial and Medicare Advantage managed care population with at least 24 months of enrollment. These facts make the results primarily applicable to TGCT patients in managed care settings obtaining frequent care. However, the health plans do offer a large sample from which to draw, which represents a wide geographic distribution across the United States. Given the rarity of TGCT, this large sample size provides for an examination of far more patient data than has been previously reported.
Conclusions
This is one of the largest studies of TGCT to date, providing a diverse array of data on more than 4,000 patients. Although the majority of study subjects were treated surgically, very few were treated with radiotherapy or anti-neoplastic agents, despite the risks of recurrence associated with TGCT. Because maintaining function while excising as much tumor as possible can be challenging, it would be helpful to investigate outcomes associated with other therapies in future studies, while considering pre-existing comorbidities, functional limitations, risks of recurrence and malignancy, and the potential need for recurrent surgeries.
Figure 4.
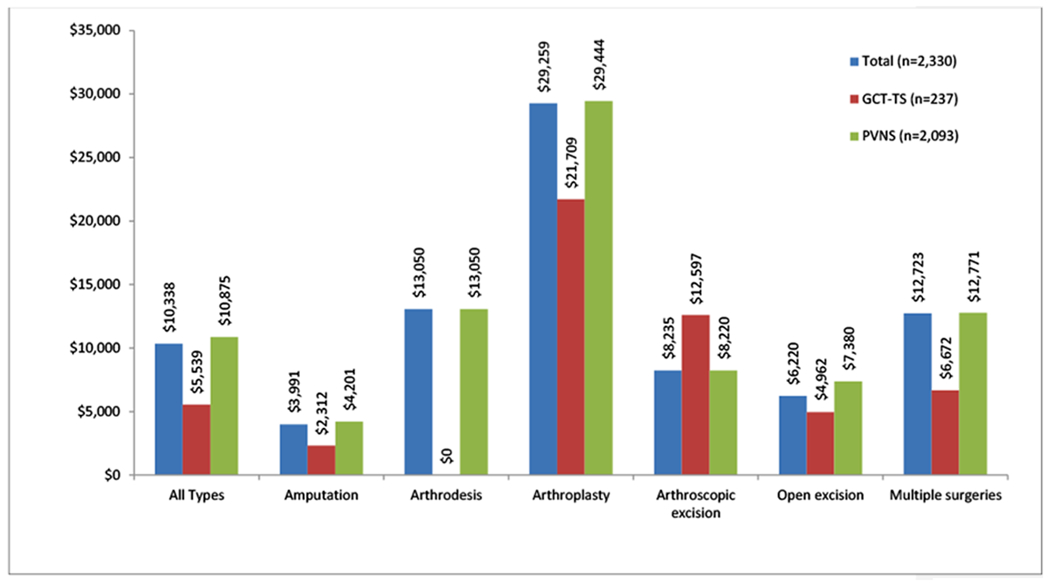
Index Surgical Costs, within 12 Months Post Index Diagnosis
Note. GCT-TS=giant cell tumor of the tendon sheath; PVNS=pigmented villonodular synovitis.
APPENDICES
Table A1.
PVNS ICD-9 Diagnosis Site Codes
| ICD-9 Diagnosis Code | Description | Index Site |
|---|---|---|
| 719.20 | Villonodular synovitis, site unspecified | Unspecified |
| 719.21 | Villonodular synovitis, shoulder region | Shoulder |
| 719.22 | Villonodular synovitis, upper arm | Upper arm |
| 719.23 | Villonodular synovitis, forearm | Forearm |
| 719.24 | Villonodular synovitis, hand | Hand |
| 719.25 | Villonodular synovitis, pelvic region and thigh | Pelvic/Thigh |
| 719.26 | Villonodular synovitis, lower leg | Lower leg |
| 719.27 | Villonodular synovitis, ankle and foot | Ankle/Foot |
| 719.28 | Villonodular synovitis, other specified sites | Other |
| 719.29 | Villonodular synovitis, multiple sites | Multiple |
Contributor Information
Tanya M. Burton, HEOR, Optum Life Sciences.
Xin Ye, HEOR, Daiichi Sankyo, 2 Hilton Ct, Parsippany, NJ 07054-4410.
Emily Parker, HEOR, Optum Life Sciences.
Timothy J. Bancroft, HEOR, Optum Life Sciences.
John Healey, Memorial Sloan Kettering Cancer Center, Chief of Orthopaedic Surgery, Memorial Sloan Kettering Cancer Center, 1275 York Ave, NY, NY 10065.
REFERENCES
- Adams EL, Yoder EM, Kasdan ML. Giant cell tumor of the tendon sheath: experience with 65 cases. Eplasty. 2012;12:423–430 [PMC free article] [PubMed] [Google Scholar]
- Bayliss EA, Ellis JL, Shoup JA, Zeng C, McQuillan DB, Steiner JF. Association of patient-centered outcomes with patient-reported and ICD-9-based morbidity measures. Ann Fam Med 2012;10(2):126–33. [DOI] [PMC free article] [PubMed] [Google Scholar]
- Blay JY, El Sayadi H, THiesse P, Garret J, Ray-Coquard I. Complete response to imatinib in relapsing pigmented villonodular synovitisi/tenosynovial giant cell tumor. Ann Oncol. 2008;19:821–822. [DOI] [PubMed] [Google Scholar]
- Bedir R, Balik MS, Sehitoglu I, et al. Giant cell tumour of the tendon sheath: analysis of 35 cases and their Ki-67 proliferation indexes. J Clin Diagn Res. 2014;8(12):FC12–FC15. [DOI] [PMC free article] [PubMed] [Google Scholar]
- Brahmi M, Vinceneux A, Cassier PA. Current Systemic Treatment Options for Tenosynovial Giant Cell Tumor/Pigmented Villonodular Synovitis: Targeting the CSF1/CSF1R Axis. Curr Treat Options Oncol. 2016. February;17(2):10. doi: 10.1007/s11864-015-0385-x. [DOI] [PubMed] [Google Scholar]
- Cassier PA, Gelderblom H, Stacchiotti S, et al. Efficacy of imatinib mesylate for the treatment of locally advanced and/or metastatic tenosynovial giant cell tumor/pigmented villonodular synovitis. Cancer. 2012;118(6):1649–1655. [DOI] [PubMed] [Google Scholar]
- Clinical Classification Software (CCS) for ICD-9-CM. Agency for Health care Research and Quality, Rockville, MD: http://www.hcup-us.ahrq.gov/toolssoftware/ccs/ccs.jsp [Google Scholar]
- Di Grazia S, Succi G, Fragetta F, Perrotta RE. Giant cell tumor of the tendon sheath: study of 64 cases and review of the literature. G Chir. 2013;34(5-6):149–52. [DOI] [PMC free article] [PubMed] [Google Scholar]
- Garg B and Kotwal PP. Giant cell tumor of the tendon sheath of the hand. J Orthop Surg (Hong Kong). 2011;19(2):218–20. [DOI] [PubMed] [Google Scholar]
- Gelhorn HL, Tong S, McQuarrie K, et al. Patient-reported symptoms of tenosynovial giant cell tumors. Clin Therap. 2016;38(4):778–793. [DOI] [PMC free article] [PubMed] [Google Scholar]
- Granowitz SP, D’Antonio J, Mankin HL. The pathogensis and long-term end results of pigmented villonodular synovitis. Clin Orthop Relat Res. 1976;114:335–351. [PubMed] [Google Scholar]
- Griffin AM, Ferguson PC, Catton CN, et al. , Long-term outcome of the treatment of high-risk tenosynovial giant cell tumor/pigmented villonodular synovitis with radiotherapy and surgery. Cancer 2012;118:4901–9 [DOI] [PubMed] [Google Scholar]
- Lai NS, Tsai TY, Li CY, Koo M, Yu CL, Lu MC. Increased frequency and costs of ambulatory medical care utilization prior to the diagnosis of rheumatoid arthritis: a national population-based study. Arthritis Care Res (Hoboken). 2014;66(3):371–378. [DOI] [PubMed] [Google Scholar]
- Martin RC, Osborne DL, Edwards MJ, et al. Giant cell tumore of tendon sheath, tenosynovial giant cell tumore, and pigmented villonodular synovitis: defining the presentation, surgical therapy and recurrence. Oncol Rep. 2000;7(2):413–9. [PubMed] [Google Scholar]
- Molena B, Sfriso P, Oliviero F, et al. Synovial colony-stimulating factor-1 mRNA expression in diffuse pigmented villonodular synovitis. Clin Exp Rheumatol. 2011;29:547–550. [PubMed] [Google Scholar]
- Murphey MD, Rhee JH, Lewis RB, et al. Pigmented villonodular synovitis of the knee. Clin Orthop Relat Res. 2009;467:2852–2858. [DOI] [PMC free article] [PubMed] [Google Scholar]
- Myers BW, Masi AT. Pigmented villonodular synovitis and tenosynovitis: a clinical epidemiologic study of 166 cases and literature review. Medicine (Baltimore). 1980;59:223–238. [PubMed] [Google Scholar]
- O’Sullivan B, Cumming B, Catton C, et al. Outcome following radiation treatment for high-risk pigmented villonodular synovitis. Int J Radiat Oncol Biol Phys. 1995;32:777–786. [DOI] [PubMed] [Google Scholar]
- Quan H, Li B, Couris CM, Fushimi K, Graham P, Hider P, Januel JM, Sundararajan V. Updating and validating the Charlson comorbidity index and score for risk adjustment in hospital discharge abstracts using data from 6 countries. Am J Epidemiol. 2011;173(6):676–82. [DOI] [PubMed] [Google Scholar]
- Ravi V, Wang WL, Lewis VO. Treatment of tenosynovial giant cell tumor and pigmented villonodular synovitis. Curr Opin Oncol. 2011;23:361–366. [DOI] [PubMed] [Google Scholar]
- Sluijmer HCE, Becker SJE, Ring DC. Benign upper extremity tumors: factors associated with operative treatment. Hand 2013;8:274–281. [DOI] [PMC free article] [PubMed] [Google Scholar]
- Suresh SS and Zaki H. Giant cell tumor of the tendon sheath: case series and review of the literature. J Hand Microsurg. 2010;2(2):67–71. [DOI] [PMC free article] [PubMed] [Google Scholar]
- US Department of Labor, Bureau of Labor Statistics. Consumer Price Index. Medical Care. Series ID: SUUR0000SAM 2012; Available at: http://data.bls.gov/cgi-bin/surveymost?su. Accessed 20 January 2016
- Verspoor FG, van dr Geest IC, Vegt E, et al. Pigmented villonodular synovitis; current concepts about diagnosis and management. Future Oncol. 2013;9:1515–31. [DOI] [PubMed] [Google Scholar]