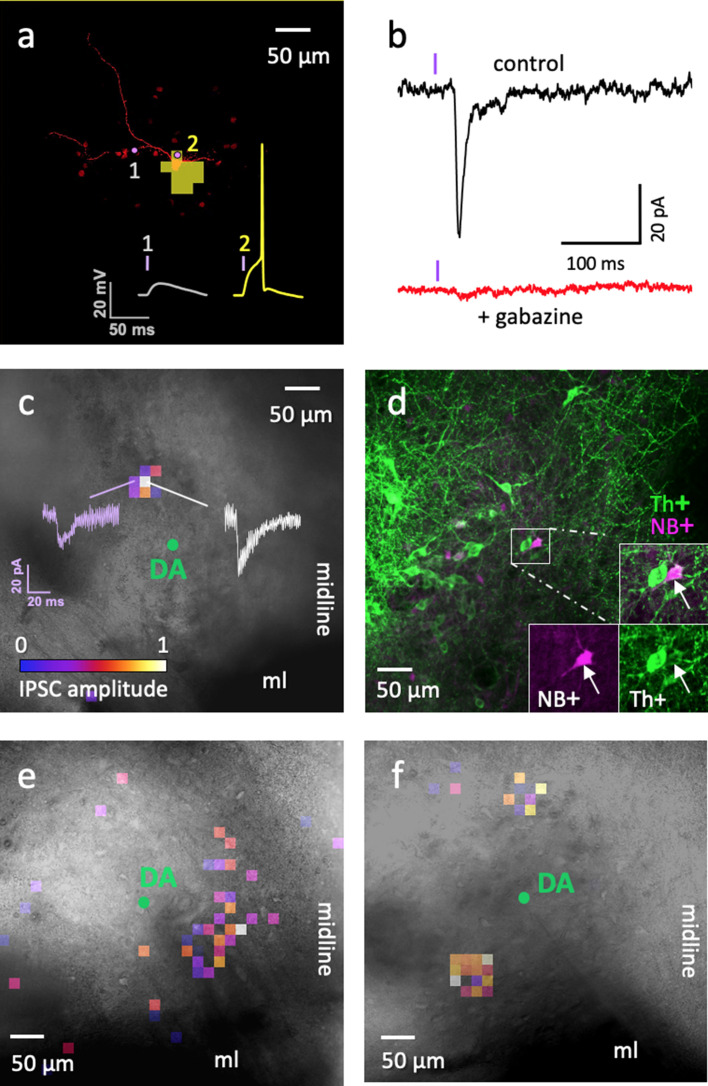
Figure 7. Optogenetic circuit mapping: a single VTA DA neuron can be inhibited by more than one ADP Sst-expressing neuron.
(a) Representative example of the optical footprint of a Sst neuron stimulated with 405 nm laser spots of 9 µW power. The neuron was filled with Alexa 594 dye through patch pipette. Optical footprint, illustrating the square spots where laser stimulation induced action potential in the ADP subtype of Sst cells, is shown in yellow pixels and located around the cell body. Traces 1 and 2 demonstrate evoked responses, while stimulating the corresponding point around the Sst cell. Action potential (2) was induced by stimulation on the soma, while no action potentials were induced by laser spots on the neurites (1). (b) The black trace (‘control’) shows an IPSC evoked in DA cell due to optical stimulation of a neighboring ADP neuron. The red trace shows an absence of evoked IPSCs in the same cell during application of the GABAA receptor antagonist gabazine (10 µM). The violet bars indicate moments of the light (405 nm) flash. (c) Colored pixels represent input maps from a Sst neuron to a neighboring DA cell (shown as a green circle in the center) at 9 μW laser power setting. Amplitudes of the optically evoked IPSCs were color-coded according to the pseudocolor scale, shown at the bottom in relative units from 0 to 1 (used also in panels e and f). Actual amplitudes varied between experiments and are here shown in white (corresponds to maximum IPSC amplitude of 40 pA) and purple (corresponds to IPSC amplitude of 20 pA) traces. (d) Post-staining of the neurobiotin-filled postsynaptic DA neuron shown in c; the cell is labeled with streptavidin 633 (magenta, NB+) and tyrosine hydroxylase antibody (green, Th+). (e–f) Two other examples of input maps at 9 µW demonstrate their variability. All circuit maps in c, e and f overlay images of horizontal VTA slices, where recordings were carried out showing location of the DA cells. Maps in c and e were recorded at bregma −4.44 and that in f at bregma −4.56. ml, medial lemniscus; ‘midline’ indicates the sagittal center line of the horizontal slice. Supporting data can be found in the Additional files: Figure 7—figure supplements 1–2.


