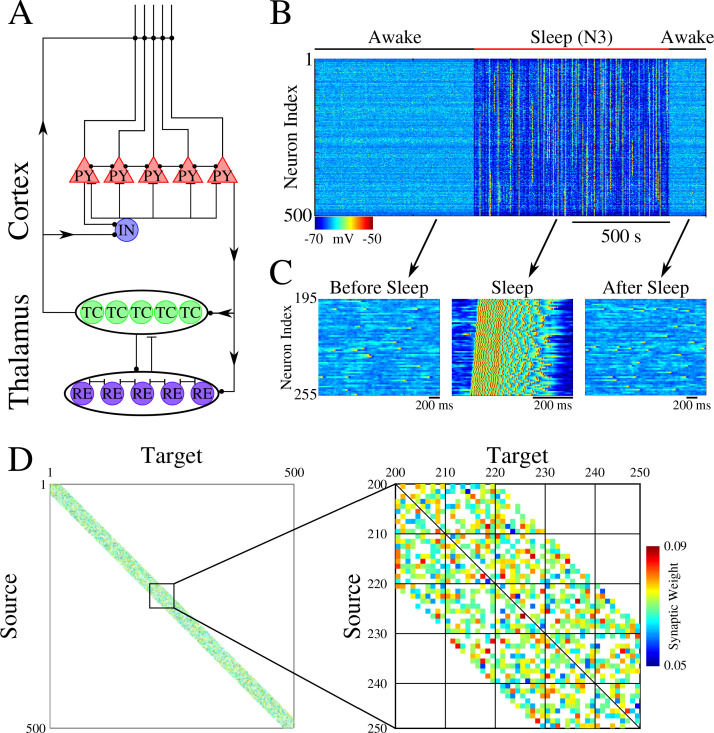
Figure 1. Network architecture and baseline dynamics.
(A) Basic network architecture (PY: excitatory pyramidal neurons; IN: inhibitory interneurons; TC: excitatory thalamocortical neurons; RE: inhibitory thalamic reticular neurons). Excitatory synapses are represented by lines terminating in a dot, while inhibitory synapses are represented by lines terminating in bars. Arrows indicate the direction of the connection. (B) Behavior of a control network exhibiting wake-sleep transitions. Cortical PY neurons are shown. Color represents the voltage of a neuron at a given time during the simulation (dark blue – hyperpolarized potential; light blue / yellow – depolarized potential; red - spike). (C) Zoom-in of a subset of neurons from the network in B (time is indicated by arrows). Left and right panels show spontaneous activity during awake-like state before and after sleep, respectively. Middle panel shows example of activity during sleep. (D) Left panel shows the initial weighted adjacency matrix for the network in B. The color in this plot represents the strength of the AMPA connections between PY neurons, with white indicating the lack of synaptic connection. Right panel shows the initial weighted adjacency matrix for the subregion indicated on the left.

