
Fig. 3.
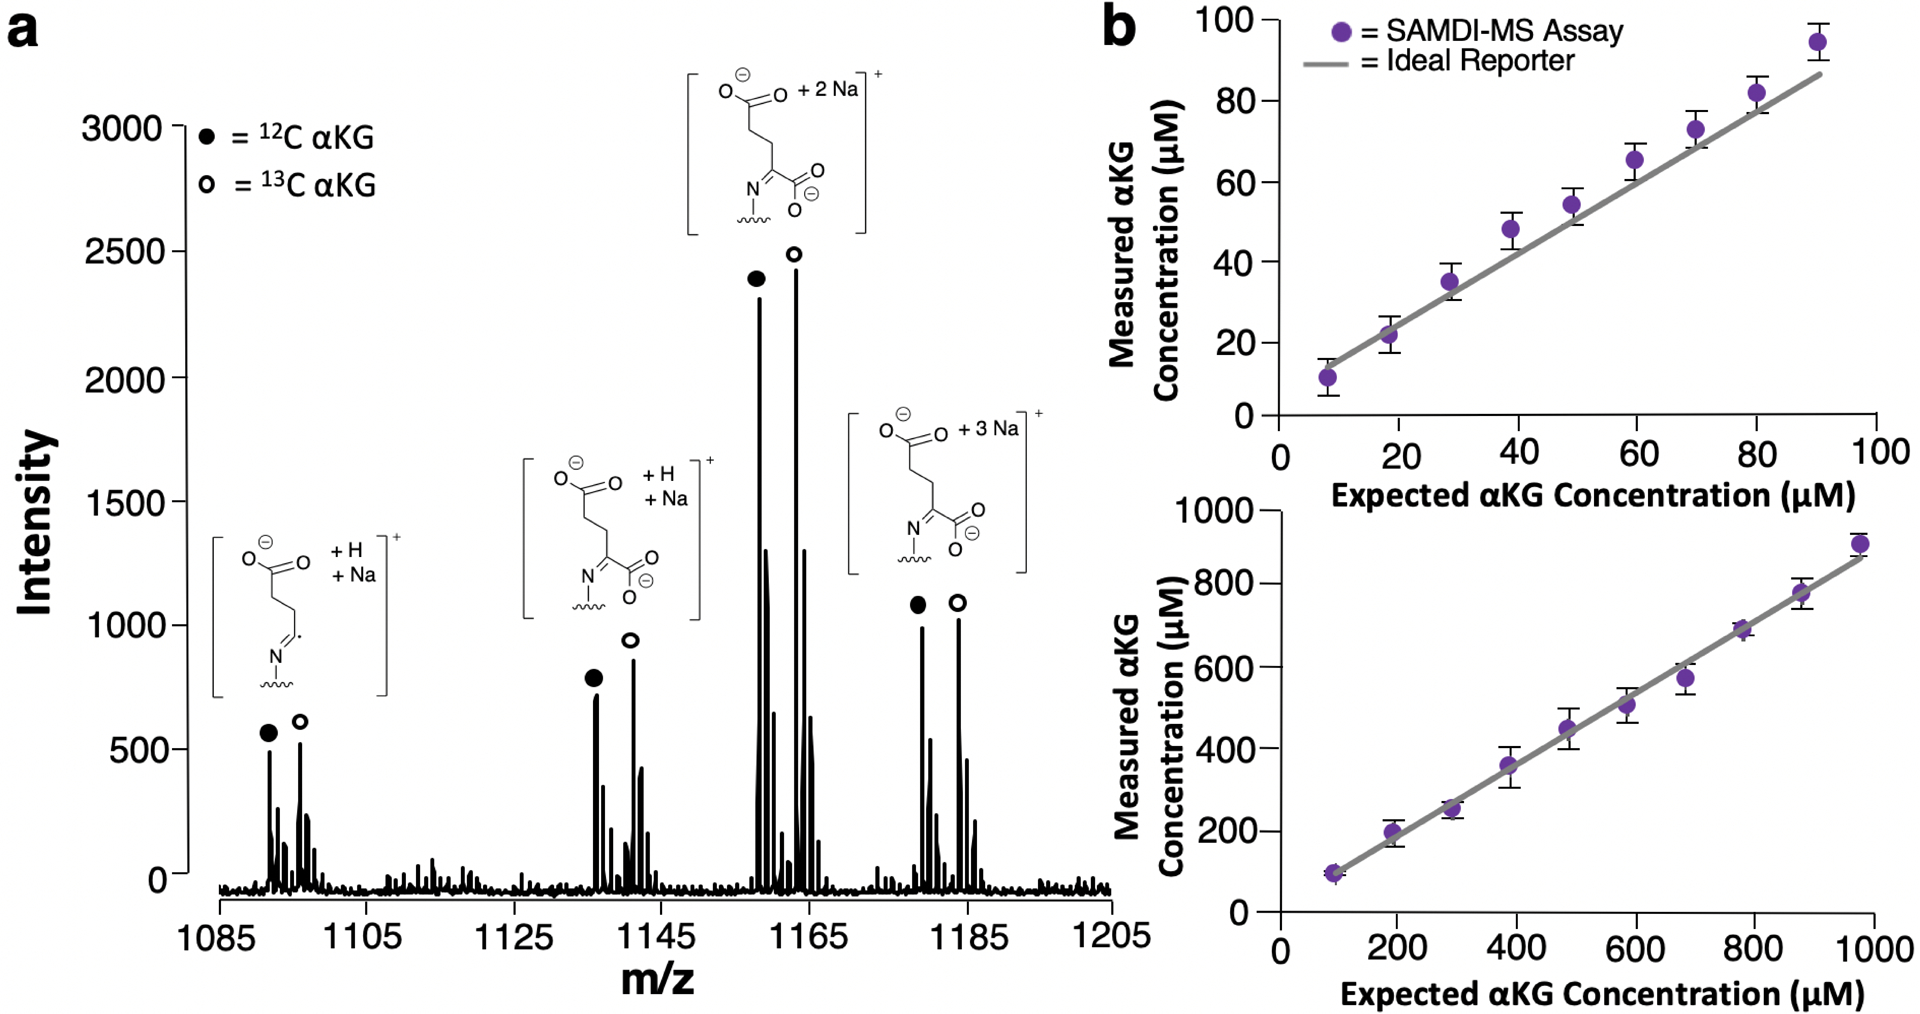
(a) Representative SAMDI-MS spectrum of a 1 mM 12C and 1 mM 13C αKG solution displaying the sodium adduct of the α-cleavage product at m/z = 1091 (12C) and m/z = 1095 (13C), the sodium adduct at m/z = 1135 (12C) and m/z = 1140 (13C), the double sodium adduct at m/z = 1157 (12C) and m/z = 1162 (13C) and the triple sodium adduct at m/z = 1179 (12C) and m/z = 1184 (13C). (b) Sensitivity plots comparing measured αKG concentration to known αKG concentration for solutions ranging from 10 to 90 μM (top) and from 100 μM to 1 mM (bottom). Data are expressed as mean ± standard deviation, with n = 8–10 technical replicates per solution.