Abstract
Diabetes often presents with ocular surface complications including dry eye, keratopathy, and altered sensitivity, along with systemic disorders. A common theme associated with corneal surface defects is decreased cellular proliferation. The opioid growth factor (OGF)–OGF receptor (OGFr) regulatory axis maintains epithelial homeostasis and can be modulated by naltrexone, an opioid receptor antagonist, to block OGF–OGFr interaction and increase cellular replication. Complete blockade using naltrexone accelerates cell proliferation, increases the rate of re-epithelialization in corneal surface abrasions, reverses dry eye, and restores corneal surface sensitivity in animal models of type 1 and type 2 diabetes. Data on the efficacy of naltrexone in these models suggest that the OGF–OGFr axis is dysregulated in diabetes. In the present study, we investigated the OGF–OGFr axis by assessing serum and tissue levels of OGF and OGFr during the development of streptozotocin-induced hyperglycemia and postulated a mechanism of action. We correlated the dysregulation of the OGF–OGFr axis with the onset and magnitude of corneal surface complications (e.g. tear fluid production, corneal surface sensitivity) in type 1 diabetes (T1D). Serum levels of OGF increased in both uncontrolled T1D and insulin-controlled (T1D-INS) male rats within four weeks of streptozotocin injection. Serum OGFr levels were significantly reduced in diabetic rats on weeks 3 and 8 post streptozotocin. Tear production was significantly reduced, and corneal sensitivity measurements were abnormal in both T1D and T1D-INS animals within four weeks of streptozotocin. Corneal re-epithelialization was delayed in T1D rats, but not in T1D-INS animals; however, expression levels of the inhibitory growth factor OGF and its receptor, OGFr, were elevated in the corneal epithelium more than 2-fold in both diabetic groups. These data demonstrate for the first time that dysregulation of the OGF–OGFr axis in the diabetic cornea is associated with the onset and magnitude of ocular surface complications.
Impact statement
This research extends our knowledge about the presence and role of the OGF–OGFr regulatory axis in type 1 diabetes (T1D) and demonstrates specific targets within the pathway that are dysregulated. Serum levels of OGF, an inhibitory growth factor, are significantly elevated in male T1D rats, and OGFr serum values are increased in T1D. The onset of elevated OGF corresponds to the onset of ocular surface complications including dry eye, delayed corneal epithelial repair, and abnormal corneal surface sensitivity in T1D. Systemic insulin does not protect against elevated OGF levels or the onset of dry eye and sensitivity. These data are the first to associate some ocular surface defects in T1D with alterations in the OGF–OGFr pathway.
Keywords: Hyperglycemia, dry eye, delayed corneal epithelialization, corneal surface sensitivity, serum OGF, serum OGFr
Introduction
Over 9% of the United States population is diagnosed with diabetes, and the associated healthcare costs approach $245 billion annually.1–3 Worldwide, the number of individuals with diabetes is expected to reach 550 million by 2030.1,2 Diabetes is a multifactorial disease that has genetic and environmental components to its pathophysiology,1–3 with an increased risk for African Americans.3 Individuals with diabetes present with various degrees of organ system involvement and most will experience one or more major complications that include peripheral neuropathy, blindness, chronic non-healing wounds, nephropathy, and cardiovascular disease.1–3 Importantly, nearly 50% of individuals with type 1 diabetes (T1D) experience at least one complication related to the eye including keratopathy, dry eye, aberrant sensitivity, or retinopathy.4,5 In particular, delayed corneal epithelial repair and dry eye disease (DED) are two common diabetic complications that often occur repeatedly throughout the course of disease. DED is an inflammatory disorder of unknown origin that is characterized by low tear film volume, increased frequency of corneal ulcerations, and a potential loss of vision.4,5 Although proper patient self-management reduces the risk of long-term diabetic ocular complications, they cannot be fully prevented,4,5 and thus understanding the time course and development of diabetic complications and dysregulation of possible associated regulatory pathways is imperative to designing therapy.
Previous research in our laboratory identified and characterized the presence and function of the opioid growth factor (OGF)–OGF receptor (OGFr) pathway in maintaining cellular homeostasis in normal and abnormal tissues and cells.6–10 Using several models of type 1 and type 2 diabetes, we have documented that blockade of the OGF–OGFr pathway by the potent opioid receptor antagonist naltrexone (NTX) reverses many of the epithelial-associated complications of T1D including delayed corneal wound healing, dry eye, decreased corneal sensitivity, and the repair rate of full-thickness cutaneous wounds.11–17 Application of NTX topically or systemically was effective at reversing many of the ocular surface complications observed in the animal models. These data were supportive of human research; however, it was not known exactly when and to what extent the OGF–OGFr regulatory pathway became dysregulated in diabetes.
Studies have documented that diabetic animals17 and humans18,19 have abnormal blood or tissue levels of OGF, chemically termed [Met5]-enkephalin, an inhibitory growth factor that suppresses cell replication. However, a systematic examination of the temporal onset and magnitude of change in the OGF–OGFr pathway and associated ocular surface complications in T1D has not been conducted. In this study, we utilized male rats rendered hyperglycemic with streptozotocin (STZ) and considered to be a model of T1D in order to determine the relationships between OGF and OGFr tissue levels in the cornea, and the onset and severity of corneal surface complications related to T1D over an eight-week period. A subset of hyperglycemic animals was implanted with insulin implants that maintained systemic insulin levels and controlled type 1 diabetes (T1D-INS). With the knowledge that NTX blockade of the OGF–OGFr axis reverses dry eye, restores corneal sensitivity, and accelerates re-epithelialization,15,16,20,21 the studies were conducted to investigate the time course and magnitude of dysregulation of the OGF–OGFr pathway in diabetes, and to correlate the onset of corneal abnormalities in T1D rats. These experiments are the first to establish a relationship between changes in expression levels of OGF and OGFr in serum and corneal epithelium and corneal surface abnormalities throughout the development of T1D.
Materials and methods
Type 1 diabetes rat model
T1D was induced in six-week old male Sprague-Dawley rats (Charles River) by injection of 50 mg/kg STZ (Sigma-Aldrich) dissolved in buffer at pH 4.5 for two consecutive days.13,17 Rats were fasted for 18 h prior to each injection; this method produced hyperglycemia (blood glucose levels > 250 mg/dL) within 72 h and resulted in minimal lethality. A cohort of hyperglycemic rats was implanted with insulin implants (LinShin, Canada) within 24 h of detecting hyperglycemia, and identified as the T1D-INS group. LinShin insulin implants designed for 60 days of insulin release (7 mm in length) were subcutaneously implanted using the manufacturer’s instructions. Insulin was released within 1 h of minipump implantation at a rate of 2 U/h. Hyperglycemic animals not treated with insulin were identified as the T1D group. Finally, rats not rendered hyperglycemic secondary to STZ receiving intraperitoneal injections of sodium citrate buffer only were removed from the study. All animal protocols adhered to the ARVO Statement for the Use of Animals in Ophthalmic and Vision Research, and were approved by the Penn State College of Medicine Institutional Animal Care and Use Committee.
Measurement of physiological markers of diabetes
At weekly intervals for eight weeks, rats were weighed and glucose levels were monitored from tail blood. At each time point, at least 15 rats (randomized) for each group (T1D, T1D+insulin, and Normal) were evaluated. Some rats in each group were maintained until week 11 post STZ injection, but the experiment was halted when T1D animals required humane euthanasia according to the IACUC regulations.
Assessment of ocular surface complications
Prior to induction of hyperglycemia and at 2, 3, 4, 5, 6, and 8 weeks following STZ injection, 12 to 20 male rats from each treatment group (T1D, T1D-INS, Normal) and representative of different experiment/shipments were examined to determine the extent of ocular surface corneal complications. All measurements were conducted in unanesthetized animals, and followed previous protocols.12,15 Dry eye was determined by the Schirmer 1 test, which consisted of inserting Schirmer paper strips (1 mm × 17 mm long) (Alcon) into the lower lid cul-de-sac for 1 min and measuring the wetting length to the nearest half millimeter using a scale provided by the manufacturer. Corneal surface sensitivity was assessed by measuring the blink rate using the Cochet-Bonnet aesthesiometer (Boca Raton, FL). The aesthesiometer pressure (g/mm2) was determined directly from the protocol supplied by the manufacturer. Increased pressure required to induce blinking when the non-anesthetized cornea was touched with the aesthesiometer filament indicated decreased corneal sensitivity.
Rate of corneal reepithelialization
Corneal epithelial wound closure was measured as the percentage of residual defect following 5 mm diameter abrasions created in the right eye; procedures and protocols followed those published previously.13,17 All surgeries were conducted between 0800 and 0900 h to prevent disparities from diurnal rhythm. Wound closure rates were determined by photographing the residual defect stained with moistened fluorescein strips at 0 (baseline), 16, 24, 32, 40, 48, 56, 72, and 90 h. No eyes were photographed at intervals ≤16 h in order to prevent disruption of the epithelial healing process. The residual area of the epithelial defect was calculated as the percentage of the original epithelial defect.
Tissue levels of OGF and OGFr
All rats were humanely euthanized with an intraperitoneal sodium pentobarbital (Euthansol) injection (>100 mg/kg; >0.2 mL/100 g body weight) at 90 h following wounding and eyes proptosed for immunohistochemistry. To assess abnormalities in OGF or OGFr expression in the cornea, the unwounded eye from three rats in each group was removed, quickly frozen, and stored at −80°C until used. Frozen corneal tissue was sectioned (8–10 µm) and stained with validated antibodies to OGF (1:200) or OGFr (1:150; Bethyl Laboratories, Inc., Montgomery, TX) according to the published procedures.22,23 Control sections of each treatment group were stained with secondary antibody only. Stained sections were photographed using confocal microscopy (Keyence Microscopy). Images were calibrated using optical density step tablet software provided by ImageJ such that densitometric analyses removed the mean gray background values and converted data from pixels to optical density units. At least 10 tissue sections from different animals were stained for immunohistochemical semi-quantitative assessment. Expression levels of peptide or receptor were analyzed by performing densitometric analyses on photographs captured at similar settings and magnification using computer software; brightness was converted to numerical values.
Serum levels of OGF, OGFr, and CD10 enkephalinase
Beginning on week 2 following STZ injections, three to six rats from each group (T1D, T1D-INS, Normal) were humanely euthanized with an intraperitoneal sodium pentobarbital injection (>100 mg/kg; >0.2 mL/100 g body weight). Whole trunk blood was collected on ice, centrifuged to obtain serum, and aliquots were stored at −80°C prior to assay. Enzyme-linked immunosorbent assay (ELISA) kits were purchased from MyBioSource for OGF (MBS756126) or OGFr (#MBS109224). CD10 (Cluster of differentiation 10, also termed neprilysin, is a neutral endopeptidase that degrades enkephalin. CD10 is not selective for methionine enkephalin (i.e. OGF), but was measured by an ELISA kit from MyBioSource (#MBS764927) with rat sensitivity of 0.094 ng/mL to determine if elevated OGF levels were related to changes in enzymatic degradation.
All serum analyses involved multiple assays with duplicate samples from at least three different rats at each time point collected across several independent experiments analyzed in a single ELISA. Each assay also included samples from rats tested in all assays as positive controls.
Data analyses
Rigor and reproducibility of the study were ensured by conducting multiple consecutive experiments with smaller cohorts of rats and using replicate samples from multiple animals in different groups and experiments. All parametric data (e.g. body weights, glucose levels, Schirmer measurements, serum values) were analyzed with GraphPad Prism 8.0 software using two-way (condition, time point) analysis of variance (ANOVA) to determine significant interaction. Subsequent comparisons were made using Newman–Keuls tests; 95% confidence levels were required for further analyses.
Results
Clinical characteristics
Across all four independent experiments, more than 95% of the rats injected with STZ had blood glucose levels of >250 mg/dL within 72 h. All T1D rats used in the studies were hyperglycemic within five days. Three rats did not convert to being hyperglycemic and were removed from the study. For the T1D-INS group, blood glucose levels began to level off within hours of insulin pump implantation. Insulin implants were replaced in a few rats that were studied until week 11. No deaths occurred in the first two weeks post STZ injection; T1D-related deaths were only reported at weeks 10 and 11.
Body weights and blood glucose levels are presented in Figure 1(a) and (b), respectively. Two-factor ANOVA identified a significant interaction (P < 0.0001) between condition (T1D, Normal, T1D-INS) and time (weeks), and subsequent analyses identified significant differences in body weight and glucose levels between T1D and Normal animals, as well as T1D and T1D-INS. Analyses indicated that hyperglycemia was evident within two weeks and that rats receiving systemic insulin (T1D-INS) had normal body weights and glucose levels throughout the course of the study. Normal body weights increased from approximately 180 g to over 470 g in eight weeks, whereas the body weights of T1D rats were approximately 300 g after two months of hyperglycemia. In comparison to blood glucose levels for normal and T1D-INS rats that ranged from 128 to 152 mg/dL or 126 to 200 mg/dL, respectively, glucose levels for T1D rats were ≥ 500 mg/dL.
Figure 1.
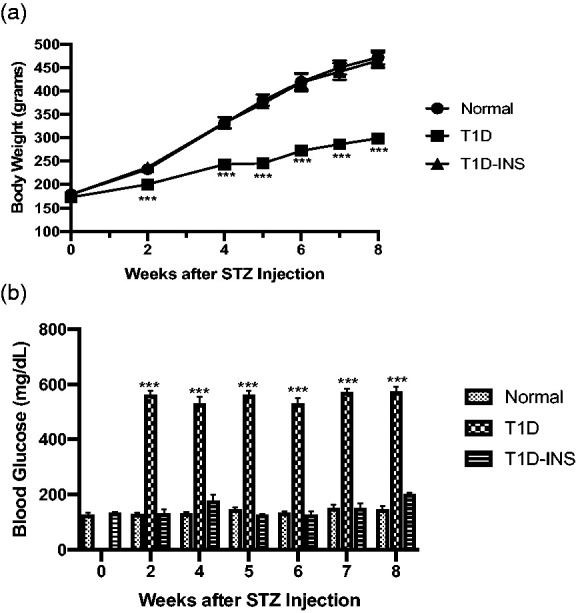
(a) Body weights (grams) and (b) blood glucose levels (mg/dL) for male Sprague-Dawley rats randomly selected from T1D, T1D-INS, or Normal groups (n ≥ 14 per group). Values represent means ± S.E. M. Two-factor ANOVA revealed a significant interaction between condition (T1D, T1D-INS, Normal) and time (weeks) at P < 0.0001. Comparisons of condition at each time point were significantly different from Normals at P < 0.001 (***).
Temporal expression of abnormalities in non-invasive measures on the corneal surface
For both parameters, two factor ANOVA revealed a strong interaction (condition × time) of P < 0.0001, and significant main effects of condition and time (each P < 0.0001). Corneal surface sensitivity (Figure 2(a)) and tear production (Figure 2(b)) were monitored on a weekly basis. T1D rats demonstrated changes in aesthesiometry after four weeks, with both T1D and T1D-INS animals having abnormalities on weeks 5 through 8. For T1D rats, the pressure required to elicit a response rose from 0.4 to 0.5 g/mm2 (week 4) to greater than 0.6 g/mm2 in weeks 5 through 8. In comparison, the pressure required was less than 0.5 g/mm2 during weeks 1–4 in the T1D-INS group, but increased to 0.6–0.8 g/mm2 during weeks 5–8; normal animals required pressure levels of 0.4 g/mm2 or less to elicit a blink response.
Figure 2.
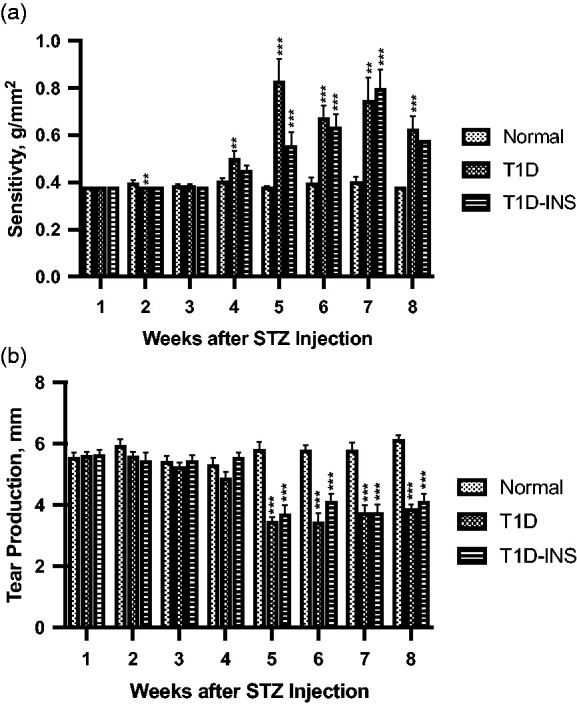
(a) Corneal surface sensitivity measured with a Cochet-Bonnet aesthesiometer. Three readings of pressure (g/mm2) were averaged for each rat at every time point. (b)Tear production (mm) measured by the Schirmer 1 test. Values represent means ± S.E.M. for male rats randomly selected at each time point from T1D, T1D-INS, and Normal conditions (n ≥ 14 per group). Two-factor ANOVA of corneal sensitivity and tear production revealed significant interactions (condition × time) at P < 0.0001. Post hoc one-way ANOVA revealed differences among groups at each time point (P < 0.001) that were significantly different from Normals at P < 0.01 (**), P < 0.001 (***) using Newman–Keuls tests.
Tear production, which was measured as the mm distance of wetting of the Schirmer paper strip, was consistent for all groups for the first four weeks (Figure 2(b)) and ranged between 5 and 6 mm. Two factor ANOVA revealed a strong interaction (condition × time) of P < 0.0001, with time being P < 0.0002. At five weeks post STZ injection, tear production was significantly reduced (P < 0.001) in controlled and uncontrolled diabetic rats, being 40% less than Normals (3.5 vs. 5.8 mm). Tear fluid measurements remained significantly lower than Normals for both T1D and T1D-INS rats, with mean values at weeks 5–8 ranging between 3.4 and 4.1 mm for T1D and T1D-INS rats in comparison to 5.7–6.1 mm for Normals.
Some T1D rats survived to week 11, along with T1D-INS and Normal animals, and body weight, blood glucose, tear production, and corneal surface sensitivity were monitored. Although n values were too low for reliable statistical analyses of the T1D-INS group, male T1D rats continued to have blood glucose levels exceeding 550 mg/dL through week 11, and significantly reduced tear production (2.8 mm) in comparison to Normal values of 5.8 mm. At approximately 80 days post initial hyperglycemia, all rats were humanely euthanized to adhere to the institutional IACUC regulations.
Magnitude of delayed corneal re-epithelialization
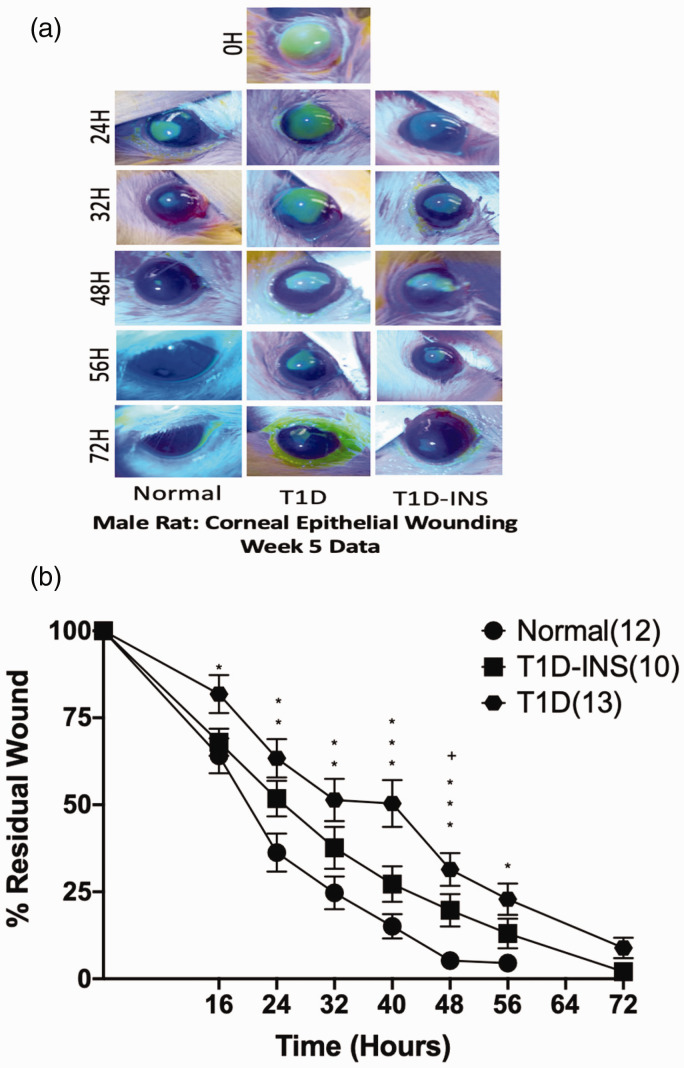
A measure of corneal epithelial dysfunction in T1D rats was the assessment of re-epithelialization following the creation of a 5-mm diameter central corneal epithelial wound (Figure 3(a) and (b)). Although there was no significant interaction of condition and time, by 16 h following wounding, the T1D rats showed evidence of slower wound healing, exhibiting significantly more residual wound area relative to their baseline wound areas and in comparison to the residual wounds in both T1D-INS and Normal rats. Residual wounds were 4.5% at 56 h for Normals in comparison to 13% and 23% for T1D-INS and T1D animals, respectively. By 64 h, wounds in the Normal rats were completely healed, whereas the male T1D rats had residual wounds of approximately 9%. T1D rats had residual wounds greater than 2% of their original area until 86 h. Corneal wounds in T1D-INS rats appeared to heal at approximately the same rate as those in Normal rats, except for measurements at 40 h, which indicated slower healing for the T1D-INS animals, as well as for the T1D rats. When wounds were less than 1% of their original size, they were considered “healed”.
Figure 3.
Photographs (a) and percent residual corneal defects (b) for T1D, T1D-INS, and Normal rats (n= 6–9 animals per group). Eyes were stained with fluorescein strips and photographed prior to wounding (0 h) and at 16, 24, 32, 40, 48, 56, and 72 h after abrasion. Two-factor ANOVA did not reveal a significant interaction with condition, but time was significant with one-factor ANOVA, P < 0.001. Residual areas (means ± S.E.M.) are presented as the percentage of remaining wound relative to the area of the original wound for the same rat. Significantly different from Normal animals at P < 0 05 (*), P < 0.01 (**), P < 0.001 (***); significantly different between T1D and T1D-INS at P < 0.05 (+). (A color version of this figure is available in the online journal.)
Dysregulation of OGF and OGFr expression in the corneal epithelium
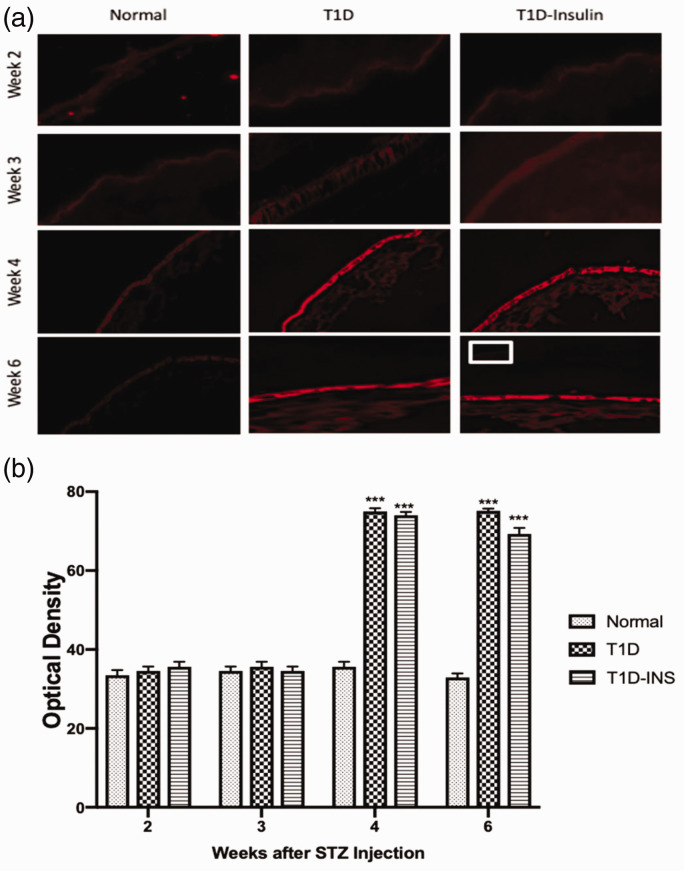
For both parameters, two factor ANOVA revealed a significant interaction between condition and time (P < 0.01), as well as significant main effects (each P < 0.01). OGF expression in corneal epithelial tissue was semi-quantitatively measured at two, three, four, and six weeks (Figure 4(a) and (b). OGF protein expression was comparable for all animals on weeks 2 and 3, and was recorded as approximately 35 optical density units. OGF expression was substantially higher in both diabetic groups on weeks 4 and 6. By week 4, OGF values in the T1D group were semi-quantitatively assessed at 75 optical density units in comparison to 35 units for Normal tissue, and the T1D-INS group had mean measurements of 74 and 69 optical units for weeks 4 and 6, respectively, representing more than twice the OGF expression as Normal rats (Figure 4(b)).
Figure 4.
OGF expression in corneal epithelium. (a) Photomicrographs of intact corneal epithelium at two, three, four, and six weeks following hyperglycemia in T1D, T1D-INS, and Normal rats stained with validated anti-OGF antibodies. Tissue stained with only secondary antibody is shown in the insert at week 6. Images were taken at 10× magnification. (b) Tissue images were scanned with a confocal microscope and semi-quantitatively evaluated for OGF expression using Image J software. Values represent means ± S.E.M. for 15–20 readings collected from at least three tissue specimens. Two-factor ANOVA revealed a significant interaction between condition and time, P < 0.01, with specific differences between conditions noted at four and six weeks. Significantly different from Normal levels at P < 0.001 (***). (A color version of this figure is available in the online journal.)
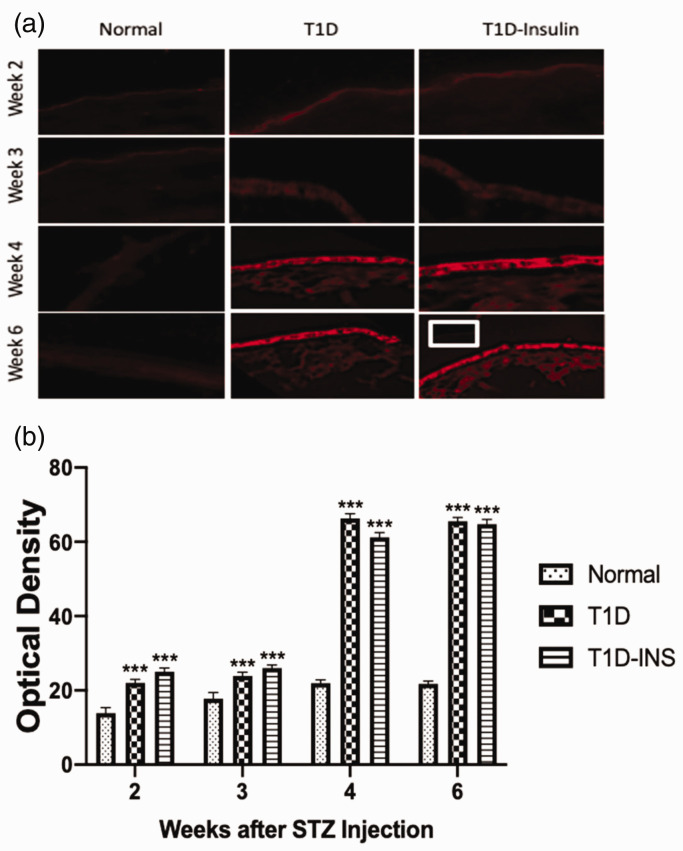
OGF receptor expression in corneal epithelium was also measured in sequential sections from the same animals (Figure 5(a) and (b)). Receptor protein expression levels in Normal rats ranged between 15 and 20 optical density units, whereas both controlled (T1D-INS) and uncontrolled (T1D) diabetic rats had elevated levels of OGFr within two weeks of becoming hyperglycemic. At weeks 2 and 3, optical density levels were 22 to 30 optical density units, but at weeks 4 and 5, OGFr expression increased to greater than 60 optical density units in both the T1D and T1D-INS groups, representing a greater than 3-fold increase over Normals within 2 weeks. Thus, insulin treatment did not reduce corneal epithelial levels of OGF or its receptor in diabetic animals compared to uncontrolled diabetic rats.
Figure 5.
OGFr expression in corneal epithelium. (a) Photomicrographs of intact corneal epithelium at two, three, four, and six weeks following hyperglycemia in T1D, T1D-INS, and Normal male rats. Tissue stained with only secondary antibody is shown in the insert at week 6. Images were taken at 10× magnification. (b) Tissue images were scanned with a confocal microscope and semi-quantitatively evaluated for OGFr expression using Image J software. Two-factor ANOVA revealed a significant interaction between condition and time, P < 0.01, with specific differences between conditions noted at four and six weeks as determined by one-way ANOVA (P < 0.001). Values represent means ± S.E.M. for 15–20 readings collected from at least three tissue specimens. Significantly different from Normal levels at P < 0.001 (***). (A color version of this figure is available in the online journal.)
Serum levels of OGF, OGFr, and CD10
Serum OGF levels for both controlled and uncontrolled hyperglycemic rats were comparable to Normal values on weeks 2 and 3 after injection of STZ (Figure 6(a)). Two-factor ANOVA revealed an interaction between condition and time (P < 0.01), and subsequent ANOVA and Newman–Keuls tests demonstrated that there were substantial changes in serum OGF levels during the eight-week examination period. However, between three and four weeks, OGF levels doubled and were significantly elevated at weeks four, five, six, and eight for T1D rats and at four, five, and six weeks for the T1D-INS rats ranging from 49 to 57 pg/mL relative to normal values. Baseline or normal values ranged between 21 and 26 pg/mL for the entire eight-week experimental period.
Figure 6.
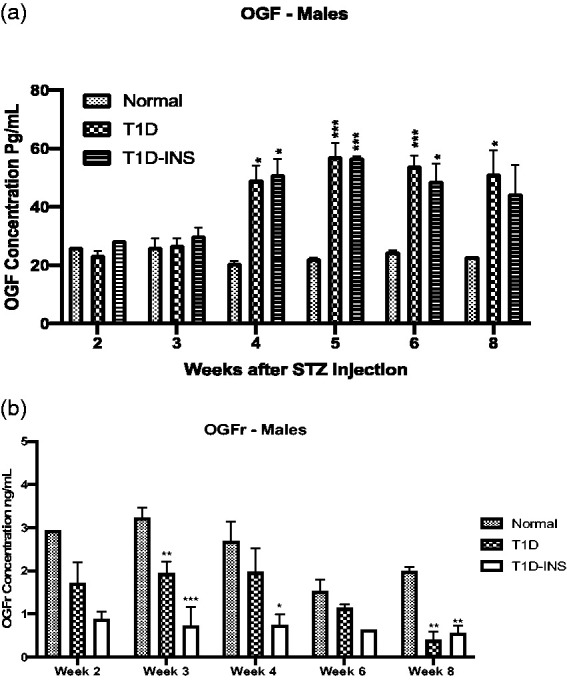
Serum levels of OGF (a) and OGFr (b) collected weekly following hyperglycemia in T1D, T1D-INS, and Normal male rats. Histograms represent means ± S.E.M. for values from multiple ELISA tests. No significant interaction (condition × time) was noted for serum levels of OGFr; however, one-way ANOVA and Newman–Keuls post hoc analyses at three, four, and six weeks revealed significant differences from Normal levels at P < 0.05 (*), P < 0.01 (**), and P < 0.001 (***).
OGFr values were 1000-fold greater than OGF levels for male rats in all conditions reaching ng quantities (Figure 6(b)). The mean OGFr levels for Normal males ranged from1.8 ng/mL to 3.2 ng/mL over the eight-week period. Two-way ANOVA analyses did not indicate a significant interaction between condition and time, but a main effect was noted. At all-time points, serum OGFr values were less than respective Normal values and reached significance on weeks 3 and 8 for the T1D group and weeks 3, 4, and 8 for T1D-INS male rats. Serum OGFr in the T1D-INS groups was less than 1 ng/mL across all eight weeks.
Analyses of CD10 in serum at three, four, and eight weeks post STZ revealed that mean CD10 values did not differ and ranged between 0.1 pg/µL and 1.2 pg/µL (data not shown).
Discussion
These data are the first to establish an association between dysregulation of the OGF–OGFr regulatory pathway and ocular surface abnormalities from diabetes. OGF, an endogenous pentapeptide that is produced in an autocrine and paracrine manner,20 functions as both an inhibitory growth factor and a neurotransmitter. These studies provide evidence for the temporal onset of overexpression of OGF in serum of diabetic rats and show that both controlled and uncontrolled type 1 diabetes results in higher serum levels of this inhibitory peptide. The receptor related to growth regulation is OGFr, and these are the first data to measure serum OGFr levels in animal models of diabetes. At this time no data are available on OGFr levels in diabetic humans. Whether the changes observed for rats are consistent with humans awaits further reseach as studies have shown that plasma OGF levels do fluctuate with different pathologies 19,24,25,26,27
Our data demonstrate a dysregulation in the OGF–OGFr axis with increases in corneal epithelial levels of the inhibitory peptide OGF and its receptor in both controlled and uncontrolled diabetic corneal epithelium. Likewise, non-invasive measures of the ocular surface (e.g. tear fluid and corneal surface sensitivity) were altered beginning at four weeks post STZ injection in both groups corresponding with the increase in serum OGF values. Of interest, it was noted that systemic insulin—at dosages utilized to maintain normal blood glucose—was reported to provide protection against delayed re-epithelialization of corneal abrasions that is normally seen in diabetic rats,12,15 but did not protect against dry eye or abnormal surface sensitivity in these animals. This is in contrast to a study where topical insulin was applied as a therapy for delayed healing24–27 and changes were noted in sensitivity relative to diabetic rats.
The present research supplements our previous findings by demonstrating that the salutary effect of insulin treatment on diabetic ocular surface complications does not extend to reverse decreased corneal sensitivity or decreased tear production. Nevertheless, it must be emphasized that blockade of OGFr by NTX reverses both of these diabetic ocular surface complications.12,15 Thus, the present study supports possibly two mechanisms causing diabetic ocular complications. The pathway related to delayed epithelial healing is characterized by upstream regulation of the OGF–OGFr axis and downstream regulation by insulin because insulin treatment did provide some protection against delayed cell replication related to delayed epithelialization. The second pathway controls neural-related mechanisms including ocular surface sensitivity and tear production; these processes do not appear to be mediated by insulin, but are modulated by NTX blockade of the OGF–OGFr axis.
Further study using proteomic and genomic approaches are warranted to delineate different pathways in diabetes that can be modulated by the OGF–OGFr axis. The concept of signaling pathways controlling paradoxical effects in insulin-controlled diabetes is not without precedent. Studies on insulin resistance in type 2 diabetes have suggested that the dysregulated insulin pathway is involved in the development of both diabetes and other associated neurodegenerative disorders.28–31 More experimentation to regulate insulin production and/or provide large systemic dosages of insulin will be required to ascertain whether the OGF–OGFr axis functions to control hyperglycemia and insulin resistance, or whether the insulin pathway has a feedback loop regulating the OGF–OGFr axis. Understanding the timing of dysregulation will enable interventions to be designed to either prevent or ameliorate complications such as dry eye, decreased corneal surface sensitivity, and delayed epithelialization. These data support studies in humans to establish the safety and effectiveness of NTX treatment of ocular surface complications in diabetics. Finally, understanding the role of the OGF–OGFr axis in diabetes may increase our knowledge about the pathobiology of T1D.
Authors’ contributions
All authors participated in the design, interpretation of data, manuscript preparation and final review, IP conducted the experiments.
DECLARATION OF CONFLICTING INTERESTS
PJM, ISZ, and JSW have intellectual property related to this topic that is owned by Penn State Research Foundation and licensed to Ocunova, Inc. PJM, ISZ, and JSW have partial ownership in Ocunova Inc. but received no financial compensation. These relationships have been reviewed by the University’s Institutional and Individual Conflict of Interest Committees and are currently being managed by the University.
FUNDING
This work was supported by the National Eye Institute of the National Institutes of Health [5R01 EY029223-02].
ORCID iD
Patricia J McLaughlin https://orcid.org/0000-0002-4630-8225
References
- 1.National Center for Chronic Disease Prevention and Health Promotion (CDC). National Diabetes Statistics Report, 2017. Estimates of Diabetes and its burden in the United States, www.cdc.gov/diabetes/pdfs/data/statistics/national-diabetes-statistics-report.pdf (accessed 22 May 2020)
- 2.American Diabetes Association. Complicationswww.diabetes.org/living-with-diabetes/complications/foot-complications/ (accessed 22 May 2020)
- 3.American Diabetes Association. Statistics about diabetes, www.diabetes.org (accessed 22 May 2020)
- 4.Lutty GA. Effects of diabetes on the eye. Invest Ophthalmol Vis Sci 2013; 54:81–7 [DOI] [PMC free article] [PubMed] [Google Scholar]
- 5.Cousen P, Cackett P, Bennett H, Swa K, Dhillon B. Tear production and corneal sensitivity in diabetes. J Diab Complicat 2007; 21:371–3 [DOI] [PubMed] [Google Scholar]
- 6.Zagon IS, Verderame MF, McLaughlin PJ. The biology of the opioid growth factor receptor (OGFr). Brain Res Brain Res Rev 2002; 38:351–76 [DOI] [PubMed] [Google Scholar]
- 7.McLaughlin PJ, Zagon IS. Duration of opioid receptor blockade determines biotherapeutic response. Biochem Pharmacol 2015; 97:236–46 [DOI] [PubMed] [Google Scholar]
- 8.Zagon IS, Sassani JW, Kane ER, McLaughlin PJ. Homeostasis of ocular surface epithelium in the rat is regulated by opioid growth factor. Brain Res 1997; 759:92–102 [DOI] [PubMed] [Google Scholar]
- 9.Zagon IS, Sassani JW, McLaughlin PJ. Reepithelialization of the human cornea is regulated by endogenous opioids. Invest Ophthalmol Vis Sci 2000; 41:73–81 [PubMed] [Google Scholar]
- 10.Zagon IS, Sassani JW, Malefyt KJ, McLaughlin PJ. Regulation of corneal repair by particle-mediated gene transfer of opioid growth factor receptor complementary DNA. Arch Ophthalmol 2006; 124:1620–4 [DOI] [PubMed] [Google Scholar]
- 11.Zagon IS, Jenkins JB, Lang CM, Sassani JW, Wylie JD, Ruth TB, Fry JL, McLaughlin PJ. Naltrexone, an opioid antagonist, facilitates re-epithelialization of the cornea in diabetic rat. Diabetes 2002; 51:3055–62 [DOI] [PubMed] [Google Scholar]
- 12.Zagon IS, Klocek MS, Sassani JW, Mauger DT, McLaughlin PJ. Corneal safety of topically applied naltrexone. J Ocul Pharmacol Ther 2006; 22:377–87 [DOI] [PubMed] [Google Scholar]
- 13.Klocek MS, Sassani JW, McLaughlin PJ, Zagon IS. Topically applied naltrexone restores corneal reepithelialization in diabetic rats. J Ocular Pharmacol Ther 2007; 3:89–102 [DOI] [PubMed] [Google Scholar]
- 14.Zagon IS, Sassani JW, Carroll MA, McLaughlin PJ. Topical application of naltrexone facilitates reepithelialization of the cornea in diabetic rabbits. Brain Res Bull 2010; 81:248–55 [DOI] [PMC free article] [PubMed] [Google Scholar]
- 15.Zagon IS, Klocek MS, Sassani JW, McLaughlin PJ. Dry eye reversal and corneal sensation restoration with topical naltrexone in diabetes mellitus. Arch Ophthalmol 2009; 127:1468–73 [DOI] [PMC free article] [PubMed] [Google Scholar]
- 16.Zagon IS, Sassani JW, Immonen JA, McLaughlin PJ. Ocular surface abnormalities related to type 2 diabetes are reversed by the opioid antagonist naltrexone. Clin Exp Ophthalmol 2014; 42:159–68 [DOI] [PubMed] [Google Scholar]
- 17.McLaughlin PJ, Sassani JW, Titunick MB, Zagon IS. Efficacy and safety of a novel naltrexone treatment for dry eye in type 1 diabetes. BMC Ophthalmol 2019; 19:35. [DOI] [PMC free article] [PubMed] [Google Scholar]
- 18.Negri M, Tonnarini G, Di Blasé N, D’Allessandro M, Fallucca F. Plasma met-enkephalin in type 1 diabetes. Metab Clin Exp 1992; 41:460–1 [DOI] [PubMed] [Google Scholar]
- 19.Negri M, Fallucca F, Tonnarini G, Mariani P, D’Allessandro M, Pachl A. High levels of circulating met-enkephalin in pregnant and menstruating type 1 diabetic women. Gynecol Endocrinol 1990; 4:25–31 [DOI] [PubMed] [Google Scholar]
- 20.Sassani JW, McLaughlin PJ, Zagon IS. The yin and yang of the opioid growth regulatory system: focus on diabetes: the Lorenz E. Zimmerman tribute lecture. J Diab Res 2016; 2016:9703729. [DOI] [PMC free article] [PubMed] [Google Scholar]
- 21.McLaughlin PJ, Sassani JW, Zagon IS. Opioid growth factor receptor blockade by naltrexone as a treatment for diabetic complications. Adv Med Biol 2019; 138:109–45 [Google Scholar]
- 22.Zagon IS, Sassani JW, Allison G, McLaughlin PJ. Conserved expression of the opioid growth factor, [Met5]-enkephalin, and the zeta (ζ) opioid receptor in vertebrate cornea. Brain Res 1995; 671:105–11 [DOI] [PubMed] [Google Scholar]
- 23.Robertson SA, Andrew SE. Presence of opioid growth factor and its receptor in the normal dog, cat, and horse cornea. Vet Ophthalmol 2003; 6:131–4 [DOI] [PubMed] [Google Scholar]
- 24.Danno K, Nishiura K, Tanaka M. Increased met-enkephalin plasma levels in hemodialysis patients with or without pruritus. J Dermatol Sci 1995; 10:238–40 [DOI] [PubMed] [Google Scholar]
- 25.Parlapiano C, Borgia MC, Tonnarini G, Giancaspro G, Pizzuto F, Campana E, Giovanniello T, Pantone P, Vincentelli GM, Alegiani F, Negri M. Met-enkephalin levels during PTCA-induced myocardial ischemia. Peptides 2001; 22:1181–2 [DOI] [PubMed] [Google Scholar]
- 26.Mosnaim AD, Maturana P, Puente J, Wolf ME. Decreased plasma methionine-enkephalin levels in cluster headache patients. Am J Ther 2012; 19:174–9 [DOI] [PubMed] [Google Scholar]
- 27.Zagon IS, Sassani JW, McLaughlin PJ. Insulin treatment ameliorates impaired corneal re-epithelialization in diabetic rats. Diabetes 2006; 55:1141–7 [DOI] [PubMed] [Google Scholar]
- 28.Klocek MS, Sassani JW, McLaughlin PJ, Zagon IS. Naltrexone and insulin are independently effective but not additive in accelerating corneal epithelial healing in type 1 diabetic rats. Exp Eye Res 2009; 89:686–92 [DOI] [PMC free article] [PubMed] [Google Scholar]
- 29.Steculorum SM, Solas M, Brüning JC. The paradox of neuronal insulin action and resistance in the development of aging-associated diseases. Alzheimers Dement 2014; 10:S3–14 [DOI] [PubMed] [Google Scholar]
- 30.Tumminia A, Vinciguerra F, Parisi M, Frittitta L. Type 2 diabetes mellitus and alzheimer’s disease: role of insulin signaling and therapeutic implications. Int J Mol Sci 2018; 19:3306. [DOI] [PMC free article] [PubMed] [Google Scholar]
- 31.Vaditsky M, Hoffman A, Unterman Y, Bar-Tana J. Insulin sensitizer prevents and ameliorates experimental type 1 diabetes. Am J Physiol Endocrinol Metab 2017; 313:E672–80 [DOI] [PubMed] [Google Scholar]


