Abstract
The precise mechanism about drug resistance of cancer stem cells (CSCs) has not yet been completely understood. Based on the expression of CD44 and CD133, two well-recognized cell surface markers for CSC identification, we tried to separate HCT8 colorectal cancer cells into different subpopulations and then investigated how the expression of CD44 and CD133 associated with doxorubicin (DXR) resistance. Interestingly, DXR resistance was observed in CD44+CD133+ (P < 0.01vs. all other subpopulations), but not in CD44+CD133− cells. CD44+CD133+ cells also showed an enhanced expression of ABCB1 and drug efflux ability (P < 0.001vs. all other subpopulations), but verapamil, an inhibitor of ABCB1, only partially mitigated the DXR resistance. Independent on the accumulation of DXR, lower level of reactive oxygen species and higher expression of Nrf2 were detected in CD44+CD133+ than CD44+CD133− cells (P < 0.05). Unexpectedly, silencing CD133 by siRNA only partially enhanced the cytotoxicity of DXR, but did not obviously change the expression of ABCB1 and the accumulation of DXR in CD44+CD133+ cells. Complex mechanisms, including drug excretion and redox regulation, are likely involved in the DXR resistance of CD133-positive cells, suggesting the difficulty of drug resistance problem in cancer chemotherapy.
1. Introduction
The heterogeneity of cancer cells is generally accepted, and a stem cell-like subpopulation that is called “cancer stem cells” (CSCs) has been identified in various types of malignant tumors. Although the lack of consensus on the definition, CSCs are widely recognized as a small subpopulation among cancer cells with the properties of self-renewal and tumor initiation. As CSCs play a critical role in the recurrence and metastasis of cancer [1], targeting the CSCs is thought to be a promising approach for curing cancer.
A large number of past studies have tried to identify and characterize the CSCs. As normal tissue-specific stem cells are considered as the main origin of cancer [2], the CSCs are also thought to be inherited, at least partially, the characterization of normal tissue-specific stem cells. Therefore, many studies on the identification/purification of CSCs have simply shared markers of hematopoietic stem cells, including the most popularly used cell surface markers of CD44 and CD133 [3, 4]. CD44 is a type I transmembrane glycoprotein that is expressed on hematopoietic, fibroblastic, and glial cells and functionally known to mediate cell-cell and cell-matrix interactions. Previous studies have demonstrated that the CD44 is not only a biomarker but also plays critical roles in the maintenance of CSCs, the resistance to various therapies/stresses, and the metastasis of cancer cells [5–11]. CD133 is originally identified as protein expressing on the cell surface of hematopoietic stem cells [12] and has subsequently been found to be critical in the maintenance of “stemness” of stem cells in various tissues [13–18]. CD133 has also been found in some CSC [19–22], which contributes to therapeutic resistance through the activation of Akt, Bcl-2, and MAPK/PI3K signaling pathways [23–26]. Although the expressions of CD44 and CD133 in cancer cells likely associate with the resistances to radiotherapy, chemotherapy, and various stresses, the different significance between CD44 and CD133 has not yet been well understood.
In this study, we investigated whether the expression of CD44 and CD133 in human colorectal cancer cells (HCT8) differently contributed to drug resistance. Our data indicated that the expression of CD133, rather than CD44, closely associated with doxorubicin (DXR) resistance, at least partially through drug excretion and redox regulation.
2. Materials and Methods
2.1. Cell Culture
Human colorectal cancer (HCT8) cells were cultured in RPMI 1640 medium (FUJIFILM Wako Pure Chemical, Japan) supplemented with 10% FBS (GIBCO, Thermo Fisher Scientific, MA, USA) at 37°C, in a humidified atmosphere of 95% air and 5% CO2.
2.2. Separation of CD44- and CD133-Positive Cells from HCT8 Cells
We separated the parent HCT8 cells into CD44-positive (CD44+) and CD133-positive (CD133+) cells by a two-step magnetic cell sorting method as described previously [13, 27]. Briefly, HCT8 cells were collected as a single-cell suspension by trypsinization and then incubated with magnetic microbead-conjugated anti-human CD44 antibody (Miltenyi Biotec, Germany) for 30 min. After washing, cells were separated into CD44− and CD44+ subpopulations by using the autoMACS™ Pro separator (Miltenyi Biotec), according to the manufacturer's instruction. The purified CD44+ cells were further expanded and then harvested as a single-cell suspension to be incubated with magnetic microbead-conjugated anti-human CD133 antibody (Miltenyi Biotec) for 30 min. After washing, the CD44+CD133− and CD44+CD133+ subpopulations were separated as described above. This two-step isolation enabled us to obtain a sufficient number of CD44−, CD44+, CD44+CD133−, and CD44+CD133+ cells for our experiments.
To verify the purity of each subpopulation, isolated cells were stained with PE-labelled mouse anti-human CD133 (clone: AC133) (Miltenyi Biotec) and FITC-labelled mouse anti-human CD44 (clone: DB105) (Miltenyi Biotec), according to the supplied protocols. Flow cytometry analysis was performed using a FACSCalibur (Becton Dickinson), as described previously [27]. Mouse IgG1-PE (Miltenyi Biotec) and mouse IgG1-FITC (Miltenyi Biotec) were used as a negative control.
2.3. Cytotoxicity Assays
Cells were seeded in 96-well culture plates at a density of 2 × 10⁴ cells per well and cultured overnight. The cells were then treated with various concentrations of DXR (FUJIFILM Wako Pure Chemical), in the absence or presence of verapamil (FUJIFILM Wako Pure Chemical). Cytotoxicity assays were performed using the Cell Proliferation Kit I (MTT) (Roche Applied Science, Germany), as described previously [27]. The absorbance was measured at 570 nm using a microplate reader (Multiskan FC, Thermo Fisher Scientific).
2.4. Analysis on the Expression of ABC Transporters
The expressions of the ATP-binding cassette subfamilies of B member 1 (ABCB1) or G member 2 (ABCG2) were analyzed by flow cytometry. Briefly, cells were incubated with mouse primary antibodies against human ABCB1 and ABCG2 (BD Biosciences, CA, USA) and then labeled by FITC-conjugated anti-mouse IgG (BD Biosciences), according to the manufacturer's instruction. Respective isotype controls were used as a negative control. After washing, flow cytometry analysis was performed using a FACSCalibur.
2.5. Analysis of Cellular Accumulation of DXR
The intracellular accumulation of DXR was analyzed by flow cytometry. Briefly, cells were treated by 10 μM DXR for 24 hr, in the absence or presence of 50 μM verapamil or 200 μM buthionine sulfoximine (BSO, Sigma-Aldrich, MO, USA). Cells were then collected as a single-cell suspension and washed twice with ice-cold phosphate-buffered saline. The accumulation of DXR within cells was evaluated by the intracellular fluorescence intensity, using a FACSCalibur. The nucleus accumulation of DXR was analyzed by using cell pellets treated with 0.1% Triton X-100/PBS as assay material, as described previously [28].
2.6. Detection of Intracellular ROS
The intracellular ROS level based on the oxidation of 2′,7′-dichlorodihydrofluorescein diacetate (H2DCFDA, Molecular Probes, Thermo Fisher Scientific) was measured to form the fluorescent compound 2′,7′-dichlorofluorescein (DCF), using a FACSCalibur.
2.7. Immunoblot Analysis
Expression levels of phosphorylated-p38 MAP kinase (phospho-p38MAPK), total p38MAPK, and nuclear factor erythroid 2-related factor 2 (Nrf2) in the cells were estimated by immunoblotting. Briefly, cell lysate (30 μg of total protein) was separated by sodium dodecyl sulfate–polyacrylamide gel electrophoresis (SDS-PAGE) gel, transferred to PVDF membranes (Bio-Rad, CA, USA), and then incubated with primary antibodies (Cell Signaling Technology, MA, USA), followed by appropriate HRP-labeled secondary antibodies (DAKO, Agilent Pathology Solutions, CA, USA). Blots were developed by enhanced chemiluminescence, using an ECL kit (GE Healthcare Life Sciences, PA, USA). Semiquantitation was done by measuring the density of bands, using the Image Quant LAS 4000 Mini biomolecular imager (GE Healthcare Life Sciences), as described previously [27].
2.8. siRNA Treatment
Small interfering RNA- (siRNA-) specific targeting to CD133 (On TARGETplus siRNA) and a scramble siRNA (On TARGETplus siRNA negative control) were obtained from Dharmacon (Horizon Discovery, Cambridge, UK). Cells were seeded in 6-well plates (2 × 10⁵ cells/well) and incubated for 16 hr. Transfections were performed using DharmaFECT 1 siRNA Transfection Reagents (Dharmacon), according to the manufacturer's instructions. Analyses were done at 48 hr after siRNA transfection.
2.9. Statistical Analysis
All of the results are presented as the means ± S.D. Statistical significance was determined by one-way analysis of variance (ANOVA) followed by Tukey's test (Dr. SPSS II, Chicago, IL). Differences were considered significant when P < 0.05.
3. Results
3.1. HCT8 Cells Were Separated into Various Subpopulations Based on Their Expressions of CD44 and CD133
First, we separated the HCT8 cells into CD44− and CD44+ subpopulations and compared their sensitivity to anticancer drugs of DXR and cisplatin (cis-diaminedichloroplatine, CDDP). However, no difference in the sensitivity to the two drugs was observed between CD44+ and CD44− cells (data not shown). We further tried to purify a small population of CD133+ cells from these CD44+ cells (CD44− cells almost negatively expressed with CD133, Figure 1(a)). As a result, we separated HCT 8 cells into different subpopulations, including CD44−, CD44+, CD44+CD133−, and CD44+CD133+ cells. The purities of isolated cells in each subpopulation were confirmed to be around 95% by flow cytometry (Figure 1(a)).
Figure 1.
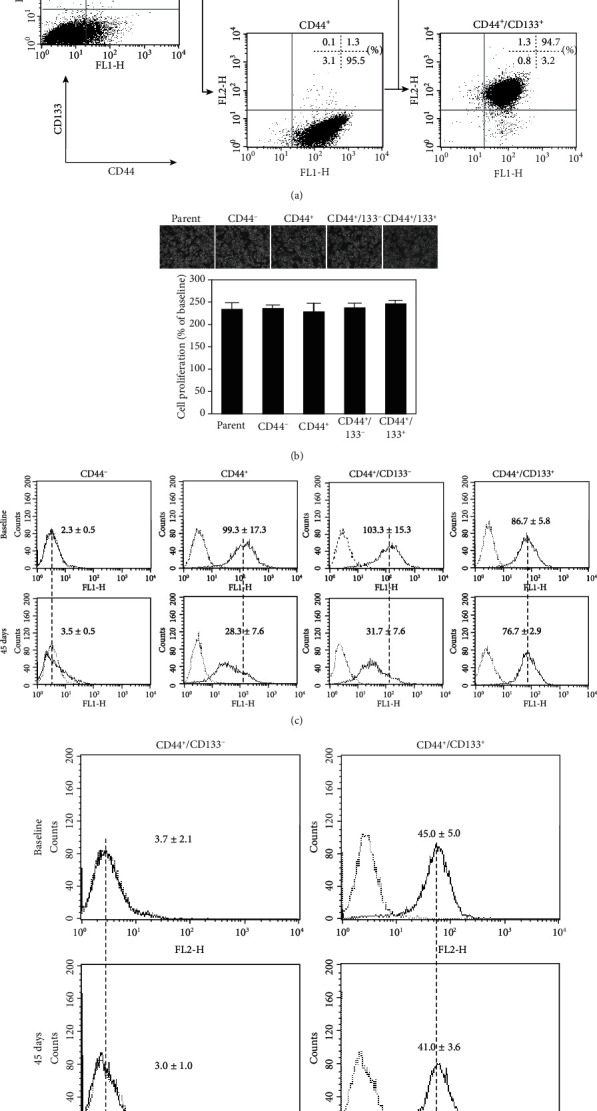
The separation of HCT8 colorectal cancer cells into different subpopulations based on the expression of CD44 and CD133. (a) Representative dot plots of flow cytometry analysis show the purities of each subpopulation of isolated cells. Quantitative data in the dot plots are presented as the percentages of positive cells from three independent experiments. (b) Representative photos of morphological properties (upper) and MTT assay on cell growth (lower) at 24 hr after the initiation of culture. Data are presented as the mean ± SD from three independent experiments. (c, d) Representative histograms of flow cytometry analysis showed the expressions of CD44 (c) and CD133 (d) at baseline and 45 days after cell culture. The dotted vertical lines through histograms indicate the difference in the expression peaks between the baseline and at 45 days after culture. Quantitative data in the histograms are presented as the mean fluorescent intensity from three independent experiments.
3.2. Growth and Phenotype Change in Different Subpopulations of Cells
The morphology and proliferation of these cells could not be found obviously different among subpopulations (Figure 1(b)). The expression of CD44 in all subpopulations kept stable within 30 days of reculturing from the frozen cells that stocked immediately after isolation. Interestingly, the expression of CD44 was a tendency to decrease with culture time in CD44+ (fluorescence intensity: 99.3 ± 17.3 at baseline vs.28.3 ± 7.6 at 45 days, P < 0.001; Figure 1(c)) and CD44+CD133− cells (fluorescence intensity: 103.3 ± 15.3 at baseline vs.31.7 ± 7.6 at 45 days, P < 0.001; Figure 1(c)) but still kept stable in CD44+CD133+ cells at 45 days after reculturing (fluorescence intensity: 86.7 ± 5.8 at baseline vs.76.7 ± 2.9 at 45 days, P = 0.84; Figure 1(c)). The expression of CD133 in CD44+CD133+ cells kept very stable (fluorescence intensity: 45.0 ± 5.0 at baseline vs.41.0 ± 3.6 at 45 days, P = 0.49; Figure 1(d)), and CD44+CD133− cells did not turn to express CD133 within 45 days of reculturing (fluorescence intensity: 3.7 ± 2.1 at baseline vs.3.0 ± 1.0 at 45 days, P = 0.99; Figure 1(d)). Therefore, we used the cells within 30 days after reculturing from the frozen stocked cells in subsequent experiments.
3.3. DXR Resistance of CD44+CD133+ Cells
Next, we evaluated the sensitivity of cells to DXR by MTT assay. With the addition of 10~200 μM of DXR in medium, we found that the survival of CD44+CD133+ cells was significantly higher than all other subpopulations of cells after 48 hr of culture (P < 0.01vs. other groups at different DXR concentrations, Figure2(a)).
Figure 2.
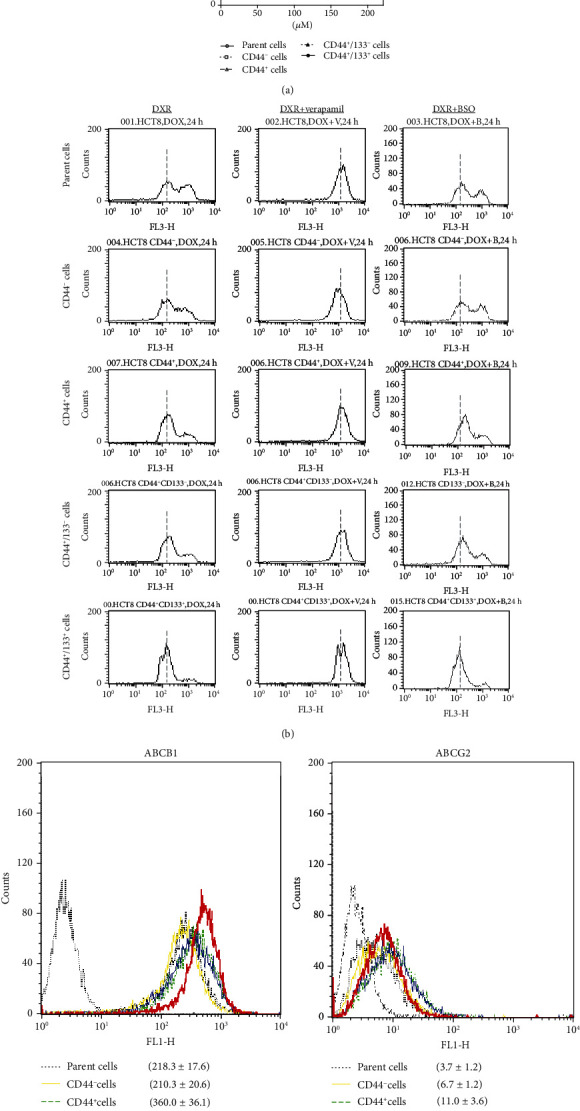
DXR resistance of different subpopulations of cells. (a) MTT assay was done to evaluate the cytotoxicity of DXR. Data are expressed as the percentile of baseline (before DXR treatment) from three independent experiments. ∗P < 0.01 vs. all other subpopulations. (b) Representative histograms of flow cytometry analysis show the accumulation of DXR in cells 24 hr after the treatment with 10 μM DXR, in the absence or presence of 50 μM verapamil and 200 μM BSO. The dotted vertical lines through histograms indicated the mean levels of DXR accumulation in CD44+CD133+ cells for comparing with other subpopulations of cells. The results were reproducible in three independent experiments. (c) Representative histograms of flow cytometry analysis show the expression of the ABCB1 or ABCG2 in different subpopulations of cells. Quantitative data in the histograms are presented as the mean fluorescent intensity from three independent experiments.
To understand the relevant mechanism, we measured the intracellular accumulation of DXR in cells by flow cytometry. The accumulation of DXR in CD44+CD133+ cells was detected as the lowest among these subpopulations, at 24 hr after the exposure to 10 μM DXR (Figure 2(b)). We further found that the intracellular accumulation of DXR in CD44+CD133+ cells was obviously increased by the treatment with verapamil, an inhibitor for drug efflux cell membrane transporters of ABCB1 and ABCG2 (Figure 2(b)). However, the intracellular accumulation of DXR in CD44+CD133+ cells did not change by the treatment with BSO, a glutathione synthesis inhibitor that indirectly regulates drug efflux through ABCC1 (Figure 2(b)). We also confirmed that the expression of ABCB1 (P < 0.01vs. other groups), but not ABCG2, was enhanced in CD44+CD133+ cells (Figure 2(c)), suggesting the probable role of ABCB1 on DXR resistance in CD44+CD133+ cells.
To further confirm the causal relationship between the enhanced drug efflux and DXR resistance, we evaluated the cytotoxicity of DXR, in the presence or absence of verapamil. Unexpectedly, verapamil only partially enhanced the cytotoxicity of DXR, in either CD44+CD133+ or CD44+CD133− cells (Figure 3(a)).
Figure 3.
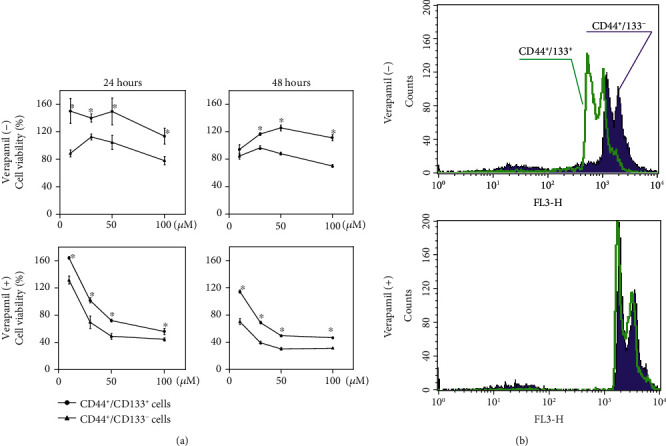
DXR resistance and nuclear DXR accumulation in CD44+CD133− and CD44+CD133+ cells, in the absence or presence of drug efflux inhibitor. (a) MTT assay was done to compare the cytotoxicity of DXR in CD44+CD133− and CD44+CD133+ cells, with or without the addition of 50 μM verapamil. Data were expressed as a percent of baseline (before DXR treatment) from three independent experiments. ∗P < 0.05 vs. CD44+CD133− cells. (b) Representative histograms of flow cytometry analysis showed the nuclear accumulation of DXR in cells 24 hr after the treatment by 10 μM DXR, with or without the addition of 50 μM verapamil. The results were reproducible in three independent experiments.
It is well known that DXR interacts with nuclear DNA to inhibit macromolecular biosynthesis. Therefore, we also estimated the effect of verapamil on the nuclear accumulation of DXR. The nuclear accumulation of DXR was observed obviously less in CD44+CD133+ than CD44+CD133− cells but tended to have comparable levels with verapamil treatment (Figure 3(b)).
3.4. CD44+CD133+ Cells Showed Better Stress Tolerance than CD44+CD133− Cells
It is well known that the stress response kinase p38MAPK can be activated by various extracellular stresses and plays critical roles in cell survival and apoptosis. Although the basal level of phosphorylated p38MAPK was detected very similar between CD44+CD133+ and CD44+CD133− cells (P = 0.92, Figure 4), lower expression was observed in CD44+CD133+ than CD44+CD133− cells after DXR exposure, even under verapamil treatment (P < 0.05, Figure 4). This suggests a better tolerance to stress of CD44+CD133+ cells, independent on the accumulation of DXR.
Figure 4.
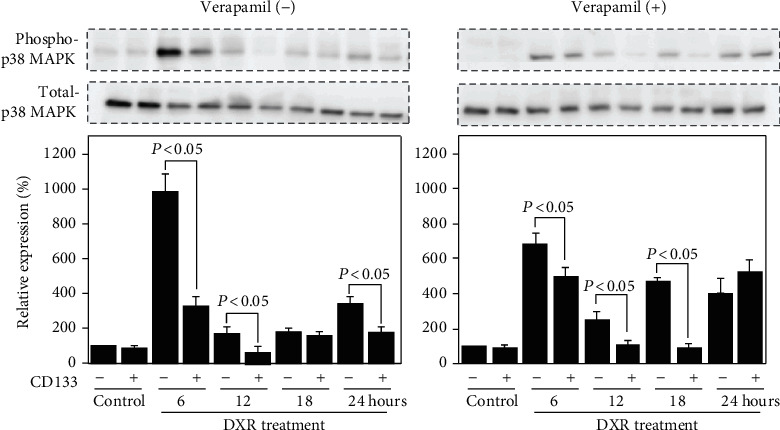
Different expression of phosphorylated p38MAPK between CD44+CD133− and CD44+CD133+ cells. Representative blots and semiquantitative data on the expression of phosphorylated p38MAPK and total p38MAPK in cells treated with 10 μM DXR, in the absence or presence of 50 μM verapamil. The quantitative data are normalized to total p38MAPK. Data are expressed as relative values to CD44+CD133− cells without DXR treatment and presented as the mean ± SD from three independent experiments.
3.5. CD44+CD133+ Cells Showed Higher Antioxidant Capacity than CD44+CD133− Cells
It is also well known that DXR generates ROS, and oxidative stress due to ROS generation may induce the activation of p38MAPK. Therefore, we estimated the ROS levels in cells, with or without DXR exposure. We observed a lower level of ROS in CD44+CD133+ than CD44+CD133− cells, especially under DXR exposure, but verapamil did not obviously change the ROS levels (Figure 5(a)). Based on these findings, we speculated that the enhanced antioxidant capacity in CD44+CD133+ cells might help to maintain a lower level of phosphorylated p38MAPK.
Figure 5.
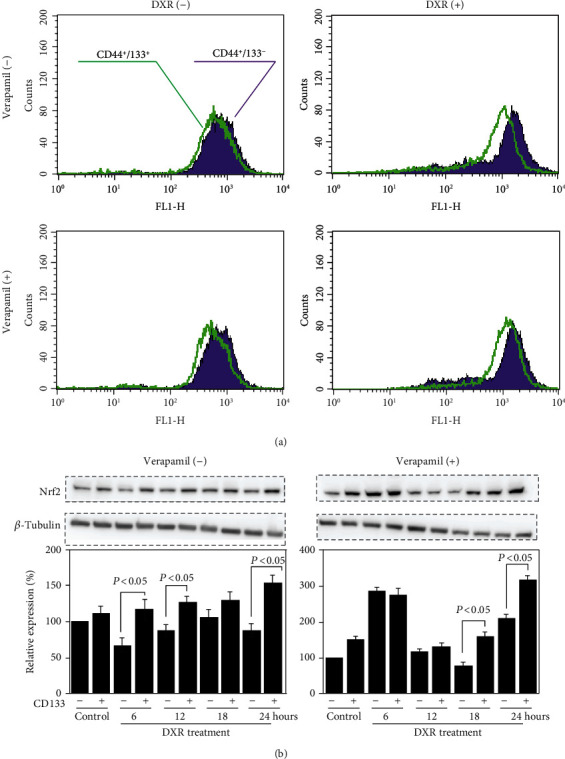
Different antioxidant capacity between CD44+CD133− and CD44+CD133+ cells. (a) Representative histograms of flow cytometry analysis show the intracellular ROS levels 24 hr after the treatment by 10 μM DXR, in the absence or presence of 50 μM verapamil. The results were reproducible in three independent experiments. (b) Representative blots and semiquantitative data on the expression of Nrf2 in cells treated with 10 μM DXR, in the absence or presence of 50 μM verapamil. The quantitative data are normalized to β-tubulin. Data are expressed as relative values to CD44+CD133− cells without DXR treatment and presented as the mean ± SD from three independent experiments.
Nrf2, a transcription factor that is well known to be activated by oxidative stress, such as ROS and electrophilic substances, can protect cells against various stresses. We also compared the expression level of Nrf2 between CD44+CD133+ and CD44+CD133− cells. Western blotting showed a higher expression of Nrf2 in CD44+CD133+ than CD44+CD133− cells, especially under DXR exposure (P < 0.05, Figure 5(b)), and the enhanced expression of Nrf2 in CD44+CD133+ cells was not cancelled by verapamil treatment (P < 0.05, Figure 5(b)).
3.6. siRNA Treatment
To further confirm the regulatory role of CD133 in drug resistance, we tried to silence CD133 expression in CD44+CD133+ cells by siRNA and then estimated cytotoxicity of DXR. Although the decrease of CD133 expression was clearly observed by targeted siRNA (P < 0.001vs. 0 nM, Figure 6(a)), DXR resistance of CD44+CD133+ cells only partially improved (Figure 6(b)). Unexpectedly, the silencing of CD133 did not change the expression of ABCB1 in CD44+CD133+ cells, even using excessive concentrations of CD133 siRNA (P = 0.89vs. 0 nM, Figure 6(c)). We also confirmed that the silencing of CD133 did not affect the accumulation of DXR in CD44+CD133+ cells (P = 0.98vs. control siRNA, Figure 6(d)).
Figure 6.
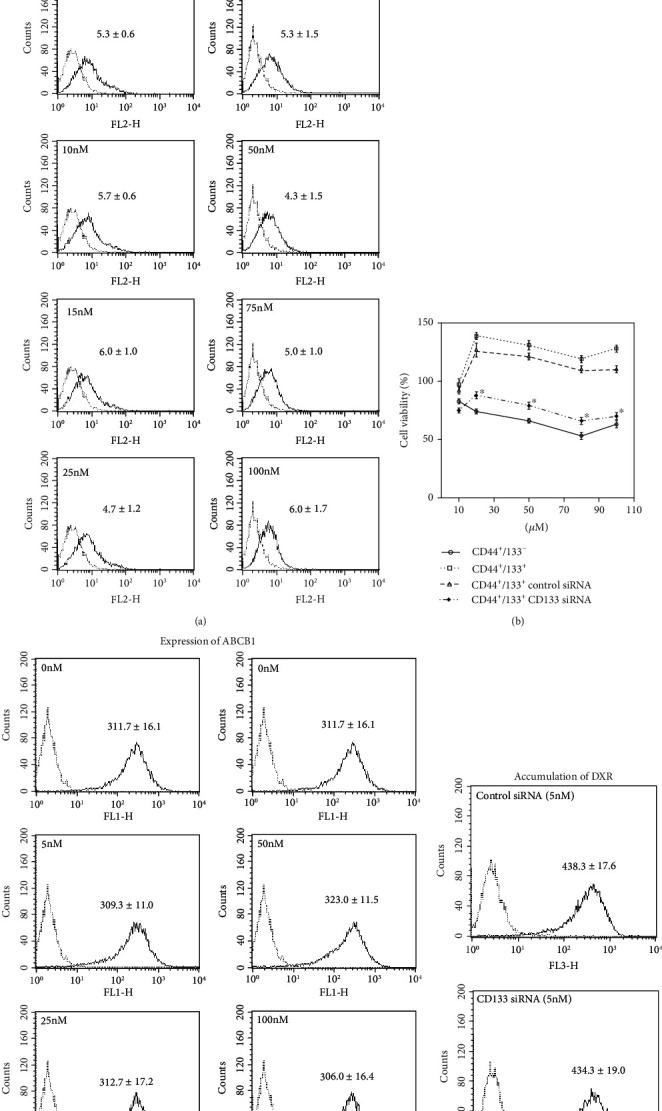
The effect of silencing CD133 expression on DXR resistance of CD44+CD133+ cells. (a) Representative histograms of flow cytometry analysis on the expression of CD133 in CD44+CD133+ cells after silencing by different dosages of targeted siRNA. Quantitative data in the histograms are presented as the mean fluorescent intensity from three independent experiments. (b) MTT assay was done to evaluate the cytotoxicity to DXR. Cells were treated with 5 nM siRNA for 48 hr followed by DXR treatment for another 48 hr. Data are expressed as a percent of baseline (before DXR treatment) from three independent experiments. ∗P < 0.05 vs. CD44+CD133− cells. (c) Representative histograms of flow cytometry analysis on the expression of ABCB1 in cells after silencing by different dosages of targeted siRNA. Quantitative data in the histograms are presented as the mean fluorescent intensity from three independent experiments. (d) Representative histograms of flow cytometry analysis on the accumulation of DXR. Quantitative data in the histograms are presented as the mean fluorescent intensity from three independent experiments.
This suggests that, beyond the drug excretion and redox regulation, other complex mechanisms are also likely involved in the DXR resistance in CD44+CD133+ cells.
4. Discussion
By using the well-recognized cell surface markers of CD44 and CD133 for CSC identification, we tried to separate the HCT8 human colon cancer cells into CD44−, CD44+, CD44+CD133−, and CD44+CD133+ subpopulations and then investigated how the expressions of CD44 and CD133 associated with drug resistance. Actually, we checked several cancer cell lines on the expression of CD44 and CD133, including HeLa cells and A549 cells. However, both HeLa cells and A549 cells showed almost 100% expression of CD44. Only the HCT8 cells showed a partial expression of CD44 (about 30%) and a rare expression of CD133. Therefore, we only isolated different subpopulations from HCT8 cells for this study.
First, we found that the expression level of CD44 kept very stable in the CD44+CD133+ cells but gradually declined in CD44+CD133− cells during a cell passaging process. On the other hand, some of CD44− cells shifted to express CD44 during a cell passaging process (Figure 1(c)). These findings suggested the plasticity of CD44 expression in HCT8 cells. Actually, Ohata et al. reported that CD44 high-expressed cells from human intractable colon cancer patients can differentiate into CD44 low-expressed cells, and a fraction of CD44 low-expressed cells can also generate CD44 high-expressed cells in a xenograft mouse model [29]. However, it is unclear why the CD44+CD133+ cells, but not CD44+CD133− cells, stably maintain the expression level of CD44. Unlike the extensive expression of CD44 with high plasticity, the expression of CD133 was only observed in very few of the HCT8 cells with poor plasticity.
A number of previous studies have demonstrated that CSCs are likely resistant to chemotherapeutic drugs. The CD44+CD133+ cells, but not the CD44+ and CD44+CD133− cells, showed DXR resistance (Figure 2(a)). According to this data, the expression of CD133, but not CD44, seems to be closely associated with drug resistance. Actually, these CD44+CD133+ cells showed the enhanced expression of ABCB1 and the decreased intracellular accumulation of DXR (Figures 2(b) and 2(c)). Liu et al. reported that non-small-cell lung cancer cells treated with low-dose CDDP are sufficient to enrich CD133+ cells and upregulate ABCB1 expression through Notch signaling, which therefore increases the cross-resistance to DXR [30]. However, the inhibition of ABCB1 by verapamil only partially improved the DXR resistance of CD44+CD133+ cells in this study.
To find other potential mechanisms involving in the DXR resistance of CD44+CD133+ cells, we investigated several interesting aspects, including the stress protection and redox regulation. We found that p38MAPK, one of the most popular protein kinases known to be activated by inflammatory cytokines, lipopolysaccharide, osmotic shock, ultraviolet light, and other stresses, was more obviously induced by DXR in CD44+CD133− cells than CD44+CD133+ cells (Figure 4). Moreover, the activation of p38 MAPK was not dependent on the intracellular accumulation of DXR (Figure 4).
DXR is known to insert between the base pairs of DNA of tumor cells and exhibits antitumor effects by suppressing the biosynthesis of both DNA and RNA through the inhibition of DNA polymerase, RNA polymerase, and topoisomerase II reactions. Furthermore, it is believed that DXR has the ability to generate sufficient ROS to raise oxidative stress. Indeed, we observed DXR-induced ROS generation in both CD44+CD133− and CD44+CD133+ cells, but the DXR-induced ROS generation was detected even higher in CD44+CD133− than CD44+CD133+ cells, independent on the intracellular accumulation of DXR (Figures 5(a), 2(b), and 3(b)), suggesting the enhanced antioxidant capacity in CD44+CD133+ cells.
The Keap1-Nrf2 control system plays a central role in the antioxidant defense mechanisms. Nrf2 is known as a transcription factor to activate various genes involving in biological defense mechanisms. It has been reported that Nrf2 is constantly expressed in many cancer cells [31–36]. Moreover, the enhanced expression of Nrf2 has been confirmed to associate with poor prognosis of cancer patients [37–41]. In our study, Nrf2 expression was detected higher in CD44+CD133+ than CD44+CD133− cells, and the difference in Nrf2 expression was observed even clearer between cells with DXR administration, independent on the DXR accumulation (Figure 5(b)). These findings also clearly indicate the enhanced antioxidant capacity in CD44+CD133+ cells. Although the absence of direct evidence by interference experiment, pathways involving in the stress protection and redox regulation might at least partially contributed to the DXR resistance of CD44+CD133+ cells.
Very strangely, our data showed that the silencing of CD133 expression in CD44+CD133+ cells by siRNA could only partially increase the cytotoxicity of DXR (Figure 6(b)) but did not change the expression of ABCB1 and the intracellular accumulation of DXR (Figure 6(c)). Other unknown mechanisms beyond the drug excretion and redox regulation are asked to be defined on the DXR resistance of CD44+CD133+ cells.
Based on data from the present study, the expression of CD133, rather than CD44, more closely associated with the resistance of cancer cells to anticancer drug. As complex mechanisms, including the drug excretion and redox regulation, are likely involved in the drug resistance of CSCs, multiple approaches may be needed to overcome the big problem of drug resistance in cancer patients.
Acknowledgments
This work was supported by a Grant-in-Aid for the Ministry of Education, Science, Sports, Culture and Technology of Japan (Grant Numbers 25462061 and 16K15622) and the collaborative research program of the Atomic bomb Disease Institute of Nagasaki University.
Abbreviations
- ABCB1:
ATP-binding cassette subfamily B member 1/P-glycoprotein/multidrug resistance protein 1/MDR1
- ABCG2:
ATP-binding cassette subfamily G member 2/breast cancer resistance protein/BCRP/CD388
- ABCC1:
ATP-binding cassette subfamily C member 1/multidrug resistance-associated protein 1/MRP1
- BSO:
Buthionine sulfoximine
- CSCs:
Cancer stem cells
- DXR:
Doxorubicin/Adriamycin
- MTT:
3-(4,5-Dimethylthiazol-2-yl)-2,5-diphenyltetrazolium bromide
- Nrf2:
Nuclear factor erythroid 2-related factor 2
- p38MAPK:
p38 MAP kinase
- ROS:
Reactive oxygen species
- siRNA:
Small interfering RNA.
Data Availability
The data that support the findings of this study are available from the corresponding author upon reasonable request.
Disclosure
The funder played no role in the study design, data collection and analysis, decision to publish, or preparation of the manuscript.
Conflicts of Interest
The authors indicate no potential conflicts of interest.
References
- 1.Elble R. C. The role of cancer stem cells in relapse of solid tumors. Frontiers in Bioscience. 2012;E4(4):1528–1541. doi: 10.2741/e478. [DOI] [PubMed] [Google Scholar]
- 2.Visvader J. E. Cells of origin in cancer. Nature. 2011;469(7330):314–322. doi: 10.1038/nature09781. [DOI] [PubMed] [Google Scholar]
- 3.Clevers H. The cancer stem cell: premises, promises and challenges. Nature Medicine. 2011;17(3):313–319. doi: 10.1038/nm.2304. [DOI] [PubMed] [Google Scholar]
- 4.Kinugasa Y., Matsui T., Takakura N. CD44 expressed on cancer-associated fibroblasts is a functional molecule supporting the stemness and drug resistance of malignant cancer cells in the tumor microenvironment. Stem Cells. 2014;32(1):145–156. doi: 10.1002/stem.1556. [DOI] [PubMed] [Google Scholar]
- 5.Ishimoto T., Nagano O., Yae T., et al. CD44 variant regulates redox status in cancer cells by stabilizing the xCT subunit of system xc− and thereby promotes tumor growth. Cancer Cell. 2011;19(3):387–400. doi: 10.1016/j.ccr.2011.01.038. [DOI] [PubMed] [Google Scholar]
- 6.Tamada M., Nagano O., Tateyama S., et al. Modulation of glucose metabolism by CD44 contributes to antioxidant status and drug resistance in cancer cells. Cancer Research. 2012;72(6):1438–1448. doi: 10.1158/0008-5472.CAN-11-3024. [DOI] [PubMed] [Google Scholar]
- 7.Bates R. C., Edwards N. S., Burns G. F., Fisher D. E. A CD44 survival pathway triggers chemoresistance via lyn kinase and phosphoinositide 3-kinase/Akt in colon carcinoma cells. Cancer Research. 2001;61(13):5275–5283. [PubMed] [Google Scholar]
- 8.Bourguignon L. Y. W., Peyrollier K., Xia W., Gilad E. Hyaluronan-CD44 interaction activates stem cell marker Nanog, Stat-3-mediated MDR1 gene expression, and ankyrin-regulated multidrug efflux in breast and ovarian tumor cells. The Journal of Biological Chemistry. 2008;283(25):17635–17651. doi: 10.1074/jbc.M800109200. [DOI] [PMC free article] [PubMed] [Google Scholar]
- 9.Bourguignon L. Y. W., Earle C., Wong G., Spevak C. C., Krueger K. Stem cell marker (Nanog) and Stat-3 signaling promote microRNA-21 expression and chemoresistance in hyaluronan/CD44-activated head and neck squamous cell carcinoma cells. Oncogene. 2012;31(2):149–160. doi: 10.1038/onc.2011.222. [DOI] [PMC free article] [PubMed] [Google Scholar]
- 10.Tajima K., Ohashi R., Sekido Y., et al. Osteopontin-mediated enhanced hyaluronan binding induces multidrug resistance in mesothelioma cells. Oncogene. 2010;29(13):1941–1951. doi: 10.1038/onc.2009.478. [DOI] [PubMed] [Google Scholar]
- 11.Ni J., Cozzi P. J., Hao J. L., et al. CD44 variant 6 is associated with prostate cancer metastasis and chemo-/radioresistance. Prostate. 2014;74(6):602–617. doi: 10.1002/pros.22775. [DOI] [PubMed] [Google Scholar]
- 12.Carling U., Barkhatov L., Reims H. M., et al. Can we ablate liver lesions close to large portal and hepatic veins with MR-guided HIFU? An experimental study in a porcine model. Blood. 2019;29(9):5013–5021. doi: 10.1007/s00330-018-5996-8. [DOI] [PubMed] [Google Scholar]
- 13.Wu Y., Wu P. Y. CD133 as a marker for cancer stem cells: progresses and concerns. Stem Cells and Development. 2009;18(8):1127–1134. doi: 10.1089/scd.2008.0338. [DOI] [PubMed] [Google Scholar]
- 14.Gehling U. M., Ergün S., Schumacher U., et al. In vitro differentiation of endothelial cells from AC133-positive progenitor cells. Blood. 2000;95(10):3106–3112. doi: 10.1182/blood.V95.10.3106. [DOI] [PubMed] [Google Scholar]
- 15.Peichev M., Naiyer A. J., Pereira D., et al. Expression of VEGFR-2 and AC133 by circulating human CD34(+) cells identifies a population of functional endothelial precursors. Blood. 2000;95(3):952–958. doi: 10.1182/blood.v95.3.952.003k27_952_958. [DOI] [PubMed] [Google Scholar]
- 16.Uchida N., Buck D. W., He D., et al. Direct isolation of human central nervous system stem cells. Proceedings of the National Academy of Sciences of the United States of America. 2000;97(26):14720–14725. doi: 10.1073/pnas.97.26.14720. [DOI] [PMC free article] [PubMed] [Google Scholar]
- 17.Cummings B. J., Uchida N., Tamaki S. J., et al. Human neural stem cells differentiate and promote locomotor recovery in spinal cord-injured mice. Proceedings of the National Academy of Sciences of the United States of America. 2005;102(39):14069–14074. doi: 10.1073/pnas.0507063102. [DOI] [PMC free article] [PubMed] [Google Scholar]
- 18.Bussolati B., Bruno S., Grange C., et al. Isolation of renal progenitor cells from adult human kidney. The American Journal of Pathology. 2005;166(2):545–555. doi: 10.1016/S0002-9440(10)62276-6. [DOI] [PMC free article] [PubMed] [Google Scholar]
- 19.Ricci-Vitiani L., Lombardi D. G., Pilozzi E., et al. Identification and expansion of human colon-cancer-initiating cells. Nature. 2007;445(7123):111–115. doi: 10.1038/nature05384. [DOI] [PubMed] [Google Scholar]
- 20.O’Brien C. A., Pollett A., Gallinger S., Dick J. E. A human colon cancer cell capable of initiating tumour growth in immunodeficient mice. Nature. 2007;445(7123):106–110. doi: 10.1038/nature05372. [DOI] [PubMed] [Google Scholar]
- 21.Lin L., Liu A., Peng Z., et al. STAT3 is necessary for proliferation and survival in colon cancer-initiating cells. Cancer Research. 2011;71(23):7226–7237. doi: 10.1158/0008-5472.CAN-10-4660. [DOI] [PMC free article] [PubMed] [Google Scholar]
- 22.Haraguchi N., Ohkuma M., Sakashita H., et al. CD133+CD44+ population efficiently enriches colon cancer initiating cells. Annals of Surgical Oncology. 2008;15(10):2927–2933. doi: 10.1245/s10434-008-0074-0. [DOI] [PubMed] [Google Scholar]
- 23.Sarvi S., Mackinnon A. C., Avlonitis N., et al. CD133+ cancer stem-like cells in small cell lung cancer are highly tumorigenic and chemoresistant but sensitive to a novel neuropeptide antagonist. Cancer Research. 2014;74(5):1554–1565. doi: 10.1158/0008-5472.CAN-13-1541. [DOI] [PubMed] [Google Scholar]
- 24.Zhang Q., Shi S., Yen Y., Brown J., Ta J. Q., Le A. D. A subpopulation of CD133(+) cancer stem-like cells characterized in human oral squamous cell carcinoma confer resistance to chemotherapy. Cancer Letters. 2010;289(2):151–160. doi: 10.1016/j.canlet.2009.08.010. [DOI] [PubMed] [Google Scholar]
- 25.Ma S., Lee T. K., Zheng B. J., Chan K. W., Guan X. Y. CD133+ HCC cancer stem cells confer chemoresistance by preferential expression of the Akt/PKB survival pathway. Oncogene. 2008;27(12):1749–1758. doi: 10.1038/sj.onc.1210811. [DOI] [PubMed] [Google Scholar]
- 26.Bao S., Wu Q., McLendon R. E., et al. Glioma stem cells promote radioresistance by preferential activation of the DNA damage response. Nature. 2006;444(7120):756–760. doi: 10.1038/nature05236. [DOI] [PubMed] [Google Scholar]
- 27.Yan C., Luo L., Guo C. Y., et al. Doxorubicin-induced mitophagy contributes to drug resistance in cancer stem cells from HCT8 human colorectal cancer cells. Cancer Letters. 2017;388:34–42. doi: 10.1016/j.canlet.2016.11.018. [DOI] [PubMed] [Google Scholar]
- 28.Goto S., Ihara Y., Urata Y., et al. Doxorubicin-induced DNA intercalation and scavenging by nuclear glutathioneS‐transferase π. The FASEB Journal. 2001;15(14):2702–2714. doi: 10.1096/fj.01-0376com. [DOI] [PubMed] [Google Scholar]
- 29.Ohata H., Ishiguro T., Aihara Y., et al. Induction of the stem-like cell regulator CD44 by Rho kinase inhibition contributes to the maintenance of colon cancer-initiating cells. Cancer Research. 2012;72(19):5101–5110. doi: 10.1158/0008-5472.CAN-11-3812. [DOI] [PubMed] [Google Scholar]
- 30.Liu Y.-P., Yang C.-J., Huang M.-S., et al. Cisplatin selects for multidrug-resistant CD133+ cells in lung adenocarcinoma by activating Notch signaling. Cancer Research. 2013;73(1):406–416. doi: 10.1158/0008-5472.CAN-12-1733. [DOI] [PubMed] [Google Scholar]
- 31.Singh A., Misra V., Thimmulappa R. K., et al. Dysfunctional KEAP1-NRF2 interaction in non-small-cell lung cancer. PLoS Medicine. 2006;3(10, article e420) doi: 10.1371/journal.pmed.0030420. [DOI] [PMC free article] [PubMed] [Google Scholar]
- 32.Wang R., An J., Ji F., Jiao H., Sun H., Zhou D. Hypermethylation of the Keap1 gene in human lung cancer cell lines and lung cancer tissues. Biochemical and Biophysical Research Communications. 2008;373(1):151–154. doi: 10.1016/j.bbrc.2008.06.004. [DOI] [PubMed] [Google Scholar]
- 33.Kensler T. W., Wakabayashi N. Nrf2: friend or foe for chemoprevention? Carcinogenesis. 2010;31(1):90–99. doi: 10.1093/carcin/bgp231. [DOI] [PMC free article] [PubMed] [Google Scholar]
- 34.Taguchi K., Motohashi H., Yamamoto M. Molecular mechanisms of the Keap1-Nrf2 pathway in stress response and cancer evolution. Genes to Cells. 2011;16(2):123–140. doi: 10.1111/j.1365-2443.2010.01473.x. [DOI] [PubMed] [Google Scholar]
- 35.Kang K. A., Hyun J. W. Oxidative stress, Nrf2, and epigenetic modification contribute to anticancer drug resistance. Toxicological Research. 2017;33(1):1–5. doi: 10.5487/TR.2017.33.1.001. [DOI] [PMC free article] [PubMed] [Google Scholar]
- 36.Kitamura H., Motohashi H. NRF2 addiction in cancer cells. Cancer Science. 2018;109(4):900–911. doi: 10.1111/cas.13537. [DOI] [PMC free article] [PubMed] [Google Scholar]
- 37.Solis L. M., Behrens C., Dong W., et al. Nrf2 and Keap1 abnormalities in non-small cell lung carcinoma and association with clinicopathologic features. Clinical Cancer Research. 2010;16(14):3743–3753. doi: 10.1158/1078-0432.CCR-09-3352. [DOI] [PMC free article] [PubMed] [Google Scholar]
- 38.Park J. Y., Kim Y. W., Park Y. K. Nrf2 expression is associated with poor outcome in osteosarcoma. Pathology. 2012;44(7):617–621. doi: 10.1097/PAT.0b013e328359d54b. [DOI] [PubMed] [Google Scholar]
- 39.Inoue D., Suzuki T., Mitsuishi Y., et al. Accumulation of p62/SQSTM1 is associated with poor prognosis in patients with lung adenocarcinoma. Cancer Science. 2012;103(4):760–766. doi: 10.1111/j.1349-7006.2012.02216.x. [DOI] [PMC free article] [PubMed] [Google Scholar]
- 40.Ma J. Q., Tuersun H., Jiao S. J., Zheng J. H., Xiao J. B., Hasim A. Functional role of NRF2 in cervical carcinogenesis. PLoS One. 2015;10(8, article e0133876) doi: 10.1371/journal.pone.0133876. [DOI] [PMC free article] [PubMed] [Google Scholar]
- 41.Yang Q., Deng H., Xia H., et al. High NF-E2-related factor 2 expression predicts poor prognosis in patients with lung cancer: a meta-analysis of cohort studies. Free Radical Research. 2019;24:1–9. doi: 10.1080/10715762.2019.1642472. [DOI] [PubMed] [Google Scholar]
Associated Data
This section collects any data citations, data availability statements, or supplementary materials included in this article.
Data Availability Statement
The data that support the findings of this study are available from the corresponding author upon reasonable request.


