

Abstract
Background
Acute aortic dissection (AAD) is a devastating cardiovascular disease with a high rate of disability and mortality. This disease often rapidly progresses to fatal multiple organ hypoperfusion, and the incidence has been increasing in recent years. However, the molecular mechanisms have yet to be clarified. This study is aimed at identifying the differential abundance proteins (DAPs) of aortic arch tissues in patients with AAD by proteomics and select possible proteins involved in AAD pathogenesis.
Methods
The fresh aortic arch tissues obtained from 5 AAD patients and 1 healthy donor were analyzed by amine-reactive tandem mass tag (TMT) labelling and mass spectrometry; then, the pathological sections of another 10 healthy donors and 20 AAD patients were chosen to verify the proteomic results by immunohistochemistry.
Results
Of 809 proteins identified by proteomic analysis, 132 differential abundance proteins (DAPs) were screened, of which 100 proteins were significantly downregulated while 32 upregulated. Among 100 downregulated proteins, two proteins with known function, integrin alpha 3 (ITGA-3) and ITGA-5, were selected as target proteins involved in AAD pathogenesis. Two target DAPs were verified by immunohistochemisty, and the results showed that the integrated option density (IOD) of ITGA-3 and ITGA-5 in AAD patients was significantly lower than that in healthy donors, which were consistent with the proteomic results (P < 0.001).
Conclusion
ITGA-3 and ITGA-5 represent novel biomarkers for the pathogenesis of AAD and might be a therapeutic target in the future.
1. Introduction
Acute aortic dissection (AAD) is one of the most serious acute aorta syndrome characterized by severe chest and/or back pain. AAD of the ascending aorta is highly lethal (a mortality rate of 1%-2% per hour early after symptom onset) that requires prompt diagnosis and surgical intervention to optimize outcomes [1–3]. The etiologies include not only mechanical stimulation such as hypertension and trauma but also vascular injury caused by atherosclerosis, inflammation, and connective tissue disease [4]. Despite recent progress in recognition of the diagnostic and therapeutic advances, clinicians are far from comfortable in defining an optimal therapy to manage aortic dissection, and AAD is still a focus and key point in the field of cardiovascular surgery and critical care so far.
AAD is a surgical emergency occurring when an intima of the aorta is damaged and ruptured and blood enters the media creating a false lumen between the two layers. The typical pathophysiological changes include large modifications to the extracellular matrix, oxidative stress, inflammatory response, vascular smooth muscle (VSM) hypertrophy, and high expression of metalloproteinase, which directly lead to the compensatory hyperplasia of collagen fiber, apoptosis and phenotypic transformation of vascular smooth muscle cells (VSMCs), and steady degradation of the extracellular matrix proteins in the aortic wall [5–13]. Current research showed that the activation of the TGF-β1 signaling pathway and high expression of its downstream matrix metalloproteinase (MMPs) are involved in the pathogenesis of AAD [14–16]. Studies also have found that the PI3K/AKT signaling pathway contributes to phenotypic switching of vascular smooth muscle cell (VSMC) and induces apoptosis [17–19]. However, detailed molecular mechanisms still need to be explored.
Quantitative mass spectrometry (MS) is an adjunctive tool to help understand the mechanisms of many diseases [20]. Large-scale identification of differential abundance proteins (DAPs) can be used to identify key proteins, and immunohistochemistry is an important traditional technique used to verify the selected proteins. The objective of this study was to identify and quantify DAPs of aortic arch tissues in patients with AAD using TMT-labelled MS and further to verify the selected DAPs of interest using immunohistochemistry, by which we hope to find some possible proteins involved in the pathogenesis of AAD. A flowchart to illustrate this study is shown in Figure 1.
Figure 1.
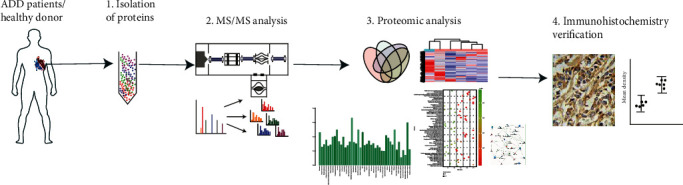
Experimental flowchart. The aortic arch tissues of 5 patients with AAD were extracted during surgery. The peptides labelled with TMT were prepared, and a MS/MS analysis was performed. The proteomic data were analyzed, and the DAPs were selected and verified by immunohistochemistry.
2. Materials and Methods
2.1. Tandem Mass Tag Labelling
2.1.1. Sample
The dissected aortic tissues (aortic arch including all layers of the wall: intima, media, and adventitia) from 5 AAD patients were extracted during surgery. In addition, one piece of healthy aortic arch tissue was obtained from a 44-year-old male donor. CTA was performed in all patients to confirm the diagnosis (all were Stanford type A dissection). Four out of them with hypertension history complained of chest and/or back pain, while one 22-year-old patient, with no history of hypertension and trauma, no family history of Marfan syndrome, and no typical clinical symptoms, was diagnosed with AAD. The clinical features and more detailed description of dissected aortic samples are summarized in Supplementary Table 1.
All tissues were collected as typical lesion specimens of approximately 1.0 × 1.0 cm2 in size. Specimens were immediately placed in an ice-bath, RNA-free specimen box and transferred to a −80°C refrigerator for preservation. The study was approved by the ethics committee of Zhongshan Hospital, Fudan University (Shanghai, China). Informed consent was obtained from patients or their legal surrogates before enrolment.
2.1.2. Sample Pretreatment
Tissues were carefully pulled out from the frozen tubes, cut into pieces, weighed about 50 mg, added 10 times extraction buffer, and extracted protein with a grinding mill. The extracted samples were spun to remove the residue of tissues. The protein concentration of the extracted sample solution was measured with a BCA Protein Assay kit (Pierce). Proteins extracted from tissue were precipitated with a TCA Protein Precipitation Kit (QYBIO). The protein pellet was dried out by SpeedVac. The pellet was subsequently dissolved with 8 M urea in 100 mM Tris-Cl (pH 8.5, Sigma). Tris(2-carboxyethyl)phosphine (TCEP, final concentration is 5 mM, Thermo Scientific) and iodoacetamide (final concentration is 10 mM, Sigma) were added to the solution and incubated at room temperature for 20 and 15 minutes for reduction and alkylation, respectively. The solution was digested with LysC at 1 : 100 (w/w) (Promega) for 4 h and then diluted four times and digested with trypsin at 1 : 50 (w/w) (Promega) for 16 h. The digested peptide mixtures were labelled with the TMT kit (6-plex, Thermo).
2.1.3. Liquid Chromatography Tandem Mass Spectrometry Analysis of Peptides
For multidimensional protein identification technology (MudPIT), total peptide mixtures were pressure loaded onto a biphasic-fused silica capillary column. The entire column setting (biphasic column-union-analytical column) was placed in line with an Agilent 1200 quaternary high-performance liquid chromatography pump (Palo Alto, CA) for MS analysis. The digested proteins were analyzed using a 12-step MudPIT separation method [21] as described previously.
2.1.4. Mass Spectrometry Condition
Data-dependent tandem mass spectrometry (MS/MS) analysis was performed with an Orbitrap mass spectrometer (Thermo Scientific, San Jose, CA). Peptides eluted from the liquid chromatography system were directly electrosprayed into the mass spectrometer with a distal 1.5 kV spray voltage. One acquisition cycle included one full-scan MS spectrum (m/z, 300–1800), followed by the top 20 MS/MS events.
2.1.5. Data Analysis
The acquired MS/MS data were analyzed against a Uniprot Homo sapiens database (database released on Sep. 24, 2015) using Integrated Proteomics Pipeline (IP2, http://integratedproteomics.com/). To estimate peptide probabilities and false discovery rates accurately, we used a decoy database containing the reversed sequences of all the proteins appended to the target database. Carbamidomethylation of cysteine was considered as a static modification.
2.2. Immunohistochemistry
2.2.1. Sample
The aortic arch tissue's paraffin sections of another 20 patients with AAD and 10 healthy donors were performed and provided by the Pathological Sample Library of Zhongshan Hospital of Fudan University. The standardized method to fix the tissues would be operated by professional staff as follows: approximately 1.0 × 1.0 × 0.2 cm3 of tissue would be extracted during surgery and fixed with formalin rapidly for 24 h; paraffin sections are performed and stored in the sample library. The basic clinical information is shown in Supplementary Table 3. The study was also approved by the ethics committee of Zhongshan Hospital of Fudan University.
2.2.2. Immunohistochemistry Method
The expression of integrin alpha 3 (ITGA-3) and integrin alpha 5 (ITGA-5) were compared stained with DAB staining and hematoxylin. Briefly, paraffin sections were dewaxed, and antigen was retrieved by citric acid buffer. The primary antibody of ITGA-3 and ITGA-5 is the rabbit antibody (Abcam, ab131055 and ab239400, respectively, 1 : 100). The corresponding secondary antibody is HRP-goat anti-rabbit IgG (H+L) (GXYbio, S8002, 1 : 100). The sections were reacted with the DAB kit (ZSGB-BIO, China, ZLI-9019). Eight separate views (magnification = original × 400) were randomly selected. The integrated option density (IOD) of ITGA-3 and ITGA-5 was chosen to determine the protein semiquantitative expression. Free ImageJ software (version 1.2; WS Rasband, National Institute of Health, Bethesda, MD) was used to conduct deconvolution and downstream analysis [22], and then, the Mann-Whitney test of the IOD was performed using SPSS software (version 25.0, IBM).
3. Results
3.1. Identification Differential Abundance Proteins (DAPs) of Ascending Aorta Tissues in Patients with AAD Using TMT Quantitative Proteomics
TMT-labelled MS analysis was performed on fresh aortic arch tissues of 5 AAD patients and one healthy donor. Principal component analysis (PCA) clustergram was created using OmicsBean software from proteins identified by quantitative MS. Except patient 1, other patients have consistent clustering as shown in PCA and heat map analysis (Figure 2). Patient 1 might fall in different subtypes of AAD compared with the other patients.
Figure 2.
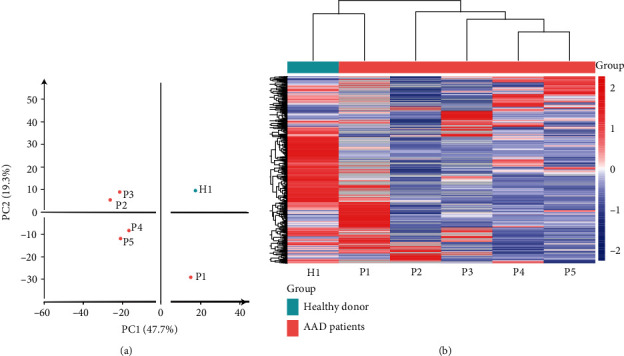
Principal component analysis (PCA) and heat map of proteome data. (a) Principal component analysis of the proteome data in a 2D graph of PC1 and PC2. (b) Expression heat map of the proteome data in the samples.
A total of 809 proteins were identified from individual unique peptides (Supplementary Table 2). Limited by the number of the healthy control, we defined the identified proteins as DAPs if there was a log2FC in excess of 2 or in less of -2.132 proteins changed significantly (32 upregulated and 100 downregulated) in AAD patients compared with the healthy donor (Tables 1 and 2).
Table 1.
Upregulated differential abundance proteins in AAD patients (n = 32).
| Accession | Expression of healthy donor | Mean expression of AAD patients (n = 5) | log2FC | Description |
|---|---|---|---|---|
| Q14315 | 324.67 | 7870.896 | 4.599 | Filamin-C |
| Q5U0D2 | 204 | 3628.784 | 4.153 | Transgelin |
| P37802 | 2044.82 | 28287.816 | 3.79 | Transgelin-2 |
| B0AZV6 | 471.5 | 5283.69 | 3.486 | cDNA, FLJ79546, highly similar to SH3 domain-binding glutamic acid-rich-like protein |
| J3KND3 | 180 | 1960.68 | 3.445 | Myosin light polypeptide 6 |
| A8KAH9 | 565 | 6078.1 | 3.427 | RAP1A, member of RAS oncogene family |
| A0A024QZQ2 | 267 | 2674.5 | 3.324 | Prosaposin (Variant Gaucher disease and variant metachromatic leukodystrophy), isoform CRA_b |
| A0A024RAB6 | 368.77 | 3658.2 | 3.31 | Heparan sulfate proteoglycan 2 (Perlecan), isoform CRA_b |
| P08294 | 718 | 6862.38 | 3.257 | Extracellular superoxide dismutase [Cu-Zn] |
| F2RM37 | 315.5 | 2933.168 | 3.217 | Coagulation factor IX |
| A0A024R321 | 236.44 | 2162.786 | 3.193 | Filamin-B, beta (actin binding protein 278), isoform CRA_a |
| B4DHX4 | 241.5 | 2181.672 | 3.175 | cDNA FLJ52902, highly similar to Rab GDP dissociation inhibitor alpha |
| A6NIZ1 | 565 | 5073.772 | 3.167 | Ras-related protein Rap-1b-like protein |
| A0A024QZX3 | 180 | 1546.584 | 3.103 | Serpin peptidase inhibitor, clade B (Ovalbumin), member 6, isoform CRA_a |
| Q53HQ0 | 270 | 2227.7 | 3.045 | Flotillin 1 variant (fragment) |
| A6NLG9 | 252.8 | 2077.26 | 3.039 | cDNA FLJ36740 fis, clone UTERU2013322, highly similar to Biglycan |
| A5YM53 | 229 | 1812.1875 | 2.984 | ITGAV protein |
| V9HWF6 | 287.5 | 2256.258 | 2.972 | Alpha 1-acid glycoprotein |
| B2RDY9 | 190 | 1426.9175 | 2.909 | Adenylyl cyclase-associated protein |
| B4DLV7 | 311.17 | 2185.602 | 2.812 | cDNA FLJ60299, highly similar to Rab GDP dissociation inhibitor beta |
| P01031 | 461 | 3067.166667 | 2.734 | Complement C5 |
| Q9NZM1 | 201 | 1334.328 | 2.731 | Myoferlin |
| P13645 | 870.5 | 5446.79 | 2.645 | Keratin, type I cytoskeletal 10 |
| P08779 | 1462.67 | 8870.308 | 2.6 | Keratin, type I cytoskeletal 16 |
| B1N7B8 | 201 | 1028.0625 | 2.355 | Cryocrystalglobulin CC1 kappa light chain variable region (fragment) |
| A0A024RBX9 | 256 | 1281.3 | 2.323 | Pyruvate dehydrogenase E1 component subunit alpha |
| Q7Z7J6 | 241.25 | 1205.772 | 2.321 | Actin alpha 1 skeletal muscle protein |
| B7Z6P1 | 266.05 | 1306.056 | 2.295 | cDNA FLJ53662, highly similar to actin, alpha skeletal muscle |
| A8K4W0 | 347 | 1656.5 | 2.255 | 40S ribosomal protein S3a |
| A0A024R821 | 451 | 1989.75 | 2.141 | Eukaryotic translation initiation factor 3 subunit B |
| P07357 | 947 | 4078 | 2.106 | Complement component C8 alpha chain |
| G3V4G1 | 274 | 1140 | 2.057 | Neuroguidin (fragment) |
Note: based on protein abundance. A protein was defined as DAPs if there was a log2FC in excess of 2. FC: fold change.
Table 2.
Downregulated DAPs in AAD patients (n = 100).
| Accession | Expression of healthy donor | Mean expression of AAD patients (n = 5) | log2FC | Description |
|---|---|---|---|---|
| H3BQZ7 | 2286.5 | 69.33333333 | -5.04344799 | HCG2044799 |
| Q6GMX6 | 24204.11 | 1024.248 | -4.56261507 | IGH@ protein |
| Q6MZQ6 | 21830.2 | 939.36 | -4.53850338 | Putative uncharacterized protein DKFZp686G11190 |
| Q6N089 | 19877.09 | 909.564 | -4.4497876 | Putative uncharacterized protein DKFZp686P15220 |
| V9HW68 | 19889.09 | 1004.376 | -4.3076059 | Epididymis luminal protein 214 |
| Q92626 | 2750 | 187.25 | -3.87639399 | Peroxidasin homolog |
| A0A024R971 | 5098 | 368.058 | -3.79192634 | Fibromodulin, isoform CRA_a |
| A0A087X2C0 | 5633 | 410.31 | -3.77911725 | Ig mu chain C region |
| A0A024R9G4 | 1679 | 122.6666667 | -3.77478706 | Family with sequence similarity 49, member B, isoform CRA_a |
| A0A0G2JPD4 | 6460.29 | 505.912 | -3.67464056 | Uncharacterized protein |
| B0YJ88 | 4307 | 350.696 | -3.61839044 | Radixin |
| Q96C32 | 9160.43 | 752.5633333 | -3.60553042 | Polyubiquitin-C |
| A8K3Q7 | 19376 | 1632.302 | -3.56929086 | Annexin |
| P43652 | 2496.5 | 211.875 | -3.55862163 | Afamin |
| A0A024R0S6 | 5116.29 | 460.624 | -3.47343655 | EH-domain containing 2, isoform CRA_a |
| Q9NZU5 | 5750 | 529.346 | -3.44127902 | LIM and cysteine-rich domains protein 1 |
| F2ZC06 | 3779.75 | 349.452 | -3.43512461 | Thyroid hormone receptor interacting protein 6 isoform 1 |
| P26006 | 4296 | 414.25 | -3.37442039 | Integrin alpha 3/beta 1 |
| A8MX94 | 5754.4 | 581.104 | -3.30779722 | Glutathione S-transferase P |
| B2R6V9 | 1398 | 142 | -3.29940153 | cDNA, FLJ93141, highly similar to Homo sapiens coagulation factor XIII, A1 polypeptide (F13A1), mRNA |
| P01023 | 3824.29 | 397.764 | -3.26520731 | Alpha 2-macroglobulin |
| O94832 | 1636 | 170.944 | -3.25857706 | Unconventional myosin-Id |
| B4DKT9 | 4013 | 422.1666667 | -3.24879658 | cDNA FLJ54052, highly similar to alpha 1 catenin (cadherin-associated protein) |
| D6RA82 | 5307.67 | 564.375 | -3.23335269 | Annexin |
| B4DQG5 | 2126.25 | 227.9175 | -3.22172763 | cDNA FLJ54122, highly similar to Cytosol aminopeptidase (EC 3.4.11.1) |
| P12235 | 1117 | 125.3333333 | -3.15578712 | ADP/ATP translocase 1 |
| A0A024QZV0 | 1431 | 160.625 | -3.15525531 | HCG1811539, isoform CRA_b |
| Q6UVK1 | 1875 | 210.564 | -3.15455989 | Chondroitin sulfate proteoglycan 4 |
| A0A0B4J1R6 | 1682.75 | 191.546 | -3.13505805 | Transketolase |
| B4DRV4 | 2956 | 340.5 | -3.11791957 | cDNA FLJ55667, highly similar to secreted protein acidic and rich in cysteine |
| A0A024RC65 | 4177 | 531.732 | -2.97369595 | HCG1991735, isoform CRA_a |
| A0A024RDE1 | 1252 | 161.95 | -2.95061419 | SPARC-like 1 (Mast9, hevin), isoform CRA_a |
| Q8TCD0 | 14216 | 1858.354 | -2.93541833 | Uncharacterized protein |
| A0A024RAC9 | 253 | 34 | -2.89553073 | Zinc finger, UBR1 type 1, isoform CRA_c |
| O76024 | 2314 | 313 | -2.8861543 | Wolframin |
| B4DQX8 | 3990 | 547.875 | -2.86447007 | cDNA FLJ51723, highly similar to DCC-interacting protein 13 alpha (fragment) |
| V9HWK1 | 2754 | 387.9425 | -2.82761382 | Triosephosphate isomerase |
| P49327 | 1231.5 | 174.842 | -2.81629294 | Fatty acid synthase |
| B4DNM8 | 360 | 51.75 | -2.79836614 | cDNA FLJ53395, highly similar to Prolyl 3-hydroxylase 1 (EC 1.14.11.7) |
| A0A087WZW8 | 14216 | 2052.316 | -2.7921908 | Protein IGKV3-11 |
| A0A087WUS7 | 2422 | 354.7 | -2.77152763 | Ig delta chain C region |
| B4E3A8 | 1457 | 216.3333333 | -2.75167299 | cDNA FLJ53963, highly similar to leukocyte elastase inhibitor |
| A8K3B6 | 406 | 60.5 | -2.74647268 | Nonspecific protein-tyrosine kinase |
| S6C4R6 | 12602.88 | 1884.586 | -2.74143392 | IgG L chain |
| A0A087WYL9 | 14216 | 2132.92 | -2.73661383 | Ig kappa chain C region |
| Q6GMX0 | 11199.11 | 1698.368 | -2.72116309 | Uncharacterized protein |
| Q6PJF2 | 9283.64 | 1452.93 | -2.67572538 | IGK@ protein |
| P27824 | 1292.5 | 204.5 | -2.65999153 | Calnexin |
| Q6P5S8 | 14216 | 2252.75 | -2.65775646 | IGK@ protein |
| A0A087X130 | 12702.62 | 2022.842 | -2.65067055 | Ig kappa chain C region |
| A0A087WWT3 | 646 | 104 | -2.63495064 | Serum albumin |
| V9HW34 | 9283.64 | 1502.036 | -2.62777119 | Epididymis luminal protein 213 |
| Q8NCL6 | 2879.25 | 479.72 | -2.58542857 | cDNA FLJ90170 fis, clone MAMMA1000370, highly similar to Ig alpha 1 chain C region |
| Q9NPP6 | 3076.09 | 515.486 | -2.57709256 | Immunoglobulin heavy chain variant (fragment) |
| Q96K68 | 2872.08 | 483.564 | -2.57031719 | cDNA FLJ14473 fis, clone MAMMA1001080, highly similar to Homo sapiens SNC73 protein (SNC73) mRNA |
| B4DEA3 | 218 | 37 | -2.55873096 | cDNA FLJ56531, highly similar to UV excision repair protein RAD23 homolog B |
| Q96CD0 | 228.5 | 41 | -2.47849835 | F-box/LRR-repeat protein 8 |
| V9HWF2 | 1684.5 | 306.8175 | -2.45686775 | Malate dehydrogenase |
| A8K4C8 | 5080 | 925.6666667 | -2.45626382 | 60S ribosomal protein L13 |
| A0A024RDY2 | 860 | 158.994 | -2.43536434 | Tumor protein, translationally controlled 1, isoform CRA_a |
| Q6MZV6 | 2675.38 | 500.17 | -2.41925339 | Putative uncharacterized protein DKFZp686L19235 |
| A0A024RB01 | 2564 | 484.4 | -2.40412549 | Integrin, alpha 5 (fibronectin receptor, alpha polypeptide), isoform CRA_b |
| A6NLN1 | 652 | 123.9175 | -2.39549202 | Polypyrimidine tract binding protein 1, isoform CRA_b |
| P07204 | 989 | 190.33 | -2.37746754 | Thrombomodulin |
| F6U211 | 253 | 49.46666667 | -2.35460879 | 40S ribosomal protein S10 |
| P63267 | 1432 | 283.6666667 | -2.33576296 | Actin, gamma-enteric smooth muscle |
| A0A0C4DFX3 | 829 | 164.6666667 | -2.33182356 | EMILIN-1 |
| A6NNI4 | 571 | 114.3333333 | -2.32024467 | Tetraspanin |
| A0A024RA21 | 843 | 170.8 | -2.30322466 | Secernin 1, isoform CRA_a |
| B2R5H0 | 1174 | 245.915 | -2.25520077 | Protein S100 |
| B4DPU3 | 7412 | 1556.5 | -2.2515573 | cDNA FLJ56548, highly similar to elongation factor 2 |
| Q6MZU6 | 6876.26 | 1445.532 | -2.25002355 | Putative uncharacterized protein DKFZp686C15213 |
| A0A024R1N1 | 1066 | 224.5 | -2.24742009 | Myosin, heavy polypeptide 9, nonmuscle, isoform CRA_a |
| A0A075B6N8 | 6872.24 | 1450.324 | -2.24440519 | Ig gamma-3 chain C region (fragment) |
| B7Z539 | 898 | 192.05 | -2.22523348 | cDNA FLJ56954, highly similar to interalpha trypsin inhibitor heavy chain H1 |
| A0A024R930 | 232 | 49.75 | -2.22135637 | Proteoglycan 4, isoform CRA_a |
| A8K9M5 | 1651.17 | 354.448 | -2.21984277 | cDNA FLJ77947, highly similar to human complement protein C8 beta subunit mRNA |
| A0A024R7Z5 | 412.5 | 89.2075 | -2.20915721 | Syndecan binding protein (Syntenin), isoform CRA_c |
| B4DDS8 | 846 | 184.5 | -2.19703685 | cDNA FLJ56686, moderately similar to FADD protein |
| A0A024R3W7 | 239 | 52.5 | -2.18662129 | Eukaryotic translation elongation factor 1 beta 2, isoform CRA_a |
| A0A087WUN8 | 371 | 82 | -2.17772337 | Syntaxin-binding protein 2 |
| B4DTX5 | 1412 | 314.816 | -2.16515932 | cDNA FLJ60072, highly similar to Homo sapiens sorbin and SH3 domain containing 1 (SORBS1), transcript variant 6, mRNA |
| Q9BVK6 | 267 | 59.75 | -2.15982912 | Transmembrane emp24 domain-containing protein 9 |
| Q9Y217 | 430 | 96.33333333 | -2.15822967 | Myotubularin-related protein 6 |
| Q8IWB1 | 194 | 43.5 | -2.15696935 | Inositol 1,4,5-trisphosphate receptor-interacting protein |
| A0A075B6G3 | 818.5 | 183.5766667 | -2.15659972 | Dystrophin |
| K7EQQ3 | 6367 | 1439.5 | -2.14504598 | Keratin, type I cytoskeletal 9 |
| B4E2F9 | 1999.32 | 455.736 | -2.13323916 | cDNA FLJ57038, highly similar to Filamin-A |
| C9JAK5 | 1520 | 346.7 | -2.13231158 | ADP-ribosylation factor 4 |
| B7Z9B7 | 1412 | 322.75 | -2.12925109 | cDNA FLJ54732, moderately similar to sorbin and SH3 domain-containing protein 1 |
| B2ZZ89 | 884 | 202.512 | -2.12603897 | Epididymis luminal protein 102 |
| A0M8W4 | 902 | 207.5 | -2.1200161 | Ubiquitin-conjugating enzyme E2 variant 2 |
| B0QZ18 | 3015 | 723.296 | -2.05949992 | Copine-1 |
| A0A024RAX0 | 676 | 162.25 | -2.05880477 | Matrix Gla protein |
| B0QY01 | 225 | 54.125 | -2.05555798 | Target of Myb protein 1 (fragment) |
| A0A087WU08 | 2574 | 619.875 | -2.05396283 | Haptoglobin |
| A0A024R6P0 | 2748 | 666.416 | -2.04388706 | Serpin peptidase inhibitor, clade A (alpha 1 antiproteinase, antitrypsin), member 3, isoform CRA_c |
| A0A024RD41 | 3012 | 731.6666667 | -2.04146333 | RAB23, member RAS oncogene family, isoform CRA_a |
| A0A024R1Z6 | 242.5 | 59 | -2.03919789 | Vesicle amine transport protein 1 homolog (T. californica), isoform CRA_a |
| Q59EQ1 | 478 | 119.5 | -2 | Cadherin 11, type 2 isoform 1 preproprotein variant (fragment) |
Note: based on protein abundance. A protein was defined as DAPs if there was a log2FC in less of -2.
To explain the cellular localization and associated functions of DAPs, gene Ontology analysis (GO analysis) was performed by Blast2GO software (version 4) to provide further understanding of these results by biological processes, cell components, and molecular function (Figure 3). According to the GO results, most DAPs were located in the extracellular region part and participated in several functions, such as cell junction, metabolic process, and developmental process, indicating that proteins involved in extracellular activities were important in AAD tissues. Kyoto Encyclopedia of Genes and Genomes (KEGG) pathway enrichment analysis was used to classify the functional annotations of DAPs. Interestingly, among the 30 significantly enriched pathways, most of downregulated DAPs (n = 16/51) were found in the PI3K-AKT signaling pathway (Figure 4). Protein-protein interaction (PPI) analysis further suggested that ITGA-3 and ITGA-5 were important nodes in the PI3K-AKT signaling pathway (Figure 5).
Figure 3.
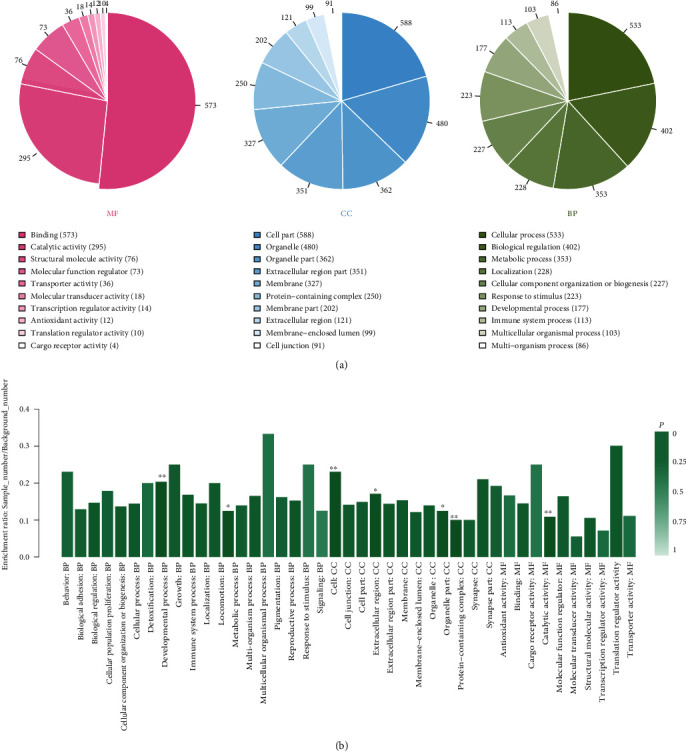
The Gene Ontology (GO) enrichment of 132 differential abundance proteins (DAPs). (a) Sorted by descending order of the number of protein associated with the listed GO ID. (b) Sorted by descending order of P value for the GO enrichment terms. Because of the limited number of patients, we considered DAPs as meaningful only as strong differently expressed (∣log2FC | >2).
Figure 4.
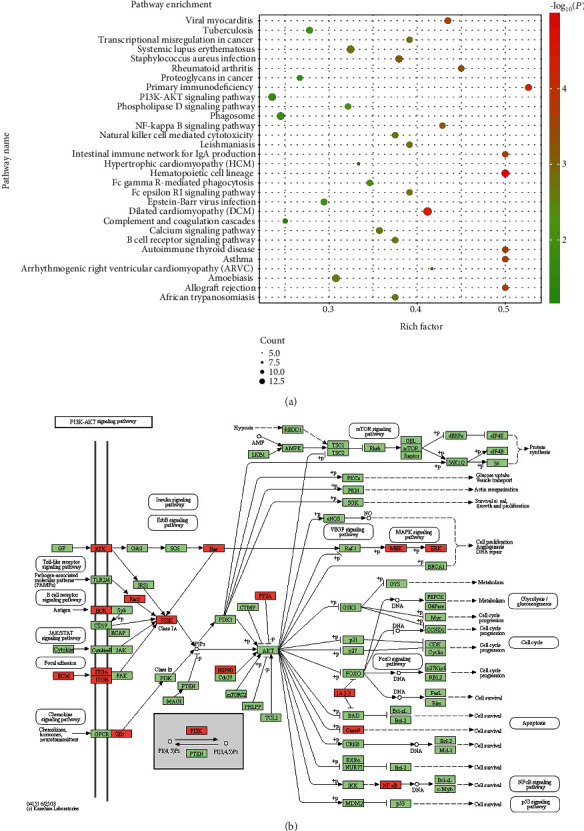
Kyoto Encyclopedia of Genes and Genomes (KEGG) pathway enrichment analysis for 132 DAPs between health donor vs. patients. (a) Top 30 significantly enriched pathways were shown in the senior bubble chart. The rich factor is the ratio of DAP numbers annotated in this pathway term to all gene numbers annotated in this pathway term (P < 0.01). (b) Most of downregulated DAPs (n = 16/51) were found in the PI3K-AKT signaling pathway.
Figure 5.

The protein-protein interaction networks is analyzed by string software. Different line colours represent the types of evidence used in predicting the associations: gene fusion (red), neighborhood (green), cooccurrence across genomes (blue), coexpression (black), experimental (purple), association in curated databases (light blue), or comentioned in PubMed abstracts (yellow).
3.2. Verification of the Levels of ITGA-3 and ITGA-5 by Immunohistochemistry
The levels of ITGA-3 and ITGA-5 in pathological sections of 20 AAD patients and 10 healthy donors were further assessed by immunohistochemistry (Figure 6(a)). The basic information of them is shown in Supplementary Table 3. The IOD of ITGA-3 and ITGA-5 in AAD patients was significantly lower compared with healthy donors (P < 0.001) (Figure 6(b)).
Figure 6.
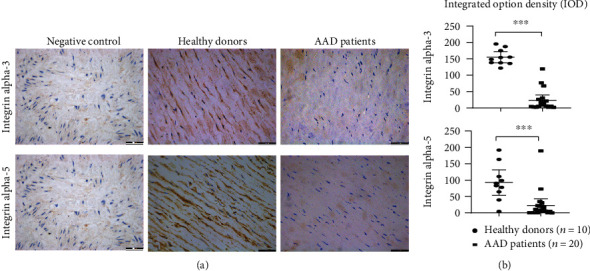
The biomarkers (ITGA-3, ITGA-5) verified by immunohistochemistry (IHC). (a) The black arrows present positive signals of ITGA-3 and ITGA-5 staining by DAB in healthy donors. Negative control: the section was stained with secondary antibodies only. Scale bars = 200 μm. (b) The IODs of ITGA-3 and ITGA-5 in AAD patients were significantly lower compared with healthy donors (∗∗∗P < 0.001).
4. Discussion
AAD of the ascending aorta is a life-threatening cardiovascular emergency with a mortality rate of 1% to 2% per hour early after the symptom onset [1, 3]. With increasing incidence of hypertension, the morbidity of AAD has increased annually in recent years [23]. However, the detailed molecular mechanisms of this disease have yet to be clarified. Finding out important proteins in dissected aorta tissues of patients with AAD can help to elucidate the pathogenesis of this disease.
In this study, the quantitative proteomics showed that 100 proteins were significantly downregulated while 32 upregulated in dissected aorta tissues of AAD patients compared with those in ascending aorta tissue of the healthy donor. Bioinformatic analysis revealed that most DAPs were primarily located in the extracellular region part and their biological functions mainly focused on cell junction, metabolic process, and developmental process. Interestingly, the PI3K-AKT signaling pathway was selected by KEGG analysis, which has been reported involved in a series of biological processes by transducing stimulatory extracellular signals to the nucleus, including proliferation, apoptosis, angiogenesis, and tumor growth [24, 25]. Liu and his colleagues demonstrated that the PI3K/AKT signaling transduction pathway was involved in rat vascular smooth muscle cell proliferation induced by apelin-13 [18]. Other studies also have shown that the 0PI3K/AKT signaling pathway contributes to VSMC dysfunction, vasoconstriction, and vascular remodeling [19, 26]. However, few studies reported the molecule or protein in the PI3K/AKT signaling pathway contributing to the VSMC dysfunction in human aorta tissues.
In this study, we found that integrins, especially ITGA-3 and ITGA-5, were significantly downregulated in dissected aorta tissues of AAD patients. As expected, ITGA-3 and ITGA-5 showed a strong downexpression in the cytomembrane and cytoplasm. As a kind of cell surface adhesion molecule with signal transduction function, integrins are key transmembrane protein upstream in the P13K-AKT signaling pathway. By connecting the extracellular matrix with actin cytoskeleton, it can maintain cell morphology and mediate cell adhesion, proliferation, differentiation, and other physiological processes according to the types of extracellular ligands. Downregulation of integrin may affect the stability of cytoskeleton, thus ultimately affecting the physiological function of cells [27, 28]. Taken together, downregulation of ITGA-3 and ITGA-5 might be involved in the pathogenesis of AAD by reducing the adhesion between cell and extracellular matrix and modulating the focal adhesion pathway.
The proteomic approach provides an exciting platform for determining the pathogenesis of aortic dissection. As an initial step, our study identified the downregulation of ITGA-3 and ITGA-5, both of which may participate in AAD pathogenesis via the focal adhesion pathway. To make up for the control sample shortage in the proteomic study, we obtained the pathological sections of another 10 healthy donors and 20 AAD patients from the Pathological Sample Library of Zhongshan Hospital to further make our results credible in the following validation test. The performance of the PI3K-AKT signaling pathway needs to activate downstream proteins, which provides insights into the specific molecule or signaling pathway contributing to the pathogenesis of aortic dissection. It needs to be further explored in animals and humans.
5. Conclusions
The aortic arch tissues of patients with AAD show a large number of DAPs, the molecular functions of which were primarily cell junction. In particular, ITGA-3 and ITGA-5 were highly differentially expressed in these tissues. Downregulation of the two proteins may contribute to the progression of AAD, which may serve as a diagnostic biomarker and a novel therapeutic target in AAD.
Acknowledgments
We thank the patients and staff of Zhongshan Hospital, Fudan University. We gratefully acknowledge the support and cooperation of Shanghai key laboratory of organ transplantation. This study was supported by the Key Project of Shanghai Municipal Health Bureau (2016ZB0202) and the Scientific Research Project of Shanghai Municipal Health Bureau (201940163).
Abbreviations
- AAD:
Acute aortic dissection
- DAPs:
Differential abundance proteins
- TMT:
Tandem mass tag
- ITGA-3:
Integrin alpha 3
- ITGA-5:
Integrin alpha 5
- MMPs:
Matrix metalloproteinase
- VSMC:
Vascular smooth muscle cell
- MS:
Mass spectrometry
- CTA:
Computed tomography angiography
- TCEP:
Tris(2-carboxyethyl)phosphine
- MudPIT:
Multidimensional protein identification technology
- IOD:
Integrated option density
- PCA:
Principal component analysis
- GO analysis:
Gene Ontology analysis
- KEGG:
Kyoto Encyclopedia of Genes and Genomes
- PPI analysis:
Protein-protein interaction analysis.
Contributor Information
Chenling Yao, Email: yao.chenling@zs-hospital.sh.cn.
Guorong Gu, Email: gu.guorong@zs-hospital.sh.cn.
Data Availability
The datasets used and/or analyzed during the current study are available from the corresponding author on reasonable request.
Ethical Approval
The study was approved by the ethics committee of Zhongshan Hospital, Fudan University (Shanghai, China) (record number 2010-12).
Consent
Informed consent was obtained from patients or their legal surrogates before enrolment.
Conflicts of Interest
The authors declare that there is no conflict of interest regarding the publication of this article.
Authors' Contributions
GRG and CLY conceived, designed, and coordinated the study. LYX, YX, and YLY drafted this manuscript. ZJS and CYT revised it. GRG, CLY, and CYT were involved in the collection of tissue samples of AAD patients and healthy donors. HJW, PW, and Catherine CL Wong carried out the TMT proteomic analysis and immunohistochemistry. YLY and DWS were responsible for data analysis. All authors read, approved, and contributed to the final manuscript. Lingyu Xing, Yuan Xue, and Yilin Yang contributed equally to this work as co-first authors.
Supplementary Materials
Supplementary Table 1 Basic data between AAD patients and healthy control in the TMT method. Note: a“0” is no; “1” is yes. bAccording to the more popular Stanford system, dissections involving the ascending aorta are classified as type A, whereas those involving only the descending aorta are classified as type B.
Supplementary Table 2 List of expreesion of all identified proteins between the two groups in the TMT method.
Supplementary Table 3 Basic data between AAD patients and healthy controls in immunohistochemistry. Note: a“0” is no; “1” is yes. bAccording to the more popular Stanford system, dissections involving the ascending aorta are classified as type A, whereas those involving only the descending aorta are classified as type B.
References
- 1.Nienaber C. A., Eagle K. A. Aortic dissection: new frontiers in diagnosis and management. Circulation. 2003;108(5):628–635. doi: 10.1161/01.CIR.0000087009.16755.E4. [DOI] [PubMed] [Google Scholar]
- 2.Mészáros I., Mórocz J., Szlávi J., et al. Epidemiology and clinicopathology of aortic dissection. Chest. 2000;117(5):1271–1278. doi: 10.1378/chest.117.5.1271. [DOI] [PubMed] [Google Scholar]
- 3.Juang D., Braverman A. C., Eagle K. Aortic dissection. Circulation. 2008;118(14):e507–e510. doi: 10.1161/circulationaha.108.799908. [DOI] [PubMed] [Google Scholar]
- 4.Elsayed R. S., Cohen R. G., Fleischman F., Bowdish M. E. Acute type A aortic dissection. Cardiology Clinics. 2017;35(3):331–345. doi: 10.1016/j.ccl.2017.03.004. [DOI] [PubMed] [Google Scholar]
- 5.He R., Guo D. C., Estrera A. L., et al. Characterization of the inflammatory and apoptotic cells in the aortas of patients with ascending thoracic aortic aneurysms and dissections. The Journal of Thoracic and Cardiovascular Surgery. 2006;131(3):671–678.e2. doi: 10.1016/j.jtcvs.2005.09.018. [DOI] [PubMed] [Google Scholar]
- 6.Branchetti E., Poggio P., Sainger R., et al. Oxidative stress modulates vascular smooth muscle cell phenotype via CTGF in thoracic aortic aneurysm. Cardiovascular Research. 2013;100(2):316–324. doi: 10.1093/cvr/cvt205. [DOI] [PMC free article] [PubMed] [Google Scholar]
- 7.Del Porto F., di Gioia C., Tritapepe L., et al. The multitasking role of macrophages in Stanford type A acute aortic dissection. Cardiology. 2014;127(2):123–129. doi: 10.1159/000355253. [DOI] [PubMed] [Google Scholar]
- 8.Ikeda Y. Aortic aneurysm: etiopathogenesis and clinicopathologic correlations. Vascular Diseases. 2016;9(2):73–79. doi: 10.3400/avd.ra.16-00018. [DOI] [PMC free article] [PubMed] [Google Scholar]
- 9.Maguire E. M., Pearce S. W. A., Xiao R., Oo A. Y., Xiao Q. Matrix metalloproteinase in abdominal aortic aneurysm and aortic dissection. Pharmaceuticals. 2019;12(3):p. 118. doi: 10.3390/ph12030118. [DOI] [PMC free article] [PubMed] [Google Scholar]
- 10.Rabkin S. W. The role matrix metalloproteinases in the production of aortic aneurysm. Progress in Molecular Biology and Translational Science. 2017;147:239–265. doi: 10.1016/bs.pmbts.2017.02.002. [DOI] [PubMed] [Google Scholar]
- 11.Zhang X., Wu D., Choi J. C., et al. Matrix metalloproteinase levels in chronic thoracic aortic dissection. Journal of Surgical Research. 2014;189(2):348–358. doi: 10.1016/j.jss.2014.03.027. [DOI] [PMC free article] [PubMed] [Google Scholar]
- 12.Abdulrahman N., Jaspard-Vinassa B., Fliegel L., et al. Na+/H+ exchanger isoform 1-induced osteopontin expression facilitates cardiac hypertrophy through p 90 ribosomal S6 kinase. Physiological Genomics. 2018;50(5):332–342. doi: 10.1152/physiolgenomics.00133.2017. [DOI] [PubMed] [Google Scholar]
- 13.Yue Y., Ma K., Li Z., Wang Z. Angiotensin II type 1 receptor-associated protein regulates carotid intimal hyperplasia through controlling apoptosis of vascular smooth muscle cells. Biochemical and Biophysical Research Communications. 2018;495(2):2030–2037. doi: 10.1016/j.bbrc.2017.12.059. [DOI] [PubMed] [Google Scholar]
- 14.Rabkin S. W. Differential expression of MMP-2, MMP-9 and TIMP proteins in thoracic aortic aneurysm - comparison with and without bicuspid aortic valve: a meta-analysis. Vasa. 2014;43(6):433–442. doi: 10.1024/0301-1526/a000390. [DOI] [PubMed] [Google Scholar]
- 15.Gillis E., van Laer L., Loeys B. L. Genetics of thoracic aortic aneurysm: at the crossroad of transforming growth factor-β signaling and vascular smooth muscle cell contractility. Circulation Research. 2013;113(3):327–340. doi: 10.1161/CIRCRESAHA.113.300675. [DOI] [PubMed] [Google Scholar]
- 16.Zhu S.-B., Zhu J., Zhou Z.-Z., Xi E.-P., Wang R.-P., Zhang Y. TGF-β1 induces human aortic vascular smooth muscle cell phenotype switch through PI3K/AKT/ID2 signaling. American Journal of Translational Research. 2016;7(12):2764–2774. [PMC free article] [PubMed] [Google Scholar]
- 17.Durdu S., Deniz G. C., Balci D., et al. Apoptotic vascular smooth muscle cell depletion via BCL2 family of proteins in human ascending aortic aneurysm and dissection. Cardiovascular Therapeutics. 2012;30(6):316. doi: 10.1111/1755-5922.12007. [DOI] [PubMed] [Google Scholar]
- 18.Liu C., Su T., Li F., et al. PI3K/Akt signaling transduction pathway is involved in rat vascular smooth muscle cell proliferation induced by apelin-13. Acta Biochimica et Biophysica Sinica. 2010;42(6):396–402. doi: 10.1093/abbs/gmq035. [DOI] [PubMed] [Google Scholar]
- 19.Morello F., Perino A., Hirsch E. Phosphoinositide 3-kinase signalling in the vascular system. Cardiovascular Research. 2008;82(2):261–271. doi: 10.1093/cvr/cvn325. [DOI] [PubMed] [Google Scholar]
- 20.Nies M. K., Ivy D. D., Everett A. D. The untapped potential of proteomic analysis in pediatric pulmonary hypertension. PROTEOMICS - Clinical Applications. 2014;8(11-12):862–874. doi: 10.1002/prca.201400067. [DOI] [PubMed] [Google Scholar]
- 21.Washburn M. P., Wolters D., Yates J. R., III Large-scale analysis of the yeast proteome by multidimensional protein identification technology. Nature Biotechnology. 2001;19(3):242–247. doi: 10.1038/85686. [DOI] [PubMed] [Google Scholar]
- 22.Crowe A., Yue W. Semi-quantitative determination of protein expression using immunohistochemistry staining and analysis: an integrated protocol. Bio-Protocol. 2019;9(24, article e3465) doi: 10.21769/bioprotoc.3465. [DOI] [PMC free article] [PubMed] [Google Scholar]
- 23.Howard D. P., Banerjee A., Fairhead J. F., et al. Population-based study of incidence and outcome of acute aortic dissection and premorbid risk factor control: 10-year results from the Oxford Vascular Study. Circulation. 2013;127(20):2031–2037. doi: 10.1161/CIRCULATIONAHA.112.000483. [DOI] [PMC free article] [PubMed] [Google Scholar]
- 24.Engelman J. A., Luo J., Cantley L. C. The evolution of phosphatidylinositol 3-kinases as regulators of growth and metabolism. Nature Reviews Genetics. 2006;7(8):606–619. doi: 10.1038/nrg1879. [DOI] [PubMed] [Google Scholar]
- 25.Bellacosa A., Kumar C. C., Cristofano A. D., Testa J. R. Activation of AKT kinases in cancer: implications for therapeutic targeting. Advances in Cancer Research. 2005;94:29–86. doi: 10.1016/S0065-230X(05)94002-5. [DOI] [PubMed] [Google Scholar]
- 26.Alexander M. R., Owens G. K. Epigenetic control of smooth muscle cell differentiation and phenotypic switching in vascular development and disease. Annual Review of Physiology. 2012;74(1):13–40. doi: 10.1146/annurev-physiol-012110-142315. [DOI] [PubMed] [Google Scholar]
- 27.Martinez-Lemus L. A., Wu X., Wilson E., et al. Integrins as unique receptors for vascular control. Journal of Vascular Research. 2003;40(3):211–233. doi: 10.1159/000071886. [DOI] [PubMed] [Google Scholar]
- 28.Plow E. F., Meller J., Byzova T. V. Integrin function in vascular biology: a view from 2013. Current Opinion in Hematology. 2014;21(3):241–247. doi: 10.1097/MOH.0000000000000042. [DOI] [PMC free article] [PubMed] [Google Scholar]
Associated Data
This section collects any data citations, data availability statements, or supplementary materials included in this article.
Supplementary Materials
Supplementary Table 1 Basic data between AAD patients and healthy control in the TMT method. Note: a“0” is no; “1” is yes. bAccording to the more popular Stanford system, dissections involving the ascending aorta are classified as type A, whereas those involving only the descending aorta are classified as type B.
Supplementary Table 2 List of expreesion of all identified proteins between the two groups in the TMT method.
Supplementary Table 3 Basic data between AAD patients and healthy controls in immunohistochemistry. Note: a“0” is no; “1” is yes. bAccording to the more popular Stanford system, dissections involving the ascending aorta are classified as type A, whereas those involving only the descending aorta are classified as type B.
Data Availability Statement
The datasets used and/or analyzed during the current study are available from the corresponding author on reasonable request.