In intestinal epithelial cells (IECs), DDX5 promotes the expression of immune response genes and oncogenes posttranscriptionally and is a novel therapeutic target for treating colitis and intestinal cancers.
Abstract
Tumorigenesis in different segments of the intestinal tract involves tissue-specific oncogenic drivers. In the colon, complement component 3 (C3) activation is a major contributor to inflammation and malignancies. By contrast, tumorigenesis in the small intestine involves fatty acid–binding protein 1 (FABP1). However, little is known of the upstream mechanisms driving their expressions in different segments of the intestinal tract. Here, we report that the RNA-binding protein DDX5 binds to the mRNA transcripts of C3 and Fabp1 to augment their expressions posttranscriptionally. Knocking out DDX5 in epithelial cells protected mice from intestinal tumorigenesis and dextran sodium sulfate (DSS)–induced colitis. Identification of DDX5 as a common upstream regulator of tissue-specific oncogenic molecules provides an excellent therapeutic target for intestinal diseases.
Introduction
Tissue-specific oncogenic molecules drive tumorigenesis in different segments of the intestinal tract. In the colon, complement component C3 protein induces the expression of pro-inflammatory cytokines, such as IL-1β and IL-17 (1, 2, 3). Ablation of C3 genetically protects against colitis and tumorigenesis in mouse models (4, 5, 6, 7). In the small intestine, fatty acid–binding protein 1 (FABP1) is critical for intestinal absorption of dietary long-chain fatty acids (8,9). Ablation of FABP1 genetically protects against tumorigenesis in the small intestine (10).
Regulations of C3 and FABP1 expression at the transcriptional level are described in previous reports. C3 transcription is controlled by the twist basic helix–loop–helix transcription factor 1 (TWIST1), CCAAT/enhancer-binding protein β (C/EBPβ), nuclear receptors farnesoid X receptor, and peroxisome proliferator-activated receptor α in response to stimulation from pro-inflammatory cytokines, such as TNFα, IFNγ, and IL1β (11, 12, 13, 14, 15, 16, 17). Fabp1 transcription is controlled by GATA-binding protein 4 (GATA4), C/EBP, peroxisome proliferator-activated receptor α, pancreatic and duodenal homeobox 1 (PDX1), and hypoxia-inducible factor (HIF1α) (18, 19, 20, 21, 22). However, little is known about how C3 and FABP1 expressions are regulated posttranscriptionally in intestinal epithelial cells (IECs).
Posttranscriptional regulation of gene products can be orchestrated, in part, by RNA-binding proteins (23). One member of the DEAD-box containing RNA-binding protein family, DDX5, is abundantly expressed in the intestinal epithelium (24). Mutation and overexpression of DDX5 are found in human cancers, and its overexpression predicts advanced clinical stage and poor survival in colorectal cancer (CRC) patients (25, 26, 27). Knockdown of DDX5 inhibited the proliferation of cancer cells in vitro and the growth of xenografts in immunodeficient hosts (28, 29).
Mechanistically, DDX proteins have two major modes of action. First, they can directly bind to specific RNA substrates, use ATP hydrolysis energy to unwind RNA duplexes, facilitate RNA annealing, and/or organize RNA–protein complex assembly (30, 31, 32, 33). Second, DDXs can partner with transcription factors to modulate gene transcription (24, 30, 34, 35, 36, 37, 38, 39, 40). In human cancer cell lines, DDX5 interacts with β-catenin protein and the long non-coding RNA NEAT1 to promote oncogene expression (41, 42). However, we know little about how the RNA-binding properties of DDX5 contribute to shaping the epithelial RNA regulome during homeostasis and tumorigenesis in vivo.
Here, we revealed that DDX5 binds to C3 and Fabp1 mRNA and promotes their expressions in primary IECs from the colon and small intestine, respectively. Loss of DDX5 expression in IECs protects against colonic and small intestine tumorigenesis in vivo. Identification of DDX5 as a common upstream regulator of tissue-specific oncogenic molecules provides an excellent therapeutic target for treating intestinal cancers.
Results
DDX5 regulates the epithelial immune response program and contributes to inflammation in the colon
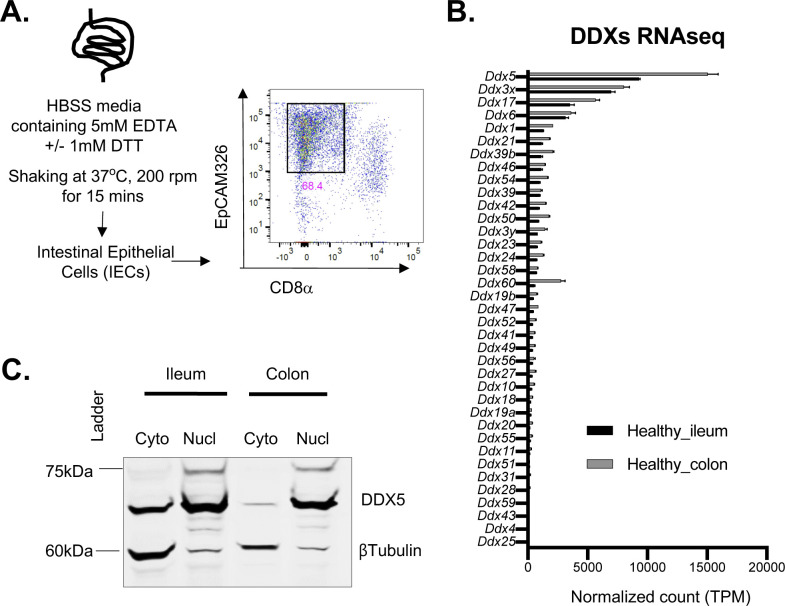
In the IECs isolated from the colon and small intestine of adult wild-type (WT) mice, mRNAs encoding 35 RNA-binding DEAD-box containing proteins (DDXs) were found at various levels (Fig S1A and B and Table S1). Among these, Ddx5 was the most abundant transcript (Fig 1A). Western blot analyses confirmed that DDX5 proteins were present throughout the intestinal tract (Fig 1B). In the colon, immunohistochemistry (IHC) and nuclear-cytoplasmic fraction revealed that DDX5 proteins predominantly localized to the nucleus of IECs (Figs 1C and S1C). Therefore, we hypothesize that DDX5 may bind to target colonic IEC RNAs in the nucleus and regulate their expressions posttranscriptionally.
Figure S1. Expression of DDXs in intestinal epithelial cells (IECs).
(A) Workflow for harvesting IECs from the intestine. Flow analyses confirmed EpCAM (CD326)-expressing IECs were enriched following EDTA fractionation of the small intestine. Gated on live singlet cells. (B) RNA expression of DDXs in ileal and colonic IECs. RNAseq was performed on ileal and colonic IECs from two independent WT mice. Data shown are normalized read count means ± SD. (C) Representative Western blot of WTIEC lysates showing that DDX5 was present in the nucleus and cytoplasm. Blots were also probed with βTubulin to confirm proper nuclear and cytoplasmic fractionation.
Figure 1. DDX5 regulates colonic epithelial immune response program and contributes to colitis.
(A) Heat map of average normalized RNAseq read counts of the 10 highest expressed members of the DDX family in the ileum and colon of steady-state WT mice (n = 2). (B) Representative Western blots showing DDX5 and β-tubulin protein expression in intestinal epithelial cells (IECs) from different sections of the intestine in WT mice. Experiments were repeated three times using independent biological samples with similar results. (C) Representative images from immunohistochemistry analysis of DDX5 in the colon of WT mice. Enlarged image is shown on the right. Scale bar represents 50 μm. (D) Scatterplot of log2 (fold changes: DDX5ΔIEC over WTIEC) and −log10(P-values) of colonic IEC transcripts. RNAseq was performed on two independent pairs of cohoused DDX5ΔIEC over WTIEC littermates. Black dot: DDX5-dependent transcripts defined as log2 (fold changes: DDX5ΔIEC over WTIEC) ≥0.5 or ≤−0.5 and P-value < 0.05 (DESeq). C3 is indicated in blue. (E) Left: Gene set enrichment analysis of immune response activation (M14047) in DDX5-deficient and DDX5-expressing colonic IECs from steady-state mice. NES, normalized enrichment score; NOM P, normalized P-value. Right: Ranked top 10 DDX5-regulated genes involved in immune response activation. (F) Weight loss of WTIEC (n = 7) and DDX5ΔIEC (n = 9) mice challenged with 2% DSS in their drinking water. This experiment was repeated twice with similar results. Error bars represent SD. ***P < 0.001 (multiple t test). (G) Colonic length in mice from (F) on day 15 post-DSS challenge. Each dot represents one mouse. Results are means ± SD. *P < 0.05 (t test).
Source data are available for this figure.
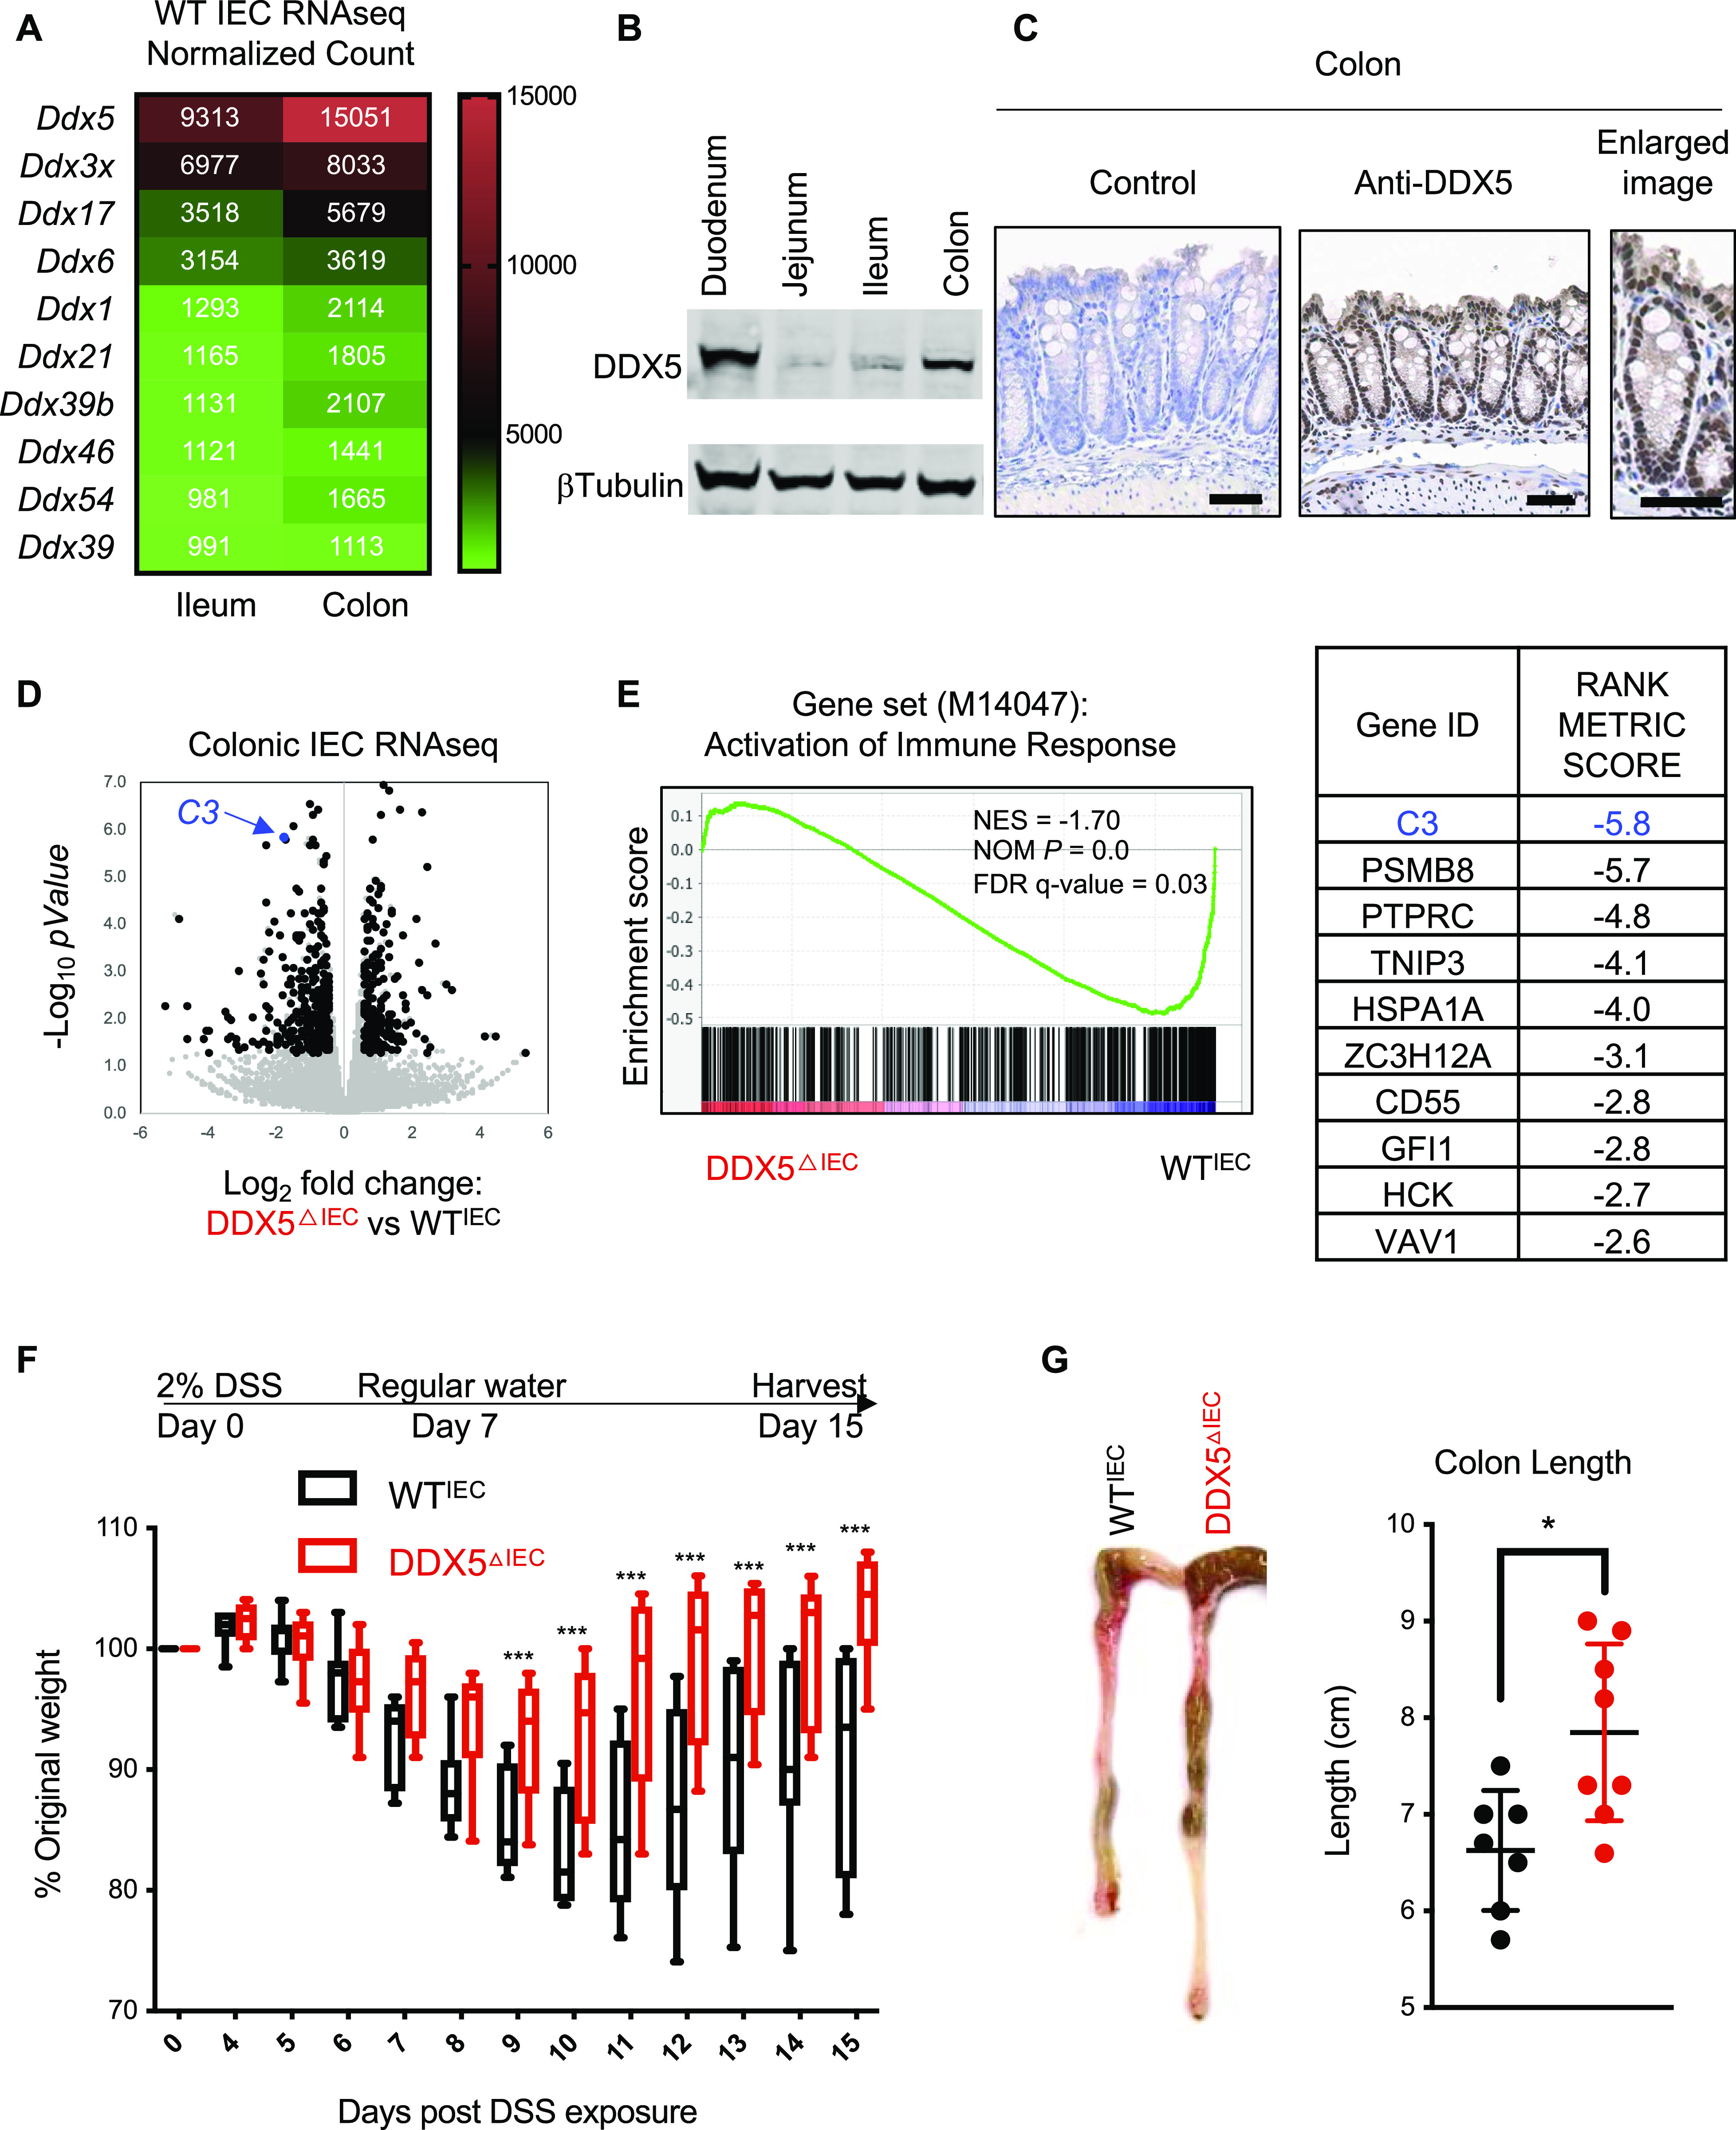
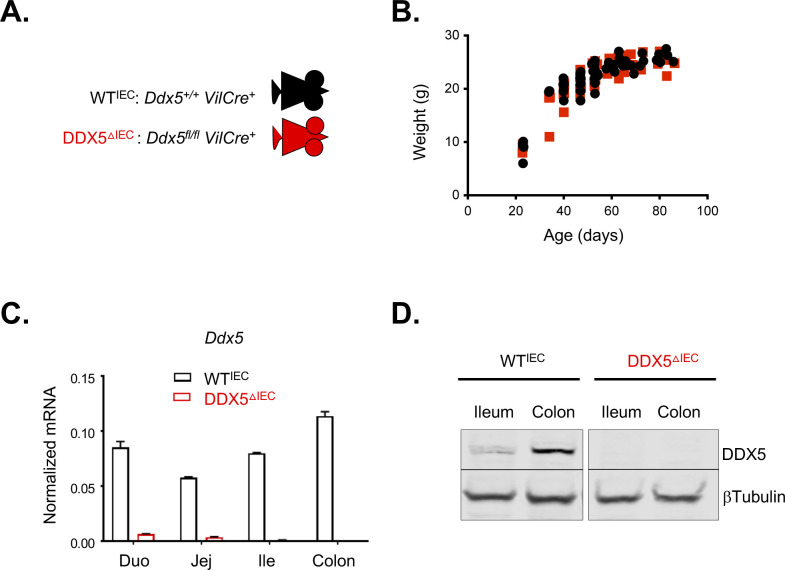
Hence, we generated an epithelial DDX5 knockout mice (DDX5ΔIEC) using the Villin1 (Vil1)–Cre recombination system (Fig S2A). WTIEC and DDX5ΔIEC littermates were born in Mendelian ratios and had similar growth curves (Fig S2B). IECs isolated from different segments of the intestinal tract confirmed efficient knockout of DDX5 at the RNA and protein levels throughout the small intestine and colon (Fig S2C and D). Comparison of the RNA profile of colonic IECs isolated from steady-state WTIEC and DDX5ΔIEC mice revealed that knocking out DDX5 resulted in a down-regulation of 306 and up-regulation of 174 colonic IEC transcripts (Fig 1D and Table S2). DDX5-dependent RNA programs of the colonic IECs were enriched with genes involved in immune response activation (Fig 1E and Table S3).
Figure S2. Generation of the pan-epithelial DDX5-knockout mouse line.
(A) Genotypes of WTIEC and DDX5ΔIEC littermates. (B) Growth curves of WTIEC and DDX5ΔIEC littermates. (C) Representative Ddx5 expression, as detected by qRT-PCR, in intestinal epithelial cells (IECs) from WTIEC and DDX5ΔIEC littermates showing effective depletion of the target mRNA in cells from DDX5ΔIEC animals. Data shown are means ± SD of two technical repeats. Experiments were repeated three times using independent biological samples with similar results. (D) Representative Western blots showing the depletion of DDX5 protein in IECs from DDX5ΔIEC mice. Experiments were repeated three times using independent biological samples with similar results.
Table S3 Gene Ontology pathway analysis of DDX5-dependent genes in the colon and ileum. (33.7KB, xlsx)
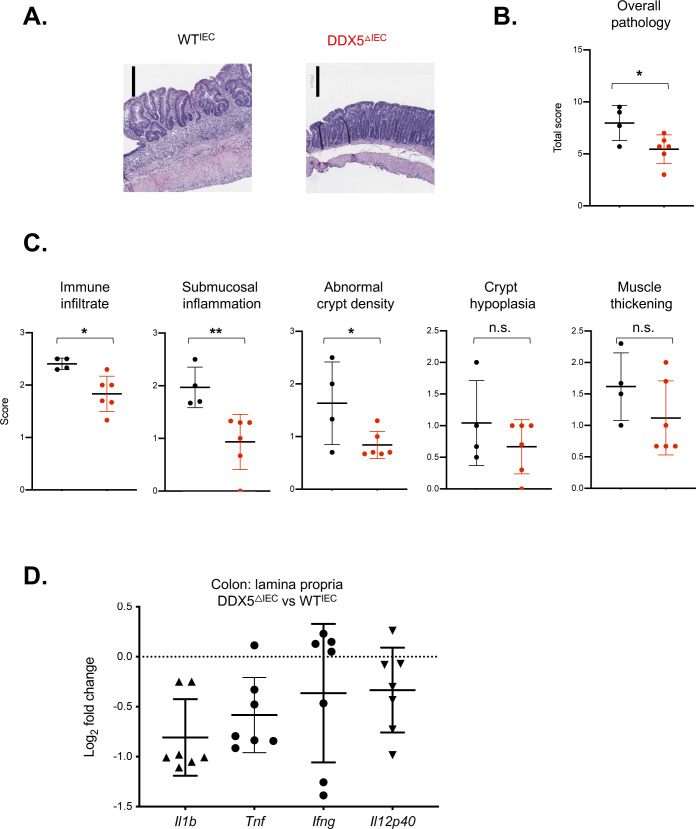
Therefore, we hypothesized that DDX5ΔIEC mice with reduced immune activation in the colon may be protected against intestinal inflammation during colitis. To test this possibility, we challenged WT and DDX5ΔIEC mice with 2% DSS in drinking water. By day 9, DDX5ΔIEC animals experienced less weight loss and recovered more quickly than their WT cohoused littermates (Fig 1F). Colons from DSS-challenged DDX5ΔIEC animals were longer (Fig 1G) and showed milder histological pathology, particularly in matrices scoring for immune infiltrate, submucosal inflammation, and abnormal crypt density (Fig S3A–C). Furthermore, lamina propria cells from DDX5ΔIEC mice expressed less transcripts of inflammatory cytokines, including Il1b and Tnf (Fig S3D).
Figure S3. DSS histology and inflammatory gene expression.
(A) Representative images of H&E-stained sections of colons from WT and DDX5ΔIEC mice on day 15 post-DSS treatment. Scale bar represents 250 μm. (B) Overall histology scores of distal colons from WT (n = 4) and DDX5ΔIEC (n = 6) mice 15 d post-DSS treatment. (C) Distal colons from WT (n = 4) and DDX5ΔIEC (n = 6) mice challenged with 2% DSS scored by immune infiltrate, submucosal inflammation, crypt density, crypt hyperplasia, and muscle thickening. (D) RNAs from the colonic lamina propria mononuclear cells from mice treated with 2% DSS in their drinking water for 7 d were evaluated for the expression of inflammatory genes. Each dot represents one mouse.
In humans, colonic tissues from ulcerative colitis (UC) patients have higher DDX5 expression than healthy controls (Fig S4A) (42). Moreover, reduction of DDX5 positively correlates with UC patients responding favorably to anti-TNF therapy (Fig S4B) (43). Together, these results indicate a conserved and unappreciated role of epithelial DDX5 in intestinal inflammation in vivo.
Figure S4. DDX5 expression is linked to human IBD.
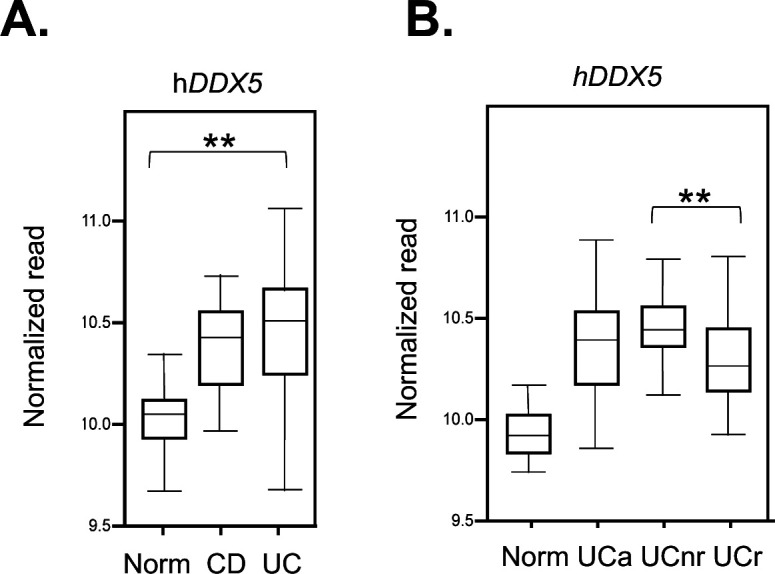
(A) RNA expression of Ddx5 in healthy or ulcerative colitis or Crohn’s disease patients. ** P-value < 0.01 (t test). (B) RNA expression of Ddx5 in healthy or ulcerative colitis patients under infliximab therapy (43). Active disease (A), infliximab non-responders (nr), infliximab responders (r). ** P-value < 0.01 (t test).
Epithelial DDX5 promotes colonic tumorigenesis
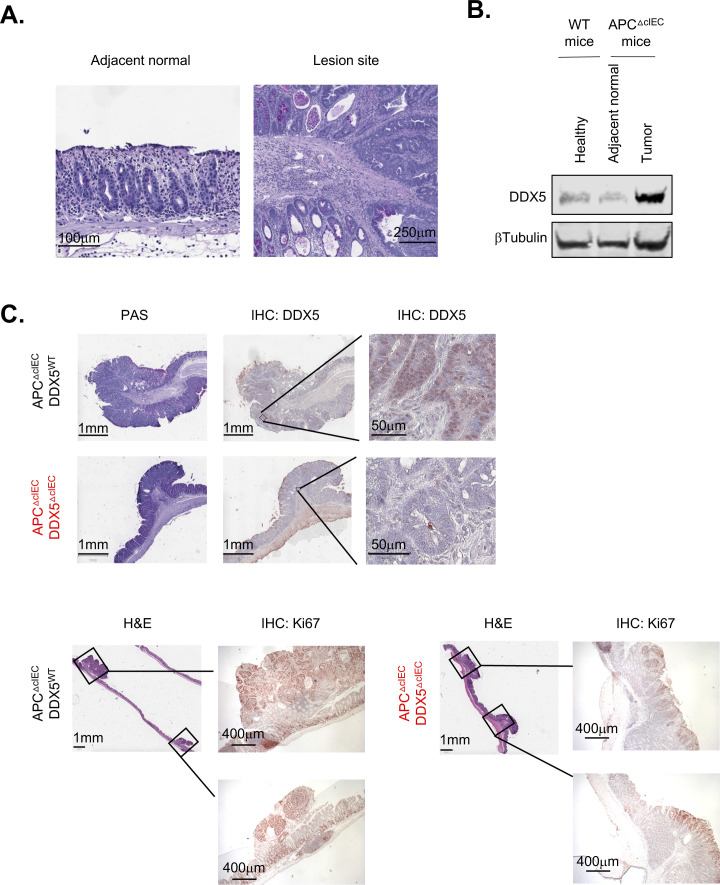
Excess inflammation, such as those found in inflammatory bowel diseases, predisposes patients to epithelial dysplasia and cancer (44, 45). Elevated expression of DDX5 predicts worse relapse-free survival in CRC patients (25, 26, 27). To assess the contribution of DDX5 to colonic tumorigenesis in vivo, we crossed the DDX5flox line to the adenomatous polyposis coli (Apc) mutant mice (Apcfl/+Cdx2Cre+, also known as APCΔcIEC) (Fig 2A). Previous studies demonstrated that intestinal tumorigenesis in the Apc mutant mice is driven by colonic immune cell–mediated inflammation (44). Haploinsufficiency of the tumor suppressor APC leads to aberrant β-catenin activation and the development of large colonic adenomas (46, 47). In this model, the loss of one copy of the Apc allele in the epithelium results in spontaneous tumors, anal prolapse, and subsequent weight loss between day 100 and 120 (44, 48, 49). Periodic acid-Schiff–stained histological sections of colonic adenomas from the APCΔcIEC mice showed a loss of differentiated goblet cell population and neoplastic cell infiltration beyond the basal membranes (Fig S5A). Western blot analyses revealed that DDX5 proteins were expressed at a significantly higher level in colonic tumors from APCΔcIEC mice than adjacent normal tissues or IECs from non–tumor-bearing WT mice (Fig S5B), similar to findings previously reported in human CRCs (25). At 4 mo of age, APCΔcIEC DDX5ΔcIEC mice had lower incidence of anal prolapse (Fig 2B) and experienced less weight change compared to APCΔcIEC DDX5WT controls (Fig 2C). In the colon, APCΔcIEC DDX5ΔcIEC mice had fewer macroscopic tumors (Fig 2D). IHC studies confirmed that DDX5 was indeed knocked out and lesions from the APCΔcIECDDX5ΔcIEC mice had reduced expression of the cell proliferation marker, Ki67 (Fig S5C). However, no significant difference of tumor sizes was found on day 120 (Fig 2E).
Figure 2. DDX5 promotes colonic tumorigenesis in Apc-mutant mice.
(A) Representative bright-field images of tumor-bearing colons from APCΔcIECDDX5WT and APCΔcIECDDX5ΔIEC animals. Scale bar equals 1 cm. (B) Anal prolapse incidents recorded in mice described in (A). (C) Percent weight change of each mice in (A) on day 110 and 120 compared to day 100. Each dot represents one mouse. Weight change from DDX5-sufficient samples are shown in black (n = 15). Weight change from DDX5 knockouts are shown in red (n = 9). Data shown are means ± SD. *P < 0.05 (t test). (D) Colonic tumor counts from APCΔcIECDDX5WT (n = 17) and APCΔcIECDDX5ΔcIEC (n = 12) tumor-bearing animals. Each dot represents one mouse. Data shown are means ± SD. **** P-value < 0.0001 (t test). (E) Average colonic tumor diameter (mm) from APCΔcIECDDX5WT (n = 17) and APCΔcIEC DDX5ΔcIEC (n = 9) tumor-bearing animals. Each dot represents one mouse. Data shown are means ± SD. n.s., not significant (t test). (F) Expression of the DDX5-dependent colonic gene signature predicts clinical outcome in colorectal cancer patients. Top 20 genes were selected based on criteria listed in the Materials and Methods section. Kaplan–Meier analysis of disease-free survival in cohort 1 (GSE13067, GSE14333, GSE17538, GSE31595, GSE37892, and GSE33113), cohort 2 (GSE87211), and progression-free survival in cohort 3 (GSE5851).
Source data are available for this figure.
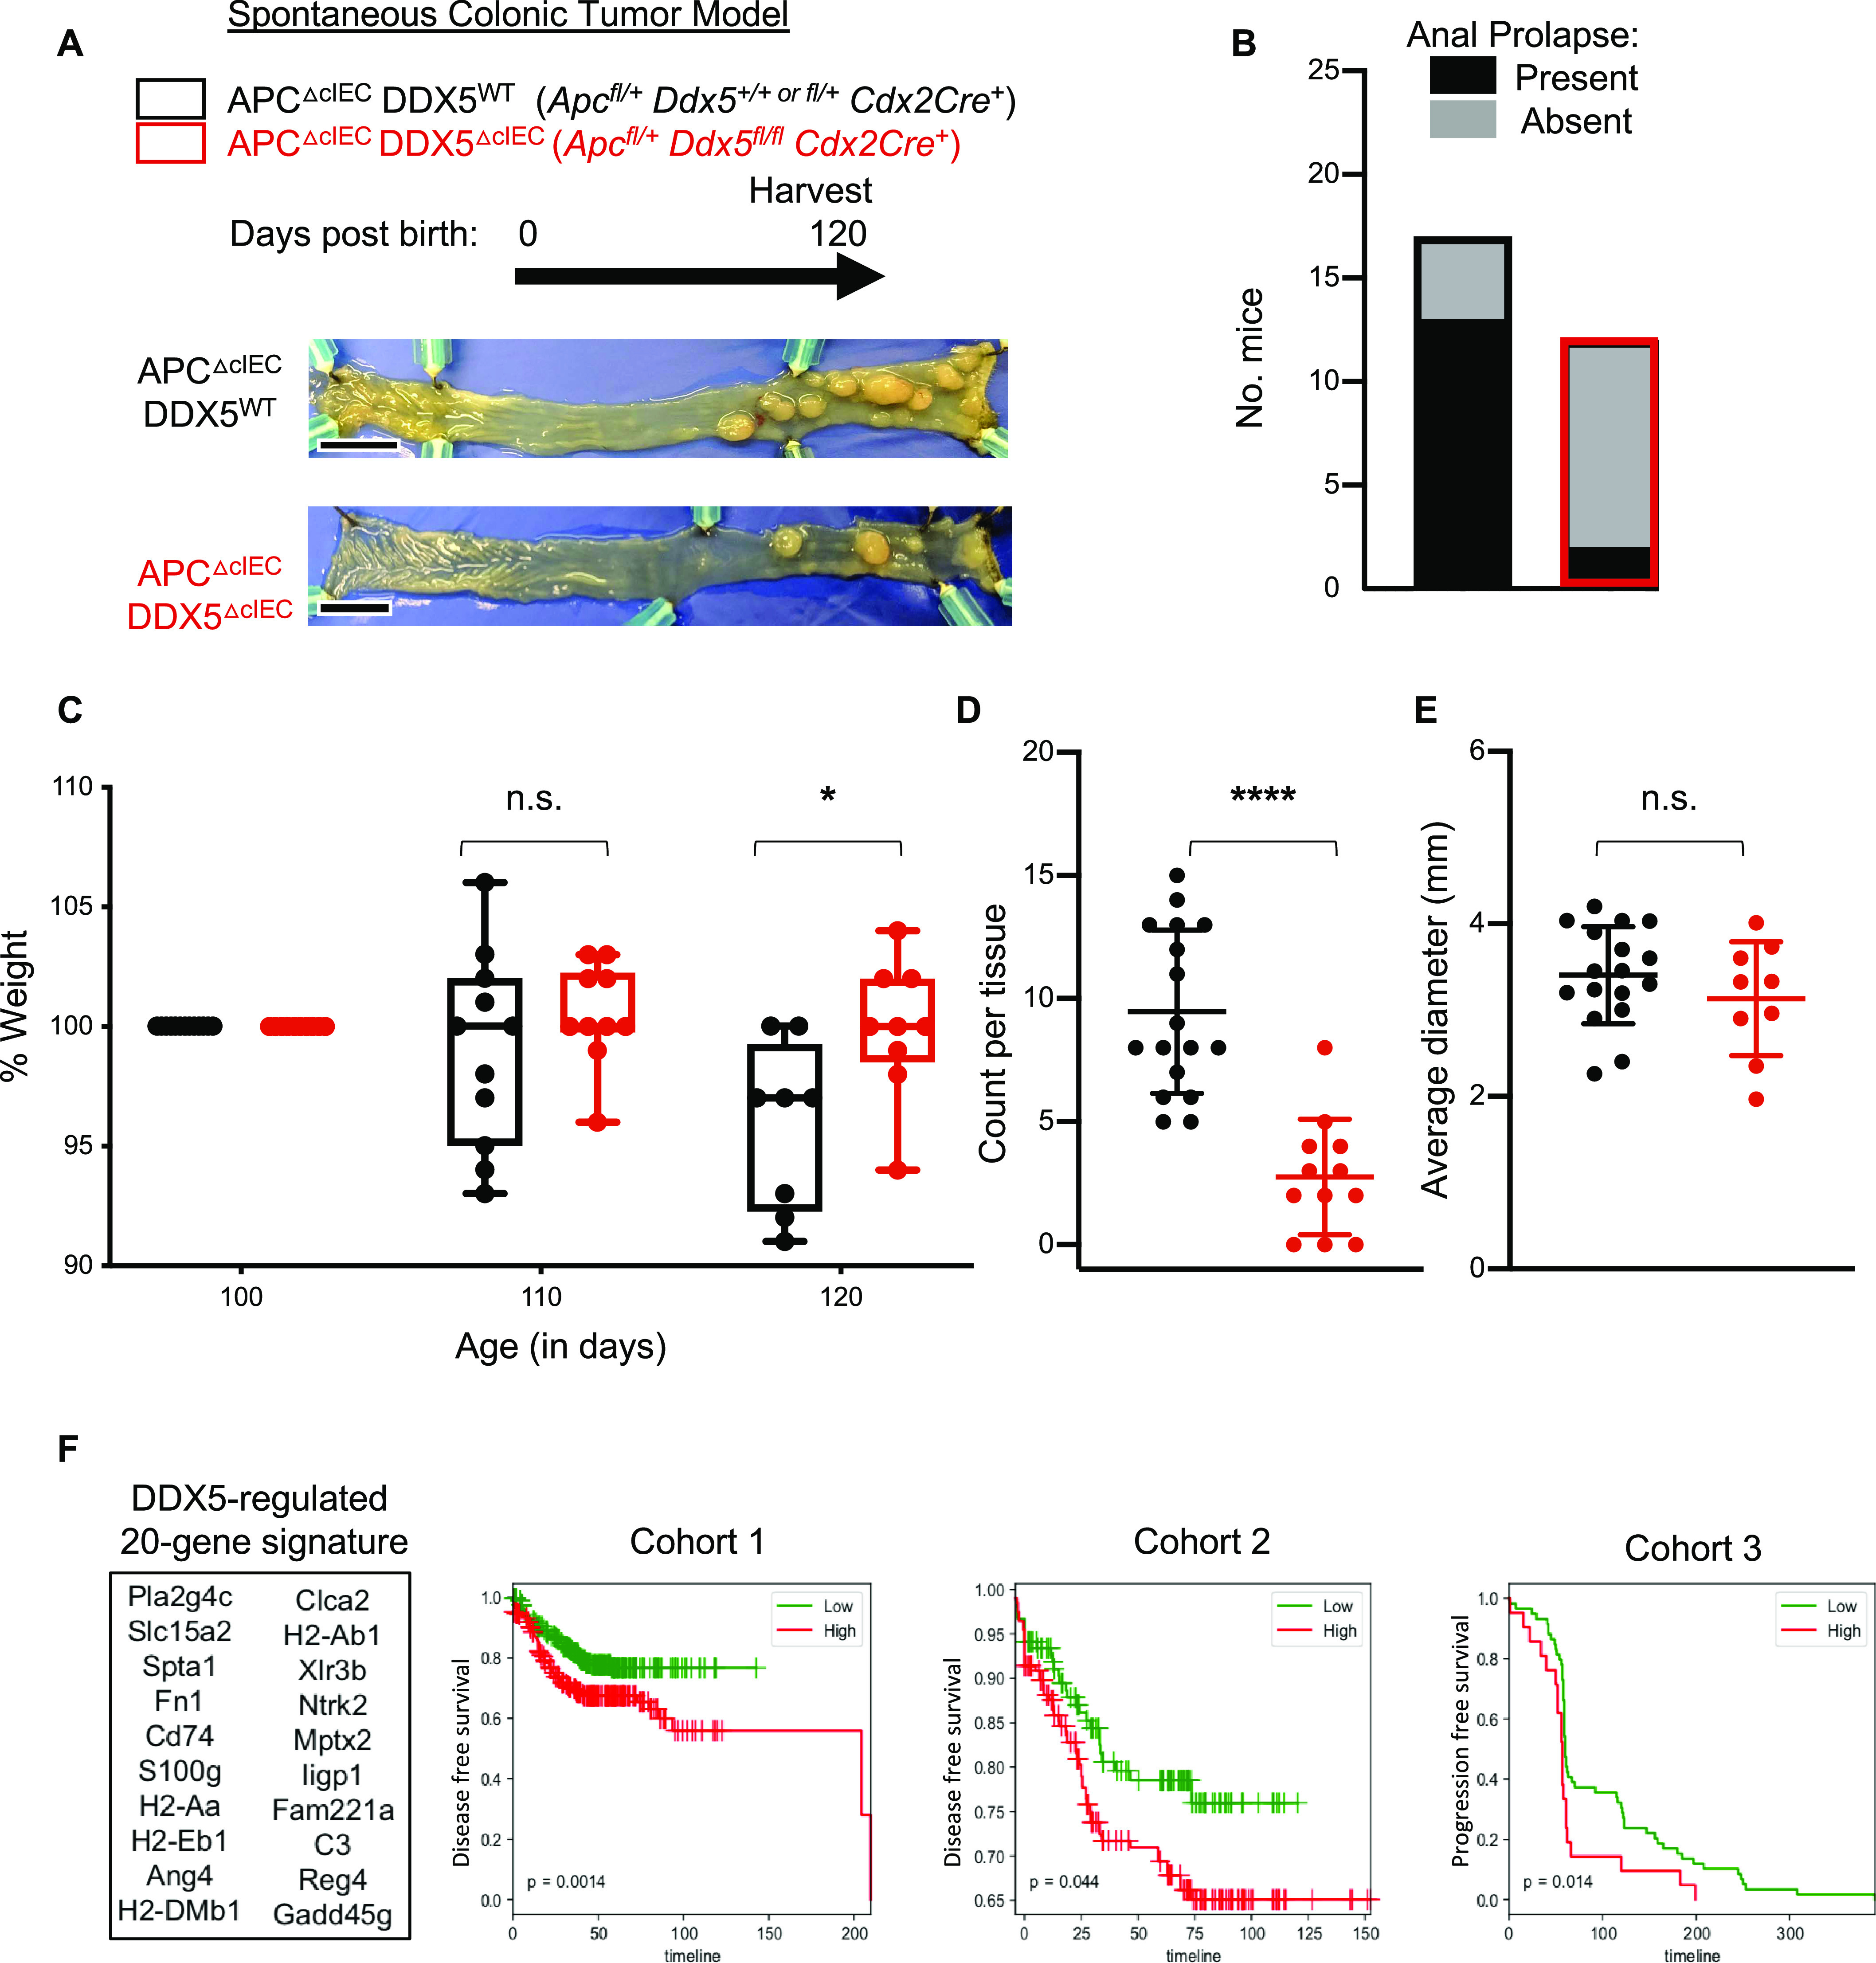
Figure S5. DDX5 protein expression in healthy tissues and in colonic tumors from Apc mutant mice.
(A) Representative images from Periodic Acid-Schiff stained section of adjacent normal colonic epithelium and one adenoma lesion. (B) Western blot analysis of DDX5 and β-tubulin in normal and tumor tissues from the colon of WTIEC and APCΔcIEC mouse. Experiments were repeated three times using independent biological samples with similar results. (C) Representative images from periodic acid-Schiff staining and immunohistochemical analysis of DDX5 and Ki67 in the colon of APCΔIECDDX5WT and APCΔIECDDX5ΔcIEC mice.
We hypothesized that DDX5 contributes to CRC by regulating specific RNA programs in colonic IECs. Consistent with this possibility, Kaplan–Meier analysis of alive and disease-free survival in two independent cohorts and progression-free survival of a third patient cohort indeed reveal strong associations between the DDX5-associated 20 down-regulated gene signature we identified in our colonic IEC RNAseq study and worse CRC outcome (Fig 2F). Together, these results demonstrate that DDX5 is a critical contributor to colonic tumorigenesis in vivo.
Epithelial DDX5 directly binds C3 mRNA and enhances its expression posttranscriptionally
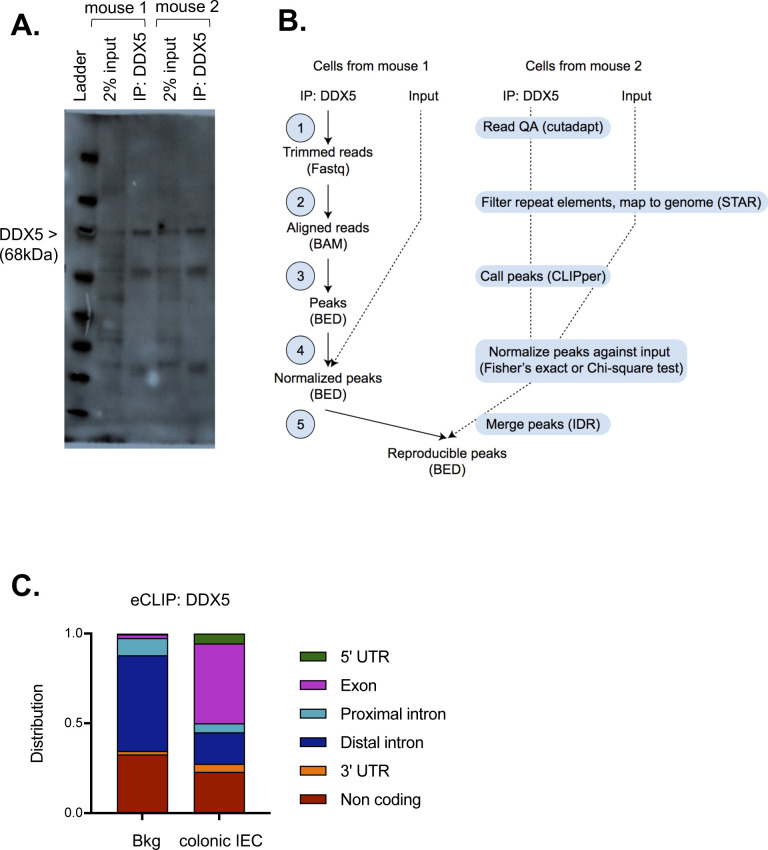
To define the direct target of DDX5 in colonic IECs, we performed the enhanced cross-linked immunoprecipitation (eCLIPseq) assay using the anti-DDX5 antibodies (Table S4). Successful pull-down of DDX5 proteins were confirmed by western assays (Fig S6A). Sequencing results were processed by the ENCODE eCLIPseq analysis pipeline, as described in reference 50 and outlined in Fig S6B. Using a cutoff of three in both log10 P-values and log2 fold changes of immunoprecipitation (IP) signal over input, we identified 201 colonic IEC RNA sites, corresponding to 138 transcripts, that were significantly enriched by the anti-DDX5 antibodies (Table S5). More than 44% of the DDX5-bound sites localized to coding regions on colonic IEC RNAs (Fig S6C). Of the 138 DDX5-bound transcripts, RNA levels of C3, Ahcyl1, and Shroom3 were significantly altered in DDX5-deficient colonic IECs (Fig 3A). Notably, the phenotype of the Apcmut C3-deficient mice (4, 5, 6, 7) mirrored those we observed here in the APCΔcIEC DDX5ΔcIEC mice. Two independent studies in human CRC patients revealed that higher expression of C3 predicts poor overall and relapse-free survival (47, 48).
Figure S6. eCLIPseq analysis pipeline.
(A) Western confirmation of efficient immunoprecipitation of DDX5 from two independent colonic intestinal epithelial cell lysates. (B) Workflow of the eCLIPseq analysis. (C) DDX5 binding preference as identified by eCLIPseq on the different colonic RNA regions. Background (Bkg) is defined as the RNA regions in the annotated mouse transcriptome from GENCODE.
Figure 3. Epithelial DDX5 binds C3 RNA to enhance its expression posttranscriptionally.
(A) Workflow to identify DDX5 direct targets in colonic intestinal epithelial cells (IECs) involved in tumorigenesis. (B) Integrative Genomics Viewer browser displaying RNA expression at the C3 and Ddx5 locus in colonic IECs from two independent pairs of WTIEC and DDX5ΔIEC littermates. (C) qRT-PCR validation of colonic C3 expression in additional independent pairs of WTIEC (n = 3) and DDX5ΔIEC (n = 3) animals. Data shown are means ± SD. *P < 0.05 (t test). (D) Representative Western analysis of C3 proteins in the colonic IECs from two independent pairs of WT and DDX5-deficient mice. Signal quantification was calculated as signal of C3 over signal of total protein. (E) Integrative Genomics Viewer browser displaying the DDX5 binding to C3 RNAs in WT colonic IECs as defined by eCLIPseq. eCLIPseq was performed on colonic IECs from two independent WT mice. Peaks were called by a cutoff of three for both log10 P-values and log2 (fold changes: immunoprecipitation over input). (F) DDX5-binding site on C3 promotes Renilla luciferase reporter activities in human SW480 cells. Left: reporter activity is calculated as Renilla readings over the constitutive firefly luciferase readings. Results shown are means ± SD of three independent studies. Black: cells transfected with psicheck2 luciferase reporter. Green: cells transfected with psicheck2 luciferase reporter that contains the DDX5-binding site on C3 and random siRNA. Purple: cells transfected with psicheck2 luciferase reporter that contains DDX5-binding site on C3 and Ddx5 siRNA. Right: expression of human DDX5 in SW480 cells were assessed by qRT-PCR and normalized to human GAPDH. SW480 cells under different treatment were indicated as black, green, and purple dots. *P < 0.05 (t test). (G) RNAi-mediated knockdown of human DDX5 destabilizes C3 mRNA in Caco-2 cells. Cells were transfected with 100M control (black) or 100M siRNA against human Ddx5 (red) for 48 h followed by 16 h of incubation with 2 μM flavopiridol. Left: expressions of human C3 were assessed by qRT-PCR and normalized to DMSO-treated controls. Right: expressions of human Ddx5 under different treatments were assessed by qRT-PCR and normalized with hGapdh. Results are means of three independent experiments ± SD, P-value = 0.06 (t test).
Source data are available for this figure.
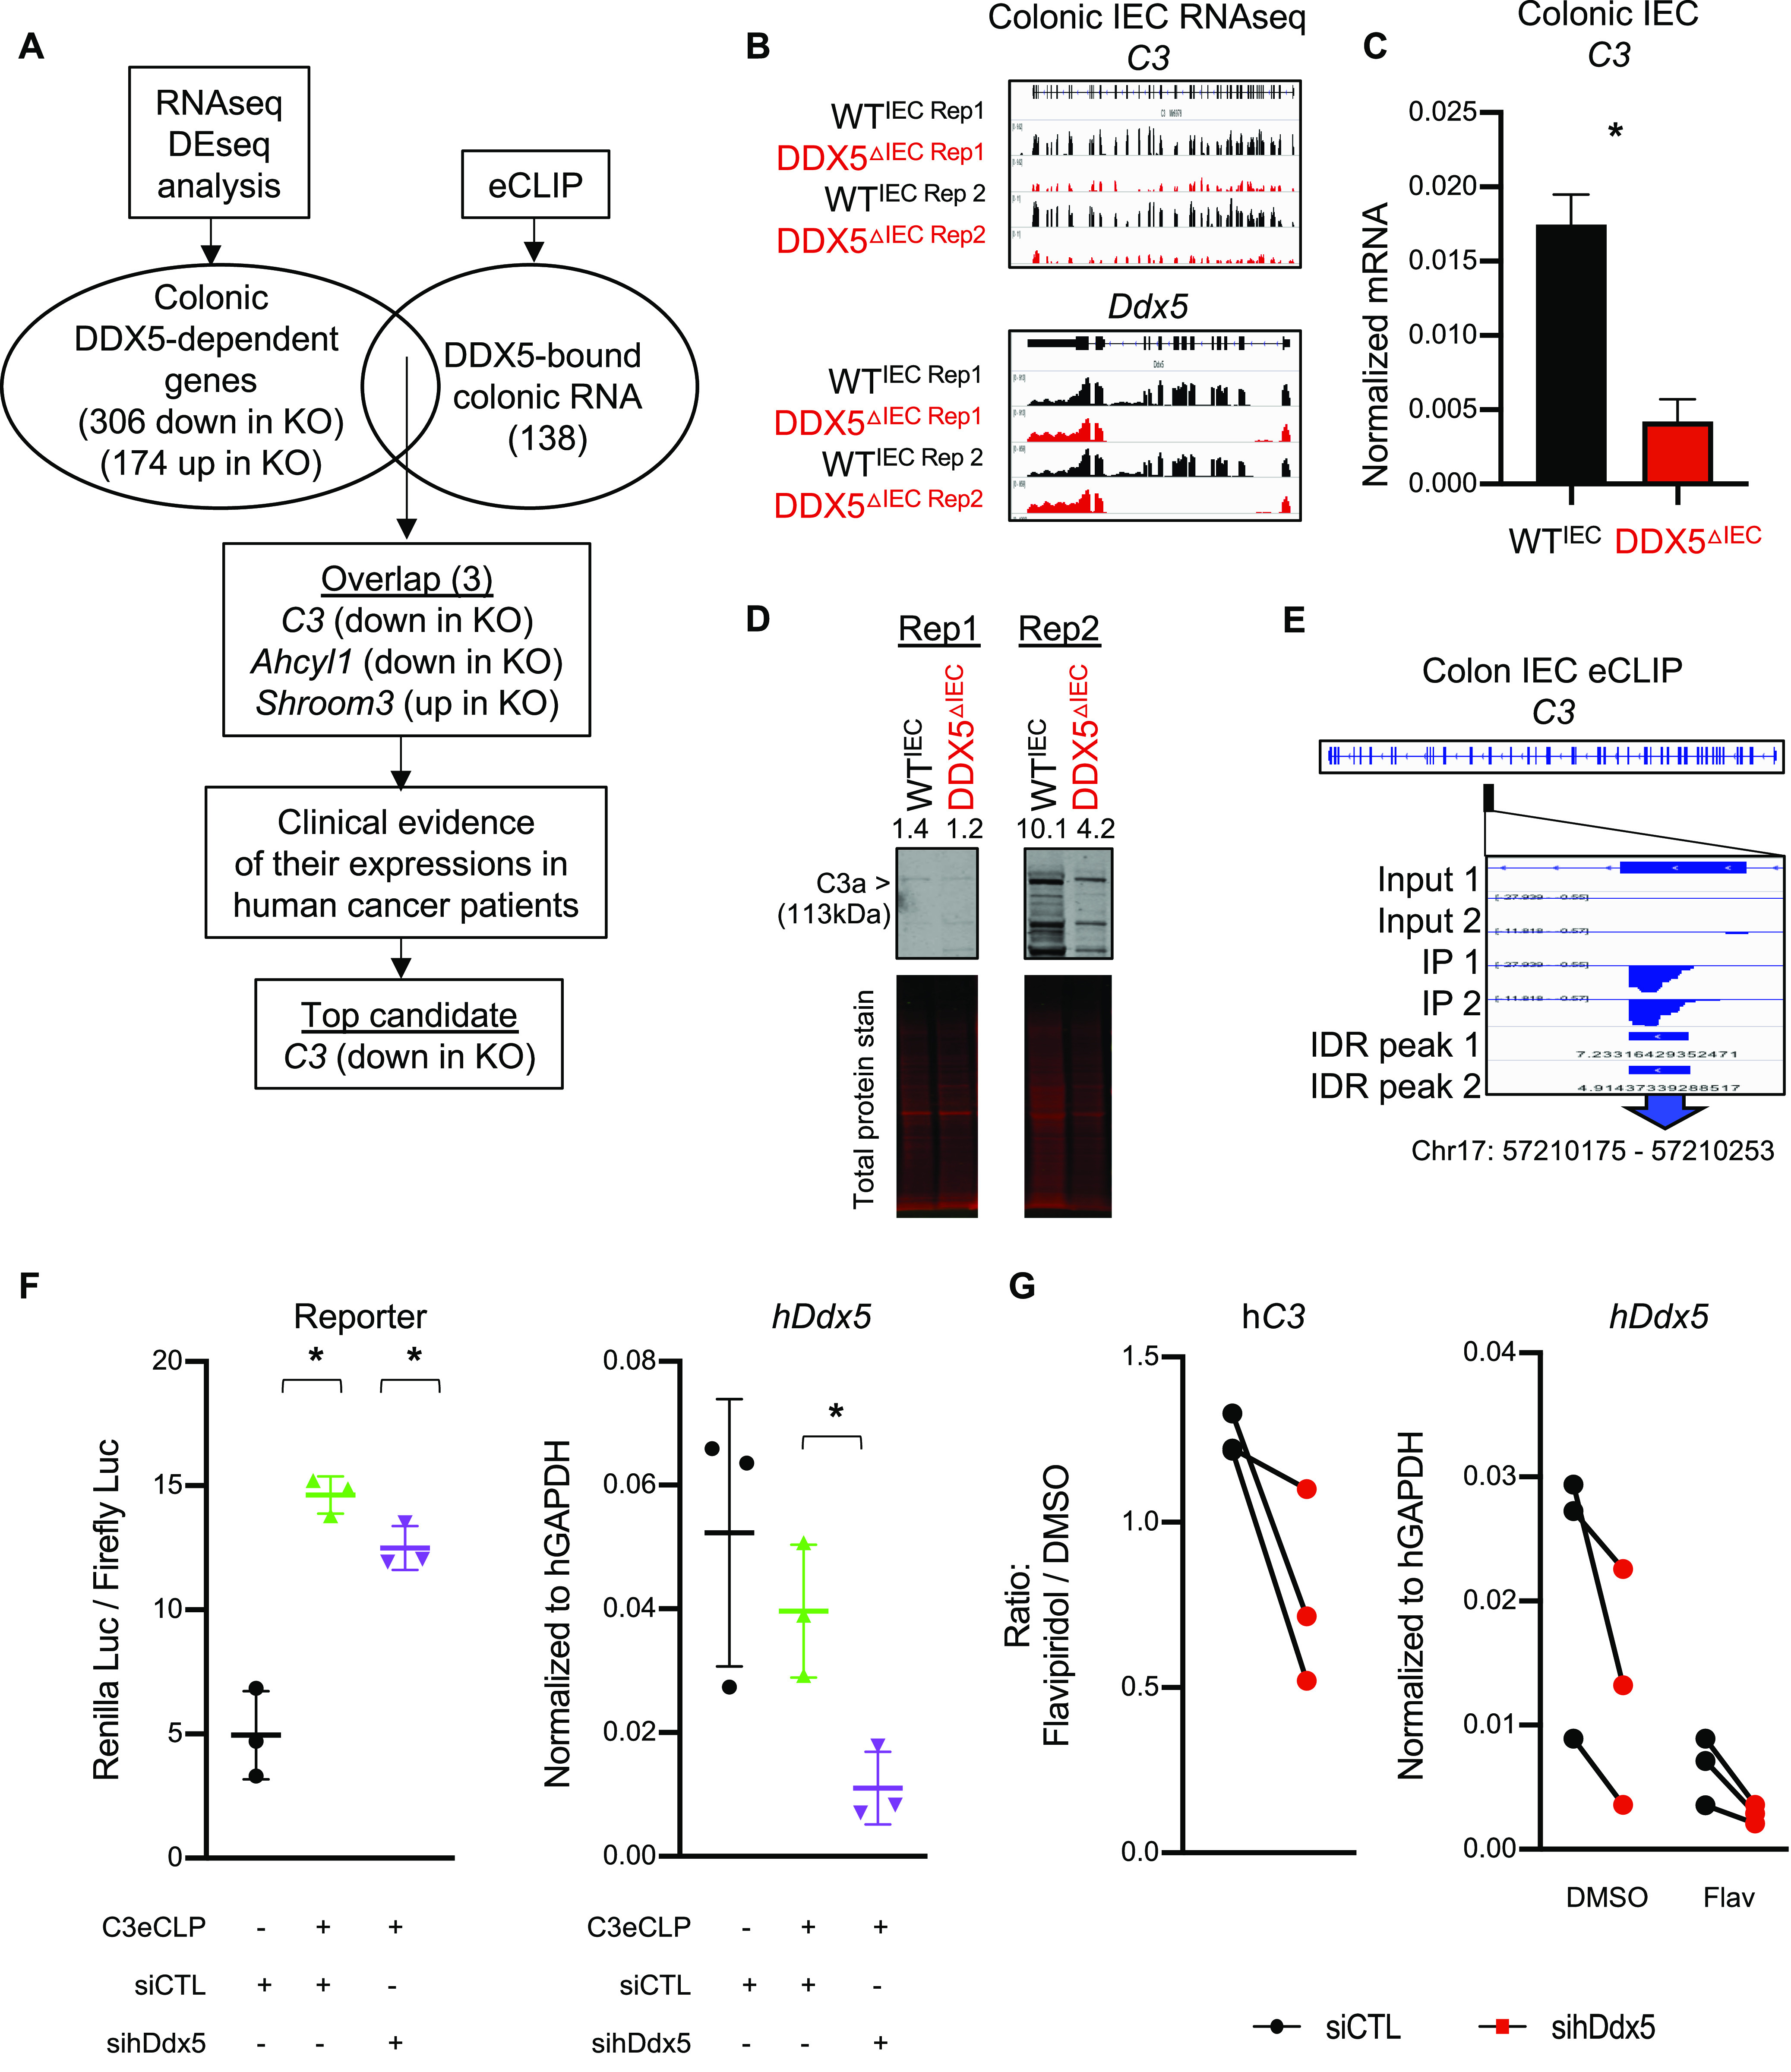
Table S5 DDX5 eCLIP targets in colonic intestinal epithelial cells. (18.1KB, xlsx)
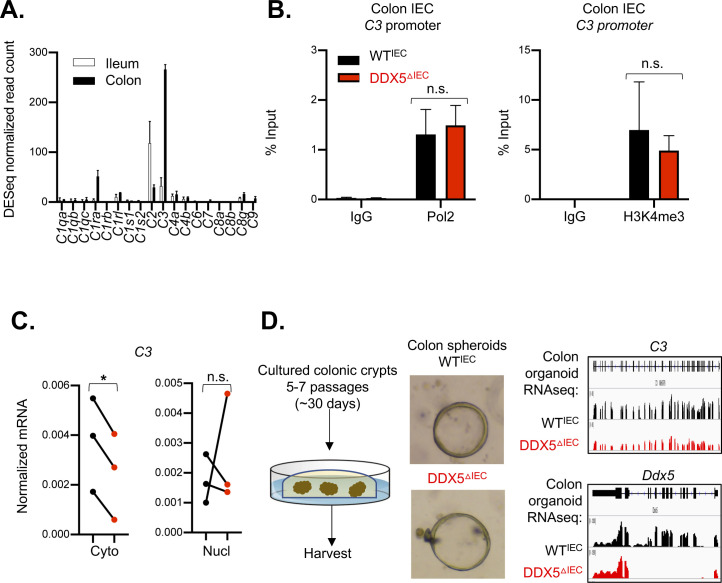
C3 mRNA is the highest expressed member of the complement family in wild-type mouse colonic IECs (Fig S7A). Reduced C3 transcripts and proteins were found in DDX5-deficient colonic IECs (Fig 3B–D). If DDX5 promotes C3 mRNA expression at the transcription level, we expect to observe altered RNA polymerase II recruitment and deposition of H3 lysine 4 trimethylation (H3K4me3) on the C3 gene promoter in colonic IECs from DDX5ΔIEC mice. However, chromatin immunoprecipitation (ChIP) qRT-PCR assay showed that a similar enrichment of RNA polymerase II and H3K4me3 were found on the C3 promoter in colonic IECs from WTIEC and DDX5ΔIEC mice (Fig S7B). In addition, fractionation studies revealed that C3 level is similar in the nuclear compartment but significantly reduced in the cytoplasm of DDX5-deficient IECs (Fig S7C). Next, we asked whether DDX5 regulation of C3 is intrinsic to colonic epithelial cells and independent of inputs from gut microbiota and immune cells using an organoid culture system. Briefly, colonic crypts containing epithelial stem cells were harvested from WTIEC and DDX5ΔIEC littermates and maintained ex vivo for 5–7 passages. RNAseq of these colonic organoids revealed a similar reduction of C3 RNA in DDX5-deficient cultured cells (Fig S7D), suggesting that the regulation of C3 by DDX5 is epithelial cell intrinsic.
Figure S7. C3 expression and RNA polymerase II and H3K4 methylation levels on its promoter.
(A) Normalized RNAseq read counts of the complement gene family in ileal and colonic intestinal epithelial cells (IECs) from steady-state WT mice. RNAseq was performed on ileal and colonic IECs from two independent WT mice. Data shown are normalized read count means ± SD. (B) Chromatin immunoprecipitation-qPCR assay of RNA polymerase II and H3K4me3 in colonic IECs. Data shown are means ± SD from two independent pairs WTIEC and DDX5-deficient mice. n.s., not significant (t test). (C) RNAs from the nuclear and cytoplasmic fractions of colonic IECs harvested from WT and DDX5DIEC mice were evaluated by qRT-PCR for C3. Each dot represents one mouse. This experiment was repeated on three pairs of independent samples. *P < 0.05 (t test). (D) Left: representative bright-field images of organoids cultured from colonic crypts of WTIEC and DDX5-deficient mice. Right: IGV browser displaying RNA expression at the C3 and Ddx5 locus in cultured organoids derived from WTIEC (n = 1) and DDX5DIEC (n = 1) colonic crypts.
Results from the eCLIPseq assay revealed that DDX5 was enriched on a region of the C3 transcript encoded by exon 30 (Fig 3E). Therefore, we hypothesize that DDX5 may bind to and regulate C3 transcripts at the posttranscriptional level. Insertion of the short stretch of DDX5-bound region of mouse C3 into the 3′UTR of the psiCheck2 reporter was sufficient to potentiate DDX5-dependent Renilla luciferase activity in a human epithelial cell line (Fig 3F). In flavipiridol-treated human epithelial cells, C3 mRNAs experienced a greater turnover when DDX5 was knocked down (Fig 3G). Together, these results suggest that DDX5 binds to and promotes C3 mRNA stability in colonic IECs.
Epithelial DDX5 promotes small intestine tumorigenesis
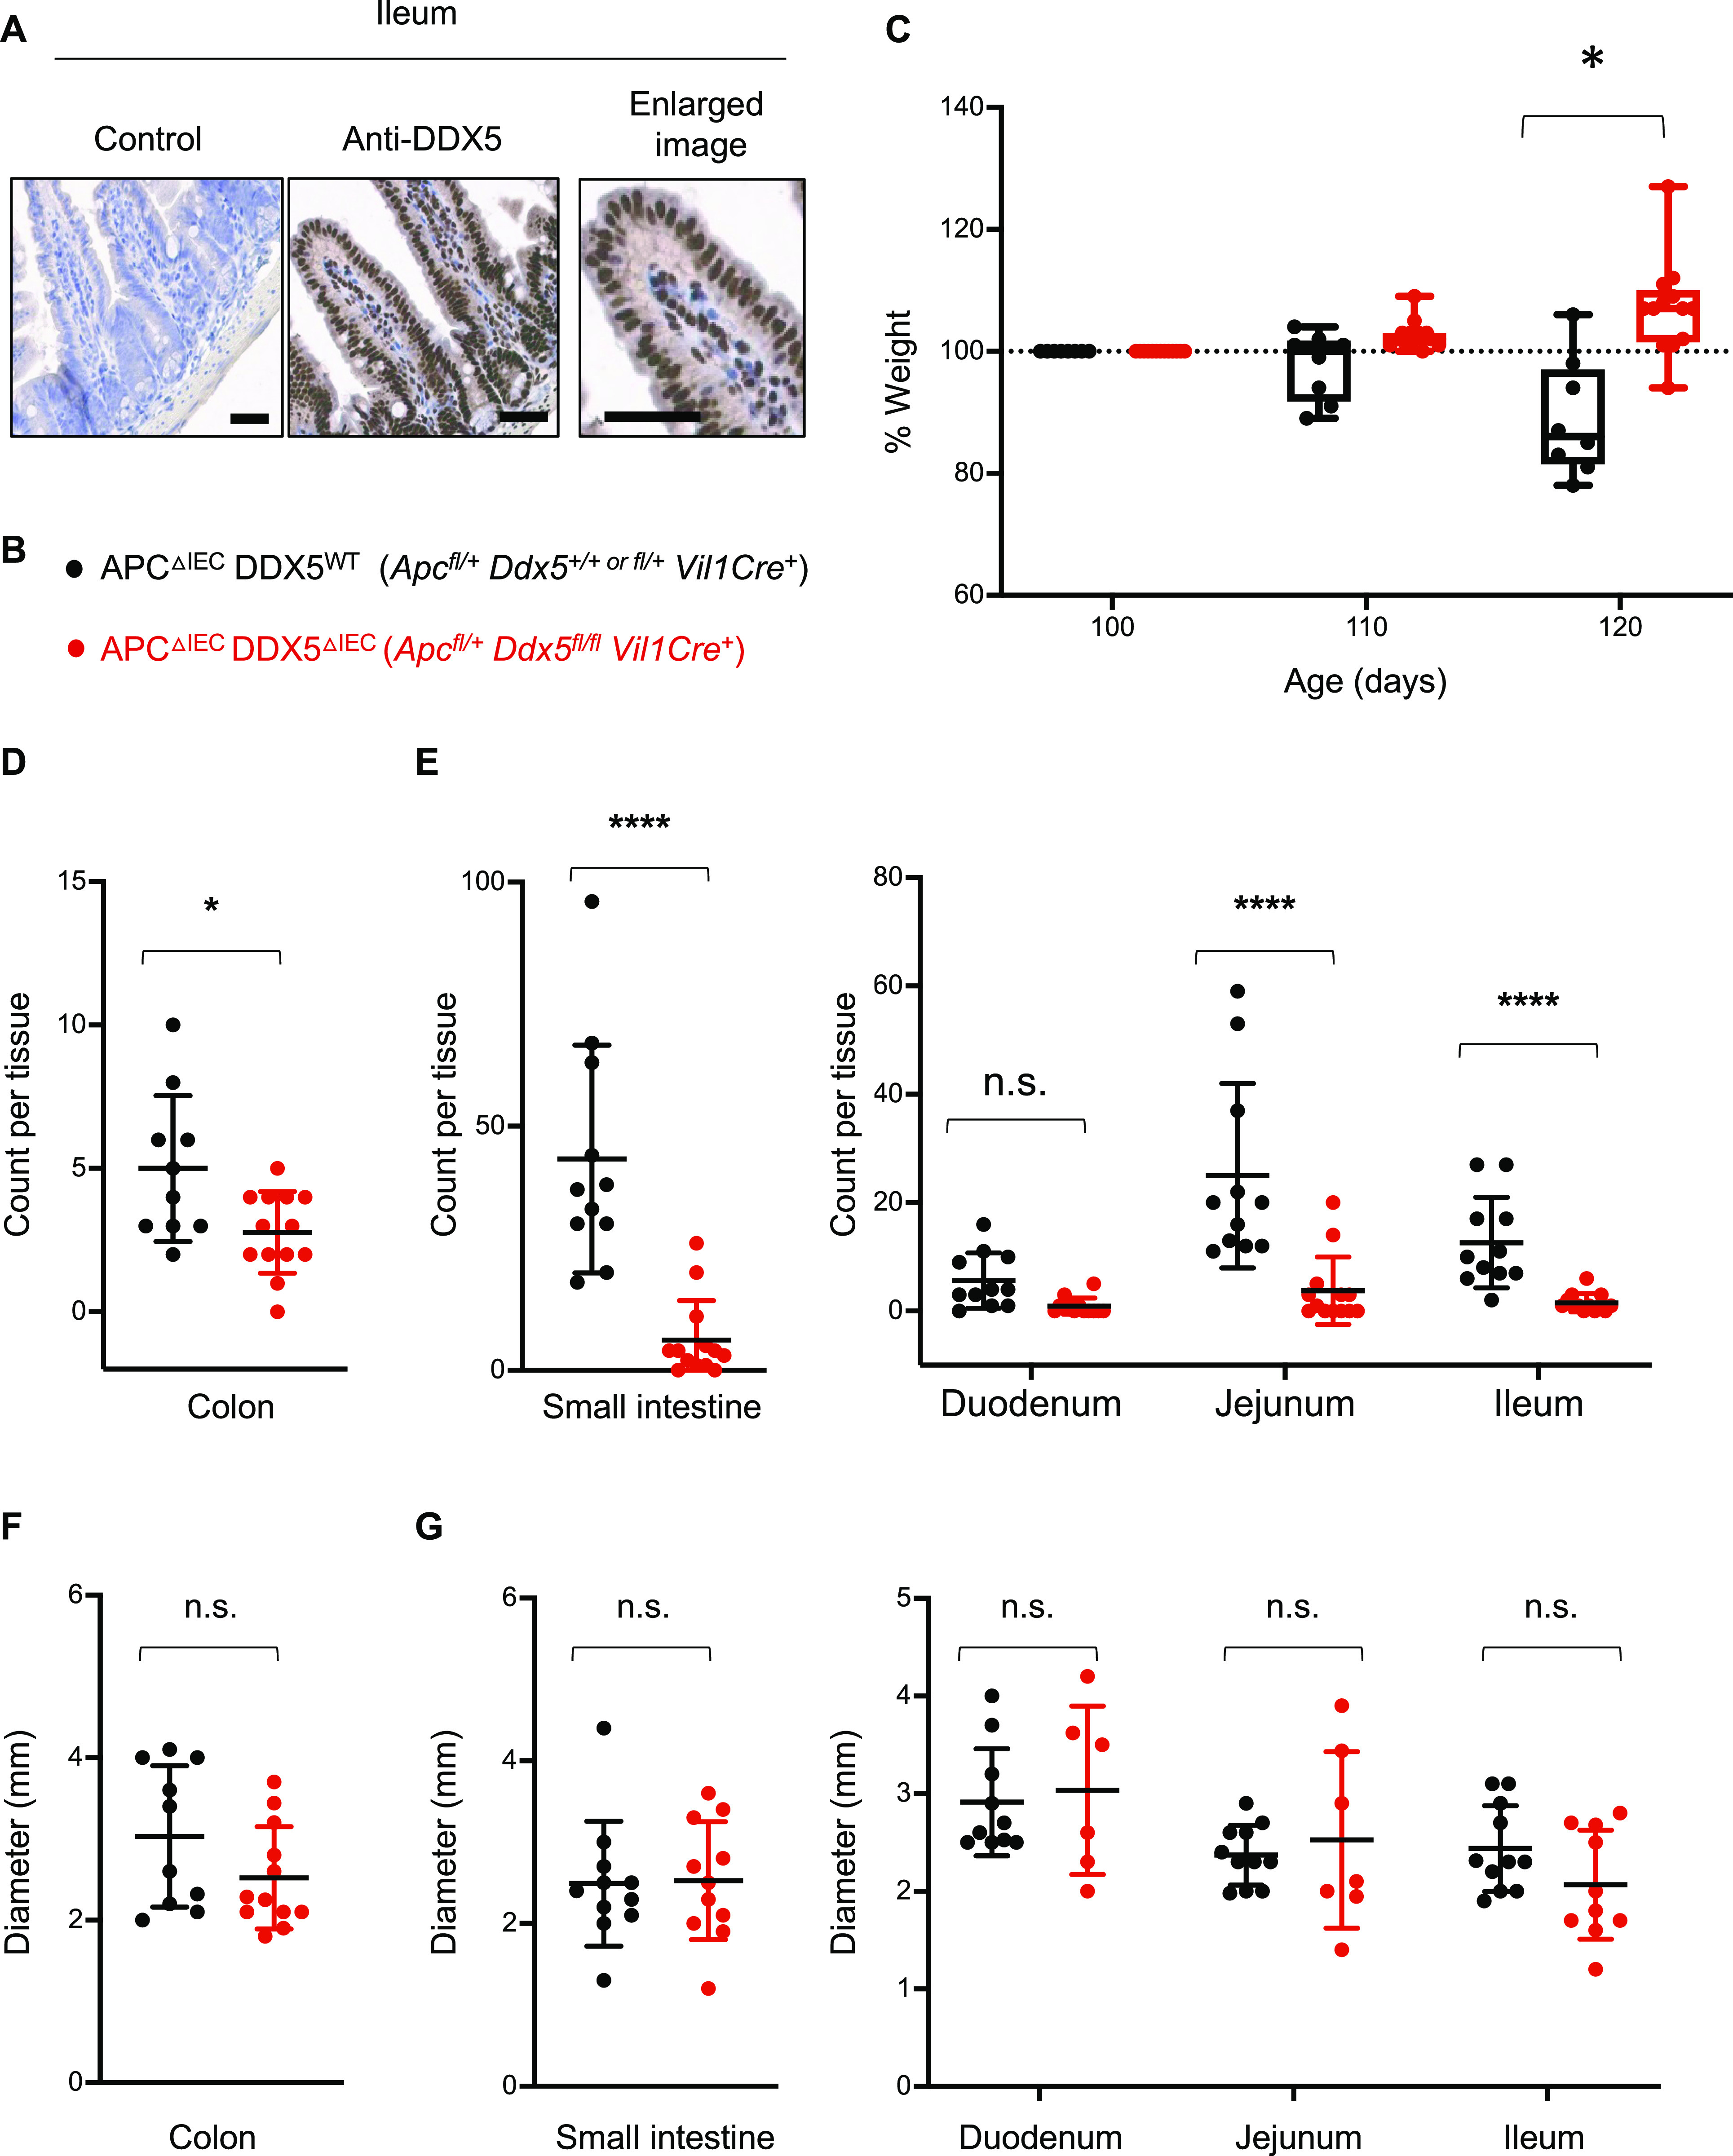
In the wild-type mouse small intestine, DDX5 is also abundantly expressed under steady state (Figs 1A and 4A). To ask whether DDX5 may also be involved in tumorigenesis of the small intestine, epithelial DDX5 conditional mice (Ddx5flox) were crossed to the Apcfl/+Vil1Cre+ mice (Fig 4B). Different from the Apcfl/+Cdx2Cre+ mutant mice described in Fig 2, APCΔIEC mice harbor intestinal tumors in both the small intestine and colon. APCΔIEC mice begin to experience significant weight loss starting around day 100 of age. By 110 d of age, APCΔIECDDX5ΔIEC littermates continued to gain weight, but APCΔIEC DDX5WT mice began to experience significant weight loss. By day 120, APCΔIEC DDX5WT and APCΔIEC DDX5 ΔIEC mice had significant weight differences (Fig 4C). Macroscopic tumor numbers in the jejunum, ileum, and colon of the APCΔIEC DDX5 ΔIEC mice were significantly lower than those found in the APCΔIEC DDX5WT mice (Fig 4D and E). No statistical significance was observed in tumor numbers found in the duodenum. The average tumor sizes were comparable between WT and DDX5-deficient tissues (Fig 4F and G), consistent with the results observed in the Apcfl/+Cdx2Cre+ mutant mice (Fig 2E). These results uncover a novel role of epithelial DDX5 in promoting small intestinal tumorigenesis.
Figure 4. DDX5 also promotes tumorigenesis in the small intestine.
(A) Representative images from immunohistochemistry analysis of DDX5 in the ileum of WT mice. Enlarged image is shown on the right. Scale bar represents 50 μm. (B, C, D, E, F, G) Genotypes of tumor-bearing APCΔIECDDX5WT and APCΔIECDDX5ΔcIEC littermates used in (C, D, E, F, G). (C) Percent weight change of each mouse in (B) on days 100, 110, and 120. Each dot represents one mouse. Data shown are means ± SD. Each dot represents one mouse. Weight change from DDX5-sufficient samples are shown in black (n = 10). Weight change from DDX5 knockouts are shown in red (n = 13). Data shown are means ± SD. *P < 0.05 (multiple t test). (D) Macroscopic tumor counts in the colon. Each dot represents one mouse. Counts from DDX5-sufficient samples are shown in black (n = 12) and counts from DDX5 knockouts are shown in red (n = 13). Data shown are means ± SD. *P < 0.05 (t test). (E) Left: total macroscopic tumor counts in the small intestine. Right: Macroscopic tumor counts in different segments of the small intestine. Each dot represents one mouse. Counts from DDX5-sufficient samples are shown in black (n = 12) and counts from DDX5 knockouts are shown in red (n = 13). Data shown are means ± SD. n.s., not significant. ****P < 0.0001 (multiple t test). (F) Average tumor diameters in the colon. Each dot represents one mouse. Diameters from DDX5-sufficient samples are shown in black (n = 12) and diameters from DDX5 knockouts are shown in red (n = 13). Data shown are means ± SD. n.s., not significant (t test). (G) Left: Average tumor diameters in the small intestine. Right: average tumor diameters in different segments of the small intestine. Each dot represents one mouse. Diameters from DDX5-sufficient samples are shown in black (n = 12) and diameters from DDX5 knockouts are shown in red (n = 13). Data shown are means ± SD. n.s., not significant (t test).
Source data are available for this figure.
DDX5 binds a distinct set of RNAs to drive tumorigenesis in the small intestine
Next, we asked whether DDX5 regulates overlapping and/or distinct RNA programs in the small intestine and colon. As most DDX5-dependent tumorigenesis of the small intestine occurred in the distal end (Fig 4E), we focused on characterizing the DDX5-dependent RNA program in the ileal section of the small intestine. Global transcriptome analyses revealed that DDX5 controls overlapping and distinct programs in the ileum and colon (Fig 5A and Table S6).
Figure 5. DDX5 regulates overlapping and distinct RNA programs in the small intestine and colon.
(A) Venn diagram of the overlapping and distinct DDX5-dependent transcripts from the ileum and colon defined as log2 fold change of ≥0.5 or ≤−0.5 and P-value < 0.05. RNAseq was performed on two independent pairs of cohoused DDX5ΔIEC over WTIEC littermates. (B) Venn diagram showing the overlapping and distinct DDX5-bound transcripts in the small intestine and colonic intestinal epithelial cells (IECs). eCLIPseq was performed on small intestine IECs from two independent WT mice. Peaks were called by a cutoff of three for both log10 P-values and log2 (fold changes: immunoprecipitation over input). (C) Integrative Genomics Viewer browser displaying DDX5 binding on the fatty acid-binding protein 1 (Fabp1) locus as defined by eCLIPseq. (D) Normalized RNAseq read counts of transcripts encoding members of the FABP family in ileal IECs from WTIEC and DDX5-deficient mice. *P < 0.05 (DEseq). (E) Representative Western blots for FABP1, DDX5, β-tubulin, and fibrillarin in cytoplasmic (C) and nuclear (N) extracts of small intestine IECs from WT and DDX5ΔIEC mice. Experiments were repeated three times using independent biological samples with similar results. (F) RNAs from the nuclear and cytoplasmic fractions of small intestine IECs harvested from WT and DDX5ΔIEC mice were evaluated by qRT-PCR for Fabp1. Each dot represents one mouse. This experiment was repeated on two pairs of independent samples. *P < 0.05 (t test). (G) Engagement of Fabp1 mRNA with ribosome RPL10A in small intestine IECs. Results are means of two independent experiments ± SD. *P < 0.05 (t test). (H) Working model: DDX5 posttranscriptionally regulates the expression of tissue-specific oncogenic RNAs in IECs.
Source data are available for this figure.
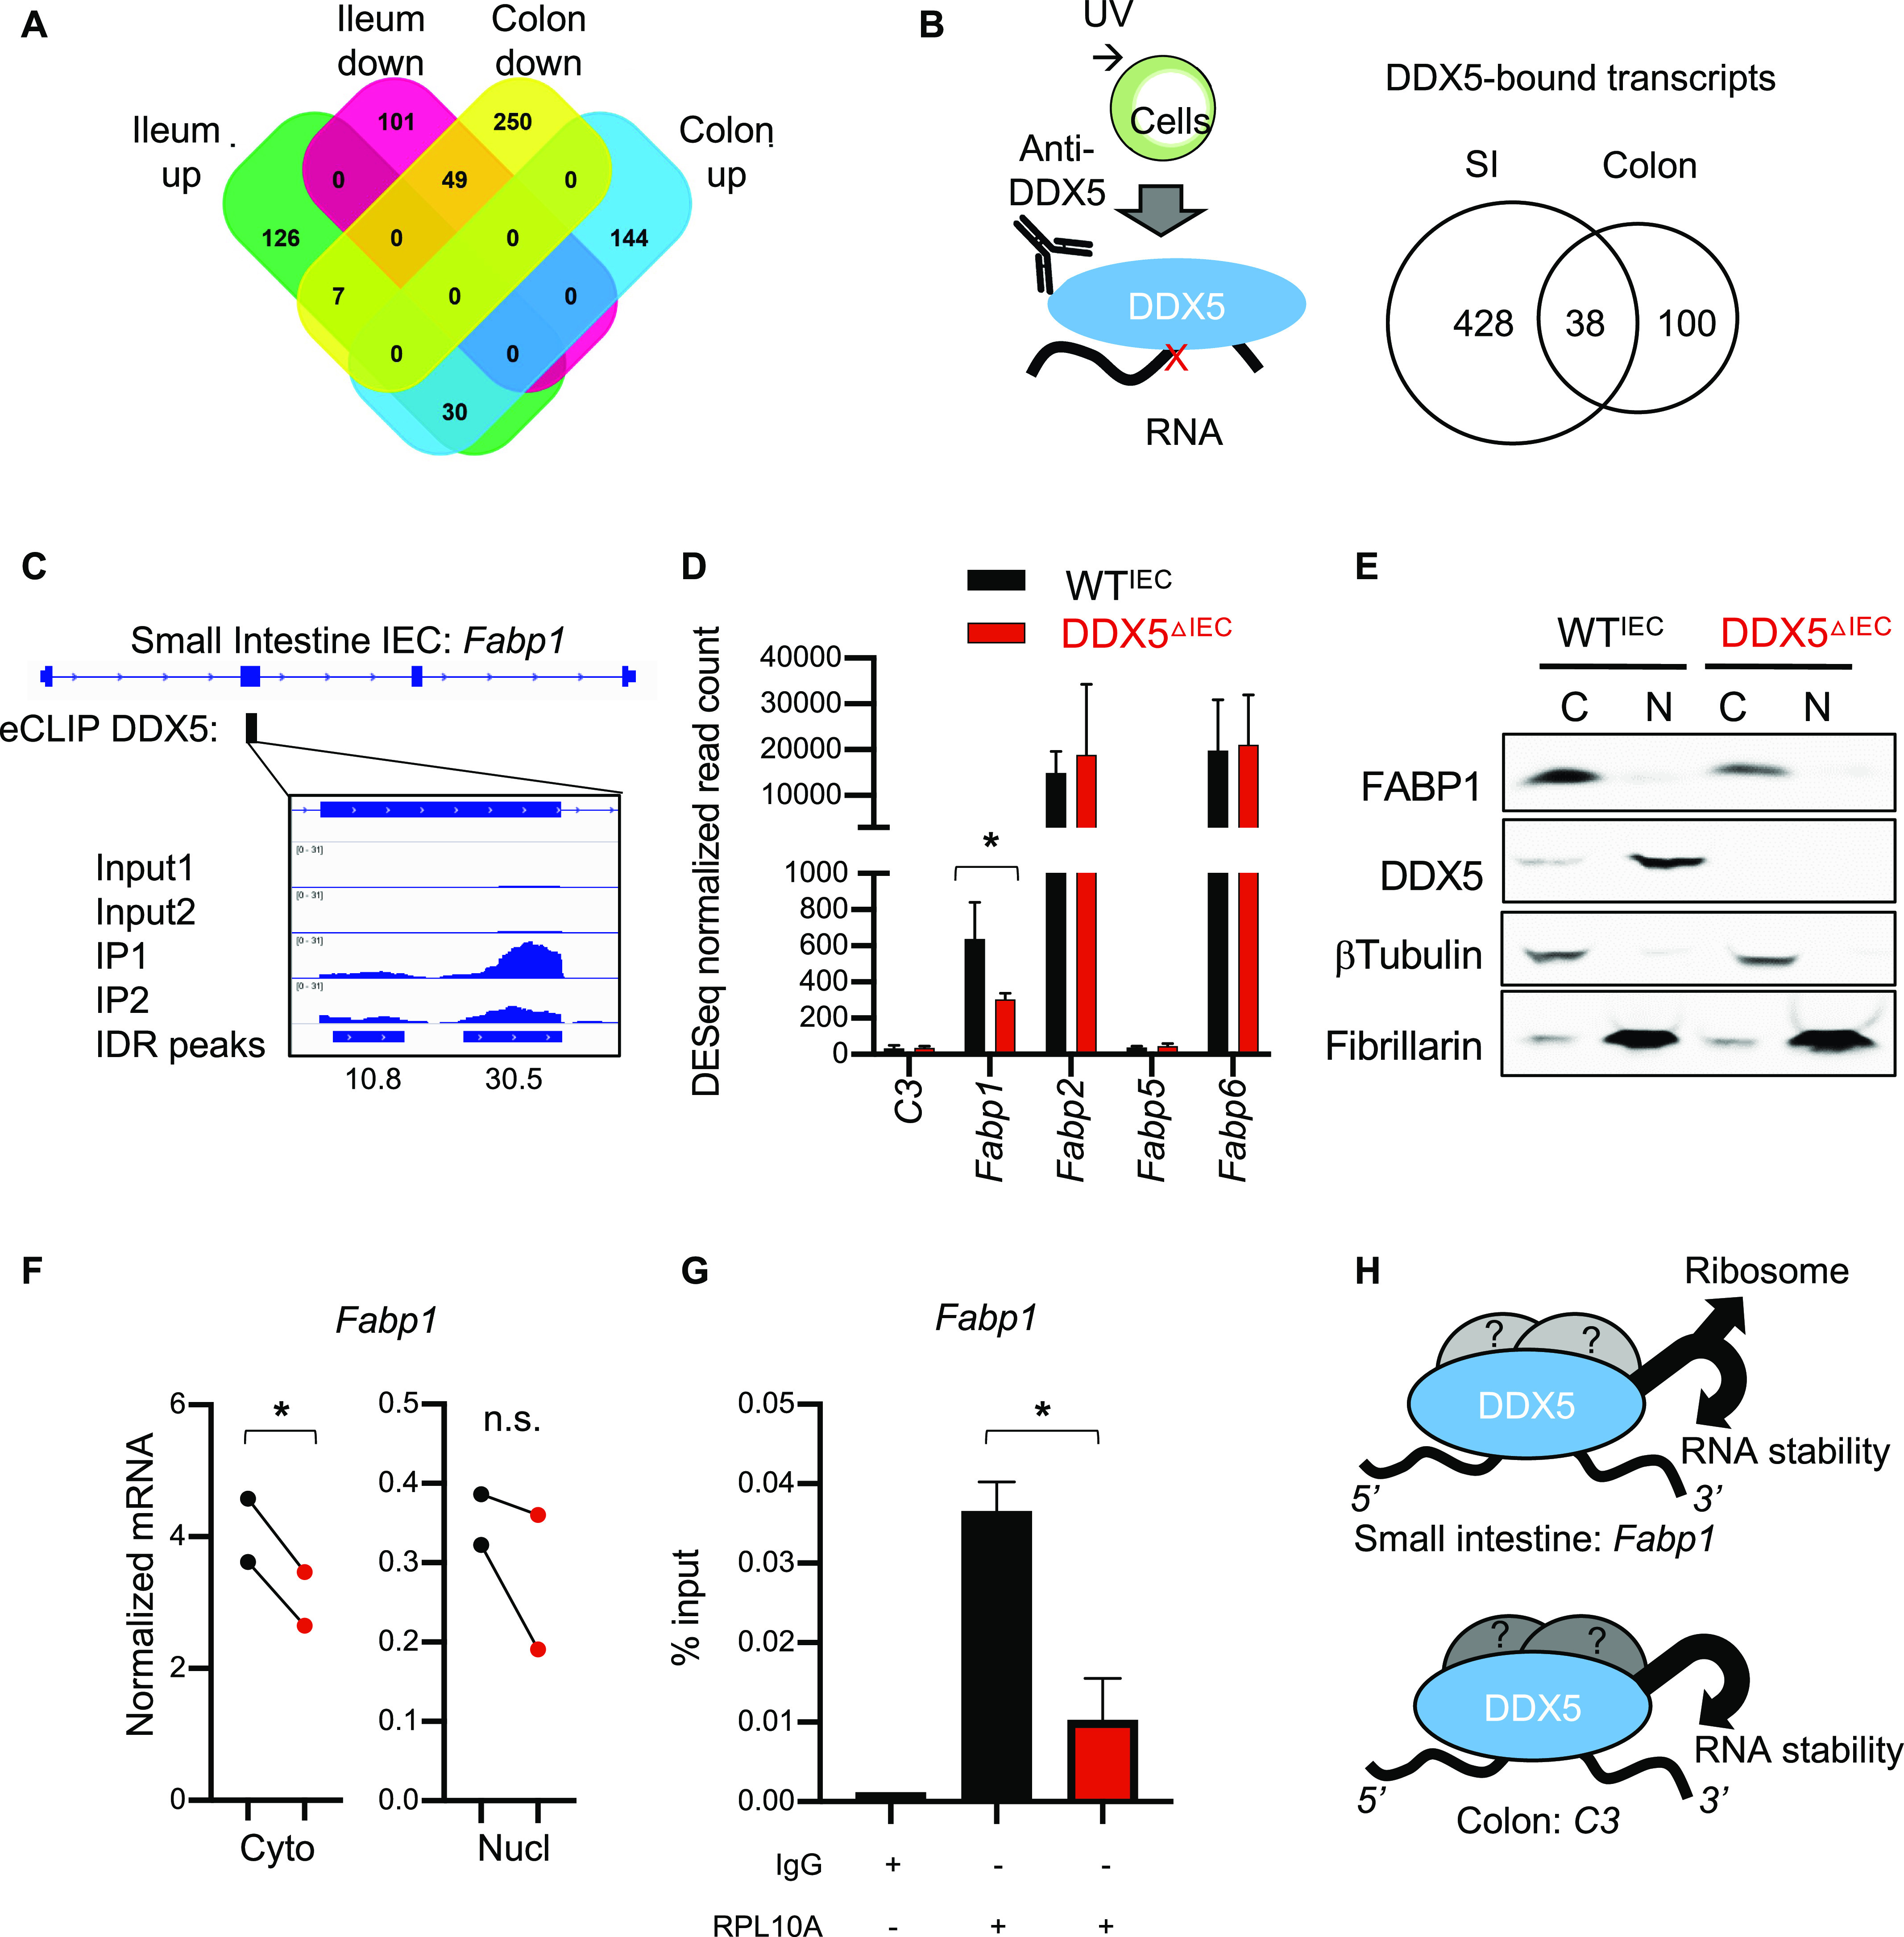
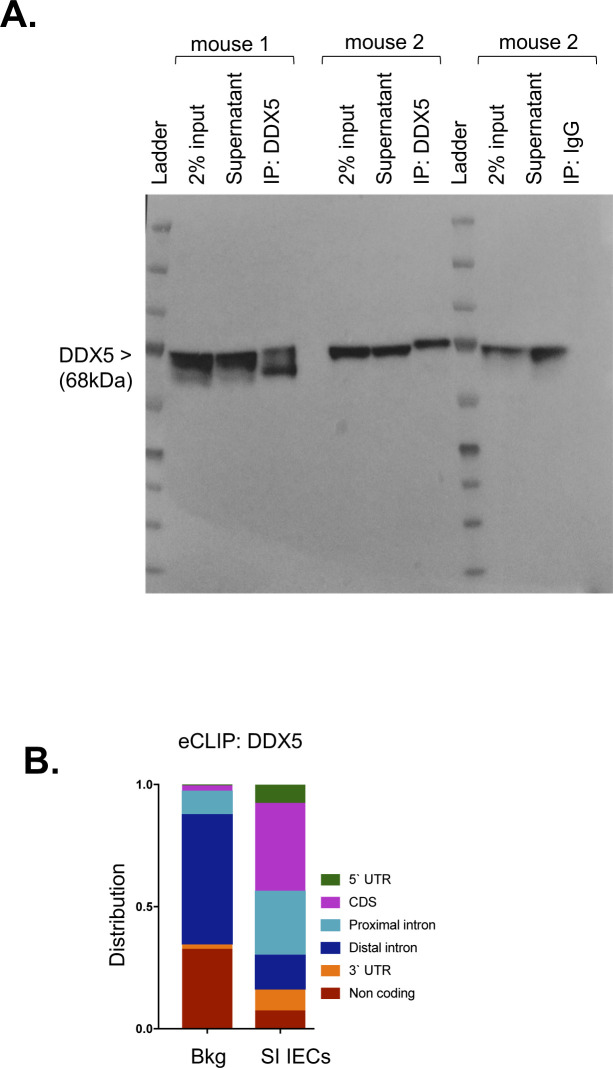
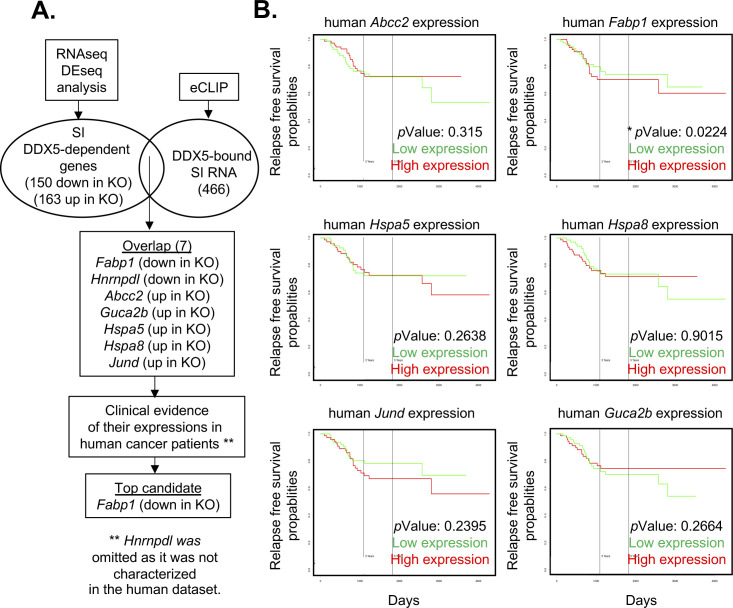
To determine the direct targets of DDX5 in the small intestine, eCLIPseq was performed using UV cross-linked cells from WT mice (Fig S8A). Overall, we found DDX5 binding to 1,276 small intestine IEC RNA sites, corresponding to 466 transcripts (Fig 5B and Table S7). Similar to colonic IECs (Fig S6C), DDX5 was also enriched on coding regions of small intestine IECs (Fig S8B). Of all the DDX5-bound small intestine transcripts, seven experienced significant altered RNA expression in DDX5-deficient ileal IECs (Fig S9A). Increased expression of Fabp1, but not the others, significantly correlates with worse relapse-free survival in CRC patients (Fig S9B).
Figure S8. Immunoprecipitation of small intestine DDX5 for eCLIPseq analysis.
(A) Western confirmation of efficient immunoprecipitation of DDX5 from two independent small intestine intestinal epithelial cell lysates. (B) DDX5 binding preferences identified by eCLIPseq on different RNA regions in small intestine intestinal epithelial cells. Background (Bkg) is defined as the RNA regions in the annotated mouse transcriptome from GENCODE.
Figure S9. Identifying DDX5-regulated small intestine targets involved in tumorigenesis.
(A) Workflow to identify DDX5 direct targets in small intestine intestinal epithelial cells involved in tumorigenesis. (B) PROGgeneV2 view of relapse-free survival (GSE17536) in CRC patient cohort divided at median of each gene expression.
Table S7 DDX5 eCLIP targets in small intestine intestinal epithelial cells. (79.7KB, xlsx)
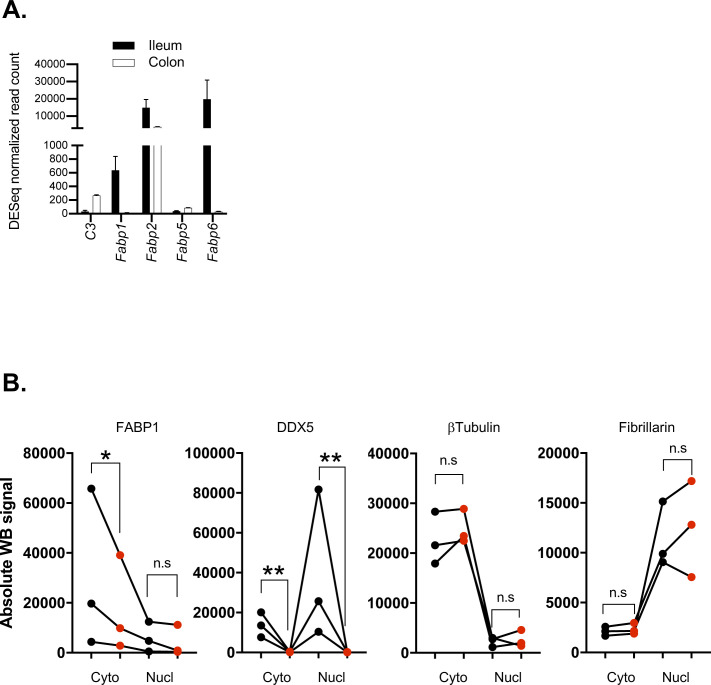
Fabp1 encodes FABP1 and is uniquely found in the small intestine IECs (Fig S10A), consistent with previous reports (51, 52). Knocking out FABP1 in mice protects against small intestine tumorigenesis (10), which phenocopied our observations in the DDX5ΔIEC mice. On the Fabp1 RNA, DDX5 localized to a region encoded by exon 2 (Fig 5C). Fabp1 mRNA and its protein were significantly reduced in DDX5-deficient small intestine IECs (Figs 5D and E and S10B). Transcripts coding for other members of the FABP family were DDX5 independent, suggesting a unique regulation of Fabp1 by DDX5. Similar abundance of mature Fabp1 mRNAs was found in the nucleus of WTIEC and DDX5ΔIEC IECs, but cytoplasmic mature Fabp1 mRNAs were significantly lowered in the DDX5ΔIEC IECs (Fig 5F). These results suggest that DDX5 binds to and promotes Fabp1 mRNA stability in small intestine IECs. Last, we asked whether binding of DDX5 to Fabp1 mRNAs in the small intestine IECs may also affect ribosome recruitment for protein translation. We found that ribosomal engagement of Fabp1 mRNA in the small intestine was significantly decreased in cells from DDX5ΔIEC mice (Fig 5G). Together, these results reveal that DDX5 regulates unique IEC targets through overlapping and distinct posttranscriptional mechanisms (modeled in Fig 5H).
Figure S10. Quantification of protein expression in WTIEC and DDX5ΔIEC small intestine intestinal epithelial cells (IECs).
(A) Normalized RNAseq read counts of transcripts encoding C3 and members of the FABP family in the ileum and colon of steady-state WT mice. RNAseq was performed on ileal and colonic IECs from two independent WT mice. Data shown are normalized read count means ± SD. (B) Quantification (LiCoR: ImageStudio) of the Western blot signals from Fig 5E (Nucl, nuclear; Cyto, cytoplasmic fractions). Dots represent the quantification from each independent experiment. n = 3. *P < 0.05, **P < 0.01, n.s., not significant (paired t test).
Discussion
CRC is the fourth most deadly cancer worldwide (53), where DDX5 is often mutated and/or overexpressed (54). The higher expression of DDX5 predicts poor patient survival (25, 26, 27). Here, we demonstrated that knocking out DDX5 in IECs in two models resulted in lower tumor counts. Interestingly, tumors that escaped DDX5 regulation had comparable size as those found in WT animals on day 120, indicating that DDX5 plays a more critical role during tumor initiation and that other regulators can compensate for its loss at the later phase of tumor growth in vivo. We observed that mRNAs encoding other DDX members with structural similarities to DDX5, such as DDX17, are also highly expressed in the intestinal epithelium (Fig 1A). Future studies will be needed to examine whether other DDXs have similar or unique roles in the context of intestinal physiology and pathology.
The characterization of the in vivo DDX5 RNA interactome and regulome uncovered several mechanistic surprises of DDX5 biology. First, we demonstrated that DDX5 preferentially localized to coding regions of RNAs, contributing to RNA stability and/or protein translation of its associated transcripts in mouse IECs. In contrast, previous study in cultured myelogenous leukemia cell line (K562) suggests that DDX5 binding on RNAs is preferentially localized to introns and 5′ UTRs (30, 31, 32, 55, 56). These results suggest that DDX5 binding to RNAs is likely tissue- and cell type specific. We speculate that such specificities may be achieved by DDX5 forming tissue-specific protein complexes with other partners yet to be identified. Future proteomics studies will be needed to uncover the DDX5 protein interactomes in different tissues to address this possibility.
In this study, we focused our mechanistic experiments on two novel targets of DDX5, C3 and Fabp1. Here, we demonstrated that DDX5 binds to and promotes C3 mRNA stability in colonic IECs. In the small intestine, DDX5 binds to Fabp1 transcripts, enhancing cytoplasmic RNA levels, and facilitating ribosome engagement to augment the synthesis of FABP1 protein. It remains to be investigated whether the helicase activity of DDX5 is involved in these regulations of epithelial RNA stability and protein translation.
C3 is a potent inducer of the Wnt/β–catenin cascade. DDX5 regulation of C3 uncovered a previously unappreciated role of DDX5 as an upstream regulator of Wnt/β–catenin signaling pathway. Whereas C3 is uniquely expressed in colonic IECs, FABP1 is expressed in the small intestine only. Future studies are needed to investigate the molecular mechanism underlying the region-specific expression of C3 and Fabp1 mRNAs observed here (Fig S10A). Regulation of FABP1 by DDX5 revealed a surprising role of DDX5 in intestinal lipid homeostasis. Highly proliferative cells, such as those found in tumor lesions, require large amounts of fatty acid building blocks from exogenous sources and/or de novo synthesis to sustain the building of cell membranes and organelles. For example, previous reports suggest that the up-regulation of acyl-CoA synthetase long chain family member 4 (ACSL4) promotes tumor cell survival in human colon adenocarcinomas (57), and that fatty acid–binding proteins can channel lipids from surrounding tissues to fuel further tumor growth (58). Future epistasis experiments will be needed to definitively test the contributions of C3, FABP1, and/or other targets acting downstream of DDX5 to promote intestinal inflammation and tumorigenesis. In summary, DDX5 posttranscriptionally orchestrates intestinal RNA programs and drive colitis and intestinal cancers.
Materials and Methods
Mice
C57BL/6 wild-type (Stock No: 000664) and Villin1Cre (Stock No: 021504) mice were obtained from The Jackson Laboratory. Ddx5flox mice were obtained from Dr. Frances Fuller-Pace’s Laboratory and have been previously described in references 59 and 60. Heterozygous mice were bred to yield 6–8-wk-old Ddx5+/+ Villin1Cre+ (subsequently referred to as wild-type, WTIEC) and Ddx5fl/fl Villin1Cre+ (referred to as DDX5ΔIEC) littermates for experiments related to understanding the role of DDX5 in IECs in both the small intestine and colon. Apcflox mice were obtained from Dr. Eric Fearon’s Laboratory and previously described in reference 44. For our colonic tumor model, Apcfl/+ Ddx5+/+ Cdx2Cre+ and Apcfl/+ Ddx5fl/+ Cdx2Cre+ (referred as APCΔcIECDDX5WT), as well as Apcfl/+ Ddx5fl/fl Cdx2Cre+ (APCΔcIEC DDX5ΔcIEC) cohoused littermates were used. For our small intestine tumor model, Apcfl/+ Ddx5+/+ Villin1Cre+ and Apcfl/+ Ddx5fl/+ Villin1Cre+ (referred as APCΔIEC DDX5WT), and Apcfl/+ Ddx5fl/fl Villin1Cre+ (APCΔIEC DDX5ΔIEC) cohoused littermates were used. All animal studies were approved and followed the Institutional Animal Care and Use Guidelines of the University of California San Diego.
Epithelial cell harvest
Steady-state intestinal epithelial and lamina propria cells were harvested as previously described (61). Briefly, after removing mesenteric fat and Peyer’s patches, the proximal 1/3, middle 1/3, and distal 1/3 of the small intestine were designated as the duodenum, jejunum, and ileum, respectively. To isolate IECs, intestine tissues were first incubated in 5 mM EDTA in HBSS containing 1 mM DTT for 20 min at 37°C with shaking, and then incubated in a second wash of 5 mM EDTA in HBSS without DTT for 20 min at 37°C with agitation. Suspended cells from the EDTA washes were pooled as “IECs.” Colons were processed similarly.
Histology and IHC
Ileal and colonic tissues were fixed overnight in 10% formalin at room temperature. Paraffin-embedded tissues were sectioned into 5-μm slices, stained with H&E, periodic acid-Schiff, or IHC (see Table S4 for antibody information). Briefly, paraffin sections were de-paraffinized and rehydrated with TBST washes between each step (Tris-buffered saline, pH 7.8, with 0.1% Tween-20). Sections were blocked first against endogenous peroxidases (immersed for 30 min in 0.3% H2O2) and then blocked against endogenous biotin using unlabeled streptavidin and excess free biotin. Antigen retrieval was induced by heating the slide for 5 min twice in 10 mM sodium citrate buffer, pH 6.0, followed by 20 min of cooling. Finally, the sections were blocked against nonspecific hydrophobic interactions with 1% BSA/TBST. Staining was then performed with either the negative control IgG antibody or anti-DDX5 and anti-Ki67 (1:100) antibodies overnight in a humid chamber at 4°C. The next day, the sections were washed with TBST and then sequentially overlaid with biotinylated goat anti-rabbit (111-065-045; Jackson ImmunoResearch) at 1:500, followed by HRP-labeled streptavidin (16-030-084; Jackson ImmunoResearch) at 1:500. Substrate was then overlaid (AEC from Vector labs following directions) for 30 min followed by nuclear counterstain with Mayer’s hematoxylin. Images were acquired using the AT2 Aperio Scan Scope (UCSD Moores Cancer Center Histology Core).
Western blot
For whole cell lysates, cells were lysed in 25 mM Tris, pH 8.0, 100 mM NaCl, and 0.5% NP40 with protease inhibitors for 30 min on ice. Samples were spun down at 14,000g for 15 min, and soluble protein lysates were harvested. The NE-PER kit (Thermo Fisher Scientific) was used for cytoplasmic and nuclear fractionation studies. 30–50 μg protein was loaded on each lane. Blots were blocked in Odyssey Blocking Buffer (LI-COR) and probed for the desired proteins. After incubation with respective IRDye secondary antibody (LI-COR), infrared signals on each blot were measured on the LI-COR Odyssey CLX. The primary antibodies used in this study are listed in Table S4.
cDNA synthesis and qRT-PCR
Total RNA was extracted with the RNeasy Plus Kit (QIAGEN) and reverse-transcribed using iScriptΪ Select cDNA Synthesis Kit (Bio-Rad). Real-time RT-PCR was performed using iTaq Universal SYBR Green Supermix (Bio-Rad). For IECs and tumor RNA expression, data were normalized to Gapdh. Primers were designed using Primer-BLAST to span across splice junctions, resulting in PCR amplicons that span at least one intron. Primer sequences are listed in Table S8.
Table S8 List of target genes and primer sequences used for their detection. (9.7KB, xlsx)
RNAseq
Ribosome-depleted RNAs were used to prepare sequencing libraries. 100-bp paired-end sequencing was performed on an Illumina HiSeq4000 by the Institute of Genomic Medicine (IGM) at the University of California San Diego. Each sample yielded ∼30–40 million reads. Paired-end reads were aligned to the mouse mm10 genome with the STAR aligner version 2.6.1a (62) using the parameters: “--outFilterMultimapNmax 20 --alignSJoverhangMin 8 --alignSJDBoverhangMin 1 --outFilterMismatchNmax 999 --outFilterMismatchNoverReadLmax 0.04 --alignIntronMin 20 --alignIntronMax 1000000 --alignMatesGapMax 1000000.” Uniquely mapped reads overlapping with exons were counted using featureCounts (63) for each gene in the GENCODE.vM19 annotation. Differential expression analysis was performed using DESeq2 (v1.18.1 package) (64), including a covariate in the design matrix to account for differences in harvest batch/time points. Regularized logarithm (rlog) transformation of the read counts of each gene was carried out using DESeq2. Pathway analysis was performed on differentially expressed protein coding genes with minimal counts of 10, log2 fold change cutoffs of ≥0.5 or ≤−0.5, and P-values < 0.05 using Gene Ontology (http://www.geneontology.org/) where all expressed genes in the specific cell type were set as background.
Gene set enrichment analysis was carried out using the pre-ranked mode of the gene set enrichment analysis software with default settings (55, 65). The gene list from DEseq2 was ranked by calculating a rank score of each gene as −log10(P-value) × sign (log2 FoldChange), in which FoldChange is the fold change of expression in DDX5ΔIEC over those found in WTIEC.
Enhanced cross-linked immunoprecipitation (eCLIPseq)
eCLIPseq analysis was performed as previously described (50). For IEC eCLIPseq, the cells were isolated from two 8–10-wk-old wild-type (C57BL/6) female mice, as described above, and 50 million cells from each mouse were used in the two biological replicates. The cells were subjected to UV-mediated cross-linking, lysis, and treatment with limiting amounts of RNases, followed by IP of the DDX5-containing RNA complexes. RNA fragments protected from RNase digestion were subjected to RNA linker ligation, reverse-transcription, and DNA linker ligation to generate eCLIPseq libraries for high-throughput Illumina sequencing.
Peak regions were defined using CLIPper first on the IP sample (https://github.com/YeoLab/clipper/wiki/CLIPper-Home). Enrichment was calculated using both the IP and input samples. Log2 fold change was calculated as eCLIPseq reads normalized for read depth over normalized reads found at each peak region in the size-matched input sample. ENCODE Irreproducible Discovery Rate analysis was performed on two independent biological replicates of IECs. Peaks were ranked using the entropy formula, Pi*log(Pi/Qi)/log2, where Pi is the probability of an eCLIPseq read at that position and Qi is the probability of input reads at that position. Results were filtered using cutoffs of three for both log10 P-values and log2 fold changes, respectively, to define a set of true peaks normalized above their respective size-matched input background signal.
ChIP
ChIP was carried out as described previously (56). Briefly, 20 million intestinal IECs were fixed with 1% formaldehyde at room temperature for 10 min and quenched with 125 mM glycine for 5 min at room temperature. All buffer compositions were described in reference 56. Nuclear lysates were sonicated with a Bioruptor (Branson Sonifier Cell Disruptor 185) at 4°C using the output setting at 4 for 10 cycles of 30 s on and 30 s off. 30 μg of chromatin was used per IP. Chromatin was diluted 10× in ChIP dilution buffer supplemented with proteinase inhibitor. 5% of the total chromatin used per IP reaction was saved as input samples. 5 μg of antibody was added per 30 μg chromatin per IP reaction and incubated overnight at 4°C. The immune complexes were then incubated with 30 μl of Dynabeads Protein G (10004D; Thermo Fisher Scientific) for 4 h at 4°C on rotation. After washes, protein–DNA complexes were eluted from the beads by adding 200 μl of elution buffer and incubating the beads at 65°C for 15 min with constant shaking at 1,000g. Eluted samples were incubated at 37°C for 30 min with 1 μl of DNase and protease-free RNase A (10 mg/ml, EN0531; Thermo Fisher Scientific). DNA and protein cross-links were reversed by adding 8 μl of i NaCL and 2 μl of proteinase K solution (20 mg/ml, AM2546; Thermo Fisher Scientific) by overnight incubation at 65°C under constant shaking. Chromatin was isolated using QIAGEN QIAquick PCR Purification Kit (28104) and eluted in 40 μl elution buffer. Input samples were diluted five times to make a 1% input control. The ChIP signals were calculated as follows: Adjusted input = Ct (Input) − 6.644. ChIP signal = 100 × Power (2; average of adjusted Input-Ct value ChIP sample). All ChIP qPCR primers are listed in Table S8.
Ribosome pull-down assay
Small intestine or colonic IECs were lysed in polysome extraction buffer (10 mM Hepes, pH 7.4, 150 mM KCl, 5 mM MgCl2, 1% NP40, 2 mM dithiothreitol, 80 U/ml RNaseOUT, 100 μg/ml cycloheximide, and protease inhibitors). Cell extracts were subject to anti-ribosome IP overnight with 2 μg anti-RPL10A antibodies (Abcam) and harvested in Protein G magnetic Dynabeads (Invitrogen) as described previously (66). cDNAs were synthesized from purified RNA using Superscript III (Invitrogen). Level of RPL10A associated transcripts in pull-down was calculated as fraction of input for each sample.
DSS-induced colitis
Mice were provided 2% (wt/vol) DSS (160110; MP Biomedicals) in their drinking water for 7 d, followed by 7 d of access to regular drinking water. Mice were monitored daily for their weight and tissues were harvested on day 15 post-DSS treatment. Pathology scoring of distal colon from DSS-challenged mice was performed blind by JE Hernandez following previously published guidelines (67), including parameters for inflammatory infiltrate, crypt density, crypt hyperplasia, muscle thickening, and submucosal inflammation.
Intestine organoid cultures
Isolated colonic crypts were embedded in Corning Matrigel Matrix Corning Matrigel GFR Membrane Matrix (CB40230C; Thermo Fisher Scientific) and seeded onto pre-warmed 24-well plates (CytoOne) and overlaid with conditioned media as described in reference 68. The organoid images were acquired using fluorescence microscopy (11350119; Thermo Fisher Scientific).
RNAi in human IECs
Caco-2 cell line was cultured in 1× DMEM/F12 media (Gibco, Life Technologies). The media were supplemented with 1× 10% FBS (Gibco, Life Technologies), 1 mM sodium pyruvate (Gibco, Life Technologies) and 1% penicillin streptomycin (Gibco, Life Technologies). Cells were plated on a 24-well plate at 500 liters/well at 2 × 10⁵ cells/ml 1 d before transfection. 50 μM human DDX5 siRNA pool (Cat. no. D-003774-02, D-003774-03, D-003774-04, D-003774-17; GE Healthcare Dharmacon, see Table S9) or scramble siRNA pool (Cat. no. D-001206-14-05; GE Healthcare Dharmacon, see Table S9) were mixed with Opti-MEM medium and Lipofectamine 3000 (L3000001; Invitrogen) reagent according to the manufacturer’s protocol. Solutions were vortexed and incubated for 5 min at room temperature to allow the formation of siRNA–lipid complex. 50 μl of transfection/siRNA (final concentration of 100 nM) mixture was added to the well and incubated at 37°C. Transcription inhibitor, flavopiridol, was purchased from Sigma-Aldrich (F3055). After incubation for 48 h, the cells were treated with DMSO or flavopiridol (2 μM) and were collected 16 h posttreatment. RNA extraction and qRT-PCR were carried out as described above.
Table S9 List of scramble control siRNA and siRNA sequences used to target human DDX5. (10.3KB, xlsx)
Luciferase assay
The psiCheck2 construct containing dual Renilla and Firefly luciferase reporters was purchased from Promega (Promega). The DDX5-bound sequence on Fabp1 was cloned into a multiple cloning site located downstream of the Renilla translational stop codon. SW480 cells were cultured in 1× DMEM/F12 media (Gibco, Life Technologies). 1× 10% FBS (Gibco, Life Technologies), 1 mM sodium pyruvate (Gibco, Life Technologies) and 1% penicillin streptomycin (Gibco, Life Technologies) were added. The cells were plated on a 96-well plate at 0.5 × 10⁵ cells/ml 1 d before transfection. 100 nM of siCTL or the human DDX5 siRNA pool were introduced to SW480 cells using Lipofectamine 3000 (L3000001; Invitrogen) in Opti-MEM medium according to the manufacturer’s protocol. The transfection mixture was incubated at room temperature for 5 min. 10 μl of the transfection mixture was added to each well and incubated at 37°C for 24 h. 1 μg of psiCheck2 luciferase reporter plasmids were transfected with Lipofectamine 3000 and 1 μl P3000 enhancer reagent in the Opti-MEM medium. After 24 h, the cell lysates were used to measure both Renilla and firefly activities using the Dual-Luciferase Reporter Assay System (Promega) according to the manufacturer’s instructions.
Kaplan–Meier analysis
Top 20 DDX5-dependent genes were selected based on two criteria: log2 FoldChange < −1 (down-regulated in DDX5-deficient colonic IECs) and adjusted P-value < 0.05. Gene expression values were normalized according to a modified Z-score approach centered around StepMiner threshold (formula = (expr − SThr)/3*stddev). A composite gene expression score is computed based on linear combination of normalized and z-scored scaled expression values. StepMiner algorithm (69) is used to classify the final score into high and low values. Kaplan–Meier analysis of disease-free survival in two independent cohorts reveal strong (Pooled gene expression omibus [GEO]: GSE13067, GSE14333, GSE17538, GSE31595, GSE37892, GSE33113, n = 555, P = 0.0014; GSE87211, n = 351, P = 0.044) association between 20 down-regulated gene signatures and worse outcome. Progression-free survival analysis were performed on the mCRC GSE5851 dataset (P = 0.014).
Accession numbers
The accession numbers for the small intestine and colon eCLIPseq results reported in this article are available on GEO (GSE124023). The IEC RNAseq datasets are available on GEO (GSE123881).
Statistical analysis
All values are presented as mean ± SD. Significant differences were evaluated using GraphPad Prism 8 software. The t test was used to determine significant differences between two groups. A two-tailed P-value of <0.05 was considered statistically significant in all experiments.
Supplementary Material
Acknowledgements
We thank Eric Fearon for sharing the APC conditional mutant mice previously described in reference 44. We thank Frances Fuller-Pace for sharing the DDX5 conditional mutant mice previously described in reference 60. We thank Giuseppe Di Caro for Apc mouse colony breeding advice. We thank Jean YJ Wang for critical reading of this manuscript. N Abbasi, T Long, Y Li, BS Cho, E Ma, PR Patel, and WJM Huang are partially funded by the Edward Mallinckrodt, Jr. Foundation and the National Institutes of Health (NIH) (R01 GM124494 to WJM Huang). JE Hernandez is funded by NIH (R01 GM124494-03S1 to WJM Huang). BA Yee and GW Yeo are partially funded by NIH (R01 HG004659 and U41 HG009889 to GW Yeo). D Sahoo is partially supported by NIH (R01 GM138385, R00 CA151673 to D Sahoo, and UG3 TR002968), and Padres Pedal the Cause/Rady Children’s Hospital Translational PEDIATRIC Cancer Research Award (#PTC2017), Padres Pedal the Cause/C3 Collaborative Translational Cancer Research Award (San Diego NCI Cancer Centers Council [C3] #PTC2017) and the Leonna M Helmsley Charitable Trust. IM Sayed and S Das are partially funded by NIH (R01 DK107585 to S Das and UG3 TR002968), the DiaComp Pilot and Feasibility award to S Das (Augusta University) and the Leonna M Helmsley Charitable Trust. P Ghosh is supported by NIH (R01 AI141630 to P Ghosh and UG3 TR002968), and the Leonna M Helmsley Charitable Trust. RNAseq was conducted at the IGM Genomics Center, University of California San Diego, with support from NIH (S10 OD026929). We thank the UC San Diego HUMANOID Core and the Moores Cancer Center Histology Core Tissue Technology Shared Resource for the IHC analysis, supported by NIH (P30 CA23100).
Author Contributions
N Abbasi: formal analysis, validation, visualization, and writing—original draft, review, and editing.
T Long: data curation, formal analysis, validation, and writing—review and editing.
Y Li: data curation, software, formal analysis, and methodology.
BA Yee: data curation, software, and formal analysis.
BS Cho: data curation, formal analysis, and writing—review and editing.
JE Hernandez: data curation, formal analysis, and writing—review and editing.
E Ma: formal analysis.
PR Patel: formal analysis and writing—review and editing.
D Sahoo: formal analysis and visualization.
IM Sayed: conceptualization and writing—review and editing.
N Varki: data curation and formal analysis.
S Das: conceptualization, supervision, and writing—review and editing.
P Ghosh: conceptualization, supervision, funding acquisition, visualization, and writing—review and editing.
GW Yeo: conceptualization, supervision, funding acquisition, and writing—original draft, review, and editing.
WJM Huang: conceptualization, data curation, formal analysis, supervision, funding acquisition, visualization, and writing—original draft, review, and editing.
Conflict of Interest Statement
GW Yeo is co-founder, member of the Board of Directors, on the Science Advisory Board, equity holder, and paid consultant for Locanabio and Eclipse BioInnovations. GW Yeo is a visiting professor at the National University of Singapore. GW Yeo’s interests have been reviewed and approved by the University of California San Diego in accordance with its conflict of interest policies. All other authors declare that they have no conflict of interest.
References
- 1.Samstad EO, Niyonzima N, Nymo S, Aune MH, Ryan L, Bakke SS, Lappegard KT, Brekke OL, Lambris JD, Damas JK, et al. (2014) Cholesterol crystals induce complement-dependent inflammasome activation and cytokine release. J Immunol 192: 2837–2845. 10.4049/jimmunol.1302484 [DOI] [PMC free article] [PubMed] [Google Scholar]
- 2.Mizutani N, Goshima H, Nabe T, Yoshino S (2012) Complement C3a-induced IL-17 plays a critical role in an IgE-mediated late-phase asthmatic response and airway hyperresponsiveness via neutrophilic inflammation in mice. J Immunol 188: 5694–5705. 10.4049/jimmunol.1103176 [DOI] [PubMed] [Google Scholar]
- 3.Liu Y, Wang K, Liang X, Li Y, Zhang Y, Zhang C, Wei H, Luo R, Ge S, Xu G (2018) Complement C3 produced by macrophages promotes renal fibrosis via IL-17A secretion. Front Immunol 9: 2385 10.3389/fimmu.2018.02385 [DOI] [PMC free article] [PubMed] [Google Scholar]
- 4.Leon F, Contractor N, Fuss I, Marth T, Lahey E, Iwaki S, la Sala A, Hoffmann V, Strober W, Kelsall BL (2006) Antibodies to complement receptor 3 treat established inflammation in murine models of colitis and a novel model of psoriasiform dermatitis. J Immunol 177: 6974–6982. 10.4049/jimmunol.177.10.6974 [DOI] [PubMed] [Google Scholar]
- 5.Lu F, Fernandes SM, Davis AE 3rd (2010) The role of the complement and contact systems in the dextran sulfate sodium-induced colitis model: The effect of C1 inhibitor in inflammatory bowel disease. Am J Physiol Gastrointest Liver Physiol 298: G878–G883. 10.1152/ajpgi.00400.2009 [DOI] [PubMed] [Google Scholar]
- 6.Ning C, Li YY, Wang Y, Han GC, Wang RX, Xiao H, Li XY, Hou CM, Ma YF, Sheng DS, et al. (2015) Complement activation promotes colitis-associated carcinogenesis through activating intestinal IL-1beta/IL-17A axis. Mucosal Immunol 8: 1275–1284. 10.1038/mi.2015.18 [DOI] [PubMed] [Google Scholar]
- 7.Pio R, Corrales L, Lambris JD (2014) The role of complement in tumor growth. Adv Exp Med Biol 772: 229–262. 10.1007/978-1-4614-5915-6_11 [DOI] [PMC free article] [PubMed] [Google Scholar]
- 8.Gajda AM, Storch J (2015) Enterocyte fatty acid-binding proteins (FABPs): Different functions of liver and intestinal FABPs in the intestine. Prostaglandins Leukot Essent Fatty Acids 93: 9–16. 10.1016/j.plefa.2014.10.001 [DOI] [PMC free article] [PubMed] [Google Scholar]
- 9.Thumser AE, Moore JB, Plant NJ (2014) Fatty acid binding proteins: Tissue-specific functions in health and disease. Curr Opin Clin Nutr Metab Care 17: 124–129. 10.1097/mco.0000000000000031 [DOI] [PubMed] [Google Scholar]
- 10.Dharmarajan S, Newberry EP, Montenegro G, Nalbantoglu I, Davis VR, Clanahan MJ, Blanc V, Xie Y, Luo J, Fleshman JW Jr, et al. (2013) Liver fatty acid-binding protein (L-Fabp) modifies intestinal fatty acid composition and adenoma formation in ApcMin/+ mice. Cancer Prev Res (Phila) 6: 1026–1037. 10.1158/1940-6207.capr-13-0120 [DOI] [PMC free article] [PubMed] [Google Scholar]
- 11.Barnum SR, Jones JL, Benveniste EN (1993) Interleukin-1 and tumor necrosis factor-mediated regulation of C3 gene expression in human astroglioma cells. Glia 7: 225–236. 10.1002/glia.440070306 [DOI] [PubMed] [Google Scholar]
- 12.Sheerin NS, Zhou W, Adler S, Sacks SH (1997) TNF-alpha regulation of C3 gene expression and protein biosynthesis in rat glomerular endothelial cells. Kidney Int 51: 703–710. 10.1038/ki.1997.101 [DOI] [PubMed] [Google Scholar]
- 13.Barnum SR, Jones JL (1995) Differential regulation of C3 gene expression in human astroglioma cells by interferon-gamma and interleukin-1 beta. Neurosci Lett 197: 121–124. 10.1016/0304-3940(95)11923-k [DOI] [PubMed] [Google Scholar]
- 14.Cho MS, Rupaimoole R, Choi HJ, Noh K, Chen J, Hu Q, Sood AK, Afshar-Kharghan V (2016) Complement component 3 is regulated by TWIST1 and mediates epithelial-mesenchymal transition. J Immunol 196: 1412–1418. 10.4049/jimmunol.1501886 [DOI] [PMC free article] [PubMed] [Google Scholar]
- 15.Hernandez-Encinas E, Aguilar-Morante D, Morales-Garcia JA, Gine E, Sanz-SanCristobal M, Santos A, Perez-Castillo A (2016) Complement component 3 (C3) expression in the hippocampus after excitotoxic injury: Role of C/EBPbeta. J Neuroinflammation 13: 276 10.1186/s12974-016-0742-0 [DOI] [PMC free article] [PubMed] [Google Scholar]
- 16.Li J, Pircher PC, Schulman IG, Westin SK (2005) Regulation of complement C3 expression by the bile acid receptor FXR. J Biol Chem 280: 7427–7434. 10.1074/jbc.m411473200 [DOI] [PubMed] [Google Scholar]
- 17.Mogilenko DA, Kudriavtsev IV, Shavva VS, Dizhe EB, Vilenskaya EG, Efremov AM, Perevozchikov AP, Orlov SV (2013) Peroxisome proliferator-activated receptor alpha positively regulates complement C3 expression but inhibits tumor necrosis factor alpha-mediated activation of C3 gene in mammalian hepatic-derived cells. J Biol Chem 288: 1726–1738. 10.1074/jbc.m112.437525 [DOI] [PMC free article] [PubMed] [Google Scholar]
- 18.Staloch LJ, Divine JK, Witten JT, Simon TC (2005) C/EBP and Cdx family factors regulate liver fatty acid binding protein transgene expression in the small intestinal epithelium. Biochim Biophys Acta 1731: 168–178. 10.1016/j.bbaexp.2005.08.014 [DOI] [PubMed] [Google Scholar]
- 19.Bosse T, Piaseckyj CM, Burghard E, Fialkovich JJ, Rajagopal S, Pu WT, Krasinski SD (2006) Gata4 is essential for the maintenance of jejunal-ileal identities in the adult mouse small intestine. Mol Cell Biol 26: 9060–9070. 10.1128/mcb.00124-06 [DOI] [PMC free article] [PubMed] [Google Scholar]
- 20.Jadoon A, Cunningham P, McDermott LC (2015) Regulation of fatty acid binding proteins by hypoxia inducible factors 1alpha and 2alpha in the placenta: Relevance to pre-eclampsia. Prostaglandins Leukot Essent Fatty Acids 93: 25–29. 10.1016/j.plefa.2014.09.004 [DOI] [PubMed] [Google Scholar]
- 21.Chen C, Fang R, Chou LC, Lowe AW, Sibley E (2012) PDX1 regulation of FABP1 and novel target genes in human intestinal epithelial Caco-2 cells. Biochem Biophys Res Commun 423: 183–187. 10.1016/j.bbrc.2012.05.113 [DOI] [PMC free article] [PubMed] [Google Scholar]
- 22.Landrier JF, Thomas C, Grober J, Duez H, Percevault F, Souidi M, Linard C, Staels B, Besnard P (2004) Statin induction of liver fatty acid-binding protein (L-FABP) gene expression is peroxisome proliferator-activated receptor-alpha-dependent. J Biol Chem 279: 45512–45518. 10.1074/jbc.m407461200 [DOI] [PubMed] [Google Scholar]
- 23.Pereira B, Billaud M, Almeida R (2017) RNA-binding proteins in cancer: Old players and new actors. Trends Cancer 3: 506–528. 10.1016/j.trecan.2017.05.003 [DOI] [PubMed] [Google Scholar]
- 24.Fuller-Pace FV. (2013) The DEAD box proteins DDX5 (p68) and DDX17 (p72): Multi-tasking transcriptional regulators. Biochim Biophys Acta 1829: 756–763. 10.1016/j.bbagrm.2013.03.004 [DOI] [PubMed] [Google Scholar]
- 25.Causevic M, Hislop RG, Kernohan NM, Carey FA, Kay RA, Steele RJ, Fuller-Pace FV (2001) Overexpression and poly-ubiquitylation of the DEAD-box RNA helicase p68 in colorectal tumours. Oncogene 20: 7734–7743. 10.1038/sj.onc.1204976 [DOI] [PubMed] [Google Scholar]
- 26.Lee H, Flaherty P, Ji HP (2013) Systematic genomic identification of colorectal cancer genes delineating advanced from early clinical stage and metastasis. BMC Med Genomics 6: 54 10.1186/1755-8794-6-54 [DOI] [PMC free article] [PubMed] [Google Scholar]
- 27.Cristescu R, Lee J, Nebozhyn M, Kim KM, Ting JC, Wong SS, Liu J, Yue YG, Wang J, Yu K, et al. (2015) Molecular analysis of gastric cancer identifies subtypes associated with distinct clinical outcomes. Nat Med 21: 449–456. 10.1038/nm.3850 [DOI] [PubMed] [Google Scholar]
- 28.Du C, Li DQ, Li N, Chen L, Li SS, Yang Y, Hou MX, Xie MJ, Zheng ZD (2017) DDX5 promotes gastric cancer cell proliferation in vitro and in vivo through mTOR signaling pathway. Sci Rep 7: 42876 10.1038/srep42876 [DOI] [PMC free article] [PubMed] [Google Scholar]
- 29.Ma Z, Feng J, Guo Y, Kong R, Ma Y, Sun L, Yang X, Zhou B, Li S, Zhang W, et al. (2017) Knockdown of DDX5 inhibits the proliferation and tumorigenesis in esophageal cancer. Oncol Res 25: 887–895. 10.3727/096504016x14817158982636 [DOI] [PMC free article] [PubMed] [Google Scholar]
- 30.Linder P, Jankowsky E (2011) From unwinding to clamping: The DEAD box RNA helicase family. Nat Rev Mol Cell Biol 12: 505–516. 10.1038/nrm3154 [DOI] [PubMed] [Google Scholar]
- 31.Lee YJ, Wang Q, Rio DC (2018) Coordinate regulation of alternative pre-mRNA splicing events by the human RNA chaperone proteins hnRNPA1 and DDX5. Genes Dev 32: 1060–1074. 10.1101/gad.316034.118 [DOI] [PMC free article] [PubMed] [Google Scholar]
- 32.Das M, Renganathan A, Dighe SN, Bhaduri U, Shettar A, Mukherjee G, Kondaiah P, Satyanarayana Rao MR (2018) DDX5/p68 associated lncRNA LOC284454 is differentially expressed in human cancers and modulates gene expression. RNA Biol 15: 214–230. 10.1080/15476286.2017.1397261 [DOI] [PMC free article] [PubMed] [Google Scholar]
- 33.Van Nostrand EL, Freese P, Pratt GA, Wang X, Wei X, Xiao R, Blue SM, Chen JY, Cody NAL, Dominguez D, et al. (2020) A large-scale binding and functional map of human RNA-binding proteins. Nature 583: 711–719. 10.1038/s41586-020-2077-3 [DOI] [PMC free article] [PubMed] [Google Scholar]
- 34.Giraud G, Terrone S, Bourgeois CF (2018) Functions of DEAD box RNA helicases DDX5 and DDX17 in chromatin organization and transcriptional regulation. BMB Rep 51: 613–622. 10.5483/BMBRep.2018.51.12.234 [DOI] [PMC free article] [PubMed] [Google Scholar]
- 35.Endoh H, Maruyama K, Masuhiro Y, Kobayashi Y, Goto M, Tai H, Yanagisawa J, Metzger D, Hashimoto S, Kato S (1999) Purification and identification of p68 RNA helicase acting as a transcriptional coactivator specific for the activation function 1 of human estrogen receptor alpha. Mol Cell Biol 19: 5363–5372. 10.1128/mcb.19.8.5363 [DOI] [PMC free article] [PubMed] [Google Scholar] [Retracted]
- 36.Wang Z, Luo Z, Zhou L, Li X, Jiang T, Fu E (2015) DDX5 promotes proliferation and tumorigenesis of non-small-cell lung cancer cells by activating beta-catenin signaling pathway. Cancer Sci 106: 1303–1312. 10.1111/cas.12755 [DOI] [PMC free article] [PubMed] [Google Scholar]
- 37.Mazurek A, Park Y, Miething C, Wilkinson JE, Gillis J, Lowe SW, Vakoc CR, Stillman B (2014) Acquired dependence of acute myeloid leukemia on the DEAD-box RNA helicase DDX5. Cell Rep 7: 1887–1899. 10.1016/j.celrep.2014.05.019 [DOI] [PMC free article] [PubMed] [Google Scholar]
- 38.Jensen ED, Niu L, Caretti G, Nicol SM, Teplyuk N, Stein GS, Sartorelli V, van Wijnen AJ, Fuller-Pace FV, Westendorf JJ (2008) p68 (Ddx5) interacts with Runx2 and regulates osteoblast differentiation. J Cell Biochem 103: 1438–1451. 10.1002/jcb.21526 [DOI] [PubMed] [Google Scholar]
- 39.Wortham NC, Ahamed E, Nicol SM, Thomas RS, Periyasamy M, Jiang J, Ochocka AM, Shousha S, Huson L, Bray SE, et al. (2009) The DEAD-box protein p72 regulates ERalpha-/oestrogen-dependent transcription and cell growth, and is associated with improved survival in ERalpha-positive breast cancer. Oncogene 28: 4053–4064. 10.1038/onc.2009.261 [DOI] [PMC free article] [PubMed] [Google Scholar]
- 40.Clark EL, Coulson A, Dalgliesh C, Rajan P, Nicol SM, Fleming S, Heer R, Gaughan L, Leung HY, Elliott DJ, et al. (2008) The RNA helicase p68 is a novel androgen receptor coactivator involved in splicing and is overexpressed in prostate cancer. Cancer Res 68: 7938–7946. 10.1158/0008-5472.can-08-0932 [DOI] [PMC free article] [PubMed] [Google Scholar]
- 41.Shin S, Rossow KL, Grande JP, Janknecht R (2007) Involvement of RNA helicases p68 and p72 in colon cancer. Cancer Res 67: 7572–7578. 10.1158/0008-5472.can-06-4652 [DOI] [PubMed] [Google Scholar]
- 42.Zhang M, Weng W, Zhang Q, Wu Y, Ni S, Tan C, Xu M, Sun H, Liu C, Wei P, et al. (2018) The lncRNA NEAT1 activates Wnt/beta-catenin signaling and promotes colorectal cancer progression via interacting with DDX5. J Hematol Oncol 11: 113 10.1186/s13045-018-0656-7 [DOI] [PMC free article] [PubMed] [Google Scholar]
- 43.Arijs I, De Hertogh G, Lemmens B, Van Lommel L, de Bruyn M, Vanhove W, Cleynen I, Machiels K, Ferrante M, Schuit F, et al. (2018) Effect of vedolizumab (anti-alpha4beta7-integrin) therapy on histological healing and mucosal gene expression in patients with UC. Gut 67: 43–52. 10.1136/gutjnl-2016-312293 [DOI] [PubMed] [Google Scholar]
- 44.Grivennikov SI, Wang K, Mucida D, Stewart CA, Schnabl B, Jauch D, Taniguchi K, Yu GY, Osterreicher CH, Hung KE, et al. (2012) Adenoma-linked barrier defects and microbial products drive IL-23/IL-17-mediated tumour growth. Nature 491: 254–258. 10.1038/nature11465 [DOI] [PMC free article] [PubMed] [Google Scholar]
- 45.Eaden JA, Abrams KR, Mayberry JF (2001) The risk of colorectal cancer in ulcerative colitis: A meta-analysis. Gut 48: 526–535. 10.1136/gut.48.4.526 [DOI] [PMC free article] [PubMed] [Google Scholar]
- 46.Hinoi T, Akyol A, Theisen BK, Ferguson DO, Greenson JK, Williams BO, Cho KR, Fearon ER (2007) Mouse model of colonic adenoma-carcinoma progression based on somatic Apc inactivation. Cancer Res 67: 9721–9730. 10.1158/0008-5472.can-07-2735 [DOI] [PubMed] [Google Scholar]
- 47.Wang K, Kim MK, Di Caro G, Wong J, Shalapour S, Wan J, Zhang W, Zhong Z, Sanchez-Lopez E, Wu LW, et al. (2014) Interleukin-17 receptor a signaling in transformed enterocytes promotes early colorectal tumorigenesis. Immunity 41: 1052–1063. 10.1016/j.immuni.2014.11.009 [DOI] [PMC free article] [PubMed] [Google Scholar]
- 48.Kwong LN, Dove WF (2009) APC and its modifiers in colon cancer. Adv Exp Med Biol 656: 85–106. 10.1007/978-1-4419-1145-2_8 [DOI] [PMC free article] [PubMed] [Google Scholar]
- 49.Fodde R, Edelmann W, Yang K, van Leeuwen C, Carlson C, Renault B, Breukel C, Alt E, Lipkin M, Khan PM, et al. (1994) A targeted chain-termination mutation in the mouse Apc gene results in multiple intestinal tumors. Proc Natl Acad Sci U S A 91: 8969–8973. 10.1073/pnas.91.19.8969 [DOI] [PMC free article] [PubMed] [Google Scholar]
- 50.Van Nostrand EL, Pratt GA, Shishkin AA, Gelboin-Burkhart C, Fang MY, Sundararaman B, Blue SM, Nguyen TB, Surka C, Elkins K, et al. (2016) Robust transcriptome-wide discovery of RNA-binding protein binding sites with enhanced CLIP (eCLIP). Nat Methods 13: 508–514. 10.1038/nmeth.3810 [DOI] [PMC free article] [PubMed] [Google Scholar]
- 51.McKinley ET, Sui Y, Al-Kofahi Y, Millis BA, Tyska MJ, Roland JT, Santamaria-Pang A, Ohland CL, Jobin C, Franklin JL, et al. (2017) Optimized multiplex immunofluorescence single-cell analysis reveals tuft cell heterogeneity. JCI Insight 2: e93487 10.1172/jci.insight.93487 [DOI] [PMC free article] [PubMed] [Google Scholar]
- 52.Haber AL, Biton M, Rogel N, Herbst RH, Shekhar K, Smillie C, Burgin G, Delorey TM, Howitt MR, Katz Y, et al. (2017) A single-cell survey of the small intestinal epithelium. Nature 551: 333–339. 10.1038/nature24489 [DOI] [PMC free article] [PubMed] [Google Scholar]
- 53.Dekker E, Tanis PJ, Vleugels JLA, Kasi PM, Wallace MB (2019) Colorectal cancer. Lancet 394: 1467–1480. 10.1016/s0140-6736(19)32319-0 [DOI] [PubMed] [Google Scholar]
- 54.Fuller-Pace FV, Moore HC (2011) RNA helicases p68 and p72: Multifunctional proteins with important implications for cancer development. Future Oncol 7: 239–251. 10.2217/fon.11.1 [DOI] [PubMed] [Google Scholar]
- 55.Mootha VK, Lindgren CM, Eriksson KF, Subramanian A, Sihag S, Lehar J, Puigserver P, Carlsson E, Ridderstrale M, Laurila E, et al. (2003) PGC-1alpha-responsive genes involved in oxidative phosphorylation are coordinately downregulated in human diabetes. Nat Genet 34: 267–273. 10.1038/ng1180 [DOI] [PubMed] [Google Scholar]
- 56.Deliard S, Zhao J, Xia Q, Grant SF (2013) Generation of high quality chromatin immunoprecipitation DNA template for high-throughput sequencing (ChIP-seq). J Vis Exp 74: 50286 10.3791/50286 [DOI] [PMC free article] [PubMed] [Google Scholar]
- 57.Chen WC, Wang CY, Hung YH, Weng TY, Yen MC, Lai MD (2016) Systematic analysis of gene expression alterations and clinical outcomes for long-chain acyl-coenzyme A synthetase family in cancer. PLoS One 11: e0155660 10.1371/journal.pone.0155660 [DOI] [PMC free article] [PubMed] [Google Scholar]
- 58.Nieman KM, Kenny HA, Penicka CV, Ladanyi A, Buell-Gutbrod R, Zillhardt MR, Romero IL, Carey MS, Mills GB, Hotamisligil GS, et al. (2011) Adipocytes promote ovarian cancer metastasis and provide energy for rapid tumor growth. Nat Med 17: 1498–1503. 10.1038/nm.2492 [DOI] [PMC free article] [PubMed] [Google Scholar]
- 59.Nicol SM, Bray SE, Derek Black H, Lorimore SA, Wright EG, Lane DP, Meek DW, Coates PJ, Fuller-Pace FV (2013) The RNA helicase p68 (DDX5) is selectively required for the induction of p53-dependent p21 expression and cell-cycle arrest after DNA damage. Oncogene 32: 3461–3469. 10.1038/onc.2012.426 [DOI] [PMC free article] [PubMed] [Google Scholar]
- 60.Bates GJ, Nicol SM, Wilson BJ, Jacobs AM, Bourdon JC, Wardrop J, Gregory DJ, Lane DP, Perkins ND, Fuller-Pace FV (2005) The DEAD box protein p68: A novel transcriptional coactivator of the p53 tumour suppressor. EMBO J 24: 543–553. 10.1038/sj.emboj.7600550 [DOI] [PMC free article] [PubMed] [Google Scholar]
- 61.Sano T, Huang W, Hall JA, Yang Y, Chen A, Gavzy SJ, Lee JY, Ziel JW, Miraldi ER, Domingos AI, et al. (2015) An IL-23R/IL-22 circuit regulates epithelial serum amyloid A to promote local effector Th17 responses. Cell 163: 381–393. 10.1016/j.cell.2015.08.061 [DOI] [PMC free article] [PubMed] [Google Scholar]
- 62.Dobin A, Davis CA, Schlesinger F, Drenkow J, Zaleski C, Jha S, Batut P, Chaisson M, Gingeras TR (2013) STAR: Ultrafast universal RNA-seq aligner. Bioinformatics 29: 15–21. 10.1093/bioinformatics/bts635 [DOI] [PMC free article] [PubMed] [Google Scholar]
- 63.Liao Y, Smyth GK, Shi W (2014) featureCounts: An efficient general purpose program for assigning sequence reads to genomic features. Bioinformatics 30: 923–930. 10.1093/bioinformatics/btt656 [DOI] [PubMed] [Google Scholar]
- 64.Love MI, Huber W, Anders S (2014) Moderated estimation of fold change and dispersion for RNA-seq data with DESeq2. Genome Biol 15: 550 10.1186/s13059-014-0550-8 [DOI] [PMC free article] [PubMed] [Google Scholar]
- 65.Subramanian A, Tamayo P, Mootha VK, Mukherjee S, Ebert BL, Gillette MA, Paulovich A, Pomeroy SL, Golub TR, Lander ES, et al. (2005) Gene set enrichment analysis: A knowledge-based approach for interpreting genome-wide expression profiles. Proc Natl Acad Sci U S A 102: 15545–15550. 10.1073/pnas.0506580102 [DOI] [PMC free article] [PubMed] [Google Scholar]
- 66.Heiman M, Kulicke R, Fenster RJ, Greengard P, Heintz N (2014) Cell type-specific mRNA purification by translating ribosome affinity purification (TRAP). Nat Protoc 9: 1282–1291. 10.1038/nprot.2014.085 [DOI] [PMC free article] [PubMed] [Google Scholar]
- 67.Koelink PJ, Wildenberg ME, Stitt LW, Feagan BG, Koldijk M, van’t Wout AB, Atreya R, Vieth M, Brandse JF, Duijst S, et al. (2018) Development of reliable, valid and responsive scoring systems for endoscopy and histology in animal models for inflammatory bowel disease. J Crohns Colitis 12: 794–803. 10.1093/ecco-jcc/jjy035 [DOI] [PMC free article] [PubMed] [Google Scholar]
- 68.Miyoshi H, Stappenbeck T (2013) In vitro expansion and genetic modification of gastrointestinal stem cells in spheroid culture. Nat Protoc 8: 2471–2482. 10.1038/nprot.2013.153 [DOI] [PMC free article] [PubMed] [Google Scholar]
- 69.Sahoo D, Dill DL, Tibshirani R, Plevritis SK (2007) Extracting binary signals from microarray time-course data. Nucleic Acids Res 35: 3705–3712. 10.1093/nar/gkm284 [DOI] [PMC free article] [PubMed] [Google Scholar]
Associated Data
This section collects any data citations, data availability statements, or supplementary materials included in this article.
Supplementary Materials
Source Data for Figure 1LSA-2020-00772_SdataF1.1.xlsx (8.8KB, xlsx) LSA-2020-00772_SdataF1.2.xlsx (7.7MB, xlsx) LSA-2020-00772_SdataF1.3.xlsx (42.4KB, xlsx) LSA-2020-00772_SdataF1.4.xlsx (10KB, xlsx)
Table S3 Gene Ontology pathway analysis of DDX5-dependent genes in the colon and ileum. (33.7KB, xlsx)
Source Data for Figure 2LSA-2020-00772_SdataF2.1.xlsx (8.3KB, xlsx) LSA-2020-00772_SdataF2.2.xlsx (8.7KB, xlsx) LSA-2020-00772_SdataF2.3.xlsx (8.5KB, xlsx) LSA-2020-00772_SdataF2.4.xlsx (8.6KB, xlsx) LSA-2020-00772_SdataF2.5.xlsx (8.4KB, xlsx)
Table S5 DDX5 eCLIP targets in colonic intestinal epithelial cells. (18.1KB, xlsx)
Source Data for Figure 3LSA-2020-00772_SdataF3.1.xlsx (8.3KB, xlsx) LSA-2020-00772_SdataF3.2.xlsx (8.4KB, xlsx) LSA-2020-00772_SdataF3.3.xlsx (8.4KB, xlsx) LSA-2020-00772_SdataF3.4.xlsx (8.7KB, xlsx)
Source Data for Figure 4LSA-2020-00772_SdataF4.1.xlsx (8.7KB, xlsx) LSA-2020-00772_SdataF4.2.xlsx (8.5KB, xlsx) LSA-2020-00772_SdataF4.3.xlsx (8.4KB, xlsx) LSA-2020-00772_SdataF4.4.xlsx (8.7KB, xlsx) LSA-2020-00772_SdataF4.5.xlsx (8.5KB, xlsx) LSA-2020-00772_SdataF4.6.xlsx (8.5KB, xlsx) LSA-2020-00772_SdataF4.7.xlsx (8.8KB, xlsx)
Source Data for Figure 5LSA-2020-00772_SdataF5.1.xlsx (8.5KB, xlsx) LSA-2020-00772_SdataF5.2.xlsx (8.5KB, xlsx) LSA-2020-00772_SdataF5.3.xlsx (8.3KB, xlsx)
Table S7 DDX5 eCLIP targets in small intestine intestinal epithelial cells. (79.7KB, xlsx)
Table S8 List of target genes and primer sequences used for their detection. (9.7KB, xlsx)
Table S9 List of scramble control siRNA and siRNA sequences used to target human DDX5. (10.3KB, xlsx)


