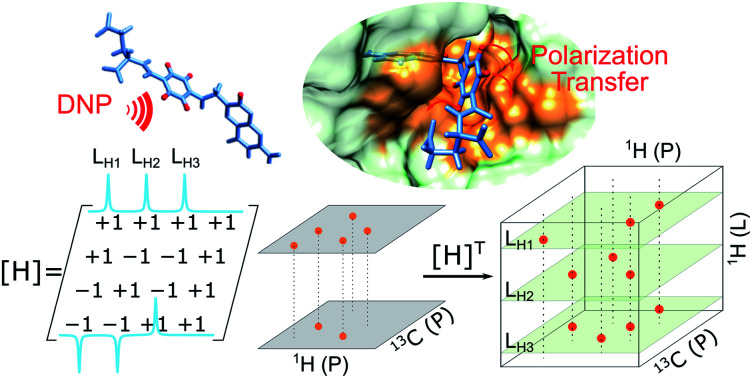
 The structure of a ligand bound to a protein is determined from fast pseudo-3D NMR spectroscopy with transfer of hyperpolarization.
Abstract
Elucidation of small molecule–protein interactions provides essential information for understanding biological processes such as cellular signaling, as well as for rational drug development. Here, multi-dimensional NMR with sensitivity enhancement by dissolution dynamic nuclear polarization (D-DNP) is shown to allow the determination of the binding epitope of folic acid when complexed with the target dihydrofolate reductase. Protein signals are selectively enhanced by polarization transfer from the hyperpolarized ligand. A pseudo three-dimensional data acquisition with ligand-side Hadamard encoding results in protein-side [13C, 1H] chemical shift correlations that contain intermolecular nuclear Overhauser effect (NOE) information. A scoring function based on this data is used to select pre-docked ligand poses. The top five poses are within 0.76 Å root-mean-square deviation from a reference structure for the encoded five protons, showing improvements compared with the poses selected by an energy-based scoring function without experimental inputs. The sensitivity enhancement provided by the D-DNP combined with multi-dimensional NMR increases the speed and potentially the selectivity of structure elucidation of ligand binding epitopes.
Introduction
Interactions of small molecules and proteins are the key components involved in many essential biological processes, including enzymatic catalysis, cellular signaling pathways, and regulation of protein functions.1–4 A comprehensive understanding of the structure and dynamics pertaining to these interactions is required to not only reveal the molecular mechanisms in biological processes, but also to provide the knowledge to develop synthetic small-molecule drugs that can alter the functions of the target proteins. Nuclear magnetic resonance (NMR) spectroscopy enables the non-invasive investigation of the intermolecular interactions in aqueous solution,5,6 and recent advances in live cell NMR7 has allowed to monitor molecular interactions directly in cellular environments.8–11
Observing magnetization transfer through the nuclear Overhauser effect (NOE) is a powerful NMR-based method to probe molecular structure, and has been widely applied for studying the water–protein12,13 or ligand–protein interactions.14 Dissolution dynamic nuclear polarization (D-DNP) is a hyperpolarization technique, which can boost the sensitivity of NMR signals by several orders of magnitude.15 The nuclear spin hyperpolarization, i.e. an enhanced, non-equilibrium population difference of nuclear Zeeman levels, is first generated by DNP in the solid state at low temperature. For this purpose, the analyte, in this case the ligand, is mixed with a free radical. Microwave irradiation of an electron spin transition through coupling to nuclear spins re-populates the nuclear energy levels. Subsequently, hyperpolarized aliquotes are rapidly dissolved with hot solvent and injected into an NMR spectrometer for liquid state measurement. Using the D-DNP to generate hyperpolarized spins serving as the NOE source, the efficiency of the NOESY measurement can be significantly improved. As a versatile technique, DNP is capable of hyperpolarizing a wide range of small molecules, including water and typical ligand molecules. In addition to accelerating an NMR experiment owing to the sensitivity gain, hyperpolarization of small molecules also provides a natural contrast for exclusively observing signals originating from the small molecule of interest.
Several applications have been demonstrated, where 1H spins of small molecules are hyperpolarized by dissolution DNP, and subsequently participate in polarization transfer to the protein or other small molecules through intermolecular NOEs. Interactions between water and protein can be directly studied by observing polarization transfer from hyperpolarized water to the protein. Hyperpolarization can be transferred to amide protons on the protein through proton exchange, and further spread within the protein through intramolecular NOE.16 By the same mechanisms, water molecules can serve as an agent to introduce hyperpolarization to the protein spins for subsequent use. This method has been applied to obtain high-resolution NMR spectra of intrinsically disordered proteins (IDPs),17 as well as folded proteins, using fast two-dimensional (2D) measurements.18 Further, our group has recently demonstrated the application of this method to measure protein signals during the folding process, which can provide insight into the structure and dynamics in protein folding.19
When a ligand is present in the protein solution, hyperpolarization from water can be transferred to the ligand, and used for the detection of binding.20 In addition, D-DNP can directly generate hyperpolarization on ligand spins. Protein mediated transfer of polarization from one hyperpolarized ligand to another, competing ligand, has been detected in the presence of the protein target, providing structural information about the ligand binding epitope.21 Polarization transferred from a hyperpolarized ligand can also be observed directly as selectively enhanced protein signals, revealing structural information related to the ligand–protein interaction.22,23
Knowledge of the protein–ligand complex structure provides essential information to guide the ligand optimization process in structure-based drug design (SBDD). Computational docking is a rapid and inexpensive method for predicting the orientation and conformation of the ligand when binding to the target protein. The integration of NMR restraints into docking calculations can further improve the prediction reliability and has emerged as a popular means in drug discovery.24,25 Ligand binding modes can be determined by integrating molecular docking with ligand-observed NMR measurements, including data from transferred NOE (trNOE),26 protein-mediated interligand NOE (INPHARMA),27 saturation transfer difference (STD),28 or a combination thereof.29 Molecular docking can also be combined with NMR experiments based on protein observation, including measurements of protein–ligand intermolecular NOEs30 or ligand-induced chemical shift perturbation (CSP).31,32 A common strategy for integrating docking with the above types of measurements consists of the generation of a set of possible ligand binding modes in silico, which are then ranked using the experimental data. In a further refinement of these methods, data-driven docking directly integrates experimental data into the docking algorithm.33–36
Protein–ligand intermolecular NOEs can provide specific atom-to-atom contacts, and hence even sparse information allows structure determination of the ligand–protein complex in the binding site through computational docking.37,38 A data-driven approach is the high ambiguity driven biomolecular docking method,39,40 where experimental intermolecular NOEs can be converted into ambiguous interaction restraints, which are used to guide the docking processes.37,41 Recently, a highly automated approach using intra-ligand NOEs and ambiguous intermolecular NOEs without protein chemical shift assignments, was shown to enable the determination of the ligand binding mode in a receptor binding pocket.42,43
Recently, we developed a method for the determination of ligand binding epitope structures by a combination of molecular docking and intermolecular NOEs obtained from a set of 1D hyperpolarized 1H NMR spectra.44 The sensitivity improvement provided by hyperpolarization thereby overcomes the long measurement time required for conventional NOE experiments. Here, we demonstrate that the efficiency of the NOE measurement is significantly improved by multi-dimensional NMR spectroscopy, which includes a 2D correlation of protein spins combined with Hadamard encoding of ligand signals in a third dimension. In the Hadamard spectroscopy,45 discrete chemical shifts are encoded in a small number of scans, making it suitable for use with hyperpolarization. The reconstructed pseudo-3D spectrum contains a similar level of information as would be available from conventional NMR spectra with longer acquisition time. The spectra are used to calculate the binding epitope structure of a ligand for the dihydrofolate reductase (DHFR) protein.
Results and discussion
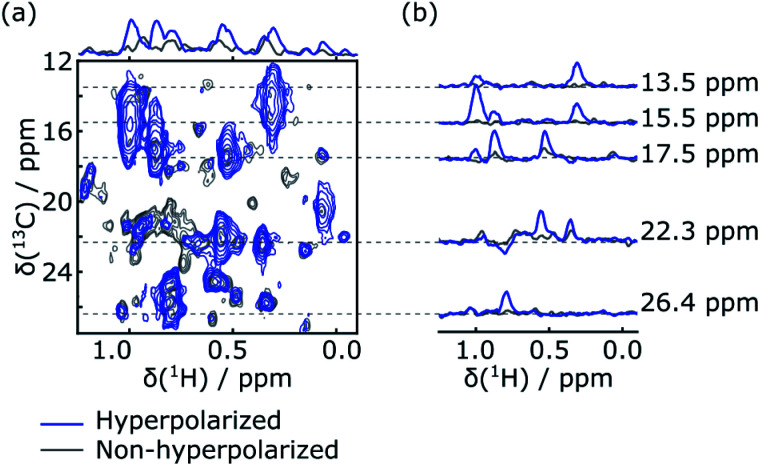
Rapid injection of the hyperpolarized ligand folic acid into the DHFR protein solution leads to selective polarization transfer from the ligand 1H spins to their nearby 1H spins on the protein. Signals resulting from this polarization transfer can be seen in the hyperpolarized 2D SOFAST-HMQC spectra shown in Fig. 1a. A spectrum with hyperpolarized ligand (blue) is compared to a spectrum acquired with the same sample and the same SOFAST-HMQC pulse sequence after hyperpolarization has decayed (gray). The spectra are acquired with selective 1H excitation of the side-chain methyl region only, to avoid consumption of the polarization of the ligand spins (2 ppm to 8.7 ppm) other than through the inevitable relaxation. In the spectrum with hyperpolarization, several strongly enhanced peaks are visible. This observation is confirmed by comparing the one-dimensional projections of the two spectra (Fig. 1a, top). The extent of peak overlap in the projection however illustrates the necessity for acquiring the 2D data. In Fig. 1b, slices of the 2D spectra measured with and without DNP hyperpolarization are compared, showing the signal enhancements through transfer of hyperpolarization for single peaks. These slices can also be compared with one-dimensional 1H NMR traces acquired with a coherence filter to select the corresponding 13C chemical shift. Such spectra were previously reported in Fig. 1b of ref. 44. They contain the same correlations, albeit in narrow chemical shift ranges. The comparison illustrates that the hyperpolarized 2D measurement significantly outperforms the 1D experiment in terms of information content, with a single 2D spectrum covering a width of 24 ppm in the 13C dimension.
Fig. 1. (a) 2D SOFAST-HMQC spectra showing the methyl chemical shift region of 0.34 mM DHFR measured after admixing of 5.3 mM hyperpolarized folic acid (blue). A spectrum of the same sample after decay of the hyperpolarization is underlaid in gray. The spectra are recorded with 40 points in the indirect dimension. The 1D traces at the top are positive sum projections of the 2D spectra. (b) 1D slices extracted at several 13C chemical shifts, as indicated by the dashed lines, from both the hyperpolarized and non-hyperpolarized 2D spectra.
Although polarization transfer through intermolecular NOE leads to selective enhancement of protein signals in the 2D DNP SOFAST-HMQC spectra, a correlation with the origin of polarization on individual ligand protons needs to be established in order to obtain atom-to-atom distance information. This correlation information was obtained by applying Hadamard encoding on ligand signals immediately after the hyperpolarized ligand was mixed with the protein preloaded in the NMR magnet. Each of a total four DNP-NMR experiments started with an inversion pulse on selected ligand resonances according to a 4 × 4 Hadamard matrix, followed by a fast [1H–13C]-HMQC (heteronuclear multi-quantum correlation) acquisition of the enhanced signals from 13C labeled protein.
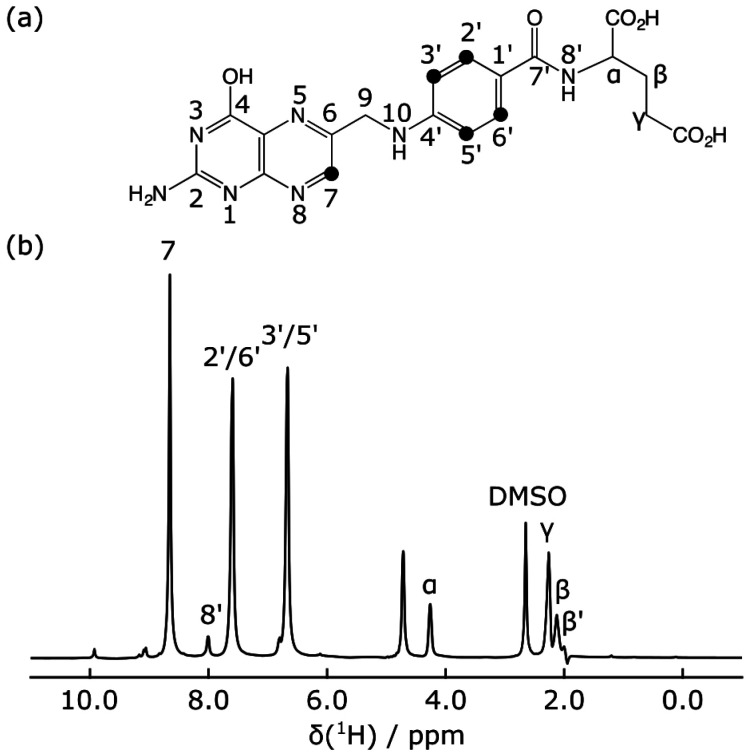
The hyperpolarized 1H NMR spectrum of the folic acid ligand shows that the largest signals were observed for three ligand peaks, H7, H2′/H6′ and H3′/H5′ (Fig. 2). Signal enhancements compared to non-hyperpolarized NMR spectra at 400 MHz were 1160, 530, and 500, respectively. These signals are also well-resolved and outside of the spectral range containing the protein methyl resonances.
Fig. 2. (a) Structure of folic acid. (b) Hyperpolarized 1H spectrum of folic acid with peak assignments labeled. DMSO designates the dimethyl sulfoxide signal from the glassing matrix used for DNP hyperpolarization.
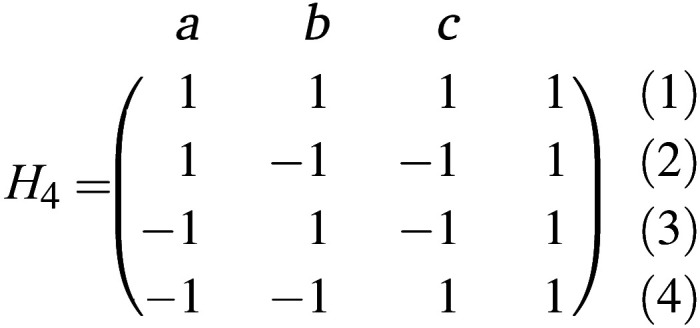
The chemical shift information for these three signals was encoded in the spectra (1)–(4) using a Hadamard scheme, as defined by a 4 × 4 matrix:
 |
1 |
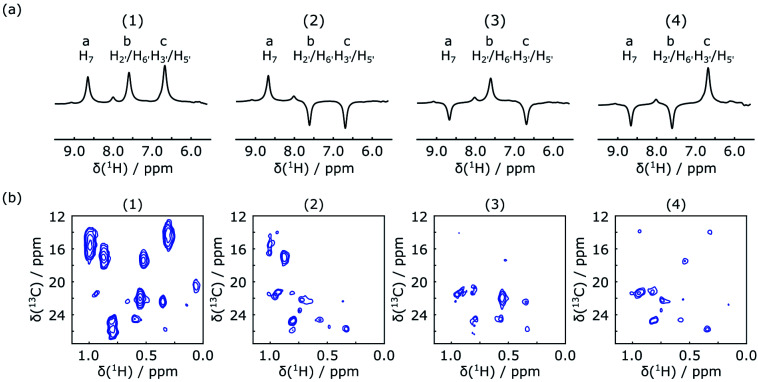
Each row of this matrix corresponds to one of 4 NMR experiments. The first three columns represent three encoded ligand peaks; a: H7, b: H2′/H6′ and c: H3′/H5′, respectively, while the fourth column represents the sum of all other ligand resonances. Entries of –1 indicate that in the respective experiment, the corresponding signal was inverted. According to this scheme, no inversion was applied in the first experiment, whereas two frequencies out of the three selected ligand resonances were selectively inverted using a dual-frequency pulse in the other three experiments.
In the first scan of each of the DNP experiments, the acquisition of a 1D NMR spectrum was integrated into the mixing time between the inversion pulse and the 2D acquisition. The excitation pulse for this spectrum consisted of a 1° hard pulse, which was chosen to obtain a signal by consuming only an insignificant amount of the initial spin polarization. The resulting spectra are shown in Fig. 3a. They can be used to confirm the success of ligand 1H encoding, and also to determine accurate enhancement factors, which may vary between experiments. The results of the corresponding four Hadamard-encoded 1H–13C SOFAST-HMQC experiments are shown in Fig. 3b. Compared to the spectrum with all (+1) encoding, a signal reduction for the methyl peaks can be seen in each of the other three spectra with selective ligand inversion. However, no peaks drop to the negative level. This behavior is expected because of positive polarization build-up during the mixing and stabilization period of about 0.65 s before the selective π pulse is applied, in addition to the possibility that other non-inverted ligand protons also contribute to the polarization transferred to the same methyl peak.
Fig. 3. (a) Hyperpolarized 1H spectra of folic acid in the presence of preloaded DHFR, measured as the first scan in the DNP experiment with 1° excitation and encoded according to the Hadamard matrix in the text with selective inversion on resonances a–c. (b) The corresponding 2D SOFAST-HMQC spectra of enhanced protein signals in the methyl region.
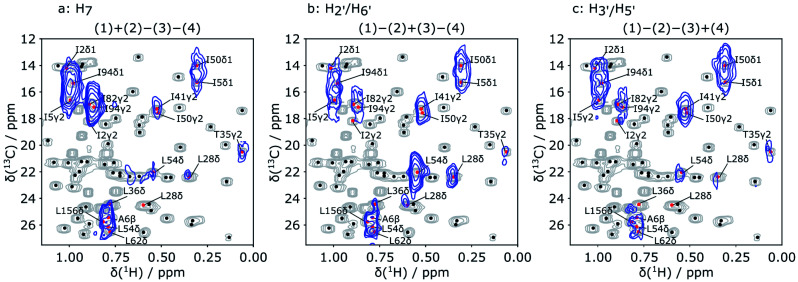
Reconstruction of the encoded information was performed by adding or subtracting the spectra of Fig. 3b according to a Hadamard transform.45 Before the reconstruction process, each spectrum was scaled with a normalization factor due to the variations in the final sample concentration after injection and the hyperpolarization level gained for each DNP experiment. A description of how the Hadamard transform generates the pure correlated signals is given in the ESI.† The final reconstructed 2D spectra are shown in Fig. 4. Each of these spectra contains the protein methyl group signals originating from polarization of one of the three ligand protons a, b or c. Simultaneous incorporation of 2D NMR and Hadamard encoding with the dissolution DNP techniques allows fast acquisition of intermolecular NOEs. The information is similar to that from conventional 3D filtered NOESY experiments shown in ref. 23, but is obtained in a fraction of the time with hyperpolarization.
Fig. 4. Hadamard reconstructed SOFAST-HMQC spectra (blue) of the methyl group chemical shift region of the protein. The ligand protons from which polarization originated are indicated above each spectrum. Underlaid in gray is the conventional HSQC spectrum of the protein. Red dots and methyl group labels indicate all assignments overlapped with the observed signals in the reconstructed DNP spectra. Additional assigned peaks in the conventional spectrum are represented with black dots.
In each of the three reconstructed spectra, distinct signal patterns are observed, allowing the determination of the source of polarization for each observable methyl group. With Hadamard encoding of the ligand side, a gain in signal-to-noise ratio is expected, since each reconstructed spectrum contains information from four individually acquired spectra. At the same time, the protein signals that do not result from transfer of encoded polarization are eliminated after the reconstruction. As a result, all observable signals in the reconstructed 2D spectra correspond to protein spins, in contact with the ligand methyl groups.
In Fig. 4, each of the three reconstructed spectra is superimposed on a conventional 1H–13C HSQC spectrum. The conventional spectrum shows the chemical shift assignments of each methyl group. The same spectrum with the detailed assignments of all methyl groups is further displayed in the ESI (Fig. S1†). Based on these assignments, the signals in the hyperpolarized 2D spectra can be identified for use in a scoring function for ranking the docked poses. The resolution of the hyperpolarized spectra however does not allow an unambiguous assignment in all cases. Therefore, all candidates that show overlap with the peaks in the reconstructed DNP spectra were considered as potentially part of the binding site and included in the further calculation. In total, 16 methyl groups were identified as potential assignments for the 9 observed NOE peaks in Fig. 4.
A scoring function (NOE score) for quantifying the difference between the simulated and experimental NOE signals was defined to rank the 250 poses generated by the AutoDock program. The target structure for docking was chosen as DHFR co-crystallized with a different ligand, methotrexate (MTX).46 This choice reflects a typical situation in drug discovery projects, where structures of the target alone or in complex with other ligands may be available. For each of the 250 folic acid poses generated by the docking program, the polarization transfer process that occurred during the D-DNP experiment covering the whole process starting from the mixing of the sample to the start of 2D acquisition for all ligand protons and protein protons located within 6 Å of the ligand were simulated based on the complete relaxation and conformational exchange matrix analysis (CORCEMA).47 This strategy is similar to that described in ref. 44, but results in a more accurate scoring function because of the increased number of constraints from the 2D spectra.
The Hadamard transform was applied to the calculated results for all methyl groups within the chemical shift range in Fig. 4. The sum of the calculated signals for each of the methyl groups with assignments overlapping with the observed peaks in the reconstructed spectra represents the expected signal for the observed NOE peak. For the remaining methyl groups, no NOE signals are expected. As a result, the scoring function includes information both for protons with and without NOE signals.
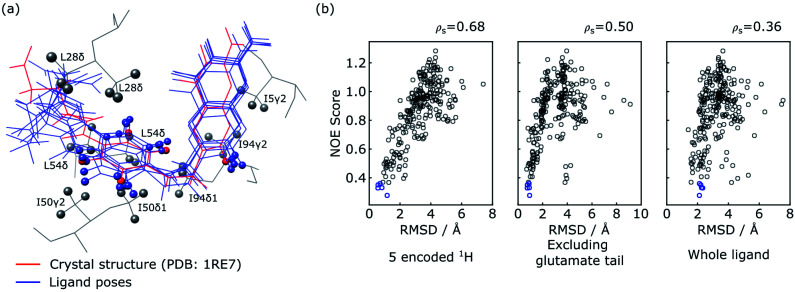
The five poses with the best NOE score are shown as blue structures in Fig. 5a, with all methyl protons within 5 Å of these poses also displayed. These methyl groups cover most of the NOE signals observed in the reconstructed spectra in Fig. 4, except for a weak NOE signal assigned to T35γ2. It can be seen that the agreement among the selected poses is high in particular for the 5 encoded protons, and the entire pteroyl moiety, where the encoded protons are located. The glutamate tail in the part of the ligand without encoded protons shows lower agreement in the 5 selected poses. The agreement among the selected structures can be quantified by the averaged pairwise root-mean-square deviation (RMSD) values, which are calculated as 0.88 Å for the 5 encoded protons, 0.68 Å for heavy atoms in the pteryol group and 2.19 Å for heavy atoms in the glutamate group. For comparison, a reference structure of DHFR-folic acid complex (PDB: ; 1RE7 (ref. 46)) is underlaid in red in Fig. 5a. High consistency is also observed between the 5 poses and the reference structure for the 5 encoded protons and the pteroyl moiety, with lower agreement for the glutamate tail. The averaged RMSD values for the 5 poses against the reference structure are 0.76 Å when calculating the 5 protons, and 0.85 Å for heavy atoms in the pteroyl moiety. Since the structure used for docking purposefully was chosen to be the crystal structure of DHFR in complex with a different ligand, an exact agreement between the calculated structures and the crystal structure in Fig. 5a is not expected. The results could possibly be further improved if some protein flexibility is allowed in the docking.
Fig. 5. Evaluation of ligand trial poses ranked by NOE score. (a) Overlay of the five docked poses with the best NOE score (blue) and the ligand in the crystal structure (red; PDB: 1RE7 (ref. 46)). For the overlay, the two protein structures were aligned on all atoms using PyMOL (The PyMOL Molecular Graphics System, Version 2.2, Schrödinger, LLC), and plotted using UCSF Chimera.48 The five encoded protons of the ligand are shown as spheres in all of the poses. Protein methyl groups from the crystal structure that are within 5 Å of the five selected poses are represented with gray spheres. (b) Correlation plot of NOE score vs. RMSD between the trial pose and the crystal structure. The blue circles represent the five poses displayed in (a). The RMSD values in the three panels are calculated considering the five ligand protons encoded with selective inversion (left), heavy atoms in the ligand structure excluding the glutamate portion (middle), and heavy atoms in the whole ligand structure (right).
Similar conclusions can be drawn from the correlation plot of the NOE score vs. structural RMSD values between the ligand poses and the reference structure (Fig. 5b). The highest correlation of these quantities is observed when considering only the 5 ligand protons that were encoded (left panel). This is followed by considering exclusively the pteroyl moiety (central panel). The entire ligand structure shows the lowest correlation (right panel). This result is reasonable, considering that atoms in the glutamate tail, without encoding, have no direct NOE correlation information. Considering the RMSD values to the crystal structure for the 5 encoded protons, the five poses selected by the NOE score rank 15, 1, 2, 4 and 3 among the 250 poses (Fig. 5b). On the other hand, the energy-based AutoDock score generated by the docking program ranks the five selected poses as 156, 114, 11, 35 and 8 among 250 poses. This comparison illustrates the benefit of including the experimental NOE information. These five poses are compared with the five poses with lowest calculated binding energy in Fig. S2.† The latter structures, without experimental input, give average RMSD values to the reference structure of 1.41 Å for the 5 encoded protons and 1.27 Å for the pteroyl moiety, larger than the RMSD values of 0.76 Å and 0.85 Å for the structures selected by the NOE score function. Among the 5 structures selected by AutoDock, one pose further gives an apparently wrong conformation for the pteridine ring, which is flipped by approximately 180 degrees compared to the reference structure. The inclusion of the experimental information therefore leads to a clear improvement in the accuracy of ligand pose selection.
Hyperpolarization generates a deviation from equilibrium for the NOE source spin, which is orders of magnitude larger than the population inversion in conventional NOESY experiments. The resulting sensitivity gain substantially accelerates the measurement of intermolecular NOEs. Here, each of the 4 hyperpolarized experiments required an acquisition time of only 5 seconds, following a polarization build-up time of approximately 20 minutes. A conventional 3D NOESY experiment typically requires several days at a target concentration in the submillimolar range.37 The short NMR acquisition time in the DNP experiment can be especially useful for protein samples that are not stable for extended periods. The polarization transfer to protein allows identification of the protein spins in the binding site in a single experiment. The hyperpolarization thereby provides a natural selectivity based on signal strength for protein spins that are located in the binding site against all other non-hyperpolarized species. This selectivity is in addition to isotope label based filters in the pulse sequences.
The large signal enhancement can also benefit ligand-observed NMR methods. Examples of combining D-DNP with the INPHARMA21 and the WaterLOGSY20 experiments have been demonstrated for obtaining structure-related information about the protein–ligand binding. However, here, the protein side observation enables the determination of the binding mode directly from observing specific intermolecular contacts. As in conventional protein-observed methods, limitations including a target size limit of around 30 kDa and the need for isotopic labeling of protein also exist in this hyperpolarized NOE measurement. Also as in corresponding conventional experiments, there is a requirement for knowledge of chemical shift assignment information and of a protein structure model. The method with hyperpolarization described here is in particular suitable for rapid structural characterization of ligand–protein binding for a series of different ligands with the same target. As described previously, the simulation of the intermolecular NOEs includes all methyl groups sharing similar 1H and 13C chemical shifts. Methyl groups that are not located in the binding site, although included in the calculation, do not significantly contribute to the simulated NOE intensities for the correct ligand poses if located at a large distance from the ligand spins. This feature allows some ambiguity in the NOE assignment and might provide the potential for extending the current method to an assignment-free approach. Several methods have already been described for determination of the structure of ligand–protein interaction site based on NOE distance restraints, where no protein resonance assignments are required. Constantine et al. proposed to rescore the pre-docked ligand based on matching the observed and predicted patterns of intermolecular NOEs.30 In a distance restraints-driven method by Orts et al., all possible assignment combinations are screened, with filtering steps included to reduce the total number of possibilities to be calculated.49 To apply these strategies with DNP-assisted intermolecular NOE experiments, the resolution of the 2D measurement should be improved to avoid peak overlapping. In addition, highly efficient experiments with more ligand frequencies encoded can be developed to collect a larger number of NOEs.
In the 2D SOFAST-HMQC experiment, spin polarization of the measured protein spins is consumed in each scan, so that the success of multi-dimensional spectroscopy depends on polarization continuously transferring from the ligand to the protein. As a consequence, hyperpolarization loss due to T1 relaxation of ligand 1H spins limits the total experimental time and the number of indirect points that can be measured. Techniques that can slow down the ligand T1 relaxation, including separating the radicals after dissolution, increasing the temperature, or using deuterated solvent, provide possible ways to increase both the resolution and sensitivity of the experiment.
Conclusions
In summary, the combination of hyperpolarized 2D NMR spectroscopy for protein detection and Hadamard encoding of ligand resonances results in pseudo 3D measurements of specific intermolecular NOEs between protein methyl groups and ligand proton spins. In DHFR, a total of four DNP-NMR experiments identified 9 different NOE contacts, which resulted in the selection of a ligand structure that shows a good agreement with the reference structure for the part of ligand containing the encoded protons, giving an average root-mean-square value of 0.76 Å for the five encoded protons. The described method of using multi-dimensional NOE data from hyperpolarized spins to score pre-docked ligand poses can correctly solve the structure of protein–ligand complexes in the binding site. Future applications may include acceleration of ligand optimization in structure-based rational drug design.
Experimental
Sample preparation
Uniformly 13C enriched DHFR was produced by expression from the pET-duet-1 plasmid in E. coli BL21 (DE3) cells, cultured in M9 minimum medium containing 3 g L–1 [U–13C]glucose. The His-tagged protein was purified by a Ni2+-NTA column followed by gel filtration chromatography as previously described.23 Purified DHFR was prepared as a 5 mM stock solution in 50 mM phosphate buffer (pH 6.8) containing 1 mM EDTA, 1 mM DTT, 50 mM KCl. The concentration was determined by measuring UV-Vis absorption at 280 nm.
NMR spectroscopy
For DNP hyperpolarization, samples of 350 mM folic acid (Spectrum Chemicals, Gardena, CA) were prepared in D2O/DMSO-d6 (v/v 7 : 3) containing 15 mM 4-hydroxy-2,2,6,6-tetramethylpiperidine-1-oxyl (TEMPOL; Sigma-Aldrich, St. Louis, MO). 30 μL aliquots of the mixture were hyperpolarized on 1H spins in a HyperSense DNP polarizer (Oxford Instruments, Abingdon, UK) under 100 mW microwave irradiation at a frequency of 94.005 GHz, and a temperature of 1.4 K. After 20 min, a frozen DNP sample was dissolved by 4 mL phosphate buffer (50 mM, pH 6.8) preheated until reaching a vapor pressure of 6 bar and then injected into a 5 mm NMR tube. The NMR tube was pre-installed in the 400 MHz NMR magnet (Bruker Biospin, Billerica, MA). In the NMR tube, a total of 25 μL of 5 mM protein solution was preloaded, which mixed with the hyperpolarized ligand during injection. The injection was achieved by applying N2 gas at a forward pressure of 1.81 MPa against a back pressure of 1.03 Mpa. The middle of this injection period was considered as the point when the mixing started (a in Fig. 6, t = 0 s). NMR measurements were programmed to automatically start after an additional period for sample stabilization (b in Fig. 6, t = 0.57 s). The final sample concentrations were determined individually for all the samples, resulting in average values of 4.9 ± 0.4 mM and 0.34 ± 0.02 mM for the ligand and protein, respectively.
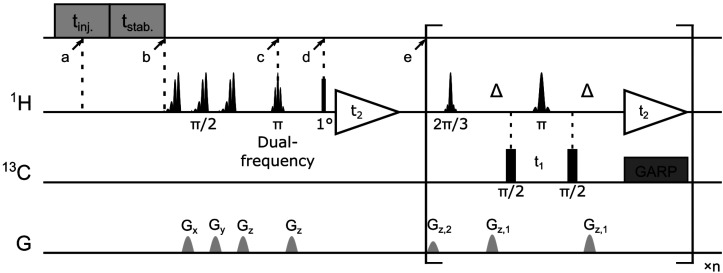
Fig. 6. Pulse sequence for the [1H–13C]-SOFAST-HMQC experiment with ligand resonances encoded by a Hadamard scheme. After the injection (tinj. = 375 ms) and sample stabilization (tstab. = 385 ms), the NMR experiment was triggered. Repeated 20 ms EBURP π/2 pulses followed by pulsed-field gradients Gx (44.8 G cm–1), Gy (38.6 G cm–1), Gz (33.5 G cm–1) were applied for water suppression. The two π/2 pulses on the 13C channel were applied with γB1/2π = 11.4 kHz. A 12.7 ms dual Gaussian shaped pulse with flip angle of π was applied simultaneously on two ligand 1H resonances followed by a pulsed field gradient Gz (47.7 G cm–1). The first 1H scan was acquired after a hard pulse with a small flip angle (1°) for enhancement determination of hyperpolarized ligand signals. In the following [1H–13C]-SOFAST-HMQC pulse sequence, a 2.8 ms PC9 shaped pulse (flip angle 2π/3, ±2 ppm bandwidth) and a 1.9 ms RSNOB shaped π-pulse were centered at 0 ppm for selective methyl proton excitation and refocusing. The coherence transfer delay was set to 1/(2JCH) as Δ = 3.5 ms. A 13C GARP decoupling sequence (γB1/2π = 3.1 kHz) was applied during the acquisition. Pulsed field gradients were applied with Gz,1 (7.5 G cm–1) and Gz,2 (4.8 G cm–1). A total of 40 × 1200 points were acquired for the 13C and 1H dimensions, with t1,max = 8.2 ms and t2,max = 100 ms, respectively.
All hyperpolarized NMR spectra were acquired in a 5 mm triple-resonance inverse detection (TXI) probe (Bruker Biospin, Billerica, MA) at a temperature of 303 K. The NMR pulse sequence consists of a selective dual-frequency inversion pulse for ligand 1H encoding (c in Fig. 6, t = 0.65 s), a small flip-angle excitation (point d, t = 0.68 s) and the subsequent 1H acquisition for determination of ligand 1H enhancement, and a [1H–13C]-SOFAST-HMQC50 sequence for detection of 1H and 13C correlation for the protein methyl groups (point e, t = 0.78 s). Two ligand resonances were chosen to be inverted simultaneously in each experiment according to the Hadamard matrix (eqn (1)). Four consecutive DNP NMR experiments were conducted for a complete encoding. The enhancement factors for ligand protons in each experiment were determined by comparing the peak integrals measured in the 1D DNP NMR spectra with those obtained at thermal polarization. The final concentration of folic acid was measured using absorbance at 350 nm by UV-Vis spectroscopy after each DNP experiment, while the protein concentration was determined by comparing the 1H NMR signals recorded under thermal polarization to a known standard. Backbone and side-chain chemical shifts assignments of the DHFR complexed with folic acid were obtained previously,23 by mapping reported values to the experimental conditions used.51
Hadamard reconstruction
The four hyperpolarized SOFAST-HMQC spectra were first normalized by a factor, which is the product of the ligand signal enhancement from the corresponding 1D NMR spectra and the final protein concentration in each sample (Table S1†). Spectra were then further processed with the Hadamard transform described in the ESI,† to generate reconstructed spectra consisting of methyl NOE peaks corresponding to each of the three encoded ligand resonances.
Docking and simulation
250 ligand trial poses were generated by docking folic acid into the DHFR binding pocket using AutoDock 4.2 (ref. 52) as previously described,44 and complete relaxation and conformation exchange matrix analysis47 were applied in the same way to simulate time-dependent polarization transfer for all involved ligand and protein 1H spins. All equivalent protons, including the methyl protons, were treated as individual atoms.47 For the ligand and protein concentrations, the enhancement factors for the hyperpolarized ligand and the additional factors to account for incomplete inversion of the ligand signals (Table S1†), the averaged values from 4 experiments were used. Starting from the occurrence of mixing (point a in Fig. 6, t = 0 s), the band-selective inversion was applied as inverting the corresponding two ligand signals at t = 0.65 s (point c). The simulated NMR signals in the four encoded SOFAST-HMQC spectra were obtained for all methyl protons involved in the calculation using the simulated magnetization at the start of the 2D measurement of t = 0.78 s (point e). The Hadamard transform was applied and the potential methyl peaks appearing at the position for the same NOE peaks were grouped together to generate the simulated NOE signals corresponding to each encoded ligand resonance.
A scoring function, NOE score, was defined to represent the deviation of the simulated results from the experimental data, covering N methyl groups for observed NOE signals and M methyl signals that are not observed in the 3 reconstructed spectra, as  . Here, Si represents the relative peak intensity defined as the ratio of individual signal to the sum of intensities of all observed peaks in a single reconstructed spectrum for both simulated and experimental results. For the two indistinguishable Hδ methyls in leucine for L28, L36, L54 and L156 without stereospecific assignment, all possible combinations were calculated and the lowest NOE score was selected. The calculated NOE score was used to rank the 250 poses.
Conflicts of interest
There are no conflicts to declare.
Supplementary Material
Acknowledgments
Financial support from the National Science Foundation (CHE-1362691), the Welch Foundation (A-1658) and Texas A&M University College of Science Strategic Transformative Research Program is gratefully acknowledged.
Footnotes
†Electronic supplementary information (ESI) available. See DOI: 10.1039/d0sc00266f
References
- Arkin M. R., Wells J. A. Nat. Rev. Drug Discovery. 2004;3:301–317. doi: 10.1038/nrd1343. [DOI] [PubMed] [Google Scholar]
- McCormick F. Curr. Opin. Biotechnol. 2000;11:593–597. doi: 10.1016/s0958-1669(00)00149-x. [DOI] [PubMed] [Google Scholar]
- Piazza I., Kochanowski K., Cappelletti V., Fuhrer T., Noor E., Sauer U., Picotti P. Cell. 2018;172:358–372. doi: 10.1016/j.cell.2017.12.006. [DOI] [PubMed] [Google Scholar]
- Mattos C. Trends Biochem. Sci. 2002;27:203–208. doi: 10.1016/s0968-0004(02)02067-4. [DOI] [PubMed] [Google Scholar]
- Meyer B., Peters T. Angew. Chem., Int. Ed. 2003;42:864–890. doi: 10.1002/anie.200390233. [DOI] [PubMed] [Google Scholar]
- Takeuchi K., Wagner G. Curr. Opin. Struct. Biol. 2006;16:109–117. doi: 10.1016/j.sbi.2006.01.006. [DOI] [PubMed] [Google Scholar]
- Freedberg D. I., Selenko P. Annu. Rev. Biophys. 2014;43:171–192. doi: 10.1146/annurev-biophys-051013-023136. [DOI] [PubMed] [Google Scholar]
- Claasen B., Axmann M., Meinecke R., Meyer B. J. Am. Chem. Soc. 2005;127:916–919. doi: 10.1021/ja044434w. [DOI] [PubMed] [Google Scholar]
- Mari S., Invernizzi C., Spitaleri A., Alberici L., Ghitti M., Bordignon C., Traversari C., Rizzardi G.-P., Musco G. Angew. Chem., Int. Ed. 2010;49:1071–1074. doi: 10.1002/anie.200905941. [DOI] [PubMed] [Google Scholar]
- Xie J., Thapa R., Reverdatto S., Burz D. S., Shekhtman A. J. Med. Chem. 2009;52:3516–3522. doi: 10.1021/jm9000743. [DOI] [PMC free article] [PubMed] [Google Scholar]
- Kumar A., Kuhn L., Balbach J. Int. J. Mol. Sci. 2019;20:378. doi: 10.3390/ijms20020378. [DOI] [PMC free article] [PubMed] [Google Scholar]
- Otting G., Liepinsh E., Wuthrich K. Science. 1991;254:974–980. doi: 10.1126/science.1948083. [DOI] [PubMed] [Google Scholar]
- Otting G., Wuethrich K. J. Am. Chem. Soc. 1989;111:1871–1875. [Google Scholar]
- Breeze A. L. Prog. Nucl. Magn. Reson. Spectrosc. 2000;36:323–372. [Google Scholar]
- Ardenkjær-Larsen J. H., Fridlund B., Gram A., Hansson G., Hansson L., Lerche M. H., Servin R., Thaning M., Golman K. Proc. Natl. Acad. Sci. U. S. A. 2003;100:10158–10163. doi: 10.1073/pnas.1733835100. [DOI] [PMC free article] [PubMed] [Google Scholar]
- Kim J., Liu M., Hilty C. J. Phys. Chem. B. 2017;121:6492–6498. doi: 10.1021/acs.jpcb.7b03052. [DOI] [PubMed] [Google Scholar]
- Szekely O., Olsen G. L., Felli I. C., Frydman L. Anal. Chem. 2018;90:6169–6177. doi: 10.1021/acs.analchem.8b00585. [DOI] [PubMed] [Google Scholar]
- Kadeřávek P., Ferrage F., Bodenhausen G., Kurzbach D. Chem.–Eur. J. 2018;24:13418–13423. doi: 10.1002/chem.201802885. [DOI] [PubMed] [Google Scholar]
- Kim J., Mandal R., Hilty C. J. Phys. Chem. Lett. 2019;10:5463–5467. doi: 10.1021/acs.jpclett.9b02197. [DOI] [PubMed] [Google Scholar]
- Chappuis Q., Milani J., Vuichoud B., Bornet A., Gossert A. D., Bodenhausen G., Jannin S. J. Phys. Chem. Lett. 2015;6:1674–1678. doi: 10.1021/acs.jpclett.5b00403. [DOI] [PubMed] [Google Scholar]
- Lee Y., Zeng H., Mazur A., Wegstroth M., Carlomagno T., Reese M., Lee D., Becker S., Griesinger C., Hilty C. Angew. Chem., Int. Ed. 2012;51:5179–5182. doi: 10.1002/anie.201201003. [DOI] [PubMed] [Google Scholar]
- Min H., Sekar G., Hilty C. ChemMedChem. 2015;10:1559–1563. doi: 10.1002/cmdc.201500241. [DOI] [PubMed] [Google Scholar]
- Wang Y., Ragavan M., Hilty C. J. Biomol. NMR. 2016;65:41–48. doi: 10.1007/s10858-016-0037-x. [DOI] [PMC free article] [PubMed] [Google Scholar]
- Stark J. L., NMR of Proteins and Small Biomolecules, Springer, Berlin, Heidelberg, 2011, vol. 326, pp. 1–34. [Google Scholar]
- Sturlese M., Bellanda M., Moro S. Mol. Inf. 2015;34:513–525. doi: 10.1002/minf.201500012. [DOI] [PubMed] [Google Scholar]
- Curto E. V., Moseley H. N. B., Krishna N. R. J. Comput.-Aided Mol. Des. 1996;10:361–371. doi: 10.1007/BF00124470. [DOI] [PubMed] [Google Scholar]
- Orts J., Tuma J., Reese M., Grimm S. K., Monecke P., Bartoschek S., Schiffer A., Wendt K. U., Griesinger C., Carlomagno T. Angew. Chem., Int. Ed. 2008;47:7736–7740. doi: 10.1002/anie.200801792. [DOI] [PubMed] [Google Scholar]
- Hajduk P. J., Mack J. C., Olejniczak E. T., Park C., Dandliker P. J., Beutel B. A. J. Am. Chem. Soc. 2004;126:2390–2398. doi: 10.1021/ja039480v. [DOI] [PubMed] [Google Scholar]
- Pilger J., Mazur A., Monecke P., Schreuder H., Elshorst B., Bartoschek S., Langer T., Schiffer A., Krimm I., Wegstroth M., Lee D., Hessler G., Wendt K.-U., Becker S., Griesinger C. Angew. Chem., Int. Ed. 2015;127:6611–6615. doi: 10.1002/anie.201500671. [DOI] [PubMed] [Google Scholar]
- Constantine K. L., Davis M. E., Metzler W. J., Mueller L., Claus B. L. J. Am. Chem. Soc. 2006;128:7252–7263. doi: 10.1021/ja060356w. [DOI] [PubMed] [Google Scholar]
- Stark J., Powers R. J. Am. Chem. Soc. 2008;130:535–545. doi: 10.1021/ja0737974. [DOI] [PubMed] [Google Scholar]
- Cioffi M., Hunter C. A., Packer M. J., Spitaleri A. J. Med. Chem. 2008;51:2512–2517. doi: 10.1021/jm701194r. [DOI] [PubMed] [Google Scholar]
- Skjærven L., Codutti L., Angelini A., Grimaldi M., Latek D., Monecke P., Dreyer M. K., Carlomagno T. J. Am. Chem. Soc. 2013;135:5819–5827. doi: 10.1021/ja4007468. [DOI] [PubMed] [Google Scholar]
- Yu Z., Li P., Merz K. M. Biochemistry. 2017;56:2349–2362. doi: 10.1021/acs.biochem.7b00170. [DOI] [PubMed] [Google Scholar]
- Fukunishi Y., Mizukoshi Y., Takeuchi K., Shimada I., Takahashi H., Nakamura H. J. Mol. Graphics Modell. 2011;31:20–27. doi: 10.1016/j.jmgm.2011.08.002. [DOI] [PubMed] [Google Scholar]
- Onila I., ten Brink T., Fredriksson K., Codutti L., Mazur A., Griesinger C., Carlomagno T., Exner T. E. J. Chem. Inf. Model. 2015;55:1962–1972. doi: 10.1021/acs.jcim.5b00235. [DOI] [PubMed] [Google Scholar]
- Shah D. M., Ab E., Diercks T., Hass M. A. S., van Nuland N. A. J., Siegal G. J. Med. Chem. 2012;55:10786–10790. doi: 10.1021/jm301396d. [DOI] [PubMed] [Google Scholar]
- Mohanty B., Williams M. L., Doak B. C., Vazirani M., Ilyichova O., Wang G., Bermel W., Simpson J. S., Chalmers D. K., King G. F., Mobli M., Scanlon M. J. J. Biomol. NMR. 2016;66:195–208. doi: 10.1007/s10858-016-0067-4. [DOI] [PubMed] [Google Scholar]
- de Vries S. J., van Dijk M., Bonvin A. M. J. J. Nat. Protoc. 2010;5:883–897. doi: 10.1038/nprot.2010.32. [DOI] [PubMed] [Google Scholar]
- Dominguez C., Boelens R., Bonvin A. M. J. J. J. Am. Chem. Soc. 2003;125:1731–1737. doi: 10.1021/ja026939x. [DOI] [PubMed] [Google Scholar]
- Proudfoot A., Bussiere D. E., Lingel A. J. Am. Chem. Soc. 2017;139:17824–17833. doi: 10.1021/jacs.7b07171. [DOI] [PubMed] [Google Scholar]
- Orts J., Wälti M. A., Marsh M., Vera L., Gossert A. D., Güntert P., Riek R. J. Am. Chem. Soc. 2016;138:4393–4400. doi: 10.1021/jacs.5b12391. [DOI] [PubMed] [Google Scholar]
- Wälti M. A., Riek R., Orts J. Angew. Chem., Int. Ed. 2017;56:5208–5211. doi: 10.1002/anie.201612304. [DOI] [PubMed] [Google Scholar]
- Wang Y., Hilty C. J. Med. Chem. 2019;62:2419–2427. doi: 10.1021/acs.jmedchem.8b01711. [DOI] [PubMed] [Google Scholar]
- Kupče E., Nishida T., Freeman R. Prog. Nucl. Magn. Reson. Spectrosc. 2003;42:95–122. [Google Scholar]
- Sawaya M. R., Kraut J. Biochemistry. 1997;36:586–603. doi: 10.1021/bi962337c. [DOI] [PubMed] [Google Scholar]
- Moseley H. N. B., Curto E. V., Krishna N. R. J. Magn. Reson. 1995;108:243–261. doi: 10.1006/jmrb.1995.1129. [DOI] [PubMed] [Google Scholar]
- Pettersen E. F., Goddard T. D., Huang C. C., Couch G. S., Greenblatt D. M., Meng E. C., Ferrin T. E. J. Comput. Chem. 2004;25:1605–1612. doi: 10.1002/jcc.20084. [DOI] [PubMed] [Google Scholar]
- Wälti M. A., Orts J. Magnetochemistry. 2018;4:12. [Google Scholar]
- Schanda P., Kupče E., Brutscher B. J. Biomol. NMR. 2005;33:199–211. doi: 10.1007/s10858-005-4425-x. [DOI] [PubMed] [Google Scholar]
- Falzone C. J., Cavanagh J., Cowart M., Palmer A. G., Matthews C. R., Benkovic S. J., Wright P. E. J. Biomol. NMR. 1994;4:349–366. doi: 10.1007/BF00179346. [DOI] [PubMed] [Google Scholar]
- Morris G. M., Huey R., Lindstrom W., Sanner M. F., Belew R. K., Goodsell D. S., Olson A. J. J. Comput. Chem. 2009;30:2785–2791. doi: 10.1002/jcc.21256. [DOI] [PMC free article] [PubMed] [Google Scholar]
Associated Data
This section collects any data citations, data availability statements, or supplementary materials included in this article.


