Abstract
Interactions between quaternary amino or guanidino groups with anions are ubiquitous in nature and have been extensively studied phenomenologically. However, little is known about the binding energies in non-covalent complexes containing these functional groups. Here, we present a first study focused on quantifying such interactions using complexes of phosphorylated A3pXA3-NH2 (X = S, T, Y) peptides with decamethonium (DCM) or diaguanidinodecane (DGD) ligands as model systems. Time- and collision energy-resolved surface-induced dissociation (SID) of the singly charged complexes was examined using a specially configured Fourier transform ion cyclotron resonance mass spectrometer (FTICR-MS). Dissociation thresholds and activation energies were obtained from RRKM modeling of the experimental data that has been described and carefully characterized in our previous studies. For systems examined in this study, covalent bond cleavages resulting in phosphate abstraction by the cationic ligand are characterized by low dissociation thresholds and relatively tight transition states. In contrast, high dissociation barriers and large positive activation entropies were obtained for cleavages of non-covalent bonds. Dissociation parameters obtained from the modeling of the experimental data are in excellent agreement with the results of density functional theory (DFT) calculations. Comparison between the experimental data and theoretical calculations indicate that phosphate abstraction by the ligand is rather localized and mainly affected by the identity of the phosphorylated side chain. The hydrogen bonding in the peptide and ligand properties play a minor role in determining the energetics and dynamics of the phosphate abstraction channel.
Introduction
Interactions of quaternary amino or guanidino groups with anions play an important role in materials science,1 host–guest chemistry,2,3 biology,4–7 and drug discovery.8,9 For example, host–guest chemistry involving phosphate–amine interactions has been used for the selective and rapid detection of phosphate and phosphonate compounds, which include biologically important signaling molecules, pesticides, and chemical warfare agents. In another area of research, non-covalent binding between guanidino groups and oxyanions has been used in the development of high-water-content mouldable hydrogels10 and ‘‘molecular glues’’—materials that can adhere to proteins and stabilize protein assemblies in aqueous buffers.11 Because of the weak binding between the protonated guanidino group and an oxyanion under physiological conditions, interactions involving more than one guanidino group are often used in designing biocompatible materials.
Interaction between charged amino groups and phosphate anions are ubiquitous in biology. For example, protonated arginine residues form voltage-sensor paddles responsible for the function of voltage-gated channels.12 The paddles’ movement across the membrane couples the pore opening to membrane voltage. It also has been demonstrated that the phospho head-groups of membrane lipids provide the necessary countercharges for the positively charged voltage-sensing residues, suggesting that interactions between protonated guanidino and deprotonated phosphate groups may play a role in the voltage gating.13 Arginine side chains are commonly involved in non-covalent binding of proteins to phosphate groups of nucleic acids or other proteins in protein–nucleic acid14 and protein–protein complexes.15 In addition, it has been demonstrated that arginine–phosphate binding involved in receptor heteromer formation plays a key role in determining the quaternary structure of heteromer complexes.16–19
As the binding energy is affected by a variety of environmental factors,4 studying the energetics of non-covalent binding of amine-phosphate interactions in solution is challenging. Gas-phase studies provide an opportunity to examine the energetics of such interactions in the absence of solvent. Furthermore, because abstraction and transfer of the phosphate group facilitated by the basic arginine residues often complicates structural characterization of phosphopeptides, phospholipids, and proteins by using tandem mass spectrometry,20–24 understanding factors that determine the competition between cleavage of covalent and non-covalent bonds in such systems is also important for analytical applications. Previous studies demonstrated that quaternary amine–phosphate15 and arginine–phosphate electrostatic interaction16 as represented by non-covalent bonds is often stronger and more stable than covalent binding. For example, cleavage of the phosphate ester bond has been reported for non-covalent complexes composed of polyalanine peptides containing a phosphorylated amino acid residue and decamethonium—a compound with two terminal tetramethylammonium groups.15 Similarly, loss of phosphate was observed in gas-phase fragmentation of non-covalent complexes between peptides with two or more adjacent arginine residues and non-basic phosphopeptides16 or DNA strands.25 Furthermore, Loo and co-workers observed fragmentation of the covalent phosphate bonds in collision-induced dissociation of ribonuclease–nucleotide complexes.26
From the above discussion it follows that quaternary amino and guanidino groups facilitate phosphate abstraction from phosphorylated amino acid residues. In this study we used two similar compounds, decamethonium (DCM) and diguanidinodecane (DGD), to represent molecules of biological interest possessing two quaternary amino and guanidino groups. We note that DCM is a neuromuscular blocking agent while DGD is an anti-diabetic drug. Model alanine-containing peptides with one phosphorylated amino acid residue in the middle, Ala-Ala-Ala-pX-Ala-Ala-Ala-NH2 (X = S, T, Y), referred to as A3pXA3-NH2, used in this study represent the peptide/protein backbone involved in cation–phosphate interactions. We present a first quantitative study focused on a molecular-level understanding of the stability and dissociation of non-covalent complexes involving these functional groups. The energetics and dynamics of dissociation of the model complexes composed of phosphorylated A3pXA3-NH2 and either DCM or DGD, denoted as DCM–A3pXA3-NH2 and DGD–A3pXA3-NH2, respectively, were examined using time- and collision energy-resolved surface-induced dissociation (SID) experiments in a Fourier transform ion cyclotron resonance mass spectrometer (FTICR-MS) combined with RRKM modeling of the experimental data.27,28 This approach has been extensively used in the past to obtain accurate energetics of dissociation of covalent and non-covalent bonds in complex molecules.29–35

Experimental
SID experiments were conducted on a uniquely manufactured 6T FTICR mass spectrometer described in detail elsewhere.36 The SID target is introduced through a vacuum interlock assembly and positioned at the rear trapping plate of the ICR cell. Ions are electrosprayed at atmospheric pressure and transferred into the vacuum system via an electrodynamic ion funnel.37 Two quadrupoles following the ion funnel provide collisional focusing and mass selection of the ion of interest. A collisional octopole held at elevated pressure (about 2–5 × 10⁻³ Torr) is used for accumulation of mass-selected ions and collisional relaxation of any internal energy possessed by ions generated by electrospray ionization prior to their injection into the ICR cell. Mass-selected ions were accumulated for 0.8–2 s, extracted from the accumulation octopole, transferred into the ICR cell, and allowed to collide with the surface. Scattered ions were captured by raising the potentials on the front and rear trapping plates of the ICR cell by 15 V. The pressure in the vacuum chamber containing the ICR cell was 2 × 10⁻⁹ Torr. Time-resolved mass spectra were acquired by varying the delay between the gated trapping and the excitation/detection event (the reaction delay) from 1 ms to 1 s. Immediately following the reaction delay, ions were excited through a broadband chirp and detected. The collision energy is defined by the difference between the potential applied to the accumulation quadrupole and the potential applied to the rear trapping plate and SID target.
Experimental control is accomplished with a modular FTICR data acquisition system developed by Heeren and co-workers,38,39 which is used to control the voltages and timing of the ion source and transfer optics, as well as ion manipulation in the ICR cell. Typical experiments involved changing the collision energy across a relatively wide range from 17 eV to 73 eV in 2 eV increments and at each reaction delay. In this study, reaction delays of 1 ms, 5 ms, 10 ms, 50 ms, 0.1 s, and 1 s were examined. Survival curves and time-resolved fragmentation efficiency curves (TFECs) were constructed from experimental mass spectra by plotting the relative abundance of the precursor ion and its fragments as a function of collision energy for each reaction delay time.
The hydrocarbon self-assembled monolayer (HSAM) surface was chosen as an SID target based on the relatively low kinetic-to-internal energy transfer efficiency (< 10%)40,41 that determines the range of kinetic energies in SID experiments. At low kinetic energies (< 15 eV) ion soft-landing is a dominant process that significantly suppresses the intensity of scattered ions.42,43 The HSAM surface was prepared on a single gold {111} crystal (Monocrystals, Richmond Heights, OH) using a standard procedure. The target was cleaned in an ultraviolet (UV) cleaner (Model 135500, Boekel Industries Inc., Feasterville, PA) for 10 min and allowed to stand in a 98% 1-dodecanethiol thiol (CH3(CH2)11SH) solution (Sigma-Aldrich) for 8–12 h. The target was removed from the thiol solution and ultrasonically washed in ethanol for 10 min to remove extra layers.
Non-covalent complexes (NCXs) examined in this study were generated by electrospraying solutions containing A3pXA3-NH2 (X = S, T, Y) peptides and DCM or DGD. The elemental composition of the complexes was confirmed by comparing the exact mass of the complex measured experimentally with the calculated mass (Table 1). Decamethonium salt was purchased from Sigma (St. Louis, MO). Synthalin sulfate (diguanidinodecane) was purchased from Tocris Bioscience (Ellisville, MO). A3pXA3-NH2 (X = S, T, Y) peptides were synthesized at the John Hopkins School of Medicine Peptide Synthesis Core Facility (Baltimore, MD). The samples were dissolved in methanol to a final concentration of 20–50 μM (peptide) and 100–200 μM (DCM or DGD). A syringe pump (Cole Parmer, Vernon Hills, IL) was used for direct infusion of the electrospray samples at a rate of 20 μL h−1. A typical high voltage applied to the ESI emitter was 2 kV.
Table 1.
Exact mass-to-charge ratios of NCX
| DCM | DGD | |
|---|---|---|
| A3pSA3-NH2 | 867.5432 | 867.4929 |
| A3pTA3-NH2 | 881.5589 | 881.5086 |
| A3pYA3-NH2 | 943.5745 | 943.5242 |
RRKM modeling
Survival curves and TFECs were modeled using an RRKM-based approach developed by our group.44 Microcanonical rate constants as a function of internal energy for all reaction channels were calculated using the RRKM/QET expression.45 The breakdown graph—a collection of breakdown curves (BDC) representing fragmentation probability of the precursor ion into a particular reaction channel as a function of the internal energy of the precursor ion (E) and the reaction delay (tr)—is calculated using the appropriate equations of formal kinetics derived for a particular reaction scheme. Because of the long reaction delay times involved in our FTICR SID experiments, radiative cooling of excited ions must be considered. The same radiative rate, krad, is used to model radiative cooling of the precursor ion and its fragments. The energy deposition function is described by the following analytical expression:46
| (1) |
where l and Δ are parameters, C = Γ(l + 1)[f(Ecoll)]l+1 is a normalization factor, and f(Ecoll) has the form:
| (2) |
where A1 and A2 are parameters, Eth is the thermal energy of the ensemble of peptide ions prior to ion activation, and Ecoll is the collision energy. The normalized signal intensity for a particular reaction channel is given by the equation:
| (3) |
Calculated TFECs were constructed using the preceding procedure and compared to the experimental data. The same energy deposition function was used for all reaction times. The fitting parameters were varied until the best fit to experimental curves was obtained. The fitting parameters included the critical energy and activation entropy for all reaction channels. The parameters characterizing the energy deposition function (eqn (1) and (2)) were determined by fitting the experimental survival curves of the singly protonated RVYIHPF and leucine enkephalin, for which the dissociation parameters are known from our previous studies,30,31 and kept the same for all reaction times. Vibrational frequencies of the precursor ion were obtained from the theoretical calculations described as follows. Vibrational frequencies for the transition state were estimated by removing one C–N stretch (reaction coordinate) from the parent ion frequencies, as well as varying all frequencies in the range of 500–1000 cm−1 until the best fit to the experimental data was obtained.
Theoretical calculations
Structures and stabilities of A3pSA3-NH2 and its complexes with DCM and DGD were examined using density functional theory (DFT) calculations. Molecular mechanics modeling was performed on an SGI Onyx 3200 workstation running Insight II/Discover (97.0, Accelrys Software Inc., San Diego, CA). Initial structures of A3pSA3-NH2, DCM, DGD, and the NCXs were built using the Biopolymer builder of Insight II (Biosym Technologies, San Diego, CA). The structures were energy minimized using the CFF91 force field47 and the quasi-Newton–Raphson (VA09A) minimization algorithm.48 The conformational space of monomers and complexes was explored using simulated annealing. Molecular dynamics (MD) simulations were performed at 1000 K and 500 K. Two types of complexes were considered for complexes of A3pSA3-NH2 with DGD: (1) NCX composed of a deprotonated peptide and a doubly protonated DGD, [A3pSA3-NH2-H]−[DGD+2H]2+ and (2) NCX composed of a neutral peptide and a singly protonated DGD, [A3pSA3-NH2][DGD+H]+. Ten lowest energy structures of each species were selected for DFT calculations carried out using NWChem (version 5.1) developed and distributed by Pacific Northwest National Laboratory (PNNL).49 The selected structures of NCXs, neutral A3pSA3-NH2, [DGD+H]+, and doubly charged DCM were initially optimized at the B3LYP/3–21G level of theory. Subsequent optimization and vibrational frequency calculation for selected three lowest-energy structures were performed using the B3LYP/6–31G(d) level of theory. Single-point energies were calculated at a higher level of theory, B3LYP/6–31++G(d,p), for all optimized structures, and zero-point energy (ZPE) corrections were included. In addition, three simplified model systems (CH3-ApSA-CH3, CH3-ApTA-CH3, and CH3-ApYA-CH3) were constructed to evaluate the energetics and mechanisms of the H2PO4 − loss from the deprotonated A3pSA3-NH2 peptide, the H2PO4−and PO3− losses from deprotonated A3pTA3-NH2 peptide, and the PO3− loss from deprotonated A3pYA3-NH2 peptide, respectively. All calculations for this model system were performed at the MP2(full)/ 6–31++G(d,p)//B3LYP/6–31G(d) level of theory, including ZPE corrections.
Results and discussion
In this study, time- and collision energy-resolved SID of mass-selected non-covalent complexes of phosphorylated A3pXA3-NH2 peptides (X = S, T, Y) with DCM and DGD was performed using HSAM as a target. Exact mass-to-charge ratios of the complexes are listed in Table 1. The DCM ligand is a dication of molecular formula C16H38N22+ that binds to a deprotonated peptide forming a singly charged complex. In contrast, DGD is a neutral ligand (C12H28N6) that may form a proton-bound dimer with a peptide molecule. Differences between these two ligands determine the observed differences in fragmentation behavior and the relative stability of the complexes.
Fragmentation pathways
Fig. 1 shows SID spectra corresponding to ca. 90% fragmentation obtained for all six complexes. In agreement with previous work,15 dissociation of DCM2+–[A3pXA3-NH2-H]− complexes is dominated by the H2PO4− abstraction from peptides containing phosphorylated S or T and the PO3− abstraction from peptides containing phosphorylated T or Y. The observed losses are characteristic of deprotonated phosphopeptides, which is consistent with the composition of the complexes. The resulting DCM2+ + H2PO4− (m/z 355.273) and DCM2+ + PO3− (m/z 337.262) are observed as singly charged fragment ions in SID spectra. Other fragmentation channels include loss of N(CH3)3 from complexes containing T and Y and the formation of the [DCM-CH3]+ fragment ion. Losses of N(CH3)3 and CH3X were observed by Gross and Williams50 as primary dissociation pathways of singly charged decamethonium salts containing small counteranions (DCM2+X−, X = Br, I, or OAc) in the gas phase. Our results indicate that similar dissociation pathways are available to DCM2+ bound to a complex peptide anion. However, in DCM2+–[A3pXA3-NH2−H]− complexes examined in this study, cleavages of phosphate bonds efficiently compete with cleavages of DCM bonds.
Fig. 1.
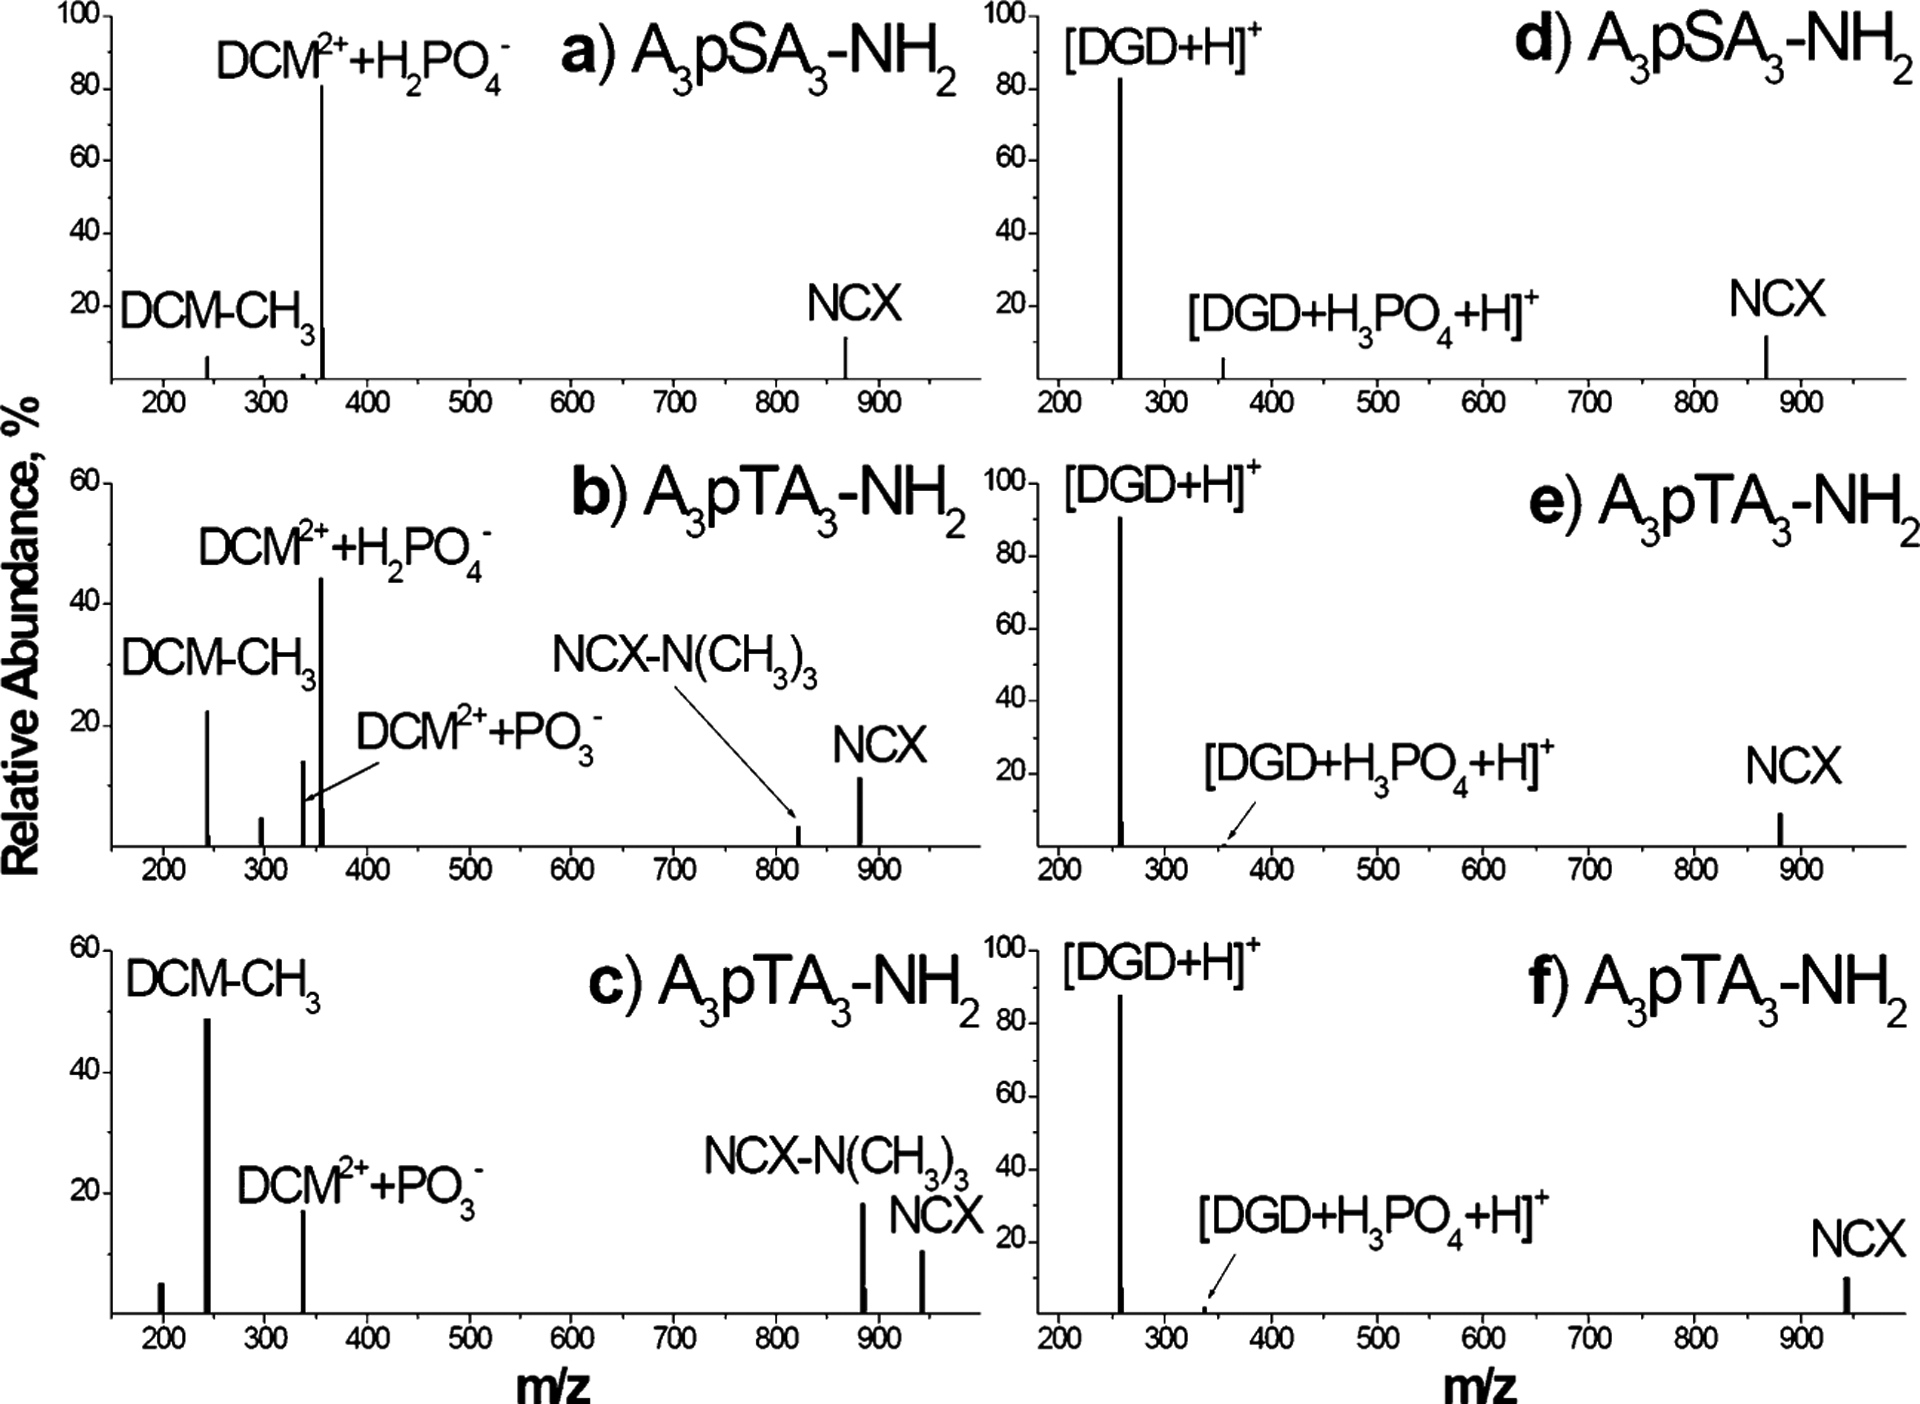
SID spectra corresponding to 90% fragmentation obtained on the HSAM surface at 1 s reaction delay for non-covalent complexes of DCM (left panels) and DGD (right panels) with A3pXA3-NH2 peptides, X = S (a, d); X = T (b, e); X = Y (c, f).
Gronert and Azebu51 studied gas-phase fragmentation of complexes composed of a dianion of 4-carboxy-4′-sulfodiphenylacetylene and a series of tetraalkylammonium cations. Two competing processes were observed upon collisional activation of these complexes: (1) alkylation of the dianion through the SN2 reaction and (2) the E2 elimination reaction resulting in protonation of the dianion. They found that the substitution on the methyl group is a preferred pathway for the tetramethylammonium cation, while the elimination reaction is important for longer alkyl chain substituents. Similar reactivity was reported by Hodyss et al. for alkylammonium cations and triphosphate dianions.52 The formation of the [DCM-CH3]+ fragment ion observed in this study is likely another example of the SN2 reaction reported in these studies. Furthermore, the absence of the E2 pathway resulting in formation of a protonated peptide is also in agreement with that study.
As discussed earlier, dissociation of DCM2+–[A3pXA3-NH2-H]− complexes is dominated by covalent bond cleavages resulting in abstraction of the H2PO4− or PO3− from the phosphorylated side chain. This pathway is a reverse of the phosphorylation reaction in gas-phase clusters examined by Beauchamp and co-workers.53 Cleavage of the non-covalent interaction resulting in formation of the DCM2+ and [A3pXA3-NH2-H]− product ions is unlikely because of the large Coulomb barrier for separation of the oppositely charged products. In contrast, because DGD is a neutral ligand, dissociation of DGD–A3pXA3-NH2 complexes is dominated by cleavage of the non-covalent bond, resulting in formation of an abundant [DGD+H]+ fragment. Interestingly, minor fragments corresponding to covalent bond cleavages, [DGD+H3PO4 + +H]+ and [DGD+HPO +H]+, are also observed in SID spectra.
Relative stability of the complexes
Relative stabilities of the complexes towards dissociation are compared in Fig. 2, where the relative abundance of each precursor ion is plotted as a function of collision energy (Fig. 2a, b) and a function of collision energy normalized to the number of vibrational degrees of freedom (Fig. 2c, d). It is well known that the kinetic shift54—the internal energy in excess of the dissociation threshold required to produce detectable fragmentation of a polyatomic ion on the time-scale of a mass spectrometer—increases linearly with the number of number of vibrational degrees of freedom. Scaling of collision energy by the number of number of vibrational degrees of freedom eliminates the effect of the size of the precursor ion on the position of survival curves shown in Fig. 2a and b. As a result, the differences in positions of survival curves plotted as a function of collision energy scaled by the number of number of vibrational degrees of freedom (Fig. 2c, d) can be attributed only to differences in the energetics and entropy effects in dissociation of the complexes. Interestingly, similar stabilities were obtained for complexes containing DGD. Meanwhile, the stability of DCM–A3pXA3-NH2 complexes shows a significant dependence on the identity of the phosphorylated amino acid. Specifically, the stability of the DCM–A3pXA3-NH2 complexes towards fragmentation increases in the order pS < < pT < pY, while the stability of the DGD–A3pXA3-NH2 complexes increases in the order pS ≌ pT < pY.
Fig. 2.
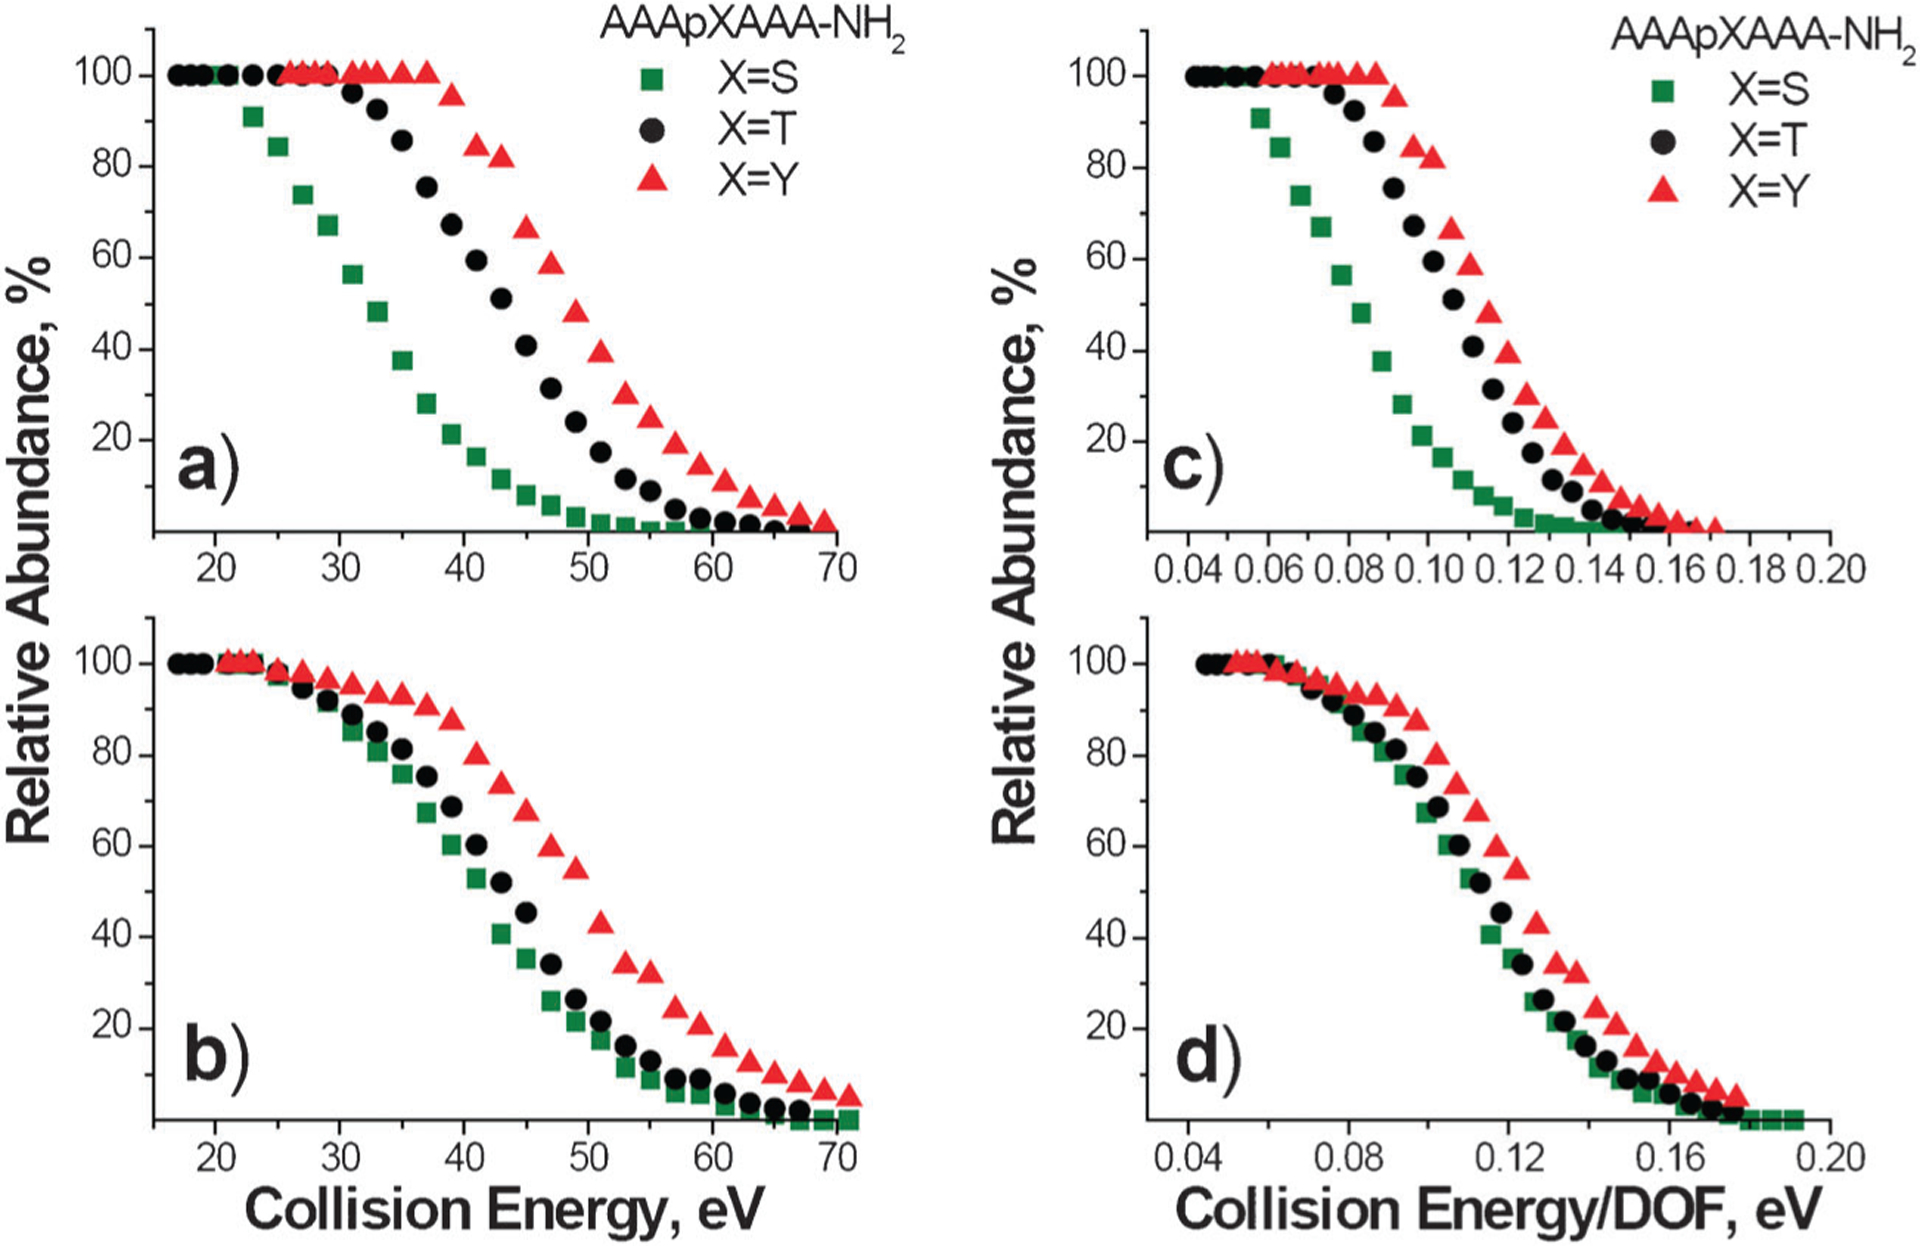
Survival curves obtained at a reaction delay of 1 s plotted as a function of collision energy (left panels) and collision energy scaled by the number of vibrational degrees of freedom, DOF, (right panels) for DCM–A3pXA3-NH2 complexes (a, c) and DGD–A3pXA3-NH2 complexes (b, d). The green squares correspond to X = S, black circles correspond to X = T, and red triangles correspond to X = Y.
Fragmentation efficiency curves of the major fragments of DCM–A3pXA3-NH2 complexes at 1 s reaction delay are shown in Fig. 3. The results demonstrate that the observed differences in stability of these complexes are mainly attributed to the differences in appearance energies (AEs) of DCM2++H2PO4− and DCM2+ +PO3− fragment ions. Facile loss of H2PO4− from phosphoserine determines the stability of the DCM–A3pSA3-NH2 complex, for which other dissociation products are observed at relatively high collision energies. In contrast, significantly higher energy is required for the H2PO4 loss from phosphothreonine. As a result, other dissociation channels of the DCM–A3pTA3-NH2 complex efficiently compete with the DCM2++H2PO4− ion formation. Notably, the AE for the PO3− loss from phosphotyrosine is higher than the AE for the formation of the [DCM-CH3]+ fragment, which is observed as a major product ion of the DCM–A3pYA3-NH2 complex. The higher threshold for the loss of PO3− from phosphotyrosine is consistent with a previous study of Bowie and co-workers.55
Fig. 3.
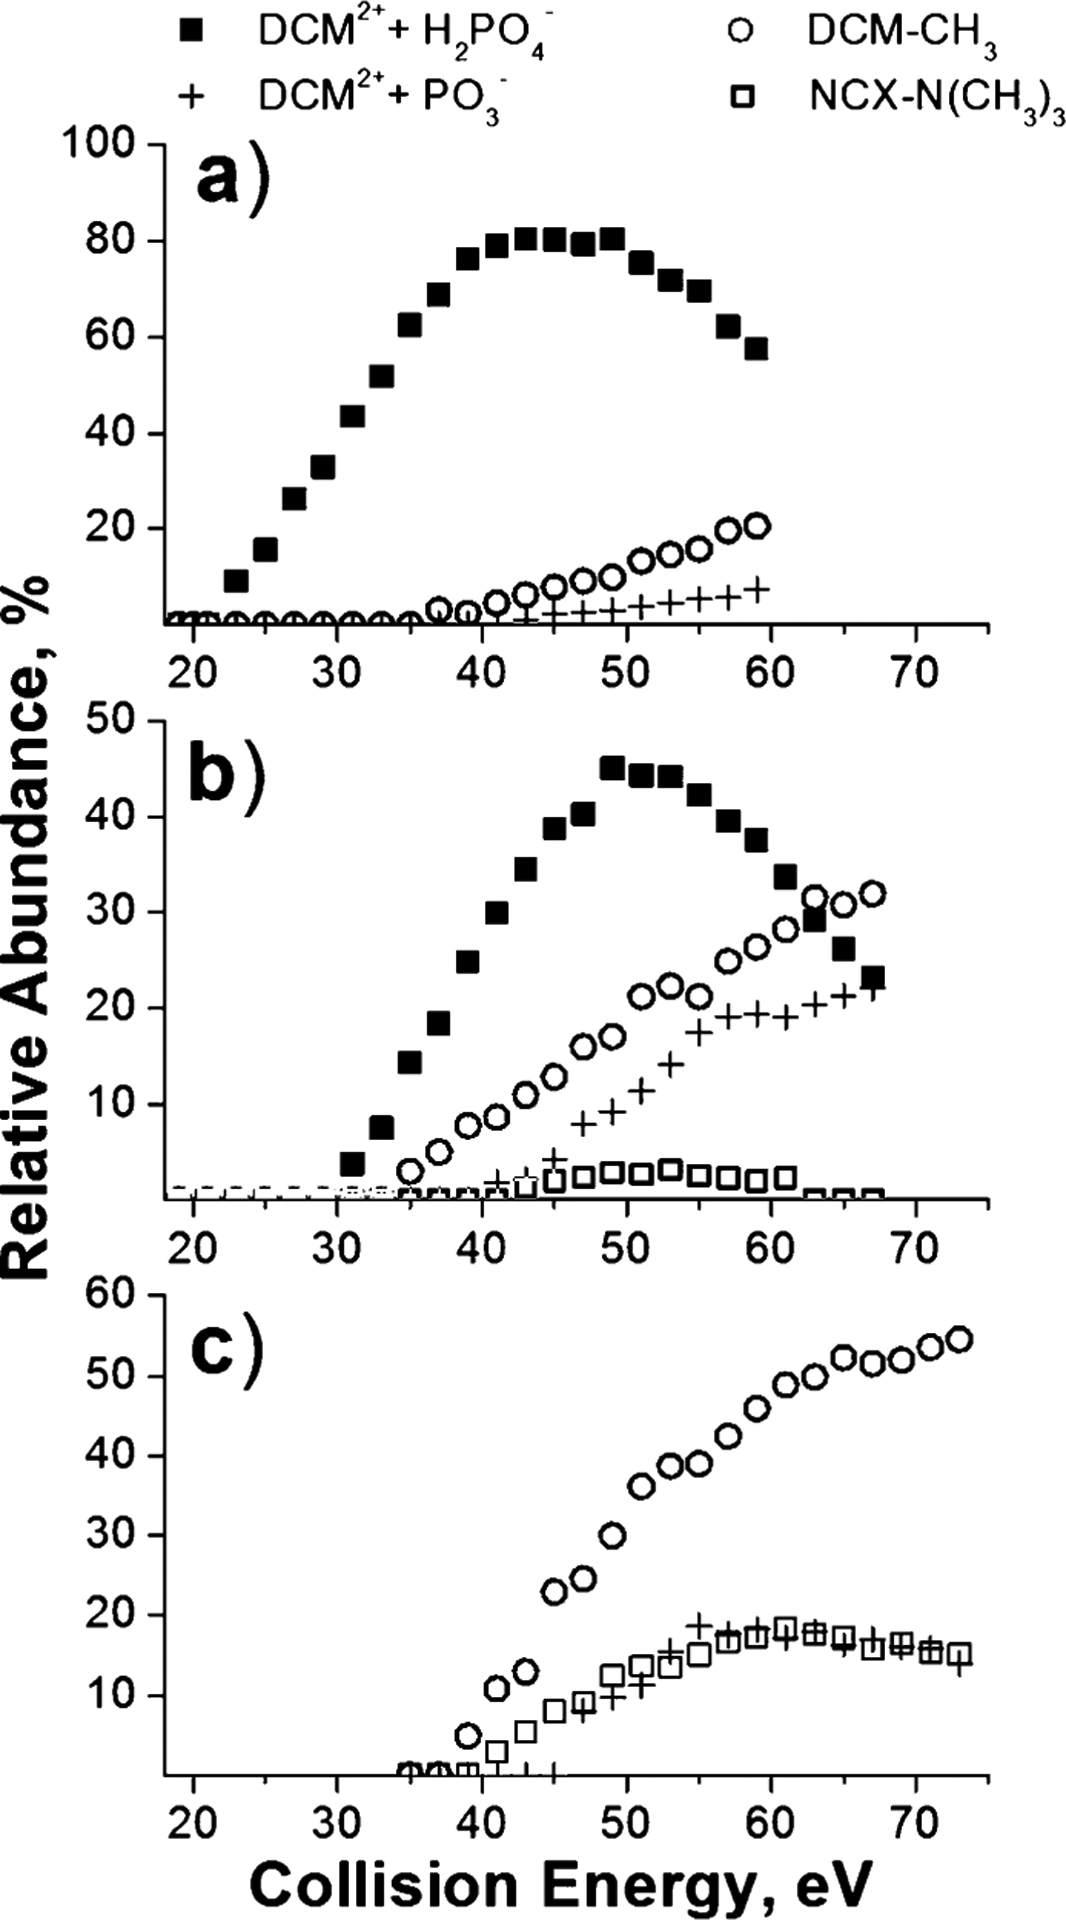
Fragmentation efficiency curves of the major DCM2+ + H2PO4− (filled squares), DCM2+ + PO3− (crosses), DCM-CH3 (open circles), and NCX-N(CH3)3 (open squares) product ions of DCM–A3pXA3-NH2 complexes—(a) X = S, (b) X = T, (c) X = Y—obtained at 1 s reaction delay.
In contrast to DCM–A3pXA3-NH2 complexes, the stability of DGD–A3pXA3-NH2 complexes is determined by the strength of the non-covalent binding. The covalent bond cleavage is observed as a minor channel. Comparison of fragmentation efficiency curves obtained for fragment ions corresponding to the covalent bond cleavage shown in Fig. 4 indicates that the AE for this channel depends on the identity of the phosphorylated amino acid. Specifically, similar to DCM–A3pXA3-NH2 complexes, the lowest AE for covalent bond cleavage was observed for the DGD complex containing phosphoserine, while higher AEs were observed for fragment ions originating from phosphothreonine and phoshotyrosine.
Fig. 4.
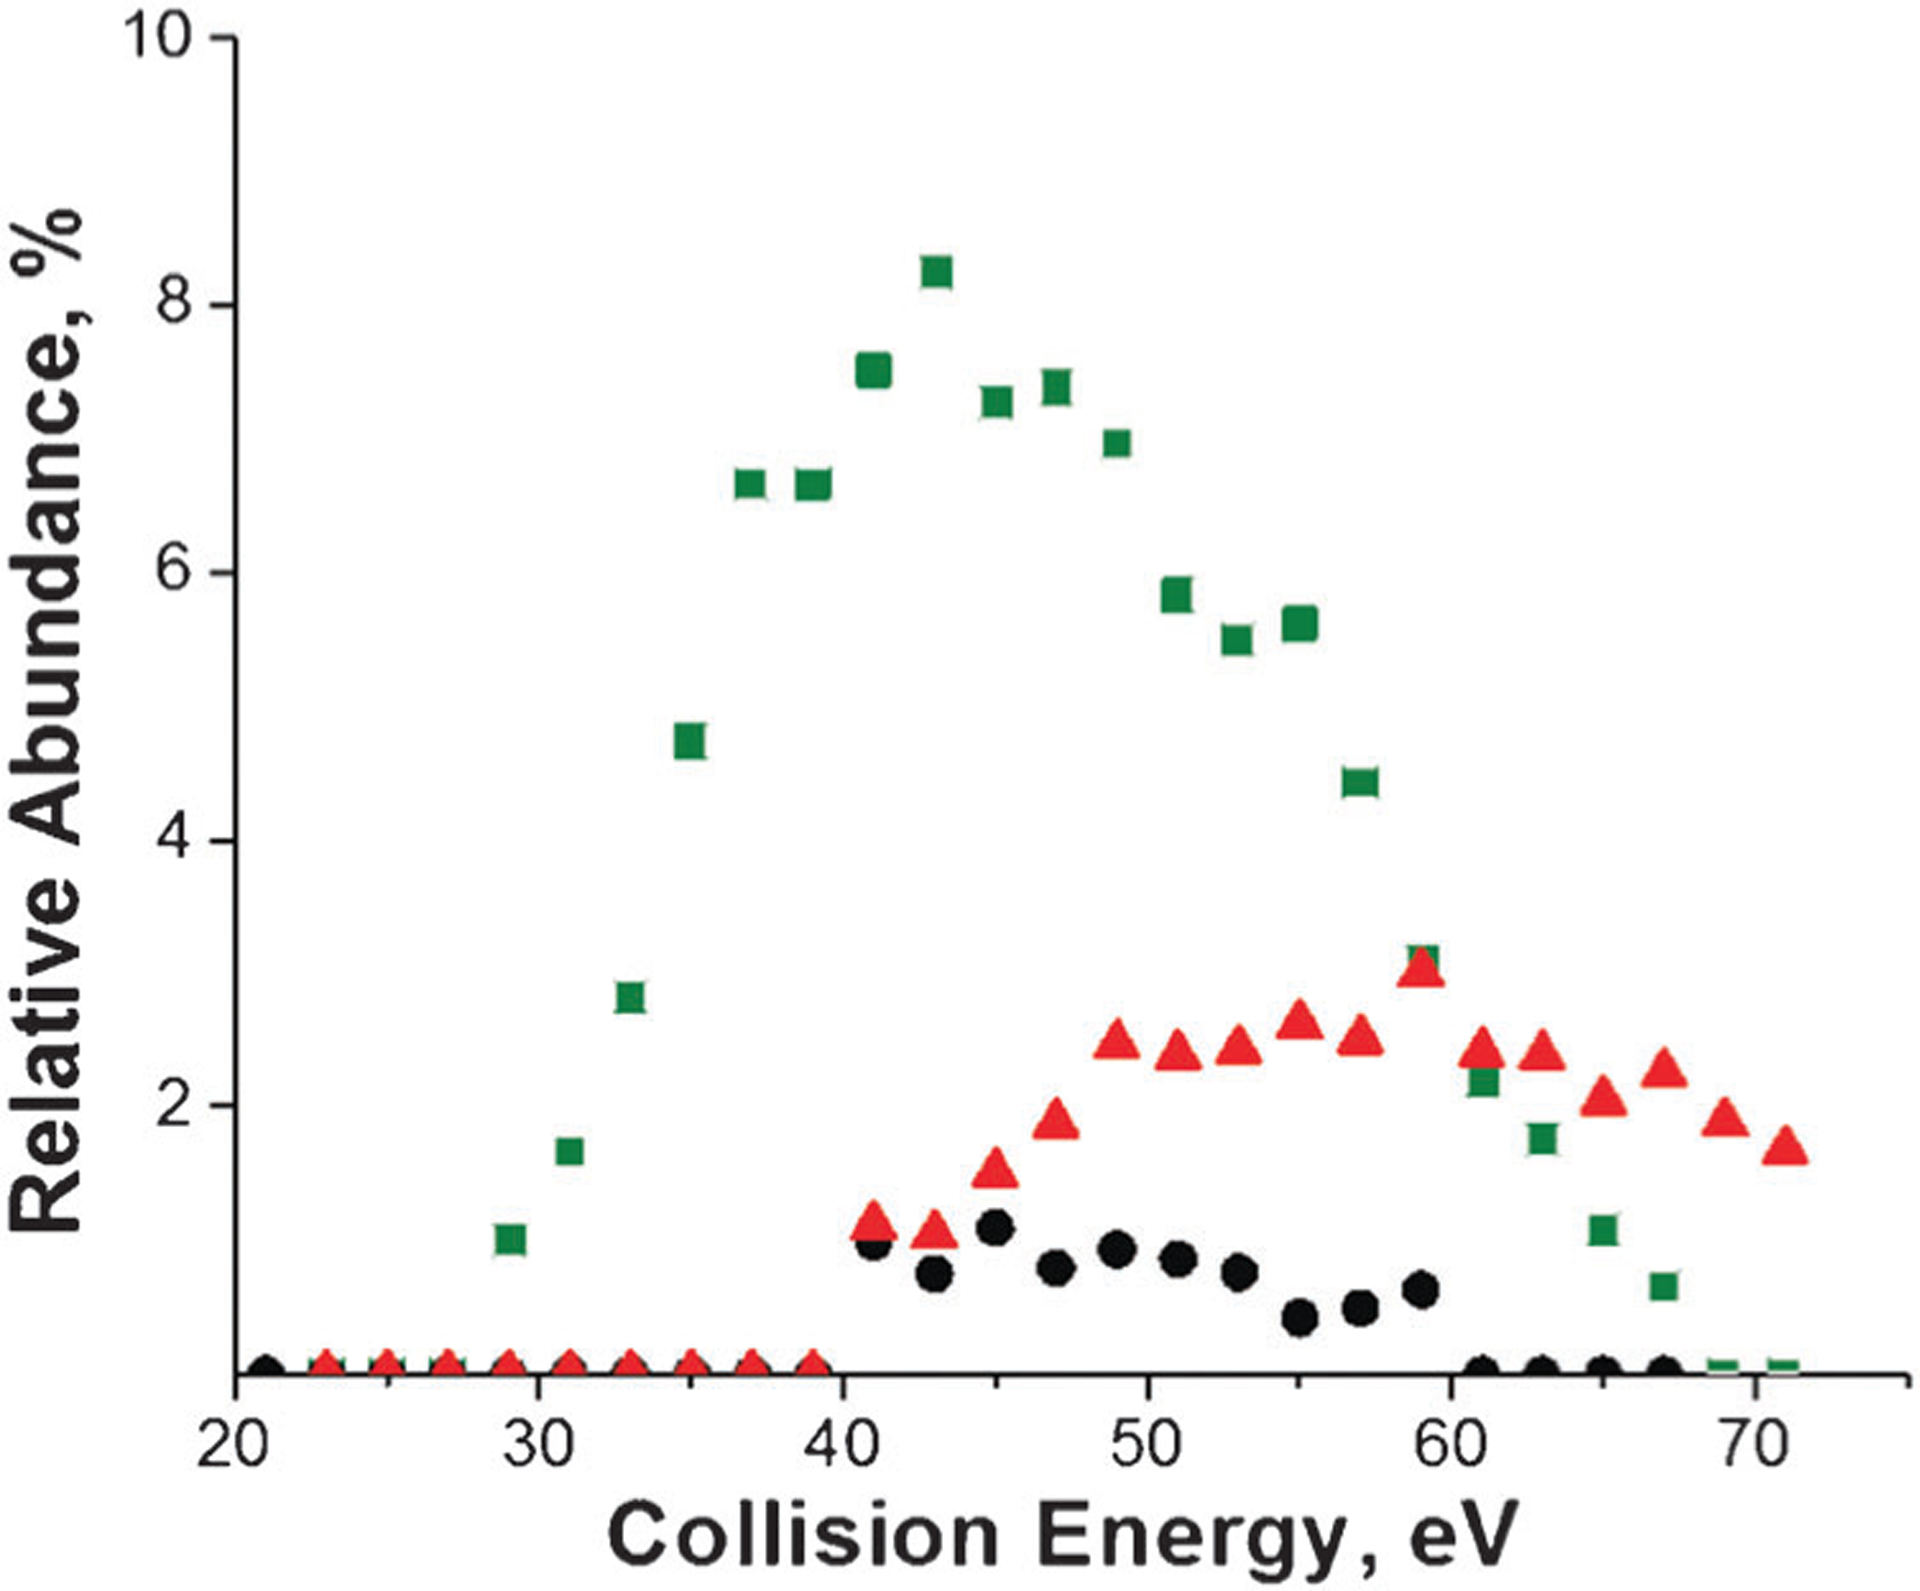
Fragmentation efficiency curves of the fragment ions corresponding to covalent bond cleavages in DGD–A3pXA3-NH2 complexes obtained at a reaction delay of 1 s. The green squares correspond to X = S, black circles correspond to X = T, and red triangles correspond to X = Y.
The energetics and dynamics of fragmentation
RRKM modeling of the experimental data was performed by fitting TFECs of individual dissociation channels. Comparison between the experimental results and simulated TFECs obtained for complexes of A3pSA3-NH2 is shown in Fig. 5. Simulated curves provide a reasonable representation of the time- and collision energy-dependent data over a broad range of collision energies and reaction delay times. Similar results were obtained for other complexes examined in this study. We note that abstraction of the phosphate group from the peptide is characterized by fairly slow kinetics (Fig. 5b and e) compared to other dissociation channels (Fig. 5c and f) with slower kinetics observed for the DGD-A3pSA3-NH2 complex.
Fig. 5.
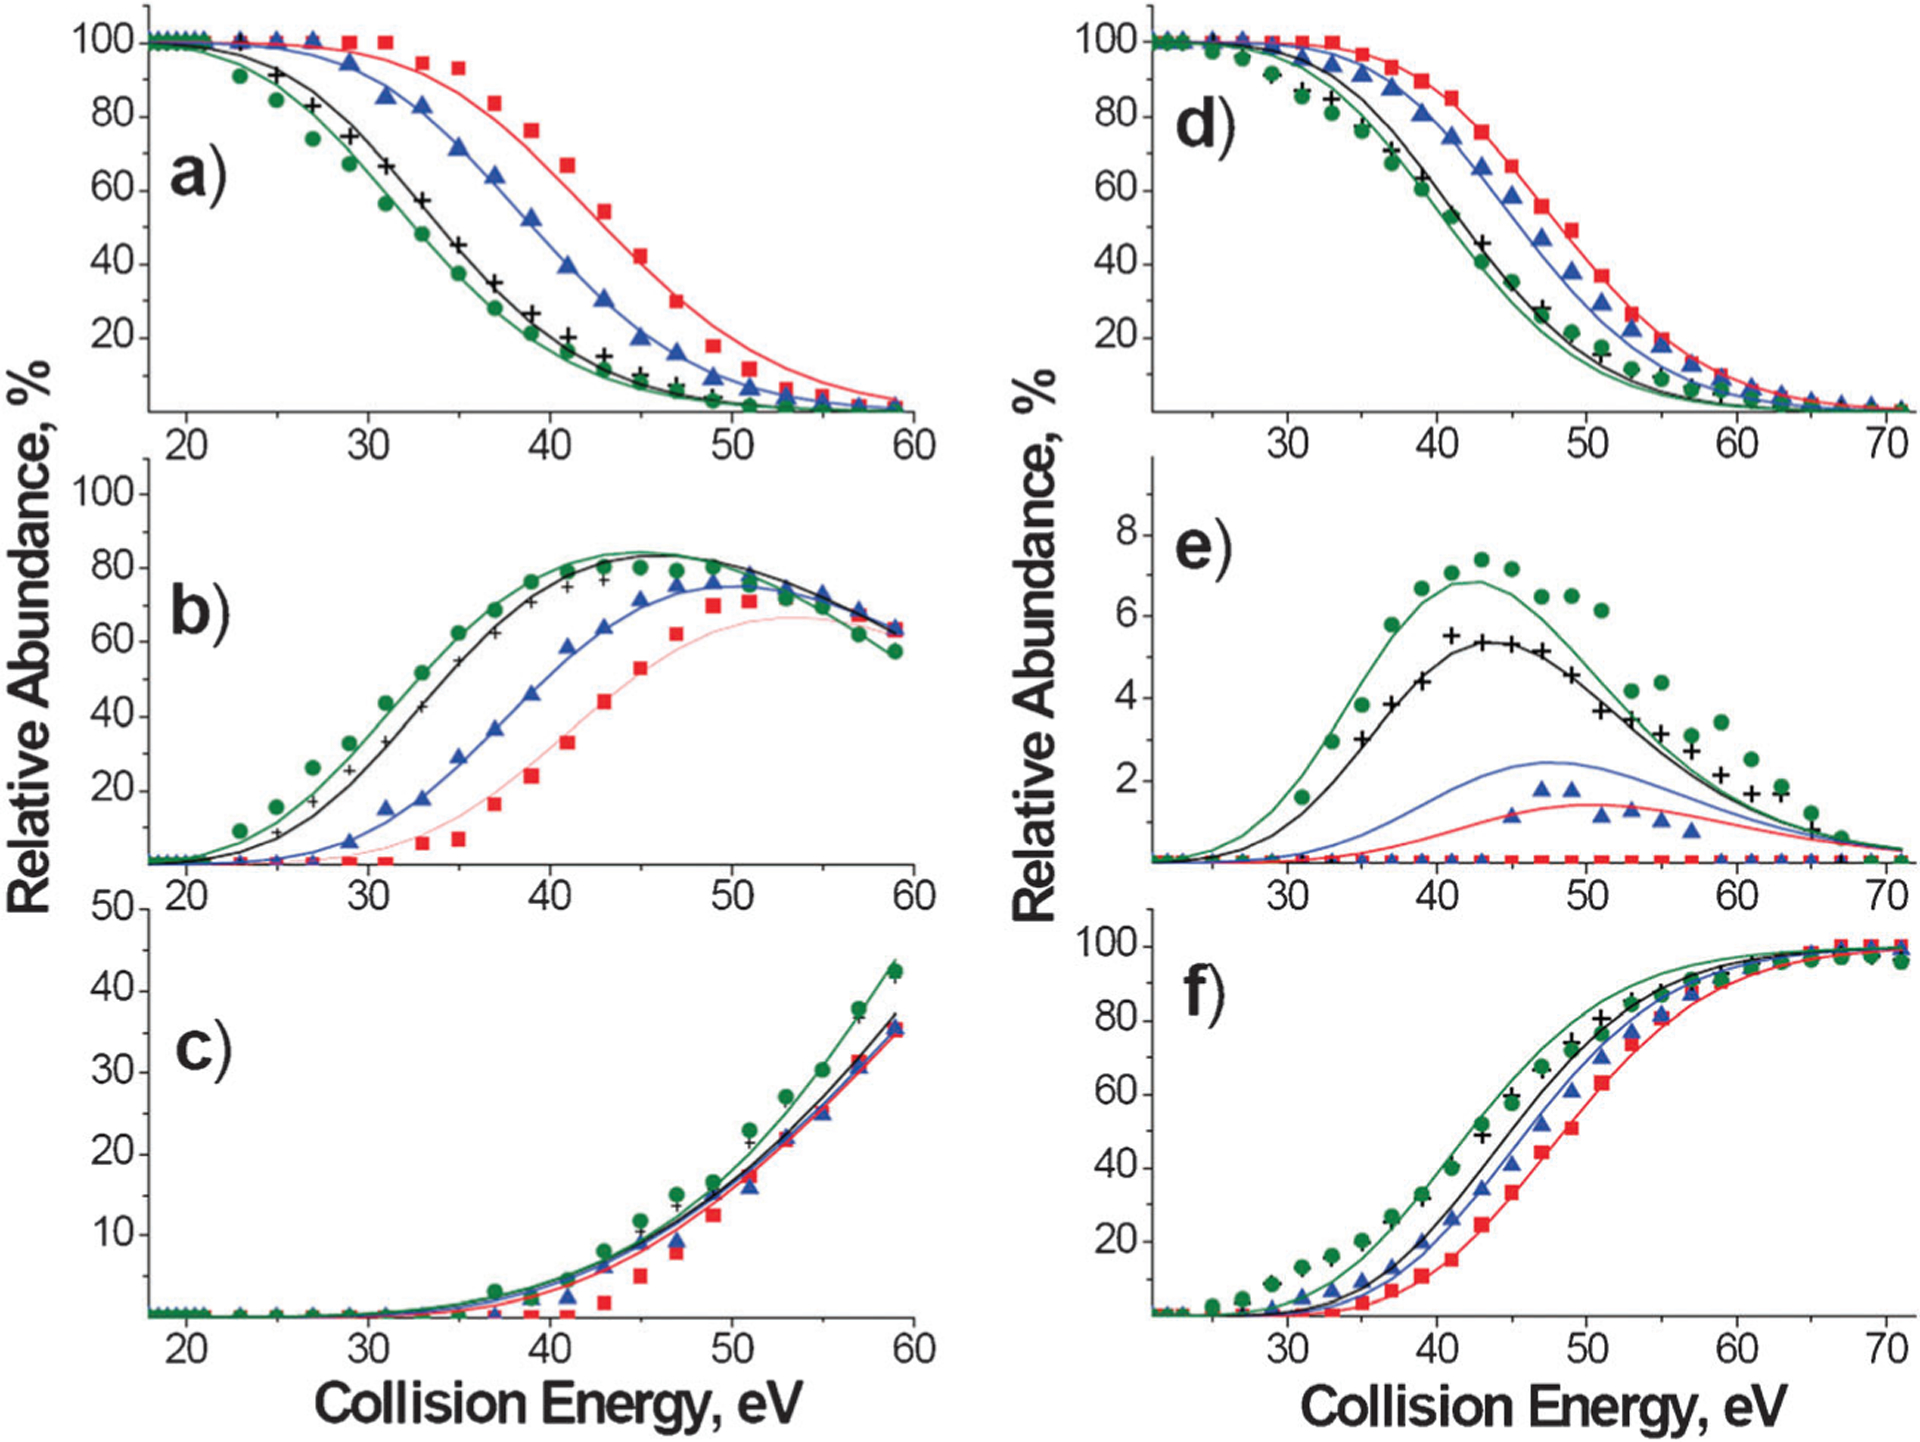
Experimental time-resolved survival curves for (a) the DCM–A3pSA3-NH2 and (d) DGD–A3pSA3-NH2complexes; TFECs for the (b) DCM2+ + H2PO4− and (c) other fragment ions of the DCM–A3pSA3-NH2 complex combined together for RRKM modeling; TFECs for (e) the [DGD + H3PO4 + H]+ fragment; (f) [DGD + H]+ fragment. The results are shown for reaction delays of 1 ms (red squares), 5 ms (blue triangles), 50 ms (black crosses), and 1 s (green circles). Solid lines show RRKM modeling results obtained for the corresponding reaction delays.
Dissociation parameters for cleavages on non-covalent bonds and phosphate bonds derived from the simulations for all six complexes are listed in Table 2. Both the threshold energy and the activation entropy associated with the formation of DCM2+ + H2PO4− (for X = S and T) and DCM2+ + PO3− (for X = Y) fragment ions of DCM–A3pXA3-NH2 complexes increase in the order S < T < Y, which matches the increase in the stability of these complexes towards dissociation observed experimentally. Because the threshold energy and activation entropy have opposing effects on the dissociation rate constant (the rate constant increases with a decrease in the threshold energy and an increase in the activation entropy), the increase in the relative stability in the order S < T < Y indicates the energy effect plays a more important role than the entropy effect in determining the stability of DCM–A3pXA3-NH2 complexes. In contrast, the small increase in the stability of the DGD–A3pYA3-NH2 complex is attributed to the lower activation entropy (slower kinetics) of the non-covalent bond cleavage in this system.
Table 2.
Threshold energies, E0; activation entropies, ΔS‡; and pre-exponential factors, A, for individual reaction channels of NCX
| Ligand | DCM | DGD | |||
|---|---|---|---|---|---|
| DCM2+ + H2PO4− | DCM2+ + PO3− | [DGD + H]+ | [DGD + H3PO4 + H]+ | [DGD + HPO3 + H]+ | |
| A3pSA3−NH2 | |||||
| E0, eV | 1.21 | 1.79 | 1.37 | ||
| ΔS‡, eua | 3.1 | 34 | 4.1 | ||
| A, s−1 | 1 × 10¹⁴ | 8 × 10²⁰ | 3 × 10¹² | ||
| A3pTA3−NH2 | |||||
| E0, eV | 1.47 | 1.9 | 1.86 | 1.49 | |
| ΔS‡, eu | 10 | 34 | 40 | −3.4 | |
| A, s−1 | 4 × 10¹⁵ | 9 × 10²⁰ | 1 × 10²² | 5 × 10¹² | |
| A3pYA3−NH2 | |||||
| E0, eV | 1.82 | 1.7 | 1.5 | ||
| ΔS‡, eu | 24 | 22 | −2.7 | ||
| A, s−1 | 6 × 10¹⁸ | 2 × 10¹⁸ | 7 × 10¹² |
e.u. = entropy unit = cal mol−1 K−1; activation entropies and pre-exponential factors at 450 K. The estimated uncertainties are ±7% for the threshold energies and ±15% for the activation entropies.
In agreement with previous studies on different systems,34,35,56 dissociation of the non-covalent binding is characterized by high positive activation entropy and a fairly high dissociation threshold. Interestingly, the lowest threshold energy was obtained for the most stable DGD–A3pYA3-NH2 complex, indicating that its stability mainly results from lower activation entropy that hinders dissociation. In contrast, similar entropy effects, but different energetics were obtained for cleavages of phosphate bonds in DGD–A3pXA3-NH2 complexes. Although the covalent bond cleavage in DGD–A3pXA3-NH2 complexes is associated with a substantially lower dissociation threshold, this channel is observed only as a minor dissociation pathway in SID spectra. The dominant cleavage of the non-covalent binding observed experimentally is promoted by the large positive entropy effect. This finding further emphasized the role of activation entropy in the gas-phase fragmentation of large molecules and biomolecular complexes.57
Fig. 6a compares microcanonical rate-energy dependences for dissociation of non-covalent binding with cleavages of phosphate bonds in DGD–A3pXA3-NH2 complexes. While covalent bond cleavages are characterized by lower threshold energies, they can compete with dissociation of non-covalent binding only on a long timescale of an ion trap or an FTICR instrument. Microcanonical rate constants for cleavages of phosphate bonds in DCM– and DGD–A3pXA3-NH2 complexes are shown in Fig. 6b as solid and dashed lines, respectively. While threshold energies for dissociation of complexes containing A3pSA3-NH2 and A3pTA3-NH2 are similar, DCM–peptide complexes are less stable towards fragmentation because of higher entropy effects.
Fig. 6.
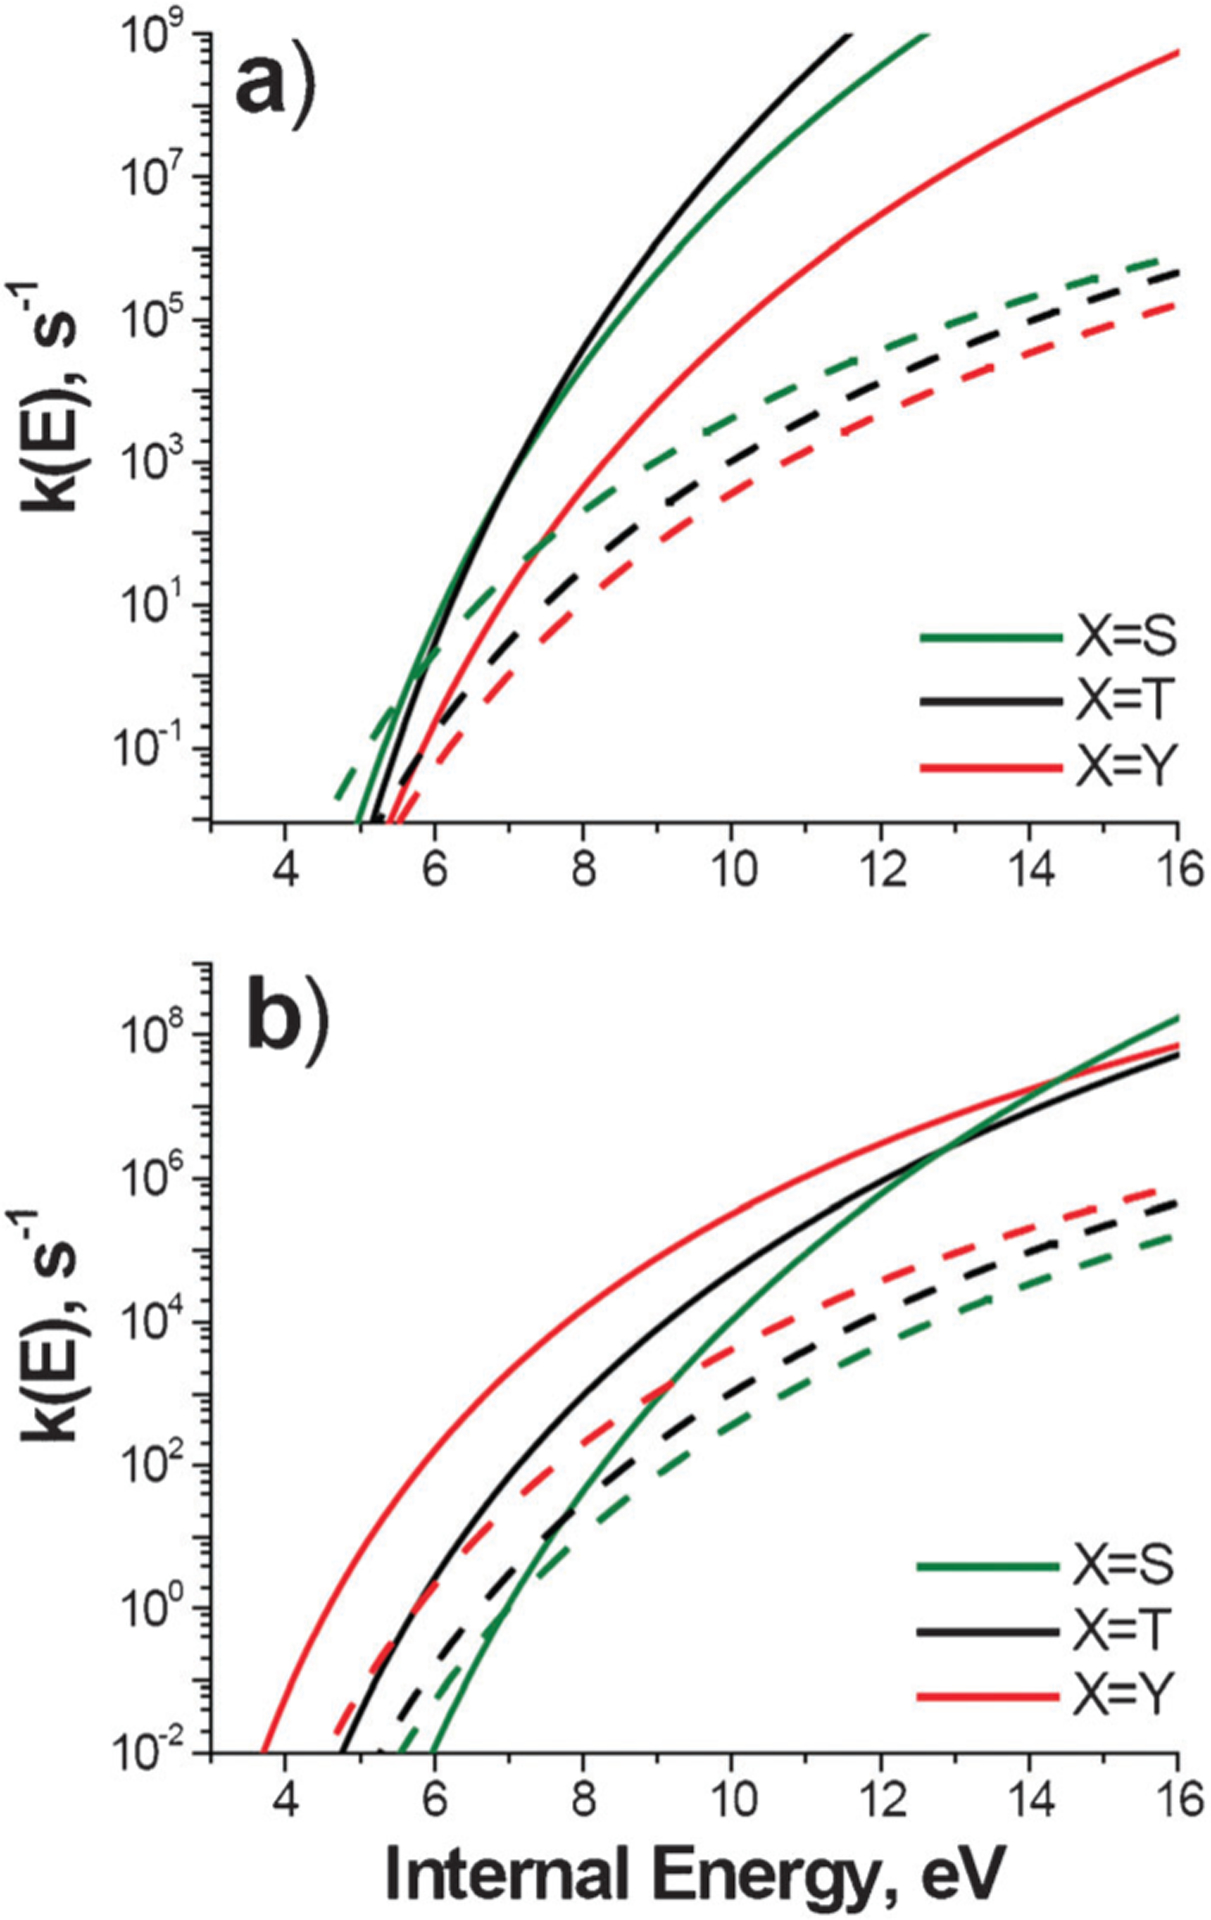
Comparison between microcanonical rate constants for dissociation of phosphate bonds in DGD–A3pXA3-NH2 complexes (dashed lines), (a) non-covalent binding (solid lines) in DGD–A3pXA3-NH2 complexes, and (b) phosphate bonds in DCM–A3pXA3-NH2 complexes (solid lines).
Comparison with electronic structure calculations
DFT calculations were performed to examine structures and stabilities of the non-covalent complexes containing A3pSA3-NH2. Fig. 7 shows lowest-energy structures of the DCM and DGD complexes with A3pSA3-NH2. We found that the most stable structure of the DGD–peptide complex (Fig. 7a) is composed of doubly protonated DGD and the singly deprotonated peptide, [DGD+2H]2+[A3pSA3-NH2-H]−. Meanwhile, the canonical structure, [DGD+H]+[A3pSA3-NH2], shown in Fig. S1,† is approximately 16.8 kcal mol−1 less stable. In the DGD–peptide complex, the deprotonated phosphate group is chelated by the protonated guanidino groups. The structure is stabilized by six hydrogen bonds—four of which are formed between the phosphate and guanidino groups of the DGD. The structure of the DCM2+[A3pSA3-NH2-H]− complex is shown in Fig. 7b. In this complex, only the deprotonated phospho group is solvated by one quaternary amino group of DCM and by the C-terminal NH2 group of the peptide. Another quaternary amino group of DCM interacts with the first and second carbonyls of the peptide backbone.
Fig. 7.
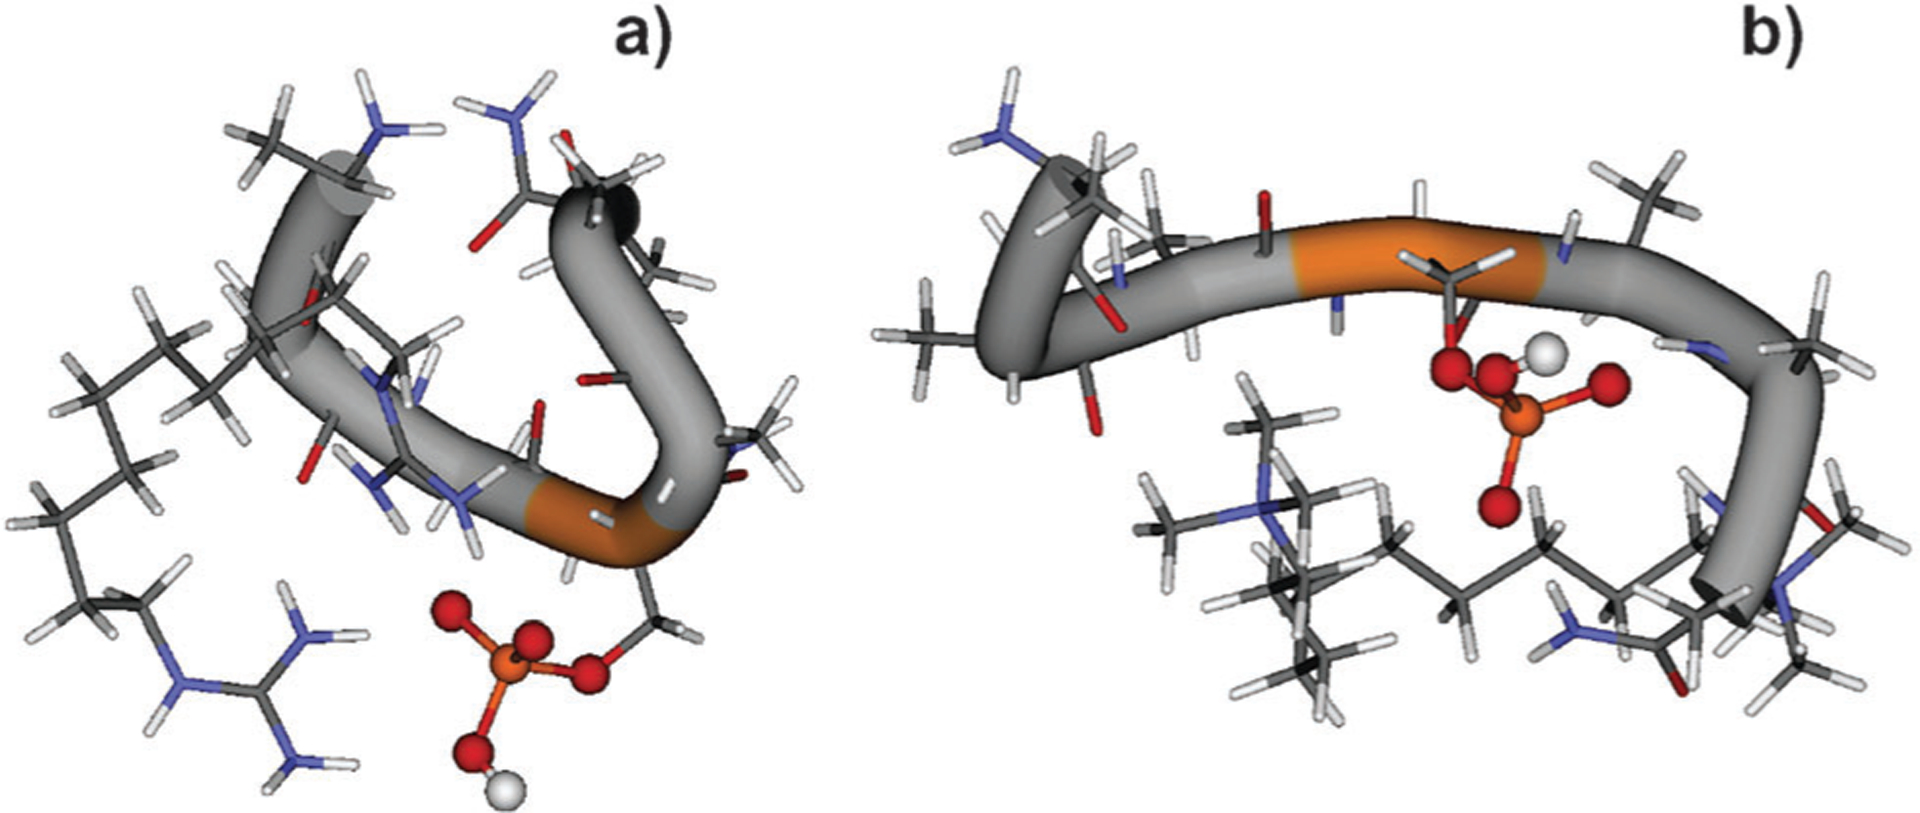
Low-energy structures of (a) DGD–A3pSA3-NH2 and (b) DCM–A3pSA3-NH2 complexes from DFT calculations.
Because dissociation of the non-covalent binding in the [DGD + 2H]2+[A3pSA3-NH2-H]− complex is characterized by a loose transition state, the binding energy for this complex can be calculated from the energy difference between the lowest-energy structures of the complex and the products, A3pSA3-NH2 and [DGD + H]+. The calculated value of 40.5 kcal mol−1 (1.76 eV), including the ZPE correction, is in excellent agreement with the experimentally measured threshold energy (1.79 eV) for the non-covalent bond cleavage in the DGD–A3pSA3-NH2 complex.
The experimentally measured threshold energies for the abstraction of H2PO4− from A3pXA3-NH2 peptides increase when phosphoserine is replaced with phosphothreonine but show only weak dependence on the type of the cationic ligand (DCM versus DGD) bound to the peptide. It follows that the energetics of this dissociation pathway is largely determined by the properties of the phosphorylated residue. We hypothesized that the threshold energy for this pathway could be reasonably estimated using electronic structure calculations for the phosphate loss from a simple deprotonated model system [CH3-NH(C=O)pX-NH(C=O)-CH3-H]− (X = S, T, Y). Andreazza et al.55 used a similar system for understanding the energetics and mechanisms of phosphate loss from deprotonated phosphopeptides. The results of DFT calculations are summarized in Fig. 8; the model system is denoted as [ApXA-H]−.
Fig. 8.
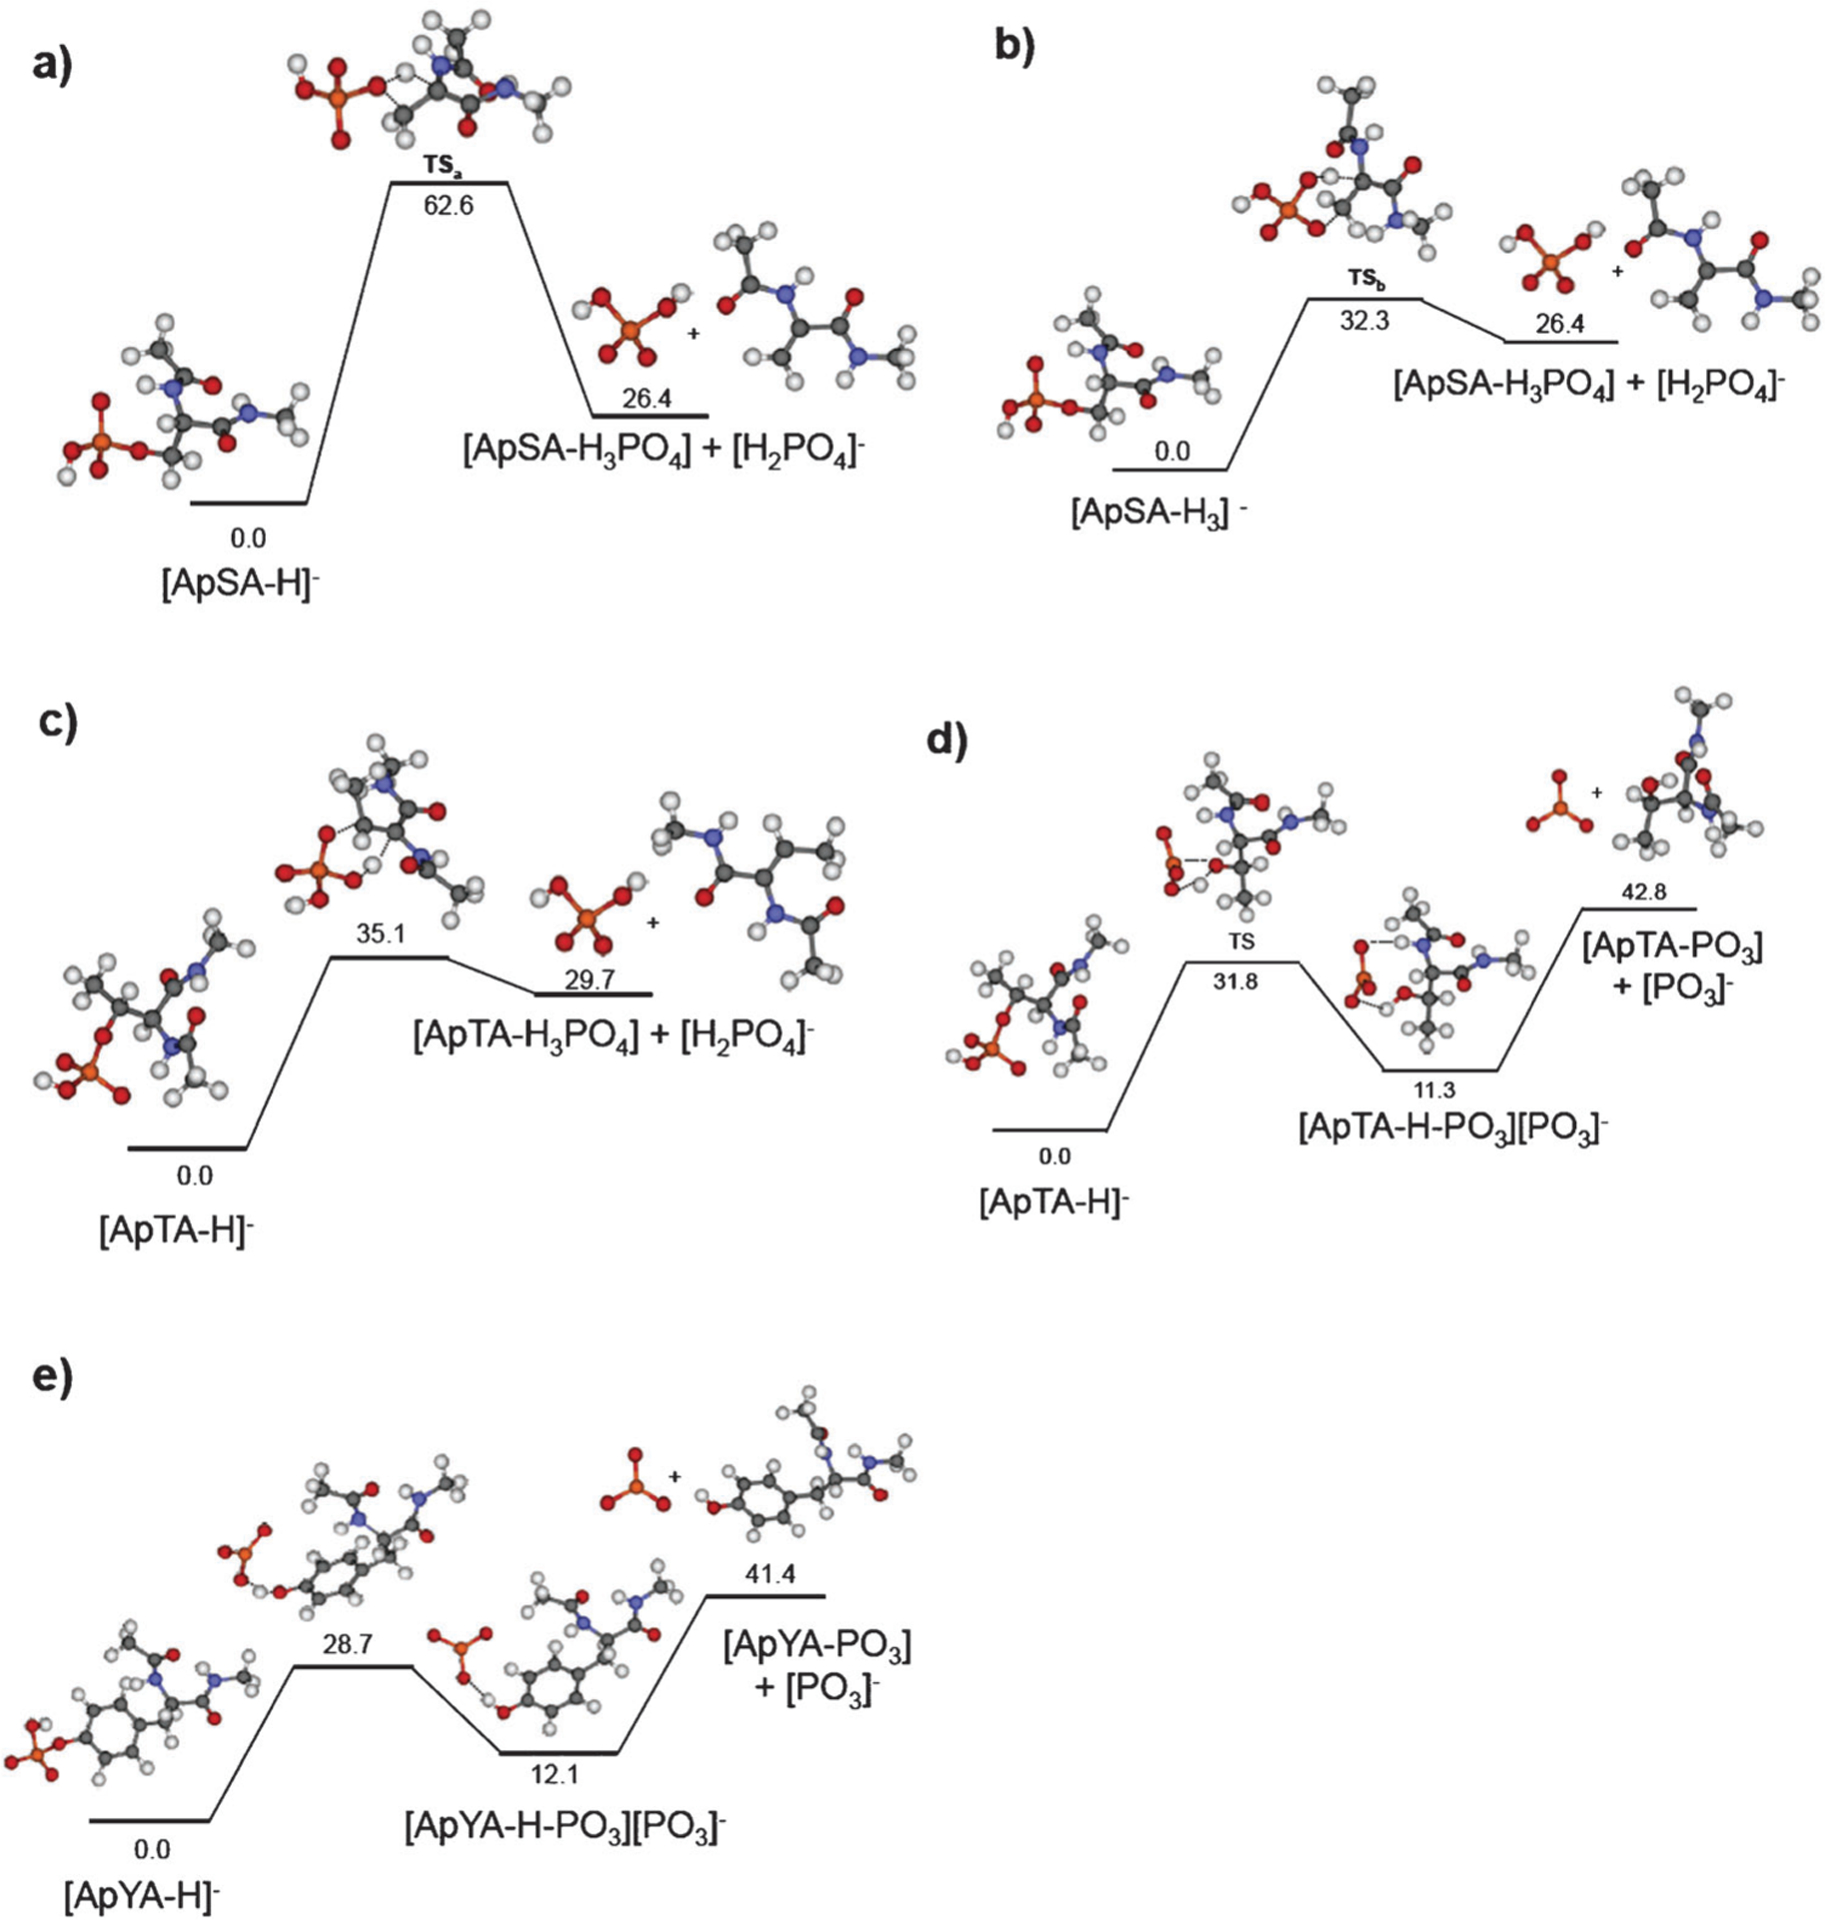
Calculated potential energy surfaces (MP2(full)/6–31++G(d,p)// B3LYP/6–31G(d) with ZPE correction) for the phosphate loss from a deprotonated model system [CH3-NH(C=O)pX-NH(C=O)-CH3-H]− (X = S, T, Y): (a) loss of H2PO4− from pS via transition state TSa; (a) loss of H2PO4− from pS via transition state TSb; lowest-energy pathways for the (c) loss of H2PO4− from pT; (d) loss of PO3− from pT; (e) loss of PO3− from pY.
Loss of H2PO4− from the deprotonated phosphate group of phosphoserine involves transfer of the proton from the a-carbon of serine to a phosphate oxygen atom followed by the formation of a Cα = Cβ double bond. Two possible pathways for this reaction were examined in this study: (1) the proton is transferred to the phosphate oxygen atom connected to the β-carbon of serine (TSa, Fig. 8a), and (2) the proton is transferred to a phosphate oxygen that is not connected to the Cβ of serine (TSb, shown in Fig. 8b). The results indicate that for both pathways, proton transfer and O–Cα bond cleavage occur simultaneously. However, the transition state of the second pathway (TSb), shown in Fig. 8b, is characterized by a much lower activation energy (32.3 kcal mol−1, 1.40 eV) than the transition state of the first pathway (TSa, 62.6 kcal mol−1, 2.72 eV) shown in Fig. 8a. The energy barrier calculated for dissociation pathway 2 of this model system is only slightly higher than the experimental value of 1.21 eV for the H2PO4− loss from the DCM–A3pSA3-NH2 complex. However, it is in excellent agreement with the experimental threshold energy of 1.37 eV obtained for the phosphate transfer in dissociation of the DGD–A3pSA3-NH2 complex. The calculated entropy change of 3.0 cal mol−1 K−1 at 450 K is in excellent agreement with the experimental value of 3.1 cal mol−1 K−1 obtained for the DCM–A3pSA3-NH2 complex and is slightly higher than the activation entropy of 4.1 cal mol−1 K−1 obtained for the DGD–A3pSA3-NH2 complex. These results demonstrate that the model system used in this study adequately represents the energetics and dynamics of phosphate loss observed in our SID experiments.
It should be noted that the calculated threshold energies for phosphate loss obtained in this study are significantly higher than the values reported by Bowie and co-workers.55 In that study, the initial structure of the [CH3-ApSA-CH3-H]− model system was deprotonated at the α-carbon. We used a different initial structure deprotonated at the phosphate group and found that this structure is 21.6 kcal mol−1 more stable than the structure deprotonated at the α-carbon. Starting with a lower-energy structure and using the transition state barrier height reported by Bowie and co-workers we estimate the overall barrier for H2PO4− loss of 33 kcal mol−1, which is quite close to the 32.3 kcal mol−1 value obtained in this study.
Loss of H2PO4− from phosphothreonine (Fig. 8c) is characterized by a somewhat higher dissociation barrier of 35.1 kcal mol−1 (1.52 eV), which is consistent with the experimental data obtained in this study for both DCM–A3pTA3-NH2 and DGD–A3pTA3-NH2 complexes (Table 2). In addition, the DCM–A3pSTA3-NH2 complex undergoes loss of PO3− as shown in Fig. 3. Our calculations indicate that PO3− loss is initiated by proton transfer from the phosphate oxygen to the oxygen atom connected to the Cb carbon of threonine followed by fragmentation of a weakly bound [CH3-NH(C=O)T-NH(C=O)-CH3] [PO3]− complex. The first step of this reaction pathway is associated with a fairly low barrier (31.8 kcal mol−1) and tight transition state, while the second rate-determining step is characterized by a high dissociation threshold (42.8 kcal mol−1, 1.85 eV) and loose transition state. The experimentally measured dissociation threshold of 1.9 eV and high positive activation entropy of 34 cal mol−1 K−1 are consistent with this mechanism.
Similar energetics and mechanism of PO3− loss was observed for the model system containing the phosphotyrosine side chain (Fig. 8e). The dissociation threshold of 41.4 kcal mol−1 (1.80 eV) for the rate-determining step of this process is in excellent agreement with the experimental value of 1.82 eV obtained for the PO3− transfer in dissociation of the DCM–A3pYA3-NH2 complex. In contrast, lower activation energy and entropy (1.50 eV, −2.7 cal mol−1 K−1) were found for the PO3− loss from DGD complex, which likely is attributed to the formation of a relatively tight transition state for the proton transfer during the fragmentation of this complex. The barrier for the PO3− loss from phosphotyrosine obtained in this study is somewhat lower than the barrier of 2.05 eV reported by Andreazza et al.55 for a similar model system. The higher barrier and a tight transition state were reported in that study for the loss of PO3− through a direct P–O bond cleavage. In contrast, the lower-energy pathway consistent with the experimental data reported in this study (Fig. 8e) is associated with proton transfer from the phosphate oxygen to the oxygen atom of the phenyl group followed by the formation of a proton-bound dimer. As a result, the rate-determining step of this fragmentation pathway is characterized by a loose transition state.
Our results indicate the covalent bond cleavage resulting in abstraction of the phosphate group from model phosphopeptides examined in this study can be adequately described using a rather small model system containing the phosphorylated side chain. However, such small model systems cannot describe the role of hydrogen bonding in non-covalent complexes on the energy and entropy effects observed experimentally. For example, lower activation entropies obtained for the phosphate loss from DGD–peptide complexes compared to DCM–peptide complexes could be attributed to the influence of the protonated guanidino groups in DGD on the proton transfer.
Conclusions
Understanding the energetics of interactions between amino groups in biomolecules with phosphates is of great interest for development of novel materials and drugs, understanding biomolecular recognition and self-assembly processes in biological systems, and enhancement of chemical sensors. Previous work demonstrated the unusual stability of arginine– phosphate7,16 and quaternary amine–phosphate7,15 electrostatic interactions. This study presents an initial step toward quantifying such interactions in the absence of solvent using complexes of DCM and DGD ligands with phosphorylated A3pXA3-NH2 (X = S, T, Y) peptides as model systems. Time- and collision energy-resolved fragmentation of these complexes following collisions with HSAM surfaces was examined using a specially configured FTICR-MS.
DFT calculations indicate, although DCM is a dication and DGD is a neutral ligand, both peptide–ligand complexes are composed of a deprotonated peptide and a doubly charged DCM or DGD ligand. SID experiments demonstrate that the properties of the ligand determine both the fragmentation behavior and the stability of the complexes toward dissociation. For example, complexes of peptides with the dicationic DCM ligand undergo facile abstraction of the phosphate group by the ligand. In contrast, dissociation of DGD–A3pXA3-NH2 complexes is dominated by the cleavage of the non-covalent binding with phosphate abstraction observed as a minor reaction channel. Detailed RRKM-based modeling of the time- and collision energy-resolved SID data demonstrated that cleavages of covalent C–O and P–O bonds are associated with low energy barriers and tight transition states, while dissociation of the non-covalent binding is characterized by relatively high threshold energy and large positive activation entropy. These findings indicate that the major reaction pathway of DGD–A3pXA3-NH2 complexes in the gas-phase resulting in cleavage of the non-covalent binding is promoted by the activation entropy, while the energetics favors cleavages of covalent C–O and P–O bonds of the phosphate group.
Dissociation parameters from DFT calculations are in excellent agreement with the results obtained from modeling the experimental data. Because dissociation of the non-covalent binding is characterized by a loose transition state, the dissociation barrier is readily obtained from the relative energies of the reactant and the products. Experimental threshold energies and activation entropies for covalent bond cleavages were compared with computational results obtained for a deprotonated model system, [CH3-NH(C=O)pX-NH(C=O)-CH3-H]− (X = S, T, Y). Dissociation parameters obtained for the loss of H2PO4− and PO3− from [CH3-NH(C=O)pX-NH(C=O)-CH3-H]− system are in good agreement with the experimental data, indicating this model system adequately describes the energetics, dynamics, and mechanism of phosphate abstraction by the cationic ligands observed in our SID experiments. Because this rather simple model system does not take into account the role of hydrogen bonding in the larger complexes examined experimentally, we conclude that for non-covalent complexes examined in this study phosphate abstraction is not significantly affected by the hydrogen bonding interactions within the peptide. This finding is consistent with the results of DFT calculations showing the deprotonated phosphate group is strongly solvated by the charged amino groups of the ligand for both DGD and DCM complexes.
Supplementary Material
Acknowledgements
This study was partially supported by the W. R. Wiley Environmental Molecular Sciences Laboratory (EMSL) user program, by a grant from the Division of Chemical Sciences, Geosciences, and Biosciences, Office of Basic Energy Sciences of the U. S. Department of Energy (DOE), and by the Intramural Research Program of the National Institute on Drug Abuse, NIH. The research described in this manuscript was performed using EMSL, a national scientific user facility sponsored by the DOE’s Office of Biological and Environmental Research and located at Pacific Northwest National Laboratory (PNNL). PNNL is operated by Battelle for the U. S. Department of Energy under contract DE-AC05-76RL01830.
Footnotes
Electronic supplementary information (ESI) available: Complete ref. 49; the canonical structure, [DGD + H]+[A3pSA3-NH2], of the DGD-A3pSA3-NH2 complex. See DOI: 10.1039/c1cp00029b
References
- 1.Holman KT, Pivovar AM, Swift JA and Ward MD, Acc. Chem. Res, 2001, 34, 107–118. [DOI] [PubMed] [Google Scholar]
- 2.Schmidtchen FP and Berger M, Chem. Rev, 1997, 97, 1609–1646. [DOI] [PubMed] [Google Scholar]
- 3.Jackson SN, Moyer SC and Woods AS, J. Am. Soc. Mass Spectrom, 2008, 19, 1535–1541. [DOI] [PMC free article] [PubMed] [Google Scholar]
- 4.Riordan JF, McElvany KD and Borders CL, Science, 1977, 195, 884–886. [DOI] [PubMed] [Google Scholar]
- 5.Tao J and Frankel AD, Proc. Natl. Acad. Sci. U. S. A, 1992, 89, 2723–2726. [DOI] [PMC free article] [PubMed] [Google Scholar]
- 6.Schug KA and Lindner W, Chem. Rev, 2005, 105, 67–113. [DOI] [PubMed] [Google Scholar]
- 7.Woods AS, J. Proteome Res, 2004, 3, 478–484. [DOI] [PubMed] [Google Scholar]
- 8.Woods AS, Moyer SC, Wang HYJ and Wise RA, J. Proteome Res, 2003, 2, 207–212. [DOI] [PubMed] [Google Scholar]
- 9.Woods AS, Kaminski R, Oz M, Wang Y, Hauser K, Goody R, Wang HYJ, Jackson SN, Zeitz P, Zeitz KP, Zolkowska D, Schepers R, Nold M, Danielson J, Graslund A, Vukojevic V, Bakalkin G, Basbaum A and Shippenberg T, J. Proteome Res, 2006, 5, 1017–1023. [DOI] [PMC free article] [PubMed] [Google Scholar]
- 10.Wang Q, Mynar JL, Yoshida M, Lee E, Lee M, Okuro K, Kinbara K and Aida T, Nature, 2010, 463, 339–343. [DOI] [PubMed] [Google Scholar]
- 11.Okuro K, Kinbara K, Tsumoto K, Ishii N and Aida T, J. Am. Chem. Soc, 2009, 131, 1626–1627. [DOI] [PubMed] [Google Scholar]
- 12.Jiang YX, Ruta V, Chen JY, Lee A and MacKinnon R, Nature, 2003, 423, 42–48. [DOI] [PubMed] [Google Scholar]
- 13.Xu YP, Ramu Y and Lu Z, Nature, 2008, 451, 826–U828. [DOI] [PMC free article] [PubMed] [Google Scholar]
- 14.Calnan BJ, Tidor B, Biancalana S, Hudson D and Frankel AD, Science, 1991, 252, 1167–1171. [DOI] [PubMed] [Google Scholar]
- 15.Woods AS, Moyer SC and Jackson SN, J. Proteome Res, 2008, 7, 3423–3427. [DOI] [PMC free article] [PubMed] [Google Scholar]
- 16.Woods AS and Ferre S, J. Proteome Res, 2005, 4, 1397–1402. [DOI] [PMC free article] [PubMed] [Google Scholar]
- 17.Ciruela F, Burgueno J, Casado V, Canals M, Marcellino D, Goldberg SR, Bader M, Fuxe K, Agnati LF, Lluis C, Franco R, Ferre S and Woods AS, Anal. Chem, 2004, 76, 5354–5363. [DOI] [PubMed] [Google Scholar]
- 18.Jackson SN, Wang HYJ, Yergey A and Woods AS, J. Proteome Res, 2006, 5, 122–126. [DOI] [PMC free article] [PubMed] [Google Scholar]
- 19.Fuxe K, Marcellino D, Leo G and Agnati LF, Curr. Opin. Pharmacol, 2010, 10, 14–22. [DOI] [PubMed] [Google Scholar]
- 20.Boersema PJ, Mohammed S and Heck AJR, J. Mass Spectrom, 2009, 44, 861–878. [DOI] [PubMed] [Google Scholar]
- 21.Wang TF, Andreazza HJ, Bilusich D and Bowie JH, Rapid Commun. Mass Spectrom, 2009, 23, 1669–1677. [DOI] [PubMed] [Google Scholar]
- 22.Palumbo AM and Reid GE, Anal. Chem, 2008, 80, 9735–9747. [DOI] [PubMed] [Google Scholar]
- 23.Edelson-Averbukh M, Shevchenko A, Pipkorn R. d and Lehmann WD, Anal. Chem, 2009, 81, 4369–4381. [DOI] [PubMed] [Google Scholar]
- 24.James PF, Perugini MA and O’Hair RAJ, J. Am. Soc. Mass Spectrom, 2006, 17, 384–394. [DOI] [PubMed] [Google Scholar]
- 25.Alves S, Woods A and Tabet JC, J. Mass Spectrom, 2007, 42, 1613–1622. [DOI] [PubMed] [Google Scholar]
- 26.Yin S, Xie Y and Loo JA, J. Am. Soc. Mass Spectrom, 2008, 19, 1199–1208. [DOI] [PMC free article] [PubMed] [Google Scholar]
- 27.Laskin J and Futrell JH, Mass Spectrom. Rev, 2003, 22, 158–181. [DOI] [PubMed] [Google Scholar]
- 28.Laskin J and Futrell JH, J. Am. Soc. Mass Spectrom, 2003, 14, 1340–1347. [DOI] [PubMed] [Google Scholar]
- 29.Laskin J, Denisov E and Futrell J, J. Am. Chem. Soc, 2000, 122, 9703–9714. [Google Scholar]
- 30.Laskin J, Bailey TH and Futrell JH, Int. J. Mass Spectrom, 2004, 234, 89–99. [Google Scholar]
- 31.Laskin J, J. Phys. Chem. A, 2006, 110, 8554–8562. [DOI] [PubMed] [Google Scholar]
- 32.Laskin J, Futrell JH and Chu IK, J. Am. Chem. Soc, 2007, 129, 9598–9599. [DOI] [PubMed] [Google Scholar]
- 33.Laskin J, Yang Z and Chu IK, J. Am. Chem. Soc, 2008, 130, 3218–3230. [DOI] [PubMed] [Google Scholar]
- 34.Yang ZB, Vorpagel ER and Laskin J, J. Am. Chem. Soc, 2008, 130, 13013–13022. [DOI] [PubMed] [Google Scholar]
- 35.Yang ZB, Vorpagel ER and Laskin J, Chem.–Eur. J, 2009, 15, 2081–2090. [DOI] [PubMed] [Google Scholar]
- 36.Laskin J, Denisov EV, Shukla AK, Barlow SE and Futrell JH, Anal. Chem, 2002, 74, 3255–3261. [DOI] [PubMed] [Google Scholar]
- 37.Shaffer SA, Tang KQ, Anderson GA, Prior DC, Udseth HR and Smith RD, Rapid Commun. Mass Spectrom, 1997, 11, 1813–1817. [Google Scholar]
- 38.Mize TH, Taban I, Duursma M, Seynen M, Konijnenburg M, Vijftigschild A, Doornik CV, Rooij GV and Heeren RMA, Int. J. Mass Spectrom, 2004, 235, 243–253. [Google Scholar]
- 39.Taban LM, van der Burgt YEM, Duursma M, Takats Z, Seynen M, Konijnenburg M, Vijftigschild A, Attema I and Heeren RMA, Rapid Commun. Mass Spectrom, 2008, 22, 1245–1256. [DOI] [PubMed] [Google Scholar]
- 40.Dongre AR, Somogyi A and Wysocki VH, J. Mass Spectrom, 1996, 31, 339–350. [DOI] [PubMed] [Google Scholar]
- 41.Laskin J and Futrell JH, J. Chem. Phys, 2003, 119, 3413–3420. [Google Scholar]
- 42.Grill V, Shen J, Evans C and Cooks RG, Rev. Sci. Instrum, 2001, 72, 3149–3179. [Google Scholar]
- 43.Laskin J, Wang P and Hadjar O, Phys. Chem. Chem. Phys, 2008, 10, 1079–1090. [DOI] [PubMed] [Google Scholar]
- 44.Laskin J, Byrd M and Futrell J, Int. J. Mass Spectrom, 2000, 195–196, 285–302. [Google Scholar]
- 45.Kenneth MJP, Holbrook A and Robertson Struan. H., Unimolecular Reactions, John Wiley & Sons, New York, 2nd edn, 1996. [Google Scholar]
- 46.Laskin J and Futrell J, J. Phys. Chem. A, 2000, 104, 5484–5494. [Google Scholar]
- 47.Schmidt AB and Fine RM, Mol. Simul, 1994, 13, 347–365. [Google Scholar]
- 48.Fletcher R, FORTRAN Subroutines for Minimization by Quasi-Newton Methods, U.K. Atom Energy Authority Research Group, NAERE R7125, 1972, p. 29. [Google Scholar]
- 49.Bylaska EJ, et al. , NWChem, A Computational Chemistry Package for Parallel Computers, Version 5.1, Pacific Northwest National Laboratory, Richland, WA, 2007. [Google Scholar]
- 50.Gross DS and Williams ER, Int. J. Mass Spectrom. Ion Processes, 1996, 157–158, 305–318. [DOI] [PMC free article] [PubMed] [Google Scholar]
- 51.Gronert S and Azebu J, Org. Lett, 1999, 1, 503–506. [Google Scholar]
- 52.Hodyss R, Cox HA and Beauchamp JL, J. Phys. Chem. A, 2004, 108, 10030–10034. [Google Scholar]
- 53.Cox HA, Hodyss R and Beauchamp JL, J. Am. Chem. Soc, 2005, 127, 4084–4090. [DOI] [PubMed] [Google Scholar]
- 54.Lifshitz C, Eur. J. Mass Spectrom, 2002, 8, 85–98. [Google Scholar]
- 55.Andreazza HJ, Fitzgerald M, Bilusich D, Hoffmann R, Hoffmann P, Elchinger PCH and Bowie JH, Rapid Commun. Mass Spectrom, 2008, 22, 3305–3312. [DOI] [PubMed] [Google Scholar]
- 56.Felitsyn N, Kitova EN and Klassen JS, Anal. Chem, 2001, 73, 4647–4661. [DOI] [PubMed] [Google Scholar]
- 57.Laskin J and Futrell JH, J. Phys. Chem. A, 2003, 107, 5836–5839. [Google Scholar]
Associated Data
This section collects any data citations, data availability statements, or supplementary materials included in this article.


