Abstract
Background
Few studies investigate the influence of body part injured and industry on future workers’ compensation claims.
Methods
Using claims incurred January 1, 2005 – July 31, 2015 (n=77,494) from the largest workers’ compensation insurer in Colorado, we assessed associations between worker characteristics, second claims involving any body part and the same body part. We utilized Cox proportional hazards models to approximate probability of a second claim.
Results
First claims represented 74.9% (n=58,007) and second claims 25.2% (n=19,487) of total claims. Gender, age, industry, and body part of first claim were associated with probability of second claims and body part affected. The five-year probabilities of second claims and same body part second claims were 27.0% (95% CI: 26.6%–27.5%) and 6.2% (95% CI: 5.9%–6.5%) in males and 26.5% (95% CI: 26.0%–27.0%) and 6.7% (95% CI: 6.5%–7.0%) in females. Most second claims occurred within three years.
Conclusions
Most second claims occur within three years. Body part and industry-specific injury patterns suggest missed opportunities for prevention.
Keywords: Repeat claims, workers’ compensation, injury, industry, body part
INTRODUCTION
For many workers, their first injury at work will not be their last. Multiple studies estimate at least one-third of workers who experience an occupational injury will sustain a subsequent new injury after returning to work.[1–7] In the U.S., estimates of the economic burden of all workplace injuries and illnesses, including both direct medical expenses and indirect costs, exceed $250 billion per year.[8, 9] The contribution of repeat claims to this figure is unknown, but likely substantial. Compared to initial claims, repeat claims appear to result in significantly higher costs and longer periods of work disability.[6, 7, 10] The impact of injuries on workers and their families is also significant. Injured workers experience a range of psychosocial consequences, including anxiety, depression, and strained family relationships.[11–13] Additionally, lost earnings reduce household assets and perpetuate income inequality.[14, 15] Despite the substantial burden of repeat claims, both in terms of cost to the system and impact on individual workers, we do not fully understand the nature of repeat claims and why they occur. Therefore, repeat claims represent an important target for additional research, attention in clinical practice, and intervention in the workplace.
Several previous studies have described features of workers who experienced repeat claims. Cherry et al. characterized claims of workers using data from the Alberta Workers’ Compensation Board in Canada, and found that 49.2% of 490,230 workers experienced at least two claims from 1994–2004.[4] Reduced time to second claim was associated with male gender, younger age, and certain industry and accident types.[4] Using a similar methodological approach, Ruseckaite et al. characterized claims of 178,630 workers from Victoria, Australia, of which 36.9% experienced at least two claims from 1996–2009.[5] Reduced time to second claim was also associated with male gender, younger age, and employment in the manufacturing industry.[5] Gross and Battié analyzed workers’ compensation board data from Alberta, Canada to predict outcomes in patients with low back injuries enrolled in intensive rehabilitation programs.[16] The number of preadmission healthcare visits consistently predicted outcomes in low back injuries. However, gender, days between injury, physical job demands, performance on a physical test, and previous back-related claims were not consistent predictors of future injury.[16]
In our review of the repeat claims literature, we observed a number of research gaps, including an understanding of the relationship between the body part affected in a worker’s first injury and the body part affected in their second injury. The majority of research conducted on repeat claims focuses almost exclusively on low back injuries. Past analyses of low back injuries suggest significant rates of recurrence.[10, 12, 17] From a clinical perspective, it is useful for practitioners to understand the anatomical location, rate and timeframe in which new injuries occur. Ruseckaite and Collie explored body parts involved in 170,148 claims from Victoria, Australia from 1996–2000, and determined the same anatomical location was involved in 34.3% of repeat claims, while a different body part was involved in 65.7% of repeat claims.[6] Relying only on self-reports, Galizzi determined 7% of injuries occurred subsequently to the same body part (mainly eyes, backs, and hands), and 2% involved the same type of injury to the same body part, suggesting a sequence of relatively different injuries.[18] Both the apparent rates of re-injury and potential disparity in findings underscore the need for more detailed investigation.
The goal of this study was to improve our understanding of the natural history and risk factors for subsequent injuries. We hypothesized that injury to a given body part may influence both the occurrence of subsequent injuries overall and of future repeat injuries to the same body part, and that these effects may vary across industries. As a second objective, to understand the probability of repeat claims, we examined both the timeframe in which repeat claims occurred and the association between subsequent injury and workers’ gender, age, industry, and body part of initial claim.
METHODS
Sample
The largest workers’ compensation insurer in the state of Colorado, Pinnacol Assurance, provided a de-identified database of all workers’ compensation claims from 552 companies included in the Pinnacol Health Risk Management Study.[19] The database included claims filed during a 10½-year period (126 months), covering January 1, 2005 through July 31, 2015. Variables of interest included claimant age, gender, date of injury, standard industrial classification (SIC) codes, and body part of injury involved in a claim. The Colorado Multiple Institutional Review Board deemed this study non-human subjects research. Claimants included in the study had no missing data related to age, gender, date of initial injury, SIC codes, or body part of injury involved in a claim. Available detail with respect to body part of injury included only the primary diagnosis for the claim, and there was no information available regarding sidedness of an injury. Many claimants experienced multiple claims, but only the first two claims for an individual were used in this analysis. The dataset included both open and closed claims, and also denied claims. These denied claims were estimated to represent approximately 5% of the dataset. Pinnacol encourages reporting of all injuries regardless of severity and in cases where work relatedness is in doubt, so there are claims with no associated time loss or expense incurred. The original dataset included 114,569 claims, of which 77,494 met criteria for analysis.
Study Variables
Our outcomes of interest were second claims involving any body part and second claims involving the same body part. Our main predictors of interest were industry and body part involved in the first claim. We defined “industry group” using standard division level SIC grouping codes, and then condensed observations by code into one of 11 categories. Categories included Agriculture/Forestry/Fishing; Finance/Insurance/Real Estate; Manufacturing; Mining and Construction; Public Administration; Police; Retail Trade; Services; Transportation/Communications/Electric/Gas/Sanitary Services; Wholesale Trade; and Fire. Initially, Police and Fire were contained within the Public Administration category, but during analysis we observed higher rates of both first claims and second claims within these populations when compared to most other groups. As a result, we excluded Police and Fire from the Public Administration group and analyzed them as standalone categories.
We defined “body part” using anatomical location of injury, and then condensed observations by location of injury into one of 10 categories – head, neck, eye, lung, upper back, low back (lumbo-sacral, sacrum and coccyx), proximal upper extremity (elbow, shoulder, upper arm including clavicle and scapula), distal upper extremity (finger(s), hand, lower arm, thumb, wrist), proximal lower extremity (hip, knee, upper leg), and distal lower extremity (ankle, foot, lower leg). Ultimately, we focused our analysis on body parts with the highest frequencies due to sample size considerations. The most common injuries were low back (n = 10,059), proximal upper extremity (n = 7,022), distal upper extremity (n = 23,240), and proximal lower extremity (n = 8,579). We classified the remaining observations (n = 28,594) as “other.”
Data Analysis
Chi-squared tests were used to assess univariate associations between gender, age group, industry, and body part of injury and the two outcomes of interest – second claims involving any body part and second claims involving the same body part. In the analysis of gender, the variable had two categories – male and female. In the analysis of age, the variable had six categories – 18–24, 25–34, 35–44, 45–54, 55–64, and 65+. In the analysis of industry, the variable had 11 categories – Agriculture/Forestry/Fishing; Finance/Insurance/Real Estate; Manufacturing; Mining and Construction; Public Administration; Police; Retail Trade; Services; Transportation/Communications/Electric/Gas/Sanitary Services; Wholesale Trade; and Fire. In the analysis of body part, the variable had five categories – Low Back, Proximal Upper Extremity, Distal Upper Extremity, Proximal Lower Extremity, and Other. Each Chi-square test yielded an indicator of association between the variables described and the characteristic of second claims involving any body part or the same body part.
We developed Cox proportional hazards models, adjusted for age and gender, to estimate industry specific time-to-event (survival) curves for a second claim within five years for both second claims involving any body part and the same body part. The Cox proportional hazards model is analogous to a multiple regression model and is commonly used to analyze survival time data when it is necessary to assess the effect of multiple covariates. The model assumes the covariates to be time-independent. The survival function and hazard function are fundamental to survival analysis, and being closely related can easily be converted to one another.[20] The survival function describes the probability of surviving past a given point in time, or more generally, the probability that the event of interest has not yet occurred. Therefore, the probability of an event, or claim in this instance, is the complement of the probability of event-free survival. All analyses were performed using SAS version 9.4 (2012; SAS Institute Inc., Cary, NC).
RESULTS
Sample Description
Characteristics of the claims are presented in Table 1. There were 77,494 claims. Overall, claims in this study were equally distributed by gender. The claims predominately represented younger workers (under age 45). The most common industries were Services (55.8%; n = 43,261), Retail Trade (11.1%; n = 8,616), and Mining and Construction (9.6%; 7,419). First claims represented 74.9% (n = 58,007) while subsequent claims represented 25.2% (n = 19,487) of total claims. Most subsequent claims involved a new body part, with the same body part being affected in only 5.4% (n = 4,179) of the total claims. It is important to note that the first claim is not necessarily the first claim for the worker; it is just the first claim observed in this dataset. Additionally, the data do not distinguish whether a second claim involving the same body part included the same extremity or contralateral extremity as the first claim.
Table 1.
Characteristics of Total Worker Population: Gender, Age, Industry, Body Part Involved
| Characteristics at First Claim | Claims Overall [1] | % | First Claims [2] | % | Second Claims Any Body Part [3] | % | Second Claims Same Body Part [4] | % |
|---|---|---|---|---|---|---|---|---|
| Gender | ||||||||
| Male | 38,646 | 49.9% | 28,930 | 49.9% | 9,716 | 49.9% | 1,983 | 47.5% |
| Female | 38,848 | 50.1% | 29,077 | 50.1% | 9,771 | 50.1% | 2,196 | 52.5% |
| Total |
77,494 |
58,007 |
19,487 |
4,179 |
||||
| Age | ||||||||
| 18–24 | 11,962 | 15.4% | 10,073 | 17.4% | 1,889 | 9.7% | 496 | 11.9% |
| 25–34 | 20,058 | 25.9% | 15,306 | 26.4% | 4,752 | 24.4% | 1,124 | 26.9% |
| 35–44 | 16,782 | 21.7% | 12,413 | 21.4% | 4,369 | 22.4% | 943 | 22.6% |
| 45–54 | 16,318 | 21.1% | 11,637 | 20.1% | 4,681 | 24.0% | 880 | 21.1% |
| 55–64 | 10,438 | 13.5% | 7,193 | 12.4% | 3,245 | 16.7% | 637 | 15.2% |
| 65+ | 1,936 | 2.5% | 1,385 | 2.4% | 551 | 2.8% | 99 | 2.4% |
| Total |
77,494 |
58,007 |
19,487 |
4,179 |
||||
| Industry | ||||||||
| Police | 814 | 1.1% | 446 | 0.8% | 368 | 1.9% | 76 | 1.8% |
| Fire | 532 | 0.7% | 343 | 0.6% | 189 | 1.0% | 35 | 0.8% |
| Public Administration (Police and Fire excluded) | 4,119 | 5.3% | 2,753 | 4.7% | 1,366 | 7.0% | 229 | 5.5% |
| Agriculture, Forestry, and Fishing | 1,647 | 2.1% | 1,086 | 1.9% | 561 | 2.9% | 202 | 4.8% |
| Mining and Construction | 7,419 | 9.6% | 5,820 | 10.0% | 1,599 | 8.2% | 299 | 7.2% |
| Manufacturing | 4,295 | 5.5% | 3,145 | 5.4% | 1,150 | 5.9% | 285 | 6.8% |
| Transportation, Communications, Electric, Gas, and Sanitary Services | 2,427 | 3.1% | 1,690 | 2.9% | 737 | 3.8% | 140 | 3.4% |
| Wholesale Trade | 2,761 | 3.6% | 2,117 | 3.6% | 644 | 3.3% | 126 | 3.0% |
| Retail Trade | 8,616 | 11.1% | 7,231 | 12.5% | 1,385 | 7.1% | 320 | 7.7% |
| Finance, Insurance, and Real Estate | 1,603 | 2.1% | 1,271 | 2.2% | 332 | 1.7% | 74 | 1.8% |
| Services | 43,261 | 55.8% | 32,105 | 55.3% | 11,156 | 57.2% | 2,393 | 57.3% |
| Total |
77,494 |
58,007 |
19,487 |
4,179 |
||||
| Body Part | ||||||||
| Low Back | 10,059 | 13.0% | 7,645 | 13.2% | 2,616 | 13.4% | 605 | 14.5% |
| Proximal Upper Extremity* | 7,022 | 9.1% | 5,150 | 8.9% | 2,084 | 10.7% | 313 | 7.5% |
| Distal Upper Extremity** | 23,240 | 30.0% | 17,386 | 30.0% | 5,628 | 28.9% | 2,182 | 52.2% |
| Proximal Lower Extremity*** | 8,579 | 11.1% | 6,344 | 10.9% | 2,279 | 11.7% | 433 | 10.4% |
| Other | 28,594 | 36.9% | 21,482 | 37.0% | 6,880 | 35.3% | 646 | 15.5% |
| Total |
77,494 |
58,007 |
19,487 |
4,179 |
||||
|
Chi Square (p values) |
Gender |
Age |
Industry |
Body Part |
||||
| First Claims / Second Claims Any Body Part | 0.972 | <0.001 | <0.001 | <0.001 | ||||
| First Claims / Second Claims Same Body Part | 0.003 | <0.001 | <0.001 | <0.001 | ||||
The number of claims overall [column 1] includes the number of first claims [column 2] and second claims: any body part [column 3]. Second claims: same body part [column 4] is a subset of second claims: any body part [column 3].
Chi-square analysis tests the relationship between characteristics (gender, age, industry, body part) and claims (first claims [column 2] and second claims: any body part [column 3]; and first claims [column 2] and second claims: same body part [column 4]).
Proximal Upper Extremity: Elbow, Shoulder, Upper Arm, Scapula/Clavicle
Finger(s), Hand, Lower Arm, Thumb, Wrist
Hip, Knee, Upper Leg
Chi square tests were applied to gender, age, industry, and body part. With respect to gender, the distribution between males and females was not significantly different (p = 0.972), however women were more likely to experience a second claim for the same body part (females 52.5%; n = 2,196 v. males 47.5%; n = 1,983, p = 0.003).
Across age groups, there were significant associations between age categories and future claims activity (any: p < 0.001; same: p < 0.001). The youngest age category (18–24 y) represented 17.4% (n = 10,073) of first claims, but only 9.7% (n = 1,889) of second claims and 11.9% (n = 496) of same body part second claims. The representation of claims increased most in the 45–54 y and 55–64 y age groups. The distribution of claims in the 45–54 y age group rose from 20.1% (n = 11,637) of first claims to 24.0% (n = 4,681) of second claims and 21.1% (n = 880) of same body part second claims. The distribution of claims in the 55–64 y age group rose from 12.4% (n = 7,193) of first claims to 16.7% (n = 3,245) of second claims and 15.2% (n = 637) of same body part second claims.
Industry categories also demonstrated significant associations with future claims (any: p < 0.001; same: p < 0.001). Police, Fire, and Agriculture had the most significant relative increases between first claims (0.8% [n = 446], 0.6% [n = 343], and 1.9% [n = 1,086]) and second claims (any: 1.9% [n = 368], 1.0% [n = 189], and 2.9% [n = 561]; same: 1.8% [n = 76], 0.8% [n = 35], and 4.8% [n = 202]). Retail, Finance/Insurance/Real Estate, and Mining and Construction had the most significant relative decreases between first claims (12.5% [n = 7,231], 2.2% [n = 1,271], and 10.0% [n = 5,820]) and second claims (any: 7.1% [n = 1,385], 1.7% [n = 332], and 8.2% [n = 1,599]; same: 7.7% [n = 320], 1.8% [n = 74], and 7.2% [n = 299]).
Regarding body part, there were significant associations between first body part injured and the second injury, involving both any body part (p < 0.001) and same body part (p < 0.001). As shown in Table 1, the distal upper extremity was the most commonly affected body part among the four designated categories (30.0%; n = 23,240). Distal upper extremity also was the most common of first claims (30.0%; n = 17,386), second claims (28.9%; n = 5,628), and same body part second claims (52.2%; n = 2,182). Low back claims were second most common overall (13.0%; n = 10,059). Low back claims comprised 13.2% (n = 7,645) of first claims, 13.4% (n = 2,616) of second claims, and 14.5% (n = 605) of same body part second claims.
Within second claims, patterns of injury emerged with respect to body part and industry (Table 2). Except for Fire, distal upper extremity was the most common second claim and same body part second claim. Distal upper extremity claims represented over 22% of all second claims and over 35% of all same body part second claims in every industry except Fire (13.2%; n = 25 and 17.1%; n = 6). The proportion of distal upper extremity claims was most significant in Agriculture/Forestry/Fishing, where these injuries comprised 49.9% (n = 280) of second claims, and 84.7% (n = 171) of same body part second claims.
Table 2.
Distribution of Second Claims by Industry and Body Part Injured
| Distribution of Second Claims, Any Body Part | Low Back | Proximal Upper Extremity | Distal Upper Extremity | Proximal Lower Extremity | Other | Total | |||||
| Industry | N | % | N | % | N | % | N | % | N | % | N |
| Police | 53 | 14.4% | 50 | 13.6% | 86 | 23.4% | 53 | 14.4% | 126 | 34.2% | 368 |
| Fire | 35 | 18.5% | 12 | 6.3% | 25 | 13.2% | 23 | 12.2% | 94 | 49.7% | 189 |
| Agriculture, Forestry, and Fishing | 41 | 7.3% | 40 | 7.1% | 280 | 49.9% | 42 | 7.5% | 158 | 28.2% | 561 |
| Public Administration (Police and Fire excluded) | 155 | 11.3% | 148 | 10.8% | 335 | 24.5% | 201 | 14.7% | 527 | 38.6% | 1,366 |
| Transportation, Communications, Electric, Gas, and Sanitary Services | 102 | 13.8% | 83 | 11.3% | 164 | 22.3% | 91 | 12.3% | 297 | 40.3% | 737 |
| Finance, Insurance, and Real Estate | 47 | 14.2% | 40 | 12.0% | 107 | 32.2% | 33 | 9.9% | 105 | 31.6% | 332 |
| Manufacturing | 151 | 13.1% | 131 | 11.4% | 389 | 33.8% | 93 | 8.1% | 386 | 33.6% | 1,150 |
| Services | 1,477 | 13.2% | 1,197 | 10.7% | 3,191 | 28.6% | 1,389 | 12.5% | 3,901 | 35.0% | 11,156 |
| Wholesale Trade | 115 | 17.9% | 67 | 10.4% | 181 | 28.1% | 71 | 11.0% | 210 | 32.6% | 644 |
| Mining and Construction | 230 | 14.4% | 164 | 10.3% | 446 | 27.9% | 144 | 9.0% | 615 | 38.5% | 1,599 |
| Retail Trade | 210 | 15.2% | 152 | 11.0% | 424 | 30.6% | 139 | 10.0% | 459 | 33.1% | 1,385 |
| Total |
2,616 |
2,084 |
5,628 |
2,279 |
6,878 |
19,487 |
|||||
| Distribution of Second Claims, Same Body Part | Low Back | Proximal Upper Extremity | Distal Upper Extremity | Proximal Lower Extremity | Other | Total | |||||
| Industry | N | % | N | % | N | % | N | % | N | % | N |
| Police | 11 | 14.5% | 10 | 13.2% | 33 | 43.4% | 10 | 13.2% | 12 | 15.8% | 76 |
| Fire | 6 | 17.1% | 1 | 2.9% | 6 | 17.1% | 4 | 11.4% | 18 | 51.4% | 35 |
| Agriculture, Forestry, and Fishing | 6 | 3.0% | 4 | 2.0% | 171 | 84.7% | 5 | 2.5% | 16 | 7.9% | 202 |
| Public Administration (Police and Fire excluded) | 36 | 15.7% | 18 | 7.9% | 96 | 41.9% | 32 | 14.0% | 47 | 20.5% | 229 |
| Transportation, Communications, Electric, Gas, and Sanitary Services | 23 | 16.4% | 20 | 14.3% | 50 | 35.7% | 19 | 13.6% | 28 | 20.0% | 140 |
| Finance, Insurance, and Real Estate | 11 | 14.9% | 7 | 9.5% | 44 | 59.5% | 5 | 6.8% | 7 | 9.5% | 74 |
| Manufacturing | 33 | 11.6% | 22 | 7.7% | 161 | 56.5% | 13 | 4.6% | 56 | 19.6% | 285 |
| Services | 349 | 14.6% | 179 | 7.5% | 1,243 | 51.9% | 285 | 11.9% | 337 | 14.1% | 2,393 |
| Wholesale Trade | 30 | 23.8% | 10 | 7.9% | 60 | 47.6% | 9 | 7.1% | 17 | 13.5% | 126 |
| Mining and Construction | 50 | 16.7% | 21 | 7.0% | 141 | 47.2% | 23 | 7.7% | 64 | 21.4% | 299 |
| Retail Trade | 50 | 15.6% | 21 | 6.6% | 177 | 55.3% | 28 | 8.8% | 44 | 13.8% | 320 |
| Total |
605 |
313 |
2,182 |
433 |
646 |
4,179 |
|||||
Time-to-Event Analysis
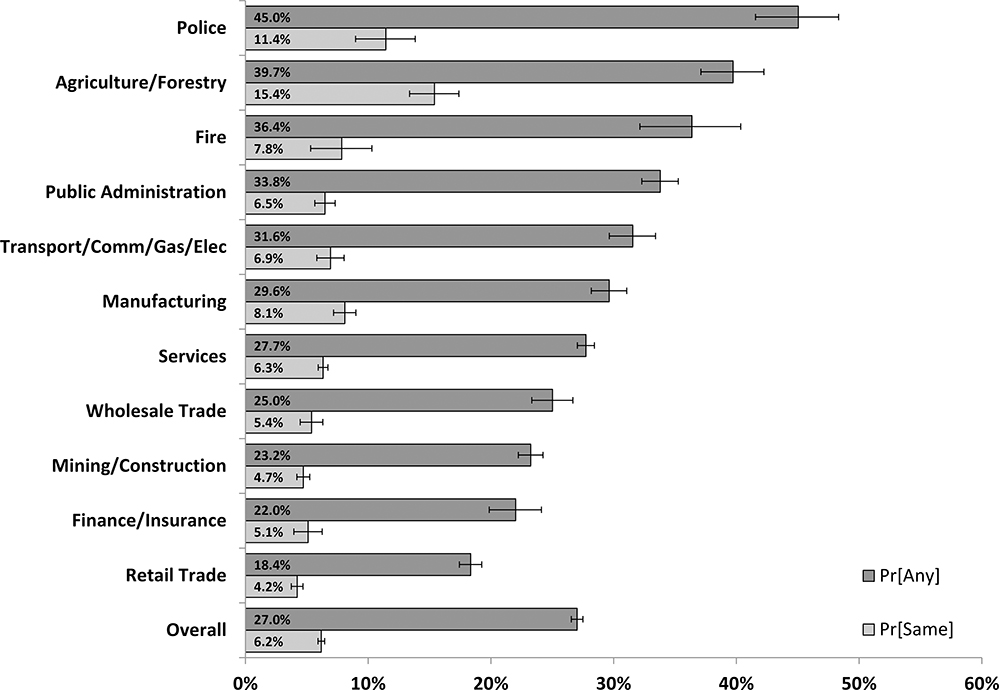
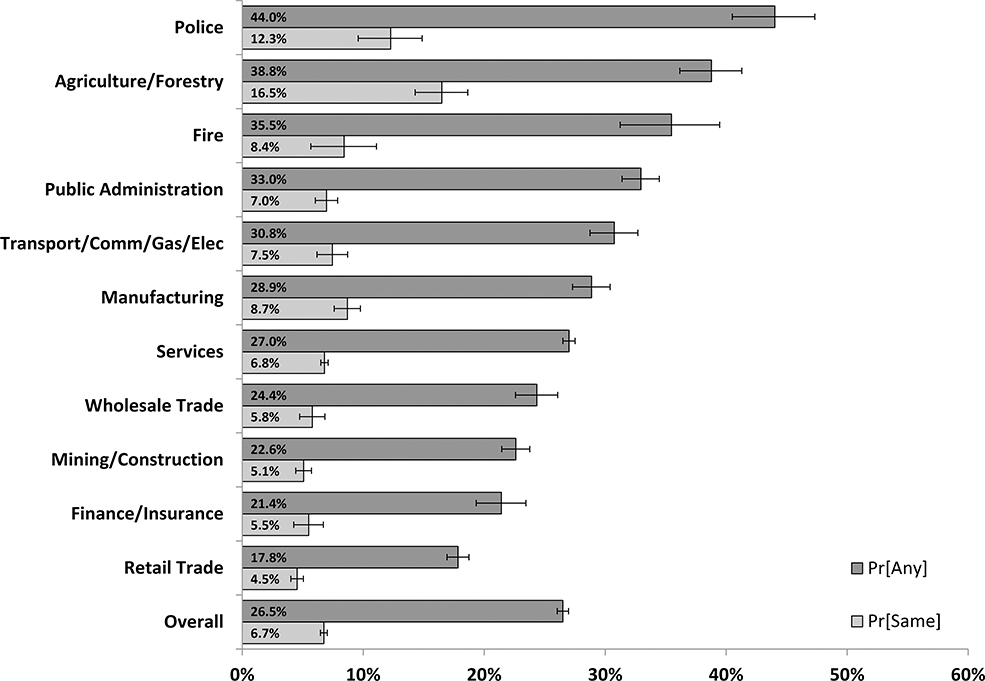
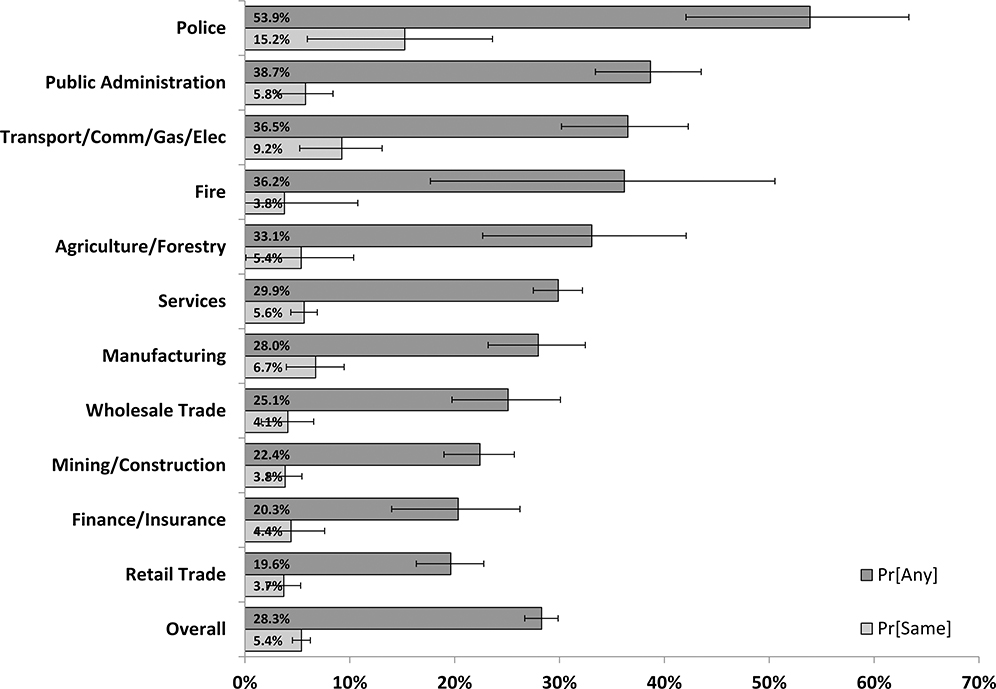
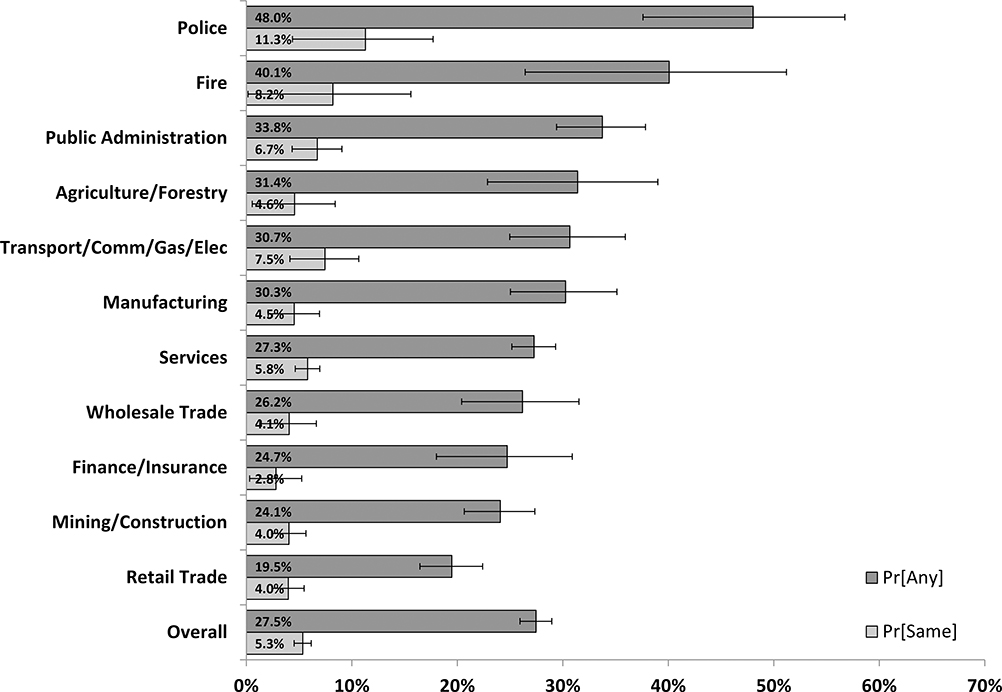
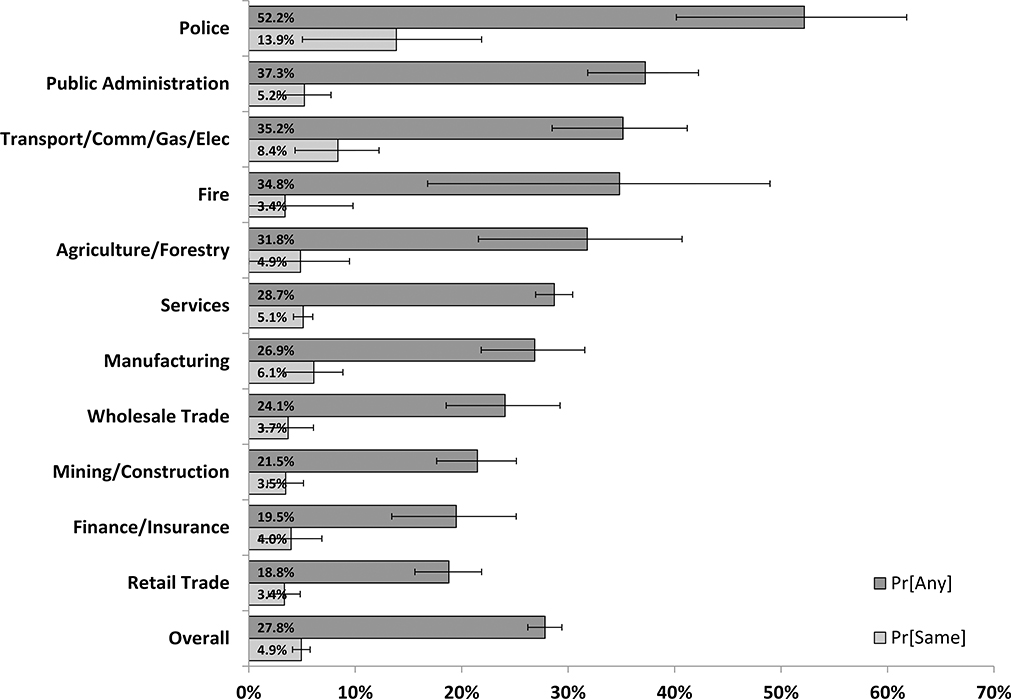
As shown in Figure 1, the overall five-year probability of second claims was 27.0% (26.6%–27.5%) in males and 26.5% (26.0%–27.0%) in females, while the five-year probability of same body part second claims was 6.2% (5.9%–6.5%) in males and 6.7% (6.5%–7.0%) in females. Supplemental Table 1 specifies 95% confidence intervals by industry and provides a comparison of survival probabilities derived by the Kaplan-Meier method and Cox proportional hazards models. The models in this analysis violated the proportionality assumption, which is considered central to the Cox model. The importance of proportionality is debated, however, because the hazard ratio can still be viewed as an average effect when the assumption is not met.[21] Additionally, the objective was to obtain adjusted survival probabilities rather than between group comparisons, and the Kaplan-Meier method and Cox proportional hazards models yielded similar results. We therefore favored use of Cox proportional hazards models despite violation of the proportionality assumption.
FIGURE 1A:
FIVE-YEAR PROBABILITY SECOND CLAIM, MALE
The five-year probability of second claims was highest for Police (45.0% [41.6%–48.3%]; 44.0% [40.5%–47.3%]) and lowest for Retail Trade (18.4% [17.4%–19.3%]; 17.8% [16.9%–18.7%]). Multiple other industries had five-year risks of second claims in excess of 30%. The five-year probability of same body part second claims was highest for Agriculture/Forestry/Fishing (15.4% [13.4%–17.4%]; 16.5% [14.3%–18.6%]), and lowest for Retail Trade (4.2% [3.7%–4.7%]; 4.5% [4.0%–5.1%]). Police and Fire also had high five-year probabilities of same body part second claims (11.4% [9.0%–13.8%]; 12.3% [9.6%–14.9%]), (7.8% [5.3%–10.3%]; 8.4% [5.7%–11.1%]).
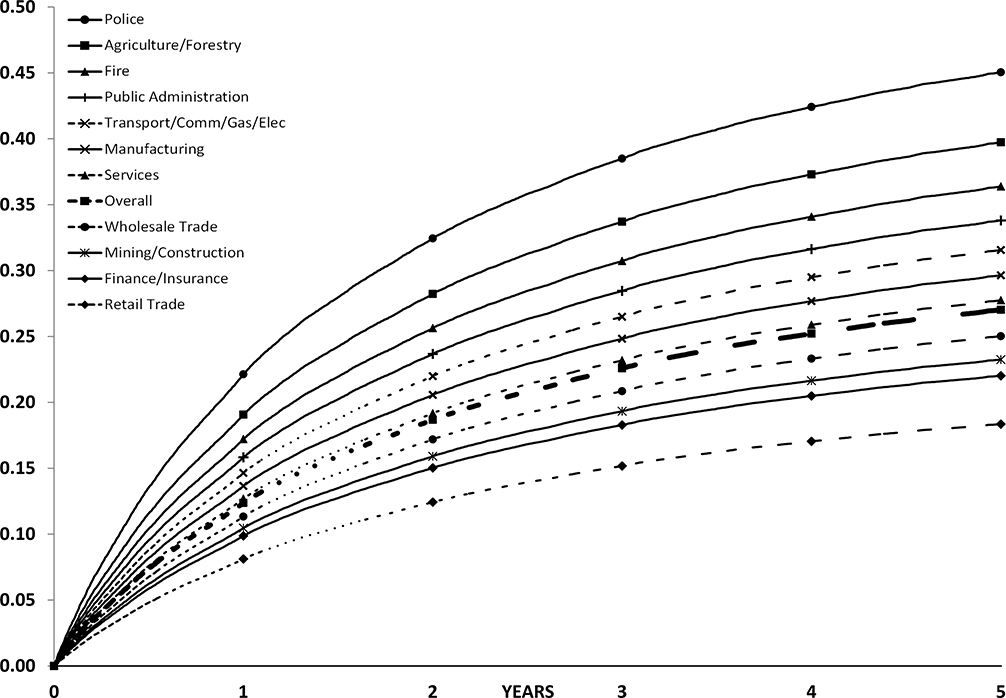
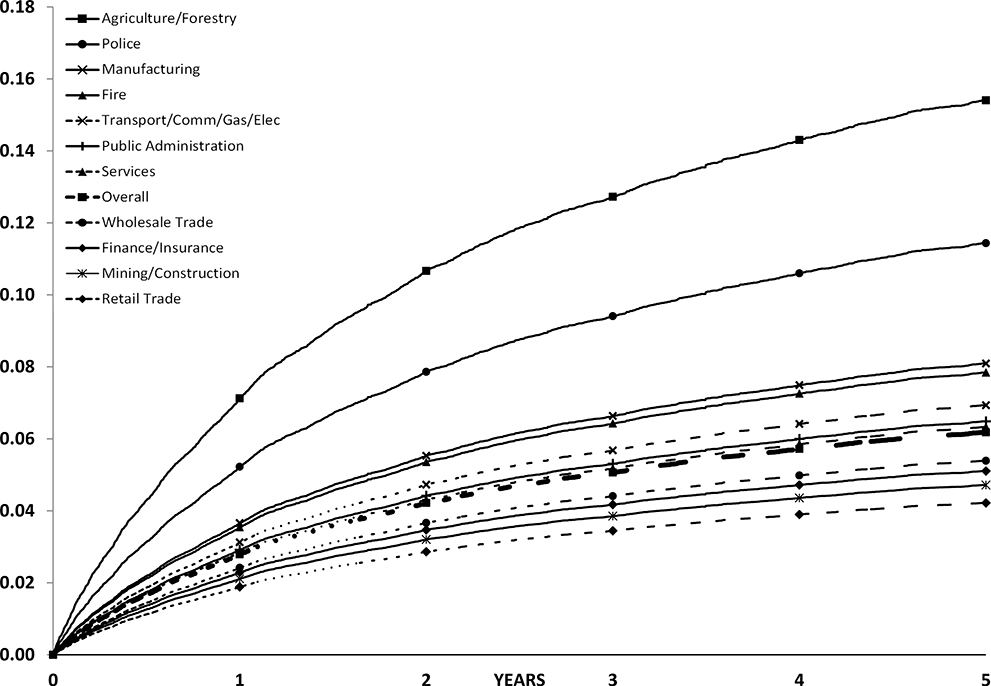
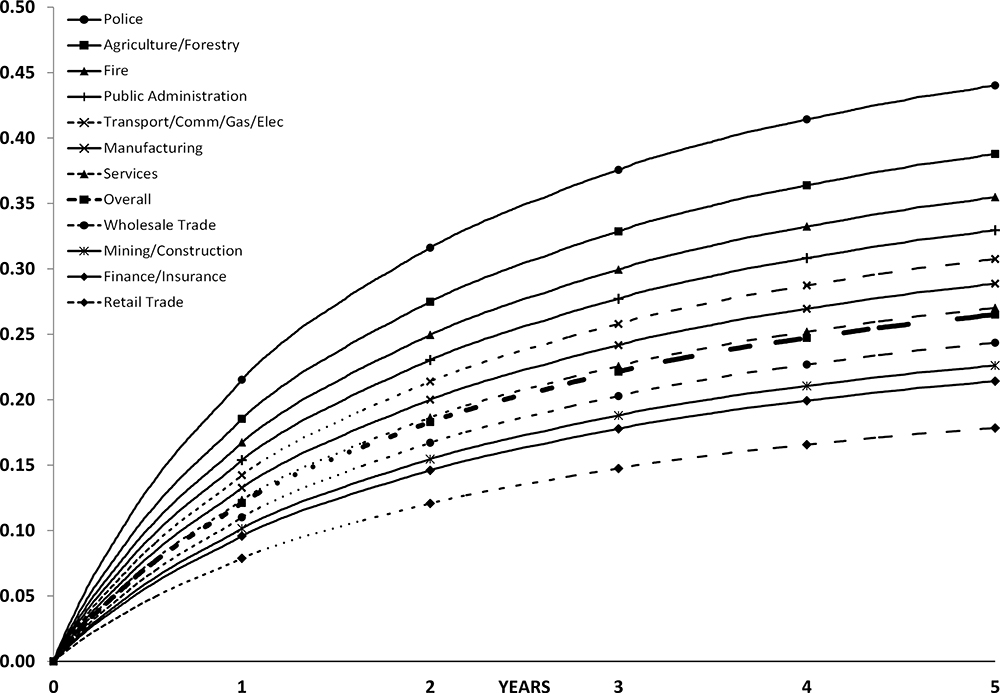
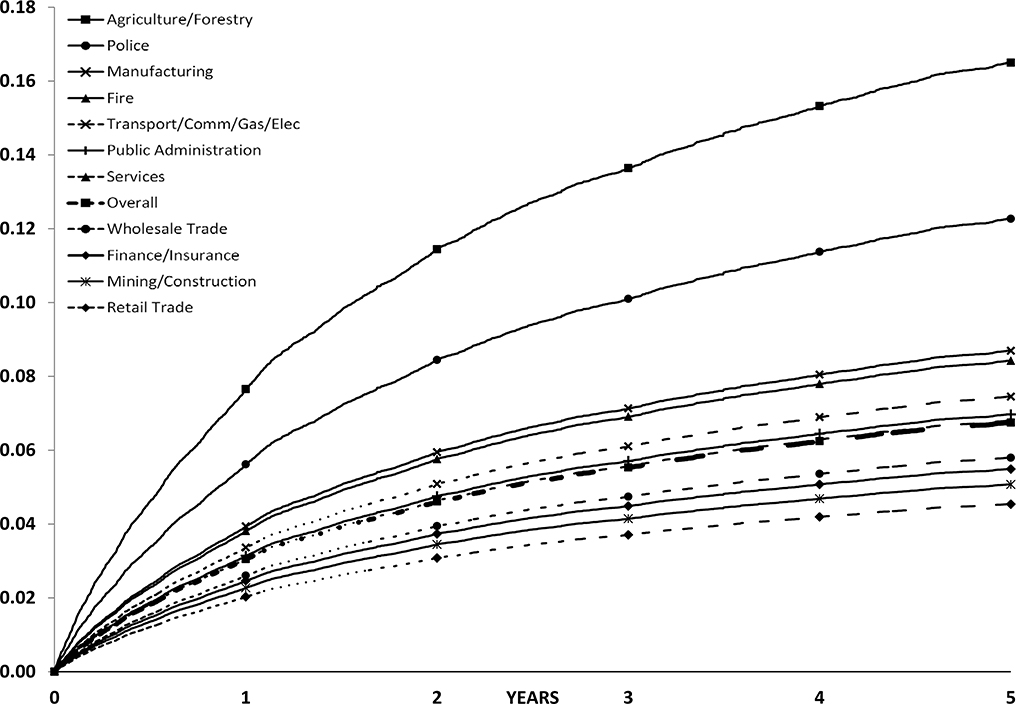
Figure 2 presents time-to-event injury probabilities up to five years. The slopes of the event lines rise most rapidly within the first two years, before becoming nearly asymptotic to the eventual five-year probabilities of a second claim by the third year. For any body part claims, Police experienced the highest overall probability of second claim regardless of gender, followed by Agriculture/Forestry/Fishing and Fire. For same body part claims, Agriculture/Forestry/Fishing experienced the highest overall probability of second claims regardless of gender.
FIGURE 2A:
FIVE-YEAR PROBABILITY OF SECOND CLAIM ANY BODY PART BY INDUSTRY, MALE
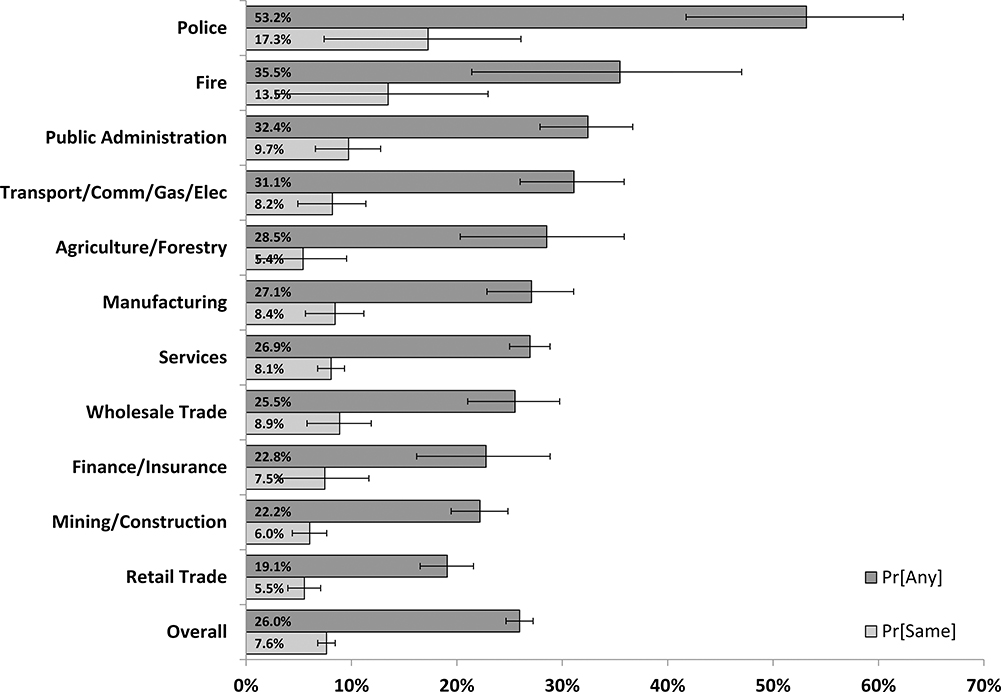
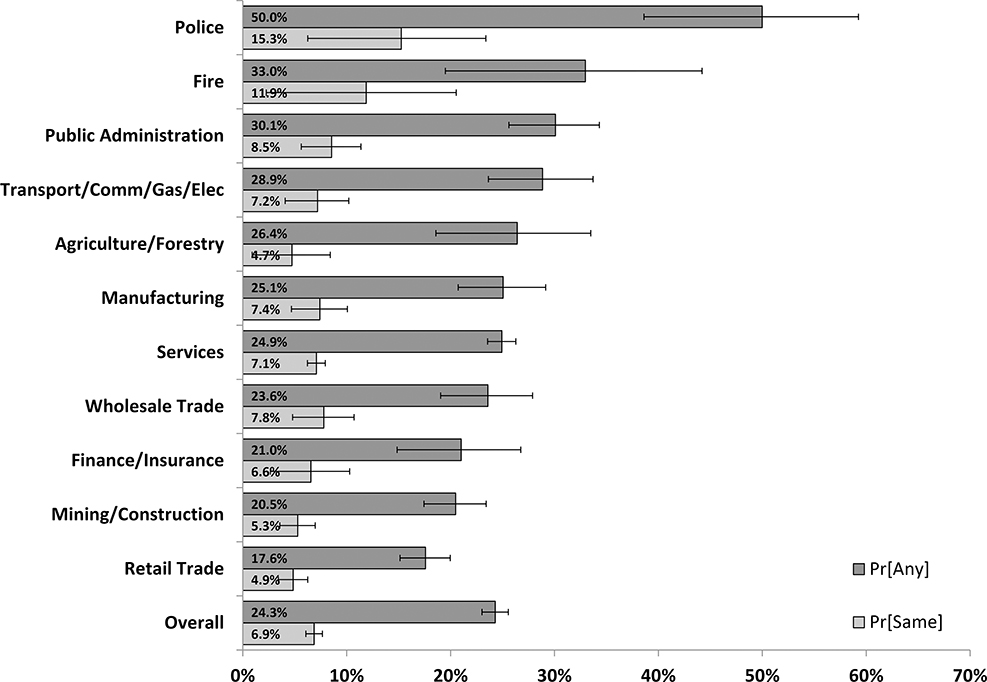
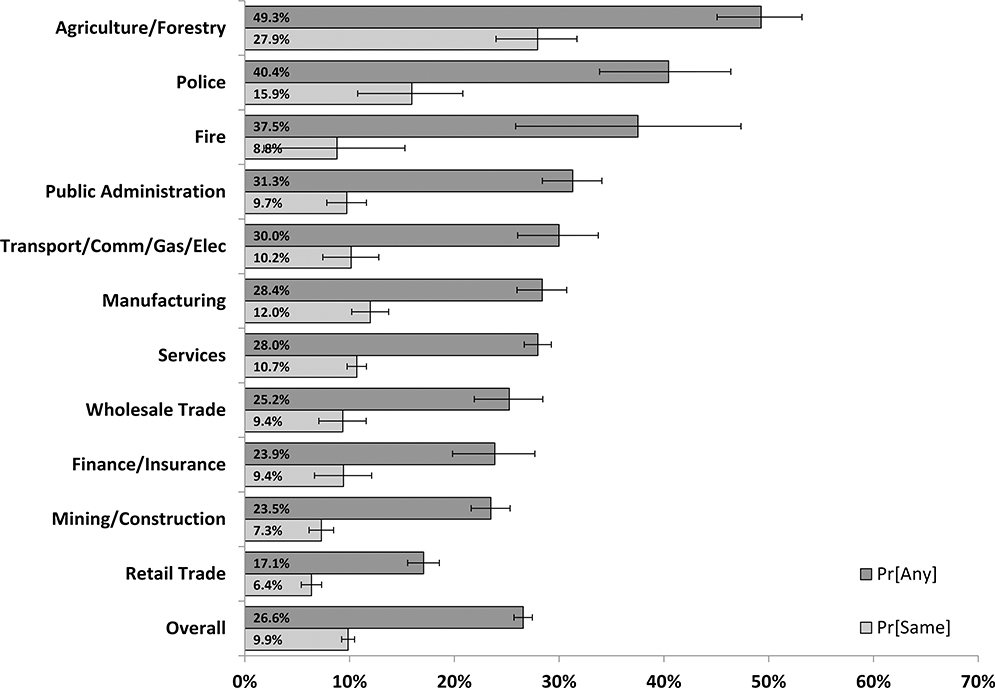
Five-year probabilities of second claims also varied by industry and body part of interest – low back, proximal upper extremity, distal upper extremity, and proximal lower extremity (Figure 3 and Figure 4). Specific values for 95% confidence intervals by industry are provided in Supplemental Table 2, and the anatomical composition of the categories of body parts analyzed is provided in Supplemental Table 3. Overall, when industry is not considered, the probability of a second claim was similar for each category of body part, ranging from 26.0%–28.3% in males to 24.3–27.9% in females. The probability of repeat claims involving the same body part ranged from 5.4%–9.9% in males to 4.9%–11.9% in females.
FIGURE 3A:
BACK - FIVE-YEAR PROBABILITY SECOND CLAIM, MALE
FIGURE 4A:
BACK - FIVE-YEAR PROBABILITY SECOND CLAIM, FEMALE
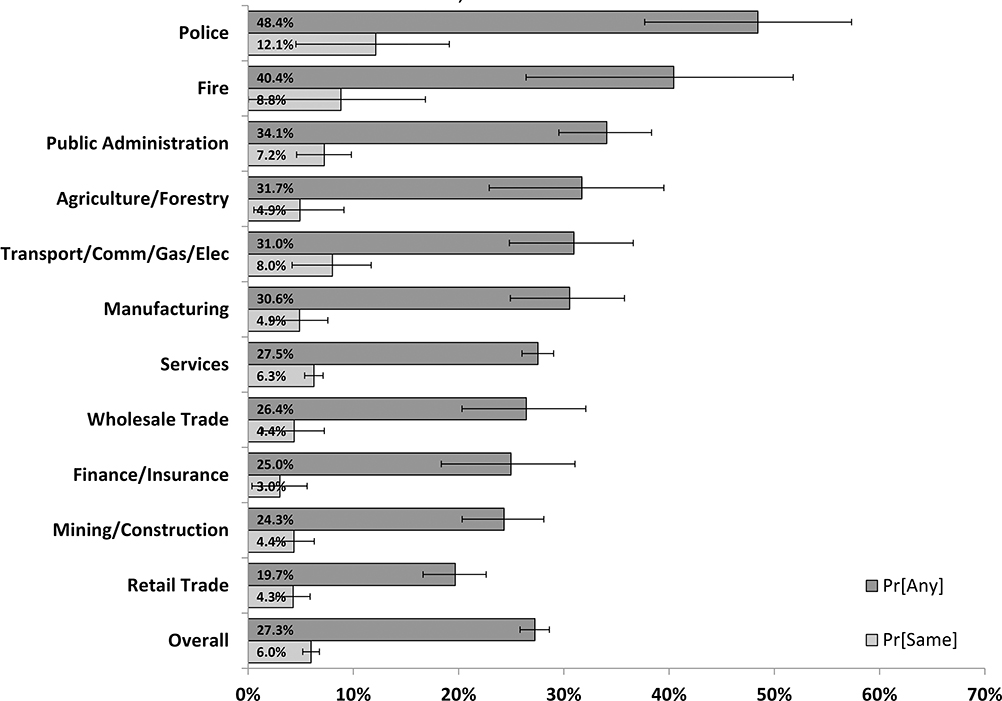
Patterns of injury emerged for certain body parts within specific industries. For example, Police stood apart with exceedingly high probabilities of repeat claims. This group had the highest five-year probabilities of second claims and same body part second claims for both males and females with respect to injuries involving the low back, proximal upper extremity, and proximal lower extremity. The same is true for Fire, which experienced the second highest five-year probabilities of both overall and same body part second claims for low back and proximal lower extremity claims in males and females. By comparison, Retail Trade generally had low probabilities of repeat claims regardless of body part or gender.
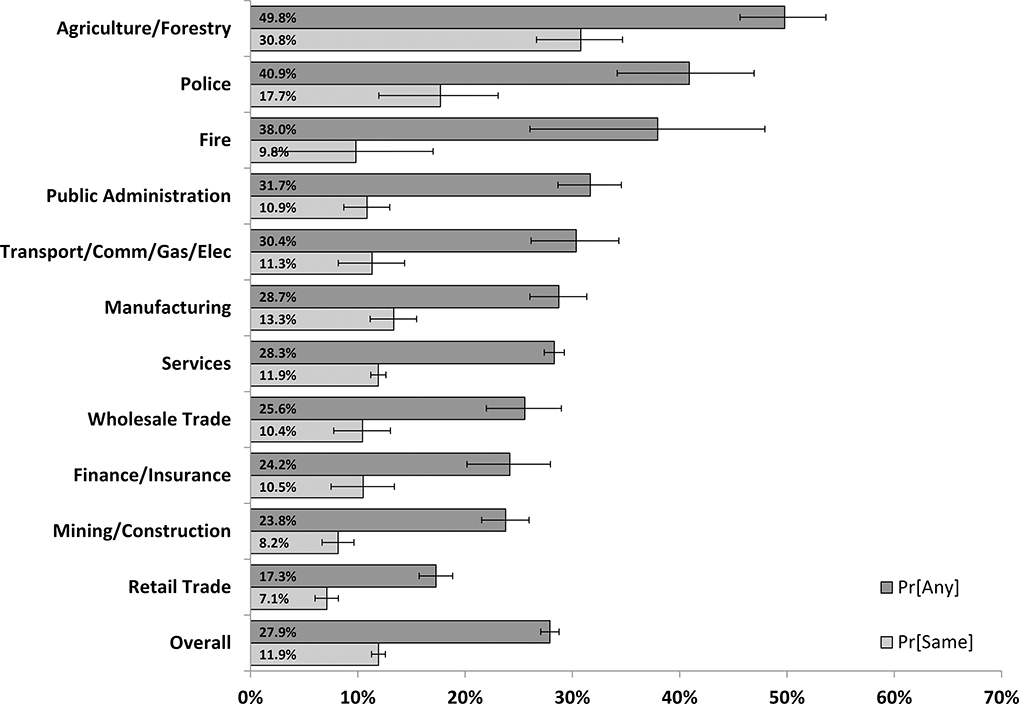
Mining and Construction, both considered high-hazard environments, experienced some of the lowest rates of repeat claims when comparing across industries (Figure 3 and Figure 4). These unexpectedly low rates may be due to the fact that inclusion in this dataset is tied to employment, and employees in these industries often move between employers. Agriculture/Forestry/Fishing is remarkable as the only industry with a higher five-year probability of second claims than Police in any category of body part. Following a first distal upper extremity claim, the Agriculture/Forestry/Fishing industry five-year probability of a second claim was 49.3% (45.1%–53.2%) in males and 49.8% (45.6%–53.6%) in females, while the probability of same body part second claim was 27.9% (24.0%–31.7%) in males and 30.8% (26.7%–34.7%) in females. This was the highest probability of same body part second claims regardless of body part and statistically distinguishable from all other industries, suggesting a pattern of relatively similar injuries in this group.
DISCUSSION
This study yielded several important findings related to body part of injury and industry involved in repeat workers’ compensation claims. Foremost, it supports the idea that body part of initial injury influences the anatomical site of subsequent injuries. Previous studies of the relationship between repeat claims and body part injured focused on recurrence of low back injuries,[10, 12, 17, 22] and did not explore the impact on other body parts in detail. It is clinically plausible that body part is an important predictor of future claims. Injury to one part of the anatomy, e.g. back injury, may predispose to injury of other body parts, or weaken tissues making them more prone to repeat injury in the future. We observed significant associations between body parts involved in first and second claims.
Second, this study demonstrated that second claims happen quickly, most often within the initial three years following the first claim. This finding was industry agnostic, and occurred for both any body part and same body part second claims. Ruseckaite et al. report means of 1,104 days (± 1,063)[5] and 1,088 days (± 1,057)[6] between first and second claims, while Cherry et al. report a mean of 744 days (± 687).[4] Our data generally confirm their findings. The speed of subsequent injury is troubling, and the relatively brief timeframe between first and second claims suggests missed opportunities to mitigate workplace hazards.
Finally, the relationship between body part injured and claims activity varied depending upon the industry, with surprisingly high probabilities (>30%) of second claims in certain industries. Claims activity varied across industries, both overall and for different body parts, with some industries exhibiting very high probabilities of subsequent claims. In Agriculture/Forestry/Fishing, distal upper extremity injuries represented 49.9% of second claims and 84.7% of same body part second claims. The five-year probability of second distal upper extremity claims in this industry was 27.9% (24.0%–31.7%) in males and 30.8% in females (26.7%–34.7%). For same body part second claims, no other industry experienced a relative proportion of injuries near this level. This pattern suggests a relatively heterogeneous distribution of injuries in second claims across all industries while underscoring the significance of distal upper extremity injuries in Agriculture/Forestry/Fishing.
The findings in Agriculture/Forestry/Fishing correlate with previous studies, where farmers and farm workers experienced high rates of low back, shoulder, and upper extremity disorders,[23, 24] in particular sprains and strains.[25, 26] The rate of arthritis, considered a repetitive motion and overuse injury, was also greater in a study of a farm cohort (147.3 per 1,000 people, age adjusted) compared to a non-farm cohort (141.2 per 1,000 people, age adjusted).[27] These findings may not be surprising given the hands-on nature of job tasks in these professions. Existing evidence also suggests that conditions of work, such as poor ergonomics and awkward postures,[28, 29] increase the risk of injury in agricultural workers.
The Police and Fire groups had high probabilities of repeat claims regardless of the body part involved. This finding is consistent with 2016 U.S. Bureau of Labor Statistics data, which rank Police and Fire in the top five of all industries in terms of annual nonfatal occupational injury rates – 9.1 and 8.6 injuries per 100 workers respectively.[30] The consistent finding of elevated injury probabilities in the Police group supports the premise that their work environment is inherently hazardous. Most media attention focuses on fatalities rather than occupational injuries. On average, 115 police and sheriff’s patrol officers suffered fatal work injuries each year from 2003–2014.[31] In 2014, this translated to a rate of 13.5 per 100,000 full-time equivalent workers, compared to 3.4 for all occupations.[31] There is a general paucity of descriptive research investigating the nature and course of both occupational fatalities and occupational injuries in this population.
Similar to the Police group, the Fire group experienced extremely high probabilities of repeat claims. Unlike Police, most second claims for firefighters fell into the “other” category, suggesting a more heterogeneous nature of subsequent injuries. A study by the Rand Corporation Center for Health and Safety in the Workplace found firefighters are 3.5 times more likely to suffer a workplace injury, and 3.8 times more likely to suffer a work-related musculoskeletal disorder than a private-sector worker.[32] Firefighters also take twice as long to return to work after a musculoskeletal injury.[32] The National Fire Protection Association (NFPA) estimates that overexertion (27.1%) and falls-slips-trips (21.0%) are the most common causes of occupational injuries in this population.[33] Overexertion alone may account for over one-third of all injuries, and, in one estimate, over 80% of overexertion injuries resulted in strains and sprains to the firefighters.[34] Fatalities are also common, with an average of 31 firefighters killed each year in the U.S. from 2008–2011.[35] Of interest, only 39% of injuries to firefighters occur on the fireground; the remainder occur during non-fire emergencies (21%), other on-duty activities (18%), training (14%), and responding to/returning from incidents (8%).[33] Given the findings of this study, and patterns described by the NFPA, there appears to be an opportunity for future research examining circumstances surrounding firefighter injuries.
The collection of findings in this study provides an opportunity to better focus on prevention opportunities. Given the high probably of repeat claims, the initial presentation for an injury provides an opportunity to counsel patients related to specific risks associated with their work, and discuss strategies to mitigate the possibility of future injuries. We highlighted Agriculture, Police, and Fire as industries at particularly high risk. In general, while there are patterns of repeat injuries to the same body part, subsequent claims usually involve injuries to different areas of the body. This finding suggests that it may be less an issue of overly aggressive return to work policies or lack or modifiable job options, but rather the persistence of hazards in the work environment that presents the greatest risk.
There are several limitations to our analysis. First, individuals included in this dataset may have claims that occurred outside the study time period, or previously worked for other employers. Thus, first claims in this dataset actually may be subsequent claims, and some subsequent claims may not be captured, resulting in censored observations. In either case, omission of claims would bias the analysis toward the null, thereby underestimating the true effect. Second, this analysis excluded future claims beyond the second claim. This exclusion of subsequent claims was necessary to perform time-to-event analysis, but admittedly ignores a portion of the available data. Including this information may demonstrate that certain professions experience greater/fewer claims on average, or that injuries to certain body parts may predispose to greater/fewer claims on average. Third, limitations in detail of available data such as lack of body part involved beyond the primary diagnosis and lack of sidedness of injury prevented a deeper analysis. Fourth, this study included worker’s compensation claims only in the state of Colorado which may affect generalizability. Fifth, because inclusion in this dataset is predicated on being able to work, it does not include individuals that leave the workforce, thereby potentially underestimating the number and severity of future injuries. Sixth, misclassification of claims was possible in the original dataset and we estimate that approximately 5% of claims in the dataset were ultimately rejected. Finally, inclusion in the dataset was tied to the employer. We believe this may help explain why Mining and Construction, where work is often project-based, had fewer occurrences of repeat claims than one might expect. Likewise, typical long durations of employment for Police and Fire likely help this study reflect a more realistic picture of these industries.
Many opportunities exist for additional research on this subject. First, investigating characteristics of multiple claims both within industries and affecting specific body parts would be valuable for various stakeholders. Police, Fire, and the Agriculture/Forestry/Fishing industries specifically had high probabilities of future claims. Ideally, future analysis would account for movement between employers. Second, this study did not look beyond the first two claims, so there is an opportunity to understand the complete pattern of workers’ injuries over a lifetime of work in each industry. Third, this study suggests there is an important relationship between body parts involved in the first claim and future claims. To guide prevention strategies, more research is needed to better understand the natural course of injuries and relationship between these claims. Fourth, a desirable next step would be to refine predictive models using datasets with more information related work conditions, work schedules, and worker characteristics. Finally, although beyond the scope of this study, it would be important for future research to examine the economic, social, and personal impacts of repeat claims. If initial injuries are treated as sentinel health events that result in changes to work practices, the human and economic burden of subsequent injuries may be greatly reduced.
In conclusion, this was the first study to specifically investigate the relationship between body part and industry involved in the first claim and its role with respect to second claims. Specific industries and specific types of injuries deserve more attention. Occupational medicine providers should use the findings of this study to guide conversations and advise patients. Workplaces should use these findings to target safety programs that help prevent subsequent injuries and promote a healthier, more productive workforce.
Supplementary Material
FIGURE 1B:
FIVE-YEAR PROBABILITY SECOND CLAIM, FEMALE
FIGURE 2B:
FIVE-YEAR PROBABILITY OF SECOND CLAIM, SAME BODY PART BY INDUSTRY, MALE
FIGURE 2C:
FIVE-YEAR PROBABILITY OF SECOND CLAIM ANY BODY PART BY INDUSTRY, FEMALE
FIGURE 2D:
FIVE-YEAR PROBABILITY OF SECOND CLAIM SAME BODY PART BY INDUSTRY, FEMALE
FIGURE 3B:
PUE - FIVE-YEAR PROBABILITY SECOND CLAIM, MALE
FIGURE 3C:
DUE - FIVE-YEAR PROBABILITY SECOND CLAIM, MALE
FIGURE 3D:
PLE - FIVE-YEAR PROBABILITY SECOND CLAIM, MALE
FIGURE 4B:
PUE - FIVE-YEAR PROBABILITY SECOND CLAIM, FEMALE
FIGURE 4C:
DUE - FIVE-YEAR PROBABILITY SECOND CLAIM, FEMALE
FIGURE 4D:
PLE - FIVE-YEAR PROBABILITY SECOND CLAIM, FEMALE
Funding:
National Institute for Occupational Safety and Health, Grant/Award Number: T42 OH009229; Pinnacol Assurance furnished the dataset and provided philanthropic support.
Footnotes
COI: none declared
REFERENCES
- 1.Rossignol M, Suissa S, Abenhaim L. The evolution of compensated occupational spinal injuries. A three-year follow-up study. Spine. 1992;17(9):1043–7. [DOI] [PubMed] [Google Scholar]
- 2.Gotz GA, Liu T-c, Galizzi M. Predictors of Multiple Workers’ Compensation Claims in Wisconsin. Cambridge, MA: Workers Compensation Research Institute; 2000. [Google Scholar]
- 3.Campolieti M The recurrence of occupational injuries: estimates from a zero inflated count model. Applied Economics Letters. 2002;9(9):595–600. [Google Scholar]
- 4.Cherry NM, Sithole F, Beach JR, Burstyn I. Second WCB claims: who is at risk? Canadian Journal of Public Health. 2010:S53–S7. [DOI] [PMC free article] [PubMed] [Google Scholar]
- 5.Ruseckaite R, Clay FJ, Collie A. Second workers’ compensation claims: who is at risk? Analysis of WorkSafe Victoria, Australia compensation claims. Can J Public Health. 2012;103(4):e309–e13. [DOI] [PMC free article] [PubMed] [Google Scholar]
- 6.Ruseckaite R, Collie A. Repeat workers’ compensation claims: risk factors, costs and work disability. BMC Public Health. 2011;11(1):492. [DOI] [PMC free article] [PubMed] [Google Scholar]
- 7.Ruseckaite R, Collie A. The incidence and impact of recurrent workplace injury and disease: a cohort study of WorkSafe Victoria, Australia compensation claims. BMJ open. 2013;3(3). [DOI] [PMC free article] [PubMed] [Google Scholar]
- 8.Leigh JP, Markowitz SB, Fahs M, Shin C, Landrigan PJ. Occupational injury and illness in the United States: estimates of costs, morbidity, and mortality. Archives of Internal Medicine. 1997;157(14):1557–68. [PubMed] [Google Scholar]
- 9.Leigh JP. Economic burden of occupational injury and illness in the United States. The Milbank Quarterly. 2011;89(4):728–72. [DOI] [PMC free article] [PubMed] [Google Scholar]
- 10.Wasiak R, Kim J, Pransky G. Work disability and costs caused by recurrence of low back pain: longer and more costly than in first episodes. Spine. 2006;31(2):219–25. [DOI] [PubMed] [Google Scholar]
- 11.Keogh JP, Nuwayhid I, Gordon JL, Gucer PW. The impact of occupational injury on injured worker and family: outcomes of upper extremity cumulative trauma disorders in Maryland workers. American Journal of Industrial Medicine. 2000;38(5):498–506. [DOI] [PubMed] [Google Scholar]
- 12.Pransky G, Benjamin K, Hill-Fotouhi C, Himmelstein J, Fletcher KE, Katz JN, et al. Outcomes in work-related upper extremity and low back injuries: results of a retrospective study. American Journal of Industrial Medicine. 2000;37(4):400–9. [DOI] [PubMed] [Google Scholar]
- 13.Dembe AE. The social consequences of occupational injuries and illnesses. American Journal of Industrial Medicine. 2001;40(4):403–17. [DOI] [PubMed] [Google Scholar]
- 14.Galizzi M, Zagorsky JL. How do on-the-job injuries and illnesses impact wealth? Labour Economics. 2009;16(1):26–36. [Google Scholar]
- 15.Dong XS, Wang X, Largay JA, Sokas R. Economic consequences of workplace injuries in the United States: findings from the National Longitudinal Survey of Youth (NLSY79). American Journal of Industrial Medicine. 2016;59(2):106–18. [DOI] [PubMed] [Google Scholar]
- 16.Gross DP, Battié MC. Predicting timely recovery and recurrence following multidisciplinary rehabilitation in patients with compensated low back pain. Spine. 2005;30(2):235–40. [DOI] [PubMed] [Google Scholar]
- 17.MacDonald MJ, Sorock GS, Volinn E, Hashemi L, Clancy EA, Webster B. A descriptive study of recurrent low back pain claims. Journal of Occupational and Environmental Medicine. 1997;39(1):35–43. [DOI] [PubMed] [Google Scholar]
- 18.Galizzi M On the recurrence of occupational injuries and workers’ compensation claims. Health Econ. 2013;22(5):582–99. [DOI] [PubMed] [Google Scholar]
- 19.Newman LS, Stinson KE, Metcalf D, Fang H. Implementation of a worksite wellness program targeting small businesses: The Pinnacol Assurance health risk management study. Journal of Occupational and Environmental Medicine. 2015;57(1):14. [DOI] [PMC free article] [PubMed] [Google Scholar]
- 20.Clark TG, Bradburn MJ, Love SB, Altman DG. Survival analysis part I: basic concepts and first analyses. British Journal of Cancer. 2003;89:232–38. [DOI] [PMC free article] [PubMed] [Google Scholar]
- 21.Allison PD. Survival analysis In: Hancock GR, Mueller RO, eds. The Reviewer’s Guide to Quantitative Methods in the Social Sciences. New York, NY: Routledge, Taylor and Francis Group, 2010:413–24. [Google Scholar]
- 22.Lipscomb HJ, Cameron W, Silverstein B. Back injuries among union carpenters in Washington State, 1989–2003. American Journal of Industrial Medicine. 2008;51(6):463–74. [DOI] [PubMed] [Google Scholar]
- 23.Davis KG, Kotowski SE. Understanding the ergonomic risk for musculoskeletal disorders in the United States agricultural sector. American Journal of Industrial Medicine. 2007;50(7):501–11. [DOI] [PubMed] [Google Scholar]
- 24.Rosecrance J, Rodgers G, Merlino L. Low back pain and musculoskeletal symptoms among Kansas farmers. American Journal of Industrial Medicine. 2006;49(7):547–56. [DOI] [PubMed] [Google Scholar]
- 25.McCurdy SA, Samuels SJ, Carroll DJ, Beaumont JJ, Morrin LA. Agricultural injury in California migrant Hispanic farm workers. American Journal of Industrial Medicine. 2003;44(3):225–35. [DOI] [PubMed] [Google Scholar]
- 26.Douphrate DI, Rosecrance JC, Wahl G. Workers’ compensation experience of Colorado agriculture workers, 2000–2004. American Journal of Industrial Medicine. 2006;49(11):900–10. [DOI] [PubMed] [Google Scholar]
- 27.Kirkhorn S, Greenlee RT, Reeser JC. The epidemiology of agriculture-related osteoarthritis and its impact on occupational disability. Wisconsin Medical Journal. 2003;102(7):38–44. [PubMed] [Google Scholar]
- 28.Douphrate DI, Nonnenmann MW, Rosecrance JC. Ergonomics in industrialized dairy operations. Journal of Agromedicine. 2009;14(4):406–12. [DOI] [PubMed] [Google Scholar]
- 29.Fathallah FA. Musculoskeletal disorders in labor-intensive agriculture. Applied Ergonomics. 2010;41(6):738–43. [DOI] [PubMed] [Google Scholar]
- 30.Injuries, Illnesses, and Fatalities - 2016. Bureau of Labor Statistics; 2017. [Google Scholar]
- 31.Fact Sheet, Police Officers - 2016. Bureau of Labor Statistics; 2016. [Google Scholar]
- 32.Seabury SA, McLaren CF. The Frequency, Severity, and Economic Consequences of Musculoskeletal Injuries to Firefighters in California. Rand health quarterly. 2012;2(3). [PMC free article] [PubMed] [Google Scholar]
- 33.Haynes HJG, Molis JL. United States Firefighter Injuries - 2016. National Fire Protection Association; 2017. [Google Scholar]
- 34.Walton SM, Conrad KM, Furner SE, Samo DG. Cause, type, and workers’ compensation costs of injury to fire fighters. American Journal of Industrial Medicine. 2003;43(4):454–8. [DOI] [PubMed] [Google Scholar]
- 35.Firefighter Factsheet - 2013. Bureau of Labor Statistics; 2013. [Google Scholar]
Associated Data
This section collects any data citations, data availability statements, or supplementary materials included in this article.


