Abstract
Transmembrane serine protease 2 (TMPRSS2) has been established as one of the host proteins that facilitate entry of coronaviruses into host cells. One of the approaches often employed towards preventing the entry and proliferation of viruses is computer-aided inhibition studies to identify potent compounds that can inhibit activity of viral targets in the host through binding at the active site. In this study, we developed a pharmacophore model of reportedly potent drugs against severe acute respiratory syndrome coronaviruses 1 and 2 (SARS-CoV-1 and -2). The model was used to screen the ZINC database for commercially available compounds having similar features with the experimentally tested drugs. The top 3000 compounds retrieved were docked into the active sites of a homology-modelled TMPRSS2. Docking scores of the top binders were validated and the top-ranked compounds were subjected to ADME, Lipinski’s and medicinal Chemistry property predictions for druglikeness analyses. Two lead compounds, ZINC64606047 and ZINC05296775, were identified having binding affinities higher than those of the reference inhibitors, favorable interactions with TMPRSS2 active site residues and good ADME and medicinal chemistry properties. Molecular dynamics simulation was used to assess the stability and dynamics of the interactions of these compounds with TMPRSS2. Binding free energy and contribution energy evaluations were determined using MMPBSA method. Analyses of the trajectory dynamics collectively established further that the lead compounds bound and interacted stably with active site residues of TMPRSS2. Nonetheless, experimental studies are needed to further assess the potentials of these compounds as possible therapeutics against coronaviruses.
Communicated by Ramaswamy H. Sarma.
Keywords: Pharmacophore modeling, homology modeling, COVID-19, serine protease
1. Introduction
Coronavirus disease 2019 (COVID-19), caused by the severe acute respiratory syndrome coronavirus 2 (SARS-CoV-2), has become a pandemic of extreme global concern and medical emergency, gaining utmost focus in the current time all around the world. The SAR-CoV-2, which broke out in Wuhan, China, in December 2019 (Wang et al., 2020; Zhou et al., 2020; Zhu et al., 2020), has since been spreading rapidly with over 3.5 million cases of infection and at least 243,400 deaths reported in 215 countries and territories as of May 5, 2020 (WHO, 2020b). Over the previous one month, the number of recorded cases of infection and deaths had increased by 3-fold and nearly 4-fold, respectively as 1.1 million cases and 62,700 deaths were recorded as of April 5, 2020 (WHO, 2020a). This indicates that the pandemic still continues to ravage the world as efforts to curtail it grow. Hence, there is a strong need for quick development of more easily accessible and reliable treatment options in order to further curb the spread, minimize death rate and salvage global economy.
Efforts to develop antiviral drugs against SAR-CoV-2 have resorted to the targeting of several candidates including coronavirus main protease—3CLpro/Mpro (Jin et al., 2020), papain-like protease — PLpro (Elfiky & Ibrahim, 2020; Li & De Clercq, 2020), RNA-dependent RNA polymerase — RdRp (Sheahan et al., 2020), angiotensin-converting enzyme 2 — ACE2 (Han & Král, 2020), viral spike glycoprotein S — S protein (Robson, 2020), and transmembrane serine protease 2 — TMPRSS2 (Hoffmann et al., 2020; Li & De Clercq, 2020). As several institutions and pharmaceutical companies across the globe are expediting unprecedented efforts towards the development of novel antiviral drugs and vaccines, repurposing of existing drugs and compounds provides the fastest and easiest response to combat the pandemic via the identified targets. The latter had led to the identification and repurposing of many drugs with varying ability to inhibit the targets (Elfiky & Ibrahim, 2020; Hoffmann et al., 2020; Li & De Clercq, 2020). Yet, there are fears that repurposing therapeutics originally designed to tackle other diseases could result in undesired pharmacological reactions and adverse effects as well as issues regarding relative appropriateness of dosages, etc. (Gns et al., 2019; Oprea et al., 2011; Vedani et al., 2015).
Recent studies have shown that ACE2 and TMPRSS2 are essential for SARS-CoV-2 attachment to and entry into host cells (Hoffmann et al., 2020; Zhou et al., 2020), similar to the requirement of the previous SARS-CoV-1 entry into cells (Glowacka et al., 2011; Li et al., 2003; Matsuyama et al., 2010; Shulla et al., 2011). The virus gains entry into the host cell via its spike protein S using the S1 unit to recognize and attach to ACE2 as a receptor on the host cell surface. TMPRSS2 primes S protein by cleaving it at the S1/S2 and S2' sites facilitating the fusion of viral and host cell membranes as well as proliferation and subsequent spreading (Hoffmann et al., 2020). In another independent mechanism, TMPRSS2, in addition to human airway trypsin-like protease (HAT), also cleaves ACE2 leading to an increased coronavirus entry into host cells (Heurich et al., 2014).
TMPRSS2 has been established as a host protein that is instrumental in the spread of a number of viral infections caused by coronaviruses and influenza A viruses (Gierer et al., 2013; Glowacka et al., 2011; Heurich et al., 2014; Iwata-Yoshikawa et al., 2019; Matsuyama et al., 2010). However, it has also been described as less essential for host’s homeostasis and developmental processes, a knockout of which did not result in any adverse effects in mice, thus its functionality could be dispensable (Hoffmann et al., 2020; Kim et al., 2006). This makes it a plausible and pursuable target for inhibition towards the development of drugs against SARS-CoV-2 (Hoffmann et al., 2020). A promising approach to preventing viral entry and proliferation is computer-aided active site-directed inhibition of targets as shown by previous studies including those on inhibitors against coronaviruses’ proteases (Kaeppler et al., 2005; Niu et al., 2008; Verschueren et al., 2008; Zhu et al., 2011).
In this study, due to the unavailability of TMPRSS2 crystal structure, we built its homology model using the closely related Serine Protease Hepsin as template followed by steps of refinement in order to improve the quality of the model. We then developed a ligand-based pharmacophore model of druggable compounds against TMPRSS2 using as templates six of the drugs, including camostat mesylate and nafamostat mesylate (Hoffmann et al., 2020; Yamamoto et al., 2016), that have been identified as promising therapeutics against SARS-CoV-2 and are being tested for repurposing. The pharmacophore model was used in a structure-based virtual screening approach to screen a database of over 750 million commercially available compounds in an attempt to identify novel drug-like compounds with similar pharmacophore features as those of the model that could be explored for antiviral leads. A total of top 3000 compounds were retrieved and computationally docked into the active site regions of the TMPRSS2 model. The docking scores of the top binders were re-validated and the topmost-ranked compounds were screened for ADME and druglikeness properties. The ligand-receptor complexes of the best ligands were subjected to molecular dynamics simulation using GROMACS so as to comprehensively assess the stability and structural flexibility of the complexes, and to understand the protein-ligand interactions therein. Further, using MMPBSA method the binding energies in each case were also calculated, and various analyses of the simulation results were carried out.
2. Materials and methods
2.1. Pharmacophore model identification
The pharmacophoric features of our experimental inhibitor drugs were modeled through the PharmaGist web server which can elucidate three-dimensional (3D) pharmacophores from known drug-like compounds that can bind to a target receptor (Schneidman-Duhovny et al., 2008). This methodology efficiently looks for pharmacophore patterns that are possible, and report only the ones with the highest score (Inbar et al., 2007). Detection of candidate pharmacophores was through multiple flexible alignment of the ligands that was input into the system and the ligands flexibility is explicitly treated in the process of alignment. PharmaGist characteristic tolerance to outliers and other modes of binding is as a result of its ability to detect pharmacophores that are common to a subset of input ligands. This serves as a comparative advantage for the methodology that is made up of four major stages (the preparation of ligands, pairwise alignment, multiple alignment and solution clustering), before the output.
In the ligand preparation stage, each of the ligands was separately processed. Rotatable bonds in each ligand were detected through this method and divided accordingly into rigid groups. The ligands in addition were individually assigned with a set of physiochemical features such as anions, cations, hydrogen bond acceptors, hydrogen bond donors, hydrophobic groups and aromatic rings. This process was followed by the second stage which involves the computation of pairwise alignment on the basis of a given pivot and a target ligand. The pivot and ligand were treated as rigid and flexible entities, respectively. The second stage output is a large number of pairwise alignments with high scores between each ligand and the pivot.
A selected pivot is also involved in the third stage of the pharmacophore modeling method, where the pairwise alignments that were formed between each ligand and the pivot were combined to form multiple alignments, with the aim of detecting significant pivot features subsets that matches the possible maximum number of pairwise alignment for each ligand. This method therefore produced multiple alignment for each subset size of the input ligands through the enumeration of all possible pivot features subset and the selection of only those that could be aligned by as many ligands as possible. Candidate pharmacophores that were reported are subsets of pivot features with significant scores. Candidate pharmacophores that were obtained from various pivot iterations were clustered in the last stage and only the non-redundant ones with the highest scores for each molecule was reported.
2.2. Pharmacophore search in chemical library
Having successfully detected the consensus pharmacophore features between our experimental compounds, we ran a search through the ZINCPharmer database in search of possible ligands with similar features. ZINCPharmer (Koes & Camacho, 2012) is a pharmacophore-based search engine for chemicals that can be purchased and it provides a mechanism for the derivation of an initial hypothesis for pharmacophores, directly for protein data bank (PDB) structures. ZINCPharmer also supports the importation of defined pharmacophores that were developed with the aid of advanced computational approaches and having their implementation in third party tools. Recore (Maass et al., 2007) and Pharmer (Koes & Camacho, 2011) which are newer approaches implemented by the ZINCPharmer use indexing methods to scale search times with the breadth and complexity of the query but not the library size.
The Pharmer open-source software is used by the ZINCPharmer to facilitate the interactive search of millions of available conformations within few minutes. ZINC itself is a collection of biologically relevant and likewise commercially available compounds that are suitable for virtual screening. The produced conformers undergo conversion into an efficient format for database search using the Pharmer open-source software. Pharmer uses the SMARTS matching Open Babel toolkit (O'Boyle et al., 2011) functionality for the identification of aromatic rings, positive or negative ions, hydrogen bond acceptor and hydrogen bond donor, all of which are possible pharmacophore features.
2.3. Homology modeling and evaluation of model quality
Owing to the unavailability of TMPRSS2 crystal structure, we built its homology model using the SWISS-MODEL server (https://swissmodel.expasy.org/). SWISS-MODEL is an online server that relies on ProMod3, a modeling tool based on the OpenStructure computational framework for the generation of protein models using homology (Biasini et al., 2014). The protein sequence of TMPRSS2 isoform 1 (equivalent of TMPRSS2 isoform 2 on NCBI database) was fetched onto the SWISS-MODEL server by inputting its UniProtKB accession code (O15393-1). Suitable template structures for the modeling were searched using the SWISS-MODEL template library (SMTL), a huge database of experimentally solved protein structures built on PDB entries. SWISS-MODEL executes this task by first running a sequence similarity search using the BLAST (Camacho et al., 2009) and HHblits (Remmert et al., 2011) databases simultaneously, and only homologues with known PDB structures are returned as hits and ranked based on QMEAN scoring function (Waterhouse et al., 2018). The top-ranked structures were selected and used as templates to build TMPRSS2 models.
Refinement of the best model was done using 3DRefine server (http://sysbio.rnet.missouri.edu/3Drefine/) (Bhattacharya et al., 2016) and GalaxyRefine (Heo et al., 2013) tool available on GalaxyWEB server (http://galaxy.seoklab.org/). The qualities of the refined models were then analyzed using ERRAT (Colovos & Yeates, 1993), ProSA (Wiederstein & Sippl, 2007) and by generating Ramachandran plots on PROCHECK (Laskowski et al., 1993).
2.4. Preparation of ligand library for docking
Molecular docking was carried out using PyRx 0.8 (Dallakyan & Olson, 2015). The top 3000 compounds obtained using the pharmacophore-based screening were retrieved from the Zinc database and saved as a single SDF file. The compounds were loaded onto PyRx using the Open Babel tool available in the software. The energies of the ligands were minimized using the uff geometry optimization force field, with the optimization algorithm set to conjugate gradients at 200 total steps. The energy-minimized ligands were then converted to the ready-to-dock PDBQT format.
2.5. Active site identification and preparation of TMPRSS2 for docking
By running a conserved domain (CD)-search using the NCBI’s conserved domain database (CDD/SPARCLE), TMPRSS2 was analyzed and its active site residues were predicted. We then used COACH-D server (Wu et al., 2018), an improved version of COACH server (Yang et al., 2013b), to further predict TMPRSS2 putative ligand-binding sites. The active site residues of the 5CE1.A template were equally predicted in order to carry out a model-template active site comparative analysis. We also used the original COACH server as a way of validating the predicted binding sites. The CDD algorithm searches a sequence of protein for footprints of conserved domains and annotates the sequence with locations of the domain families and subfamilies, characteristic amino acids as well as functional sites deduced from identified footprints (Marchler-Bauer et al., 2017).
The COACH-D algorithm employs methods that identify ligand-binding templates from the BioLiP database of biologically important ligand–protein interactions (Yang et al., 2013a) using comparisons of binding-specific substructure and sequence profile. The consensus predictions from the different computational methods are then generated in order to produce the final ligand binding site predictions. The top five are results are selected as output and ranked according to such parameters as prediction confidence score (C-score) and docking energy for the complex built with ligands from the PDB templates (Yang et al., 2013b). We manually examined the top five predicted binding sites and finally chose and proceeded with the top two based on two criteria: (1) prediction C-score and docking binding energy of the predicted ligand-binding site complex; (2) the presence of the CDD-predicted active site residues in the binding site. The TMPRSS2 model in its PDB format was loaded onto PyRx and converted to PDBQT format while simultaneously setting it as the target macromolecular ready for docking.
2.6. Molecular docking
Docking was carried out on PyRx using the AutoDock Vina option ran at an ‘exhaustiveness’ of 8. In order to define the Vina search space, the grid box was centered at X = 12.1477, Y = –3.5864, Z = 18.4151, with a grid dimension of 45.0279 Å × 68.7439 Å × 56.9456 Å, thereby enclosing the active site residues (including the catalytic triad and the substrate binding site), the two predicted binding sites as well as the neighboring regions surrounding them. Following a series of ligand-receptor docking runs, Vina evaluates the results, calculates the binding affinities of the ligands and clusters the resulting poses based on their conformational overlaps. The best pose from each cluster is chosen and the ligands are then ranked according to their binding affinities (Trott & Olson, 2010). The docking results of the top ligands were first validated by re-docking them into the same defined regions of the receptor using AutoDock Vina.
Re-validation of the binding scores and protein-ligand interactions was then done by BINDSURF (Sánchez-Linares et al., 2012). A blind docking of the ligands to the TMPRSS2 model was carried out using the BINDSURF Achilles blind docking server (http://bio-hpc.eu/software/blind-docking-server/) which carries out an exhaustive series of docking simulations and calculations of the ligand to the entire protein surface so as to identify sites with the best binding affinities. The tool then uses a pose clustering algorithm to generate clusters of the results, and the pose with the best binding affinity in each cluster is chosen as the representative. The BINDSURF tool analyses the docking results for protein-ligand interactions by employing Protein-Ligand Interaction Profiler (PLIP) algorithm (Salentin et al., 2015). We manually inspected the representative clusters, and the best post having the ligand bound at the predicted pocket was identified and chosen for each compound. The protein-ligand interactions of the AutoDock Vina-generated results were analyzed using LigPlot (Laskowski & Swindells, 2011) and visualization of binding pose of the complexes was done using PyMOL (DeLano, 2002).
2.7. ADME and druglikeness analysis
The ADME (absorption, distribution, metabolism, excretion), druglikeness and medicinal Chemistry parameters of selected ligands were predicted using the SwissADME (Daina et al., 2017) web tool (http://www.swissadme.ch/).
2.8. Molecular dynamics simulations and structural analyses
The TMPRSS2-ligand complexes of the top two ligands as obtained from the molecular docking step were subjected to molecular dynamics simulation to understand the effect of their binding on the structural stability and conformational flexibility of TMPRSS2 and the complexes. The simulation (MDS) was done using GROMACS 2018 (Lemkul, 2019) with the GROMOS96 43A1 force field and in a size 1.0 nm cubic box under periodic boundary conditions, solvated with SPCE water and neutralized by adding seven chloride ions. The topology files of the ligands were generated using the PRODRG2 server (Schüttelkopf & Van Aalten, 2004). The steepest descent algorithm was deployed for the energy minimization at 1000 steps with position restraint applied on the TMPRSS2-ligands. The minimized system was subjected to a two-phase equilibrium step. Temperature equilibration at 300 K was done on the system followed by pressure equilibration at 1 bar for 50,000 ps. A 50 ns production MDS run was performed, maintaining the temperature at 300 K and the pressure at 1 bar. Structural analysis was conducted on the systems via its trajectory using the root mean square deviation (RMSD), root mean square fluctuation (RMSF), radius of gyration (Rg), analysis of hydrogen bonding and solvent accessible surface area (SASA) to understand the differences that could have occurred during the simulation time. Xmgrace (Turner, 2005) was used for graph plotting and Visual Molecular Dynamics (VMD) (Humphrey et al., 1996) was used for visualization.
2.9. Calculation of binding and contribution energies using MMPBSA
The binding energies of the complexes were calculated using the Molecular Mechanics-Poisson Boltzmann Surface Area (MMPBSA) protocols implemented in g_mmpbsa package (Kumari et al., 2014) over the last 10 ns of the 50-ns protein-ligand trajectories. Origin 2018 (OriginLab, 2018) was used to plot the MMPBSA calculations. The binding energies compose the van der Waal and electrostatic interactions, the solvation energy. The solvation energy comprises of the polar and non-polar energy.
3. Results and discussion
3.1. Pharmacophore model identification
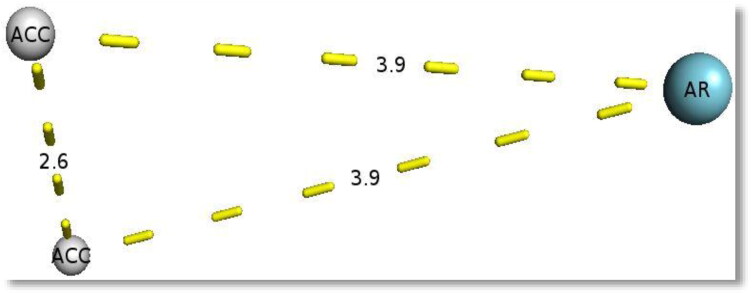
The input as earlier described is a compressed file containing a set of six drug like compounds, four of which are serine protease inhibitors (camostat mesylate, nafamostat, pefabloc SC and phenylmethylsulfonyl fluoride) and the remaining two being Janus-associated kinase inhibitors (baricitinib and ruxolitinib). The output was a 3D depiction of candidate pharmacophore features (Figure 1). This is a 3D pattern of the shared physiochemical features between the input ligands. The output in addition, also produced a 3D superposition conformation of the input compounds for each candidate pharmacophore (Figure 2(A–F)). The algorithm generally suggests the task solving through multiple flexible druglike compounds alignment, but due to the enormity of this task, provision was made for a heuristic solution in practice. The algorithm in addition is also based on the assumption that one of the input ligands is in a conformation that is very similar to the bound state, thereby acting as the pivot where the remaining ligands will be aligned, although the algorithm by default selects iteratively the input compound that will act as the pivot.
Figure 1.
Three-dimensional depiction of the resulting candidate pharmacophore features. The output produced two common hydrogen bond acceptors (ACC) and a single aromatic ring (AR) at varying distances.
Figure 2.
Three-dimensional superposition of camostat mesylate (A), nafamostat (B), Pefabloc SC (C), phenylmethylsulfonyl fluoride (D), Baricitinib (E), and Ruxolitinib (F) on each candidate pharmacophore.
3.2. Pharmacophore search in chemical library
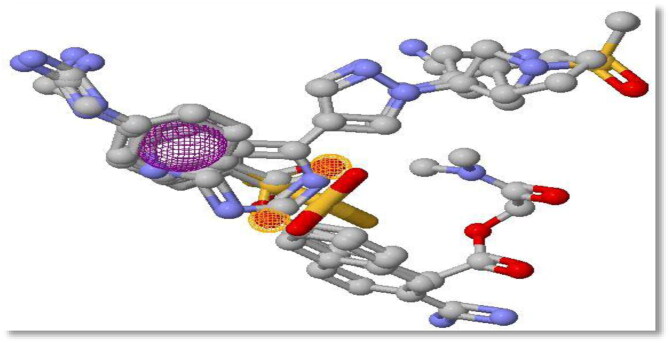
The ZINCPharmer server output displays the distinct pharmacophore features within the aligned input ligands using a Jmol-based molecular viewer. The aligned input ligands were displayed in the form of sticks while the aromatic ring and hydrogen bond acceptor pharmacophore features were presented in pink and purple mesh, respectively (Figure 3). The result browser which links directly and the information about the purchase of any selected compound display the zinc identity of the top hits. For the purpose of this study, the returned search hits were filtered down to the top 3000 compounds which were screened based on individual root mean square deviation (RMSD) at a given conformation to the query.
Figure 3.
Three-dimensional structural alignment display of experimental compounds, showing the three points with consensus pharmacophore features. Regions of consensus hydrogen bond acceptors are shown in pink mesh while the region of the consensus aromatic ring is shown in purple mesh.
The spatial arrangement of enabling features of a compound for interaction with a receptor target in a particular binding mode is regarded as a pharmacophore. A pharmacophore once identified can be used as a versatile application model for rational drug design, such as lead optimization, de novo design, ADMET studies and virtual screening (Güner, 2000). With a given set of compounds with drug-like properties, our aim of carrying out this pharmacophore modeling protocol is to locate the largest or highest scoring features that is responsible for their binding to a specific receptor target in a 3D pattern. These features must be common to most or preferably all the input compounds as projected in Figure 1. This process is a challenging task based on the flexible nature of the drug-like compounds and in most cases, the number of input ligands, because the alignment of drug-like compounds in the case of three rigid compounds has been shown to be quite challenging, and more challenging has been the case of two compounds where one is flexible and the other is rigid (Akutsu & Halldórsson, 2000; Shatsky et al., 2006).
The existing indirect method as used in this study for the detection of the common pharmacophore features between our compounds of interest greatly differs in its approach of sorting the flexibility of drug-like compounds, as such a compound may exhibit a wide range of potentially feasible conformations due to its possession of several rotatable bonds. For this reason, all possible feasible conformations assumed by the experimental compounds must be considered in the process of modeling the common pharmacophore features, as the particular conformations adopted by the compounds during interaction with a specific receptor is unknown. Most indirect pharmacophore modeling methods are known for performing the search for conformations as an initial separate stage through which a discrete conformational set will be generated for input compound with the objective of sampling all feasible conformations (Shatsky et al., 2006). The generated pharmacophore features were used for the virtual screening of compounds in the ZINC database, a process which led to the generation of a set of newly discovered TMPRSS2 inhibitors with favorable drug-like properties.
3.3. Homology modeling and evaluation of model quality
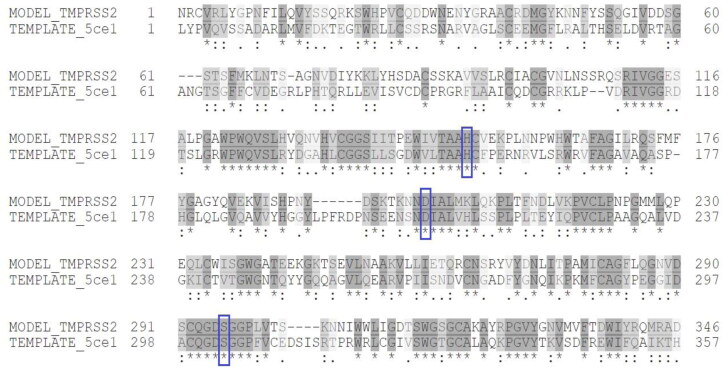
The SWISS-MODEL sequence alignment and template search identified five crystal structures of Serine Protease Hepsin as the top-ranked most related structures. Based on its Global Model Quality Estimate (GMQE) score (which is an estimated quality score of the expected output model using a particular template) being 0.53, sequence coverage of 70%, sequence identity of 33.82% and sequence similarity of 51% with the template (Figure 4), Serine Protease Hepsin (SPH; PDB ID: 5CE1 (Rao et al., 2016)) was used to build TMPRSS2 model. A template sharing a similarity of more than 30% with the sequence of interest is generally considered suitable and a model obtained therewith will be expected to be reliable and plausible (Zhexin, 2006). The QMEAN Z-score of the model generated was –1.43 (Table 1). The QMEAN score gives an estimate of the degree of nativelikeness of the model, and scores close to 0 and not lower than –4.0 indicate models having satisfactory agreement with experimental structures of similar size (Benkert et al., 2011).
Figure 4.
Model-template sequence alignment of TMPRSS2 and Serine Protease Hepsin chain A (5CE1.A). Conserved catalytic triad residues are enclosed in blue boxes.
Table 1.
Summary of quality check and validation scores of TMPRSS2 homology model.
| Server/tool | Parameter | Score |
|---|---|---|
| SWISS-MODEL | QMEAN | –1.43 |
| ProSA-web | Z-score | –8.74 |
| PROCHECK (Ramachandran plot) | Most favored regions | 87.3% |
| Additional allowed regions | 12.4% | |
| Disallowed regions | 0.3% | |
| G-factor | –0.47 | |
| ERRAT plot | Overall quality factor | 94.97% |
| PyMOL (Model-Template alignment) | RMSD | 0.157 Å |
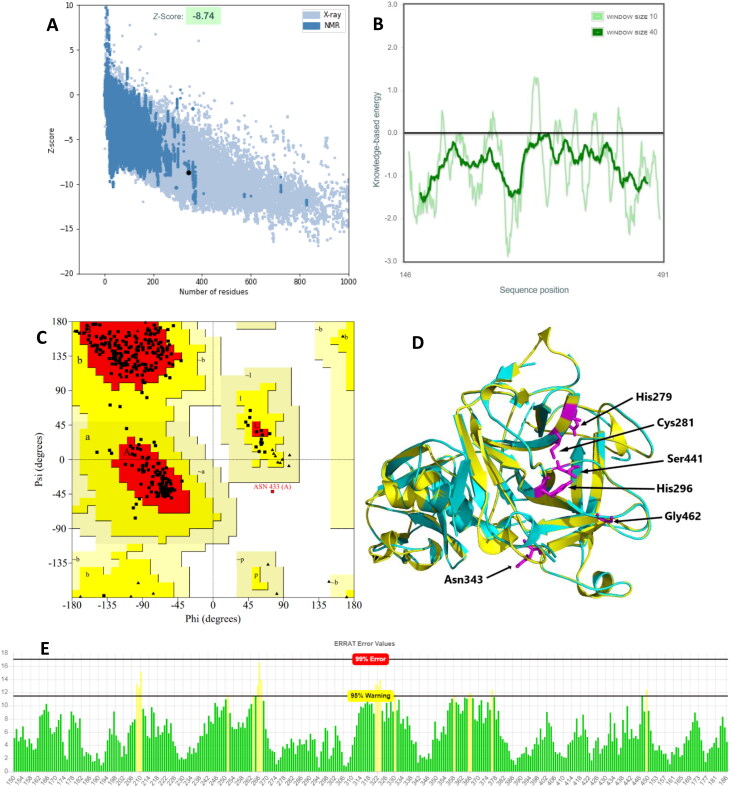
The TMPRSS2 model was refined using 3DRefine and GalaxyRefine. Analysis of the refined models with Protein Sequence Analysis tool (ProSA) and PROCHECK suggested that the 3DRefined-model had higher improvement in quality and was hence selected for subsequent steps. The ProSA tool calculates the overall quality score as a measure of its Z-score in relation to the Z-scores of PBD experimentally determined native structures (Wiederstein & Sippl, 2007). The Z-score of our model when validated with ProSA-web was –8.74 (Figure 5(A); Table 1), which falls within the range of those of the PDB native structures. In addition, the amino acids local energy profile plot showed that all the residues across the sequence have negative values (Figure 5(B)) indicating favorable amino acid energy profile, high accuracy and reliability of the model. Ramachandran phi/psi torsion angles plot was generated using PROCHECK (Laskowski et al., 1993). Based on the plot, 99.7% of the residues in the modelled TMPRSS2 structure are in the allowed regions with 87.3% in the most favored regions, 12.4% in additional allowed regions and only 0.3% in disallowed regions (Figure 5(C); Table 1). This indicate that the model has good stereochemical quality and energetically favored geometry.
Figure 5.
Quality assessment and structural validation of TMPRSS2 homology model. (A) ProSA Z-score plot of the overall model quality (B) ProSA amino acid local energy profile (C) PROCHECK Ramachandran plot (D) Model-Template structural alignment of TMPRSS2 model (Yellow) and SPH 5CE1 (Cyan), RMSD = 0.157 Å. Shown with stick representation (magenta) are identical active site residues predicted by COACH-D for both the model and the template and were structurally conserved (E) ERRAT plot for TMPRSS2 model. Green bars: properly folded regions, yellow bars: less properly folded regions at 95% confidence level, red bars (none in this model): improperly folded regions at 99% confidence.
The ERRAT plot analysis of the model gave an overall quality factor (OQF) of 94.97% which is very much above the generally accepted score of >50%. ERRAT error plot is a statistical analysis of the non-bonded atomic interaction of protein structures with the quality level calculated as OQF, and higher OQF scores implying higher model quality. The TMPRSS2 model ERRAT plot (Figure 5(E)) showed that most of the residues are properly folded with very low error rate, hence the high OQF. The refined TMPRSS2 model was structurally aligned and superimposed with the 5CE1 template PDB structure using PyMOL software (DeLano, 2002). The structural alignment showed an RMSD of 0.157 Å (Figure 5(D); Table 1) indicating that the model had a very high structural similarity with the template and thus reliable and suitable for the study. In addition, a comparative model-template active site analysis showed that identical active site residues predicted by COACH-D for both the model and the template were structurally conserved in the model as shown with stick representation (magenta) in Figure 5(D). However, some of the binding site residues that were predicted for only the template were not identical to the corresponding ones on the model when aligned structurally, but the positions were rather occupied by chemically similar amino acids. This shows that important active site residues of TMPRSS2 were appropriately modelled and the model is thus reliable.
3.4. Active site identification
Based on the CD-search, residues 256-487 of TMPRSS2 form a domain characteristic of Trypsin-like serine proteases. The CDD algorithm also identified a total of six amino acid residues that are especially important in the active site make-up of TMPRSS2. They include three residues (His296, Asp345, Ser441) found at the catalytic site (catalytic triad), and three residues (Asp435, Ser460, Gly462) found at the substrate binding site. The top two binding sites predicted by COACH-D server are shown in Table 1. The best prediction had a confidence score of 0.99, which indicates a very high reliability, and –7.0 kcal/mol docking energy of representative ligand and template complex showing that potential ligands would high a preference and affinity for the site (Wu et al., 2018). The predicted binding site ranked second had a C-score of 0.11 which is higher than the other lower rank binding sites. In addition, the binding residues of the top two predictions included five of the six CDD-predicted active site residues including the catalytic triad (Table 2). However, the lower rank predictions included none of the CDD-predicted residues and they are also located farther from them. The top two predicted binding sites were also validated by the COACH server and thus were defined as the Vina search space in the molecular docking step.
Table 2.
Active site residues and top two putative binding sites as predicted by COACH-D.
| Predicted binding site | C-score | Docking energy of representative ligand-template complex | Predicted binding residuesa |
|---|---|---|---|
| CD-Search_ active site | – | – | His296, Asp345, Asp435, Ser441, Ser460, Gly462 |
| COACH-D_ binding site 1 | 0.99 | –7.0 | His296, Lys342, Asp435, Ser436, Cys437, Asn438, Gly439, Ser441, Thr459, Ser460, Trp461, Gly462, Ser463, Gly464, Cys465, Gly472 |
| COACH-D_ binding site 2 | 0.11 | –1.0 | His279, Val280, Cys281, His296, Leu302, Lys342, Thr393, Asp435, Ser436, Cys437, Asn438, Gly439, Asp440, Ser441, Ser460, Trp461, Gly462, Gly464, Gly472 |
aCommon residues with CD-predicted active site are in bold characters.
3.5. Molecular docking, ADME and drug-likeness analysis
Virtual screening methods used in the identification of potential lead compounds against a target include ligand-based and structural-based (receptor-based) methods (Cereto-Massagué et al., 2015; Clark, 2008; Kumar & Zhang, 2015). In this study, 107 out of the 3000 compounds that were docked with TMPRSS2 gave higher binding scores than Nafamostat (the reference drug with the highest score of –8.20 kcal/mol). The binding scores of these ligands were validated by re-docking them with TMPRSS2 and there were no much deviations when compared with the first docking results. This shows that the pharmacophore model obtained in this study was able to identify ligands with good binding affinity for the target.
A cut-off score of –8.70 kcal/mol (well above the binding affinity of the best reference drug) was set and 33 from the 107 compounds passed with binding scores above this set threshold. The binding scores of these top-ranked compounds as well as the reference drugs were further re-validated by BINDSURF Blind Docking Server. The binding energies were remarkably similar to and consistent with AutoDock Vina-generated scores. Overall, most of the top ligands including the reference drugs had a deviation of no more that ±0.40 kcal/mol. However, two lead compounds (ZINC64606047 and ZINC05296775 also referred to as LIGAND1 AND LIGAND2, respectively) from the top-ranked ligands screened passed the various rules of leadlikeness and druglikeness which included Lipinski’s (Lipinski, 2002), Ghose’s (Ghose et al., 2012), Veber's (Pollastri, 2010), and Varma's (Varma et al., 2004), Egan’s (Egan, 2010), Muegge’s (Muegge, 2002), PAIN (Pan assay interference compounds) (Baell et al., 2013) and Brenk alerts (Brenk et al., 2008), indicating that they possess good druglike, leadlike and medicinal chemistry properties.
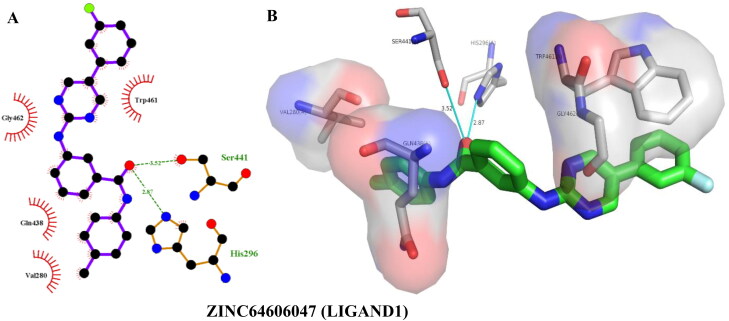
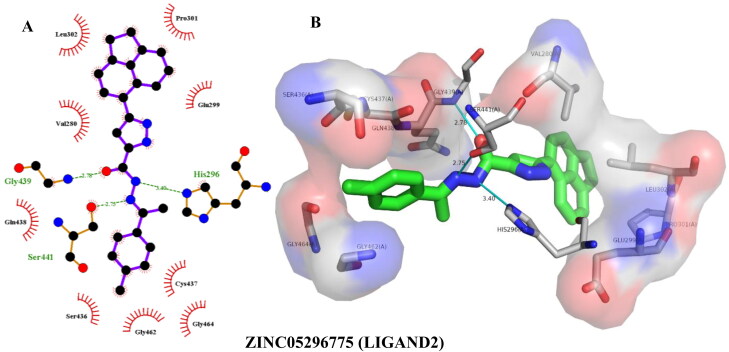
ZINC64606047 (LIGAND1, IUPAC: 3-[[5-(3-fluorophenyl)pyrimidin-2-yl]amino∼(N)-(4-methyl phenyl)benzamide]) showed the highest binding affinity of –9.30 kcal/mol, forming two hydrogen bonds and four hydrophobic interactions with TMPRSS2 as calculated by Autodock Vina (Table 3, Figure 6). BINDSURF validated the binding energy as well as the binding interactions, with ZINC64606047 giving a binding energy of –9.00 kcal/mol and two more hydrogen bonds with Val280 (Table 4) in addition to those calculated by AutoDock Vina (Table 3). Docking with Autodock Vina showed that ZINC05296775 (LIGAND2, IUPAC: 3-(1,2-dihydroacenapthylen-5-yl)-(N)-[(-(E))-1-(4-methyl phenyl)ethylideneamino]-1-(H)-pyrazole-5-carboxamide) bound to TMPRSS2 with an energy of –9.20 kcal/mol, forming three hydrogen bonds and seven hydrophobic interactions (Table 3, Figure 7). Similarly, it gave a binding energy of –9.40 kcal/mol with BINDSURF, albeit the highest ranked (Table 4), forming three hydrogens bonds with Gly439, Ser441, and His296 and seven hydrophobic bonds with the same residues as observed with AutoDock Vina. The TMPRSS2 amino acid residues involved in ligand interactions with LIGAND1 and LIGAND2 as indicated in Figures 6 and 7 are part of the residues that make up the binding pockets 1 and 2 (Table 2), as predicted by COACH-D, and even more interestingly, residues of the catalytic triad were also interacted with. This shows that LIGAND1 and LIGAND2 have the potential of disrupting the binding of substrates to the TMPRSS2 binding pockets as well as preventing catalysis by the triad.
Table 3.
Protein-ligand binding energy and interactions generated from docking with AutoDock Vina.
| Ligands | Binding energy (kcal/mol) | Residues involved in protein-ligand interactions |
|
|---|---|---|---|
| Hydrogen bonds (bond distance in Å) | Hydrophobic interactions (bond distance in Å) | ||
| ZINC64606047 (Ligand1) | –9.30 | Ser441(3.52), His296(2.87) | Trp461(3.59), Gly462(3.93), Gln438(3.77), Val280(3.23) |
| ZINC05296775 (Ligand2) | –9.20 | His296(3.40), Gly439(2.78), Ser441(2.75) | Val280(3.79), Val280(3.22), Leu302(3.56), Leu302(3.20), Pro301(3.54), Glu299(2.87), Cys437(3.64) |
| Nafamostat | –8.20 | Gly464(2.90), Asp435(2.87), Trp461(3.19), His296(3.31), Val280(3.21), His279(2.93) | Thr459(3.90) |
| Camostat | –7.20 | Ser441(2.38), Gln438(2.31), Ser436(2.89), His296(3.26) | Gln438(3.78) |
| Baricitinib | –6.90 | Ser460(3.36), Ser441(2.98), Gly464(3.11), Gln438(3.29) | Val280(3.91) |
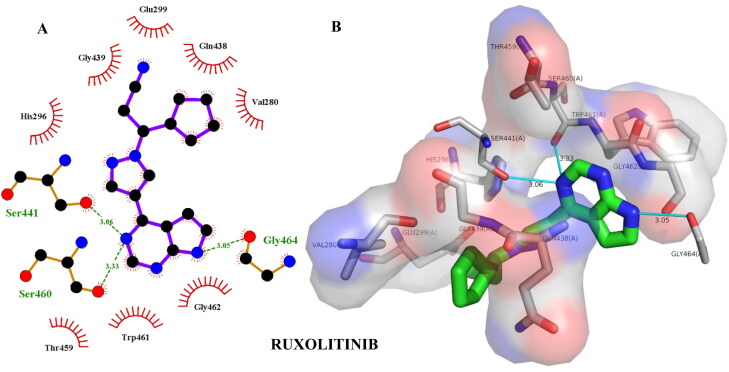
| Ruxolitinib | –6.70 | Ser441(3.06), Ser460(3.33), Gly464(3.05) | Gly462(3.85), His296(3.50), Trp461(4.06), Gln438(3.74) |
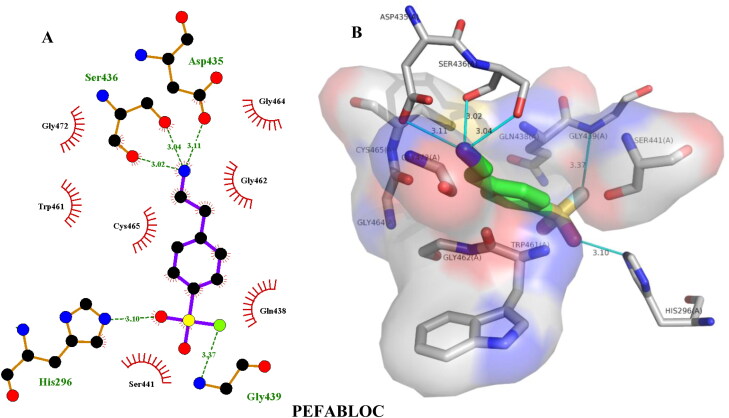
| Pefabloc | –5.60 | His296(3.10), Gly439(3.37), Ser436(3.04), Ser436(3.02), Asp435(3.11) | Gln438(3.71) |
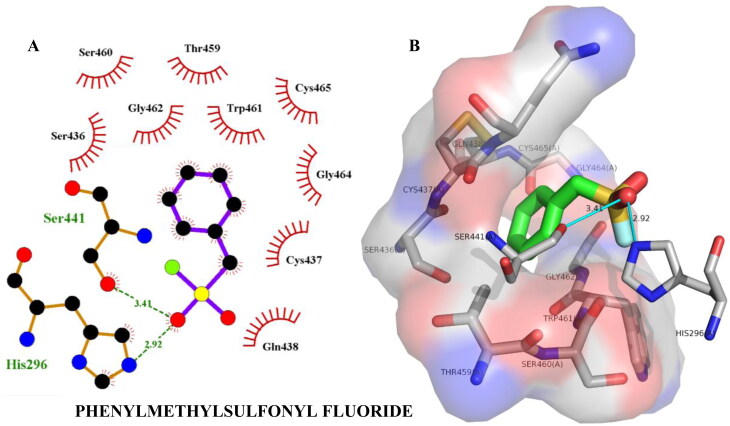
| Phenylmethyl sulfonylfluoride | –5.00 | His296(2.92), Gly439(3.34), Ser441(3.41) | Thr459(3.48) |
Figure 6.
Hydrogen bonding and hydrophobic interactions of ZINC64606047 with TMPRSS2. 2D (A) and 3D (B) representations of its interactions and binding pose within TMPRSS2 binding site.
Table 4.
Validation of docking scores and protein-ligand interactions by BINDSURF.
| Ligands | Binding energy (kcal/mol) | Residues involved in protein-ligand interactions |
|
|---|---|---|---|
| H-bonding (bond distance in Å) | Hydrophobic interaction (bond distance in Å) | ||
| ZINC05296775 (Ligand2) | –9.40 | Gly439(2.15), Ser441(2.15), His296(2.61) | Pro301(3.47), Val280(3.48), Leu302(3.51), Glu299(3.70), Val280(3.80), Leu302(3.80), Thr459(3.87) |
| ZINC64606047 (Ligand1) | –9.00 | Val280(2.95), Ser441(2.88), Gly439(3.25), Val280(3.52) | Val280(3.39), Thr459(3.63), Gln280(3.75), Val278(3.92) |
| Nafamostat | –8.30 | Gly464(1.95), Asp435(3.02), Ser441(3.13), Val473(3.29) | Thr459(3.75), Gln280(3.97) |
| Camostat | –7.50 | Ser436(2.35), Gln438(2.48) Ser436(3.02), Ser436(3.45), | Gln438(3.71) |
| Ruxolitinib | –7.10 | Gly464(2.06), Ser441(2.13), His296(3.04), Ser441(3.06), Gln438(3.26), Gly464(3.49), Gly462(3.61) | Val280(3.62) |
| Baricitinib | –7.00 | Gly464(2.03), Ser441(2.16), Gln438(2.69), His296(2.90), Gly464(3.34) | Val280(3.74) |
| Pefabloc | –5.50 | Ser436(2.17), Ser436(3.68) | Gln438(3.75) |
| Phenylmethyl sulfonyl fluoride | –4.70 | -- | Thr459(3.47) |
Figure 7.
Hydrogen bonding and hydrophobic interactions of ZINC05296775 with TMPRSS2. 2D (A) and 3D (B) representations of its interactions and binding pose within TMPRSS2 binding site.
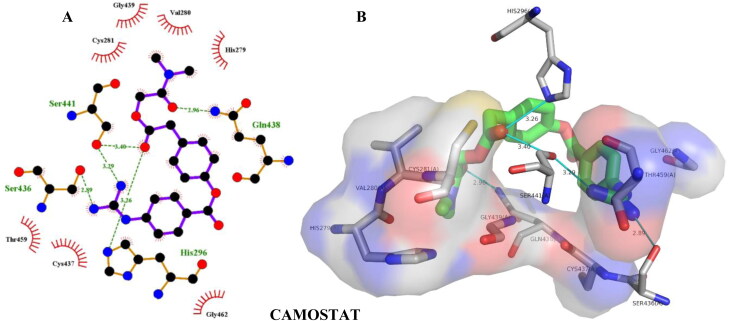
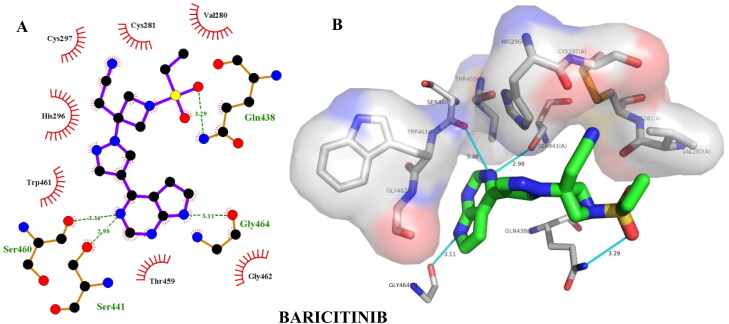
With AutoDock Vina, Nafamostat, Camostat, Baricitinib, Ruxolotinib, Pefabloa, and Phenylmethylsulfonyl fluoride on the other hand gave binding energies of –8.20, –7.20, –6.90, –6.70, –5.60 and –5.00 kcal/mol, respectively, as shown in Figures 8–13, which were all lower than those of LIGAND1 and LIGAND2. The scores of the reference drugs were adequately validated by the results of blind docking done using BINDSURF with binding energies of –8.30, –7.50, –7.00, –7.10, 5.50 and 4.70 kcal/mol, respectively. The interacted residues were equally similar in both docking exercises (Tables 3 and 4). Although the reference drugs also made hydrogen bonds with TMPRSS2, but unlike LIGAND1 and LIGAND2, they generally made far lesser hydrophobic interaction with residues of TMPRSS2 binding pocket. In addition to their strong hydrogen bonding engagements with TMPRSS2, the additional interactions of the lead compounds could account for their higher binding affinities as shown by the docking results.
Figure 8.
Hydrogen bonding and hydrophobic interactions of nafamostat with TMPRSS2. Two-dimensional (2D) (A) and 3D (B) representations of its interactions and binding pose within TMPRSS2 binding site.
Figure 9.
Hydrogen bonding and hydrophobic interactions of camostat with TMPRSS2. Two-dimensional (2D) (A) and 3D (B) representations of its interactions and binding pose within TMPRSS2 binding site.
Figure 10.
Hydrogen bonding and hydrophobic interactions of baricitinib with TMPRSS2. Two-dimensional (2D) (A) and 3D (B) representations of its interactions and binding pose within TMPRSS2 binding site.
Figure 11.
Hydrogen bonding and hydrophobic interactions of ruxolitinib with TMPRSS2. Two-dimensional (2D) (A) and 3D (B) representations of its interactions and binding pose within TMPRSS2 binding site.
Figure 12.
Hydrogen bonding and hydrophobic interactions of pefabloc with TMPRSS2. Two-dimensional (2D) (A) and 3D (B) representations of its interactions and binding pose within TMPRSS2 binding site.
Figure 13.
Hydrogen bonding and hydrophobic interactions of phenylmethylsulfonyl fluoride with TMPRSS2. Two-dimensional (2D) (A) and 3D (B) representations of its interactions and binding pose within TMPRSS2 binding site.
3.6. Molecular dynamics simulations and structural analyses
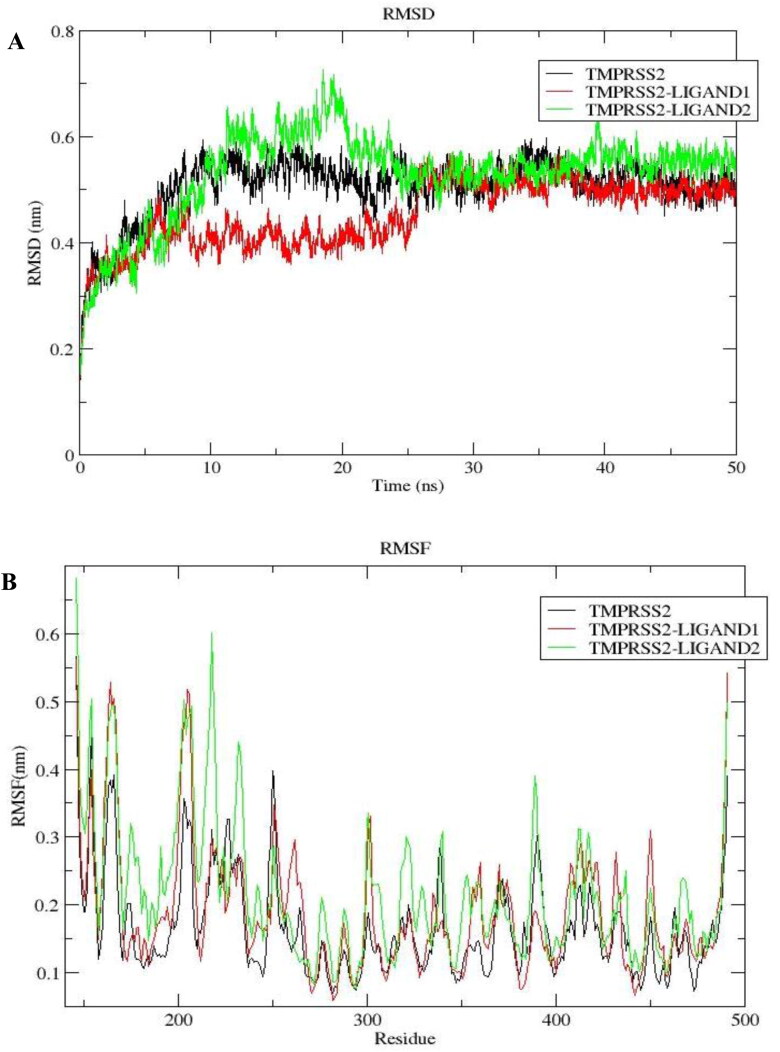
The structural stability of the complexes was assessed using the RMSD of the backbone atoms relative to the protein. The RMSD describes the measure of the changes in the conformation of a given structure over time. The complexes underwent conformational fluctuation at different RMSD levels before 25 ns, but they equilibrated afterward with the TMPRSS2 (apo protein). Both complexes of LIGAND1 and LIGAND2, after equilibration at 25 ns, maintained an overall similar pattern of trajectory until the end of the simulation time (Figure 14(A)).
Figure 14.
Dynamics of LIGAND1 and LIGAND2 binding to TMPRSS2. (A) Root mean square deviation plot as a function of simulation time. (B) Root mean square fluctuation of the residues.
The dynamic behavior of TMPRSS2-LIGAND1 showed a minimum, maximum, and average RMSD of 0.098 nm, 0.568 nm, and 0.452 ± 0.068 nm, respectively. The trajectory of TMPRSS2-LIGAND1 attained stability at 37 ns and remained stable till the end of the simulation time with nearly no structural deviations from the unbound TMPRSS2 as shown in Figure 14(A). Likewise, the trajectory pattern of TMPRSS2-LIGAND2 gave a minimum, maximum, and average RMSD of 0.112 nm, 0.727 nm and 0.5277 ± 0.088 nm, respectively. The maximum deviation was before equilibration at 25 ns. It became stable before 40 ns, and maintained the stability for the last 12 ns of the simulation time with a slight conformational deviation of 0.05 nm from the apo TMPRSS2, albeit with similar trajectory pattern with TMPRSS2-LIGAND1. This shows that the ligand maintained stable binding with the receptor before the end of the simulation time.
3.6.1. Root mean square fluctuation analysis
RMSF analysis of the complexes in relation to apo TMPRSS2 was done in order to compare the dynamics of the individual residues of the protein backbone. Regions of the protein with great flexibility had high RMSF. The loop regions being the most flexible part of the protein had the greatest fluctuations. The other regions that had less fluctuation are the constrained residues regions, where the ligands bound. The minimum, maximum, and average RMSF fluctuation of the TMPRSS2-LIGAND1 were 0.06, 0.562, and 0.187 ± 0.097 nm, respectively and that of TMPRSS2-LIGAND2 were 0.078, 0.680 and 0.206 ± 0.107 nm, respectively, showing appreciably low residual fluctuations.
TMPRSS2-LIGAND2 had overall higher fluctuations than TMPRSS2-LIGAND1. RMS fluctuations of TMPRSS2-LIGAND1 at the active site residue positions 296, 345 and 441 as well as the substrate binding sites 435, 460 and 462 were lower (with very low RMSF values of ≤0.10 nm) than that of the unbound TMPRSS2. Similarly, for TMPRSS2-LIGAND2 complex, RMSF values at these positions (≤0.15 nm) were either lower than or equal to those of apo TMPRSS2. These show that the binding of the ligands to TMPRSS2 at the active site conferred structural stability on the complex. However, the relatively higher residual fluctuation was observed at the N-terminal, while the fluctuation decreased towards the C-terminal region of the protein (Figure 14(B)) where the catalytic and active sites residues are located (Table 2).
3.6.2. Radius of gyration
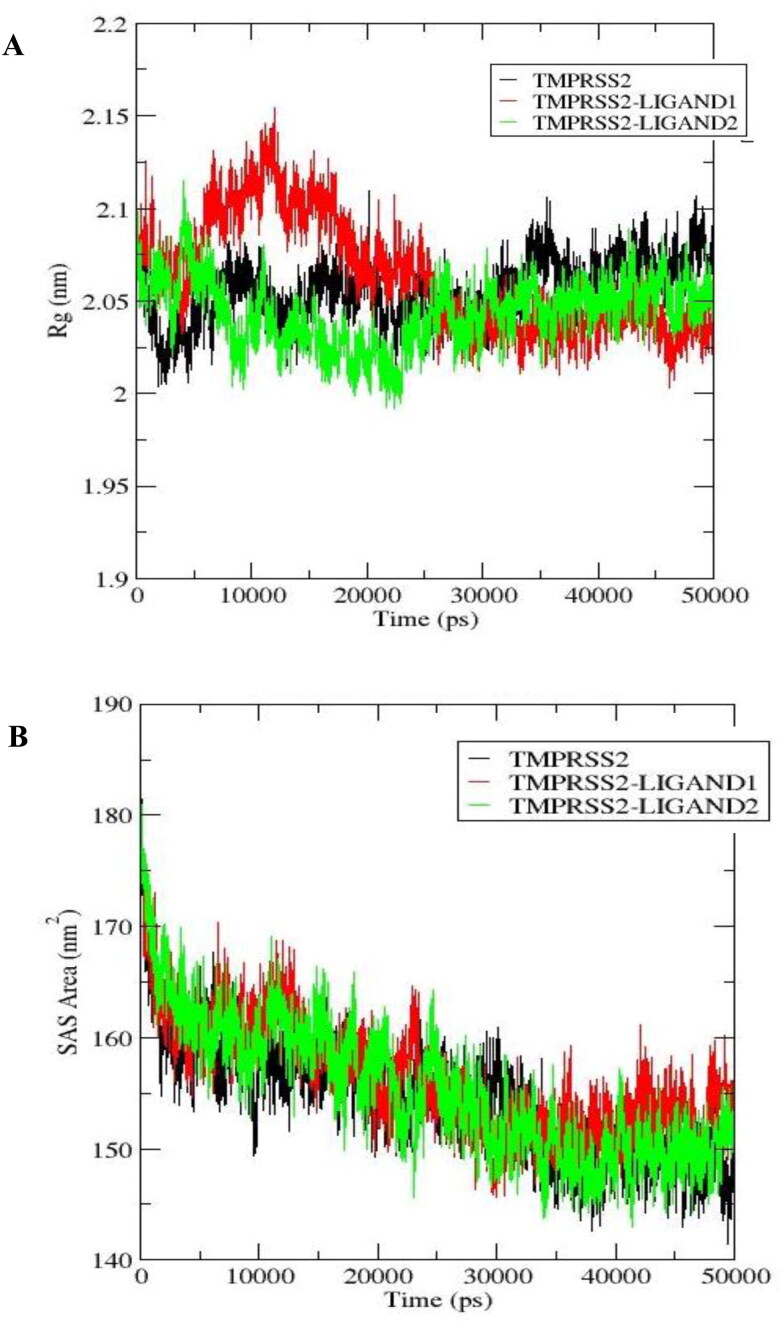
The stability of a protein in a biological system can also be evaluated using analysis of the radius of gyration (Rg), which describes the compactness of the protein. The complexes demonstrated higher Rg deviations than apo TMPRSS2 at the beginning of the simulation up to about 25 ns. However, the radii of gyration of TMPRSS2-LIGAND1 and TMPRSS2-LIGAND2 complexes became lower and more stable (at 2.03 and 2.05 nm, respectively) than that of the unbound TMPRSS2 after 25 ns till the end of the simulation time, whereas that of the unbound TMPRSS2 continued to fluctuate increasingly up to 2.10 nm (Figure 15(A)). The minimum, maximum, and average Rg were 2.000, 2.154 and 2.063 ± 0.03 nm, respectively for TMPRSS2-LIGAND1, and for TMPRSS2-LIGAND2, they were 1.992, 2.115 and 2.032 ± 0.150 nm, respectively. This further shows that the protein gained more stability upon the binding of the ligands.
Figure 15.
Time-dependent analysis of molecular dynamics trajectory. (A) Radius of gyration plot as a function of simulation time. (B) Solvent accessible surface area plot as a function of simulation time.
3.6.3. Solvent-accessible surface area
The solvent-accessible surface area (SASA) was evaluated to characterize the regions of TMPRSS2 that are accessible to solvent molecules. The apo TMPRSS2 and its ligand-bound complexes maintained comparable SASA patterns throughout the simulation time (Figure 15(B)). TMPRSS2-LIGAND1 maintained 145.651, 184.292, and 155 ± 11.974 nm2 as the minimum, maximum and the average SASA, respectively. The minimum, maximum and average SASA for TMPRSS2-LIGAND2 were 142.984, 183.877 and 154.596 ± 6.213nm2, respectively. The patterns of SASA changes over the 50-ns simulation time for the complexes were similar to that of the apo TMPRSS2.
3.6.4. Hydrogen bond analysis
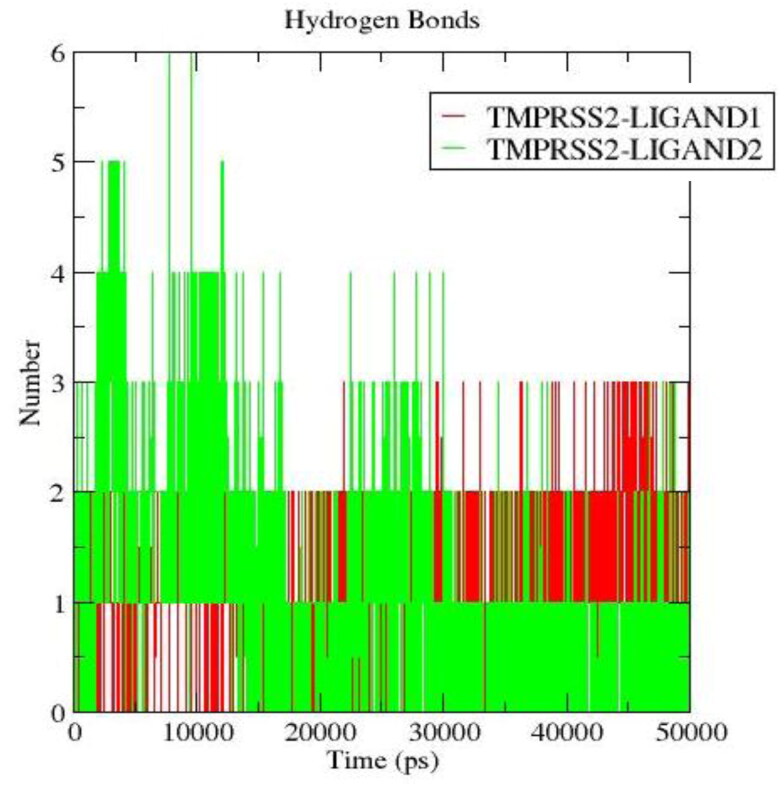
The stability of the TMPRSS2 complexes is maintained by several interactions which include electrostatic, hydrogen bonds, hydrophobic interactions, etc. Analyses showed that hydrogen bonds had a significant impact on the binding of LIGAND1 and LIGAND2 to TMPRSS2. The average number of hydrogen bonds observed for TMPRSS2-LIGAND1 and TMPRSS2-LIGAND2 were evaluated. Three hydrogen bonds were predominantly formed in the TMPRSS2-LIGAND1 throughout the simulation. The hydrogen bonds of TMPRSS2-LIGAND2 complex reduced from 5 to 3 towards the end of the simulation (Figure 16).
Figure 16.
Hydrogen bonding analysis of TMPRSS2-LIGAND1 and TMPRSS2-LIGAND2 complexes.
Hydrogen bonding occupancy was also calculated for the complexes using their trajectories. Gly391, His296, Ser339, Ser441 of TMPRSS2 were the key residues taking part in hydrogen bonding interaction with LIGAND1 and possessed individual occupancy of 6.5%, 8.4%, 12.6%, 81.4%, respectively. The TMPRSS2-LIGAND2 key residues forming the hydrogen bonding include His296, Gln438, Gly439, Lys340, Ser441, Val280 with occupancy of 2.96%, 3.8%, 6.4%, 10%, 24.9%, 27.8%, respectively. This is highly consistent with the protein-ligand analyses of both Vina- and BINDSURF-generated docking results (Tables 3 and 4) as residues His296 and Ser441 in particular were established to be involved in hydrogen bonding with LIGAND1 (Figures 6); and residues His296, Gly439 and Ser441 in particular with LIGAND2 (Figure 7). In addition, the higher percentage occupancy of Ser441 than other residues observed for both ligands suggests that it is the residue most involved in hydrogen bonding with the ligands, and this is further corroborated by its hydrogen bond distance being the shortest for both ligands as shown in Tables 3 and 4. Importantly, Ser441 and His296 are part of TMPRSS2 catalytic triad, and interaction of the ligands with them is expected to abolish or at least disrupt catalysis.
3.6.5. Principal component analysis
The principal component analysis (PCA) was used to investigate the significant motions during the binding of the ligands to protein. In this study, the eigenvectors were calculated by diagonalization of the matrix. The decreasing order of the eigenvalue against the corresponding eigenvector for both complexes is represented in Figure 17(A). The eigenvalues represent the collective motion of particles, where the values of the vectors show how often the corresponding atom participated in the motion. The first 10 eigenvectors from the 50 eigenvectors selected for calculation accounted for 96.20% and 98.55% for TMPRSS2-LIGAND1 and TMPRSS2-LIGAND2, respectively.
Figure 17.
Principal component analysis. (A) Plot of eigenvalues against first 50 eigenvector index. (B) Projection of the protein motion in phase space along PC1 and PC2 for TMPRSS2-LIGAND1. (C) Projection of the protein motion in phase space along PC1 and PC2 for TMPRSS2-LIGAND2.
The dynamics of the system were also assessed using a two-dimensional projection of PCA (PC1 and PC2) for the prediction of motions in the complexes. PC1 is denoted as the most significant and it accounts for the maximum variability in terms of internal motion of proteins while PC2 accounts for the remaining variability (Pandey et al., 2019). From the 2D projection, a complex with stable cluster occupying less phase space represents a stable complex, and the complex that shows a non-stable cluster and occupies more space represents a less stable complex. Both TMPRSS2-LIGAND1 and TMPRSS2-LIGAND2 occupied small phase spaces, but TMPRSS2-LIGAND2 occupied more space and has a wide cluster as compared to the TMPRSS2-LIGAND1.
3.7. Calculation of binding and contribution energies using MMPBSA
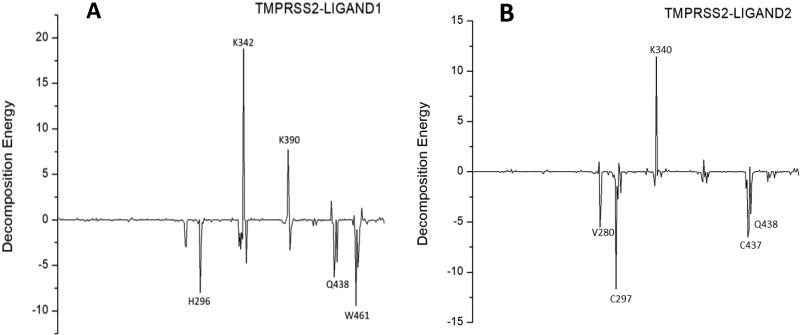
The binding energies of the complexes and their individual components obtained from the MMPBSA calculations are shown in Table 5. For each of the two complexes, negative overall binding energies were obtained indicating spontaneity of their binding. The individual component of the two complexes possessed negative energies except for the polar solvation energies. The relative binding energies of the two complexes showed there was a strong binding of the ligands to TMPRSS2. Key residues contributing to the binding free energies of LIGAND1 and LIGAND2 to TMPRSS2 were analyzed. The average contributing energies of the residues to the binding energies of the two complexes are shown in Figure 18. In TMPRSS2-LIGAND1, the main contributing energies were from Trp461, His296, Gln438, Ser463, Asp435, Lys342, Lys390 having –9.45, –8.03, –6.29, –5.24, –4.74, 18.82 and 7.71 kJ/mol, respectively. While in TMPRSS2-LIGAND2, the main energy-contributing residues included Cys297, Cys437, Gln438, Val280, Lys340 and Lys390 having –11.69, –6.52, –5.88, –5.49, 11.45 kJ/mol, respectively.
Table 5.
Summary of the energy component of the complexes in kJ/mol. VdW — Van der Waal Energy, ELECTROSTATIC — Electrostatic Energy, PSE — Polar Solvation Energy, SASA — Solvent Accessible Surface Area Energy.
| Complexes | VdW | Electrostatic | PSE | SASA | Binding energy |
|---|---|---|---|---|---|
| TMPRSS2-LIGAND1 | –284.56 ± 10.57 | –15.16 ± 7.36 | 130.11 ± 15.65 | –21.14 ± 1.04 | –190.75 ± 16.39 |
| TMPRSS2-LIGAND2 | –192.16 ± 12.25 | –13.63 ± 7.01 | 81.81 ± 13.01 | –16.19 ± 1.07 | –140.16 ± 14.93 |
Figure 18.
Contribution energies of TMPRSS2 residues involved in (A) TMPRSS2-LIGAND1, and (B) TMPRSS2-LIGAND2 complexes.
4. Conclusion
Computationally, we have identified two commercially available druglike compounds (ZINC64606047 and ZINC05296775) against TMPRSS2 using a pharmacophore model of experimentally tested drugs, a homology model and molecular docking. The compounds were analyzed and predicted to have satisfactory ADME, physicochemical and medicinal Chemistry properties. Further studies using molecular dynamics simulations and subsequent analyses showed that the two compounds possess good stability and dynamics within the TMPRSS2 active site. The results of this study showed that the compounds demonstrated to be good leads with potential of being inhibitor drugs against TMPRSS2 that could be optimized for tests against SARS-CoV-2. However, further experimental studies are required to better assess these compounds.
Disclosure statement
Authors declare no conflict of interest.
References
- Akutsu, T., & Halldórsson, M. M. (2000). On the approximation of largest common subtrees and largest common point sets. Theoretical Computer Science, 233(1–2), 33–50. 10.1016/S0304-3975(97)00278-8 [DOI] [Google Scholar]
- Baell, J. B., Ferrins, L., Falk, H., & Nikolakopoulos, G. (2013). PAINS: Relevance to tool compound discovery and fragment-based screening. Australian Journal of Chemistry, 66(12), 1483–1494. 10.1071/CH13551 [DOI] [Google Scholar]
- Benkert, P., Biasini, M., & Schwede, T. (2011). Toward the estimation of the absolute quality of individual protein structure models. Bioinformatics (Oxford, England), 27(3), 343–350. 10.1093/bioinformatics/btq662 [DOI] [PMC free article] [PubMed] [Google Scholar]
- Bhattacharya, D., Nowotny, J., Cao, R., & Cheng, J. (2016). 3Drefine: An interactive web server for efficient protein structure refinement. Nucleic Acids Research, 44(W1), W406–W409. 10.1093/nar/gkw336 [DOI] [PMC free article] [PubMed] [Google Scholar]
- Biasini, M., Bienert, S., Waterhouse, A., Arnold, K., Studer, G., Schmidt, T., Kiefer, F., Gallo Cassarino, T., Bertoni, M., Bordoli, L., & Schwede, T. (2014). SWISS-MODEL: Modelling protein tertiary and quaternary structure using evolutionary information. Nucleic Acids Research, 42(Web Server issue), W252–W258. 10.1093/nar/gku340 [DOI] [PMC free article] [PubMed] [Google Scholar]
- Brenk, R., Schipani, A., James, D., Krasowski, A., Gilbert, I. H., Frearson, J., & Wyatt, P. G. (2008). Lessons learnt from assembling screening libraries for drug discovery for neglected diseases. ChemMedChem, 3(3), 435–444. 10.1002/cmdc.200700139 [DOI] [PMC free article] [PubMed] [Google Scholar]
- Camacho, C., Coulouris, G., Avagyan, V., Ma, N., Papadopoulos, J., Bealer, K., & Madden, T. L. (2009). BLAST+: Architecture and applications. BMC Bioinformatics, 10, 421. 10.1186/1471-2105-10-421 [DOI] [PMC free article] [PubMed] [Google Scholar]
- Cereto-Massagué, A., Ojeda, M. J., Valls, C., Mulero, M., Garcia-Vallvé, S., & Pujadas, G. (2015). Molecular fingerprint similarity search in virtual screening. Methods (San Diego, California), 71, 58–63. 10.1016/j.ymeth.2014.08.005 [DOI] [PubMed] [Google Scholar]
- Clark, D. E. (2008). What has virtual screening ever done for drug discovery? Expert Opinion on Drug Discovery, 3(8), 841–851. 10.1517/17460441.3.8.841 [DOI] [PubMed] [Google Scholar]
- Colovos, C., & Yeates, T. O. (1993). Verification of protein structures: Patterns of nonbonded atomic interactions. Protein Science : a Publication of the Protein Society, 2(9), 1511–1519. 10.1002/pro.5560020916 [DOI] [PMC free article] [PubMed] [Google Scholar]
- Daina, A., Michielin, O., & Zoete, V. (2017). SwissADME: A free web tool to evaluate pharmacokinetics, drug-likeness and medicinal chemistry friendliness of small molecules. Scientific Reports, 7, 42717. 10.1038/srep42717 [DOI] [PMC free article] [PubMed] [Google Scholar]
- Dallakyan, S., & Olson, A. J. (2015). Small-molecule library screening by docking with PyRx . Methods in Molecular Biology, 1263, 243–250. 10.1007/978-1-4939-2269-7_19 [DOI] [PubMed] [Google Scholar]
- DeLano, W. (2002). The PyMOL molecular graphics system. DeLano Scientific. [Google Scholar]
- Egan, W. J. (2010). Predicting ADME properties in drug discovery. In K. M. Merz, D. Ringe, & C.H. Reynolds (Eds.), Drug Design: Structure-and Ligand-Based Approaches, (pp. 165–177). New York, USA: Cambridge University Press. [Google Scholar]
- Elfiky, A., & Ibrahim, N. S. (2020). Anti-SARS and anti-HCV drugs repurposing against the Papain-like protease of the newly emerged coronavirus (2019-nCoV). Preprint from Research Square, PPR124220. 10.21203/rs.2.23280/v1. [DOI]
- Ghose, A. K., Herbertz, T., Hudkins, R. L., Dorsey, B. D., & Mallamo, J. P. (2012). Knowledge-based, central nervous system (CNS) lead selection and lead optimization for CNS drug discovery. ACS Chemical Neuroscience, 3(1), 50–68. 10.1021/cn200100h [DOI] [PMC free article] [PubMed] [Google Scholar]
- Gierer, S., Bertram, S., Kaup, F., Wrensch, F., Heurich, A., Krämer-Kühl, A., Welsch, K., Winkler, M., Meyer, B., Drosten, C., Dittmer, U., von Hahn, T., Simmons, G., Hofmann, H., & Pöhlmann, S. (2013). The spike protein of the emerging betacoronavirus EMC uses a novel coronavirus receptor for entry, can be activated by TMPRSS2, and is targeted by neutralizing antibodies. Journal of Virology, 87(10), 5502–5511. 10.1128/JVI.00128-13 [DOI] [PMC free article] [PubMed] [Google Scholar]
- Glowacka, I., Bertram, S., Müller, M. A., Allen, P., Soilleux, E., Pfefferle, S., Steffen, I., Tsegaye, T. S., He, Y., Gnirss, K., Niemeyer, D., Schneider, H., Drosten, C., & Pöhlmann, S. (2011). Evidence that TMPRSS2 activates the severe acute respiratory syndrome coronavirus spike protein for membrane fusion and reduces viral control by the humoral immune response. Journal of Virology, 85(9), 4122–4134. 10.1128/JVI.02232-10 [DOI] [PMC free article] [PubMed] [Google Scholar]
- Gns, H. S., Gr, S., Murahari, M., & Krishnamurthy, M. (2019). An update on drug repurposing: Re-written saga of the drug's fate. Biomedicine & Pharmacotherapy = Biomedecine & Pharmacotherapie, 110, 700–716. 10.1016/j.biopha.2018.11.127 [DOI] [PubMed] [Google Scholar]
- Güner, O. F. (2000). Pharmacophore perception, development, and use in drug design (Vol. 2). Internat'l University Line. [Google Scholar]
- Han, Y., & Král, P. (2020). Computational design of ACE2-based peptide inhibitors of SARS-CoV-2. ACS Nano, 14(4), 5143–5147. 10.1021/acsnano.0c02857 [DOI] [PMC free article] [PubMed] [Google Scholar]
- Heo, L., Park, H., & Seok, C. (2013). GalaxyRefine: Protein structure refinement driven by side-chain repacking. Nucleic Acids Research, 41(Web Server issue), W384–388. 10.1093/nar/gkt458 [DOI] [PMC free article] [PubMed] [Google Scholar]
- Heurich, A., Hofmann-Winkler, H., Gierer, S., Liepold, T., Jahn, O., & Pöhlmann, S. (2014). TMPRSS2 and ADAM17 cleave ACE2 differentially and only proteolysis by TMPRSS2 augments entry driven by the severe acute respiratory syndrome coronavirus spike protein. Journal of Virology, 88(2), 1293–1307. 10.1128/JVI.02202-13 [DOI] [PMC free article] [PubMed] [Google Scholar]
- Hoffmann, M., Kleine-Weber, H., Schroeder, S., Krüger, N., Herrler, T., Erichsen, S., Schiergens, T. S., Herrler, G., Wu, N.-H., Nitsche, A., Müller, M. A., Drosten, C., & Pöhlmann, S. (2020). SARS-CoV-2 cell entry depends on ACE2 and TMPRSS2 and is blocked by a clinically proven protease inhibitor. Cell, 181(2), 271–280.e278. 10.1016/j.cell.2020.02.052 [DOI] [PMC free article] [PubMed] [Google Scholar]
- Humphrey, W., Dalke, A., & Schulten, K. (1996). VMD: Visual molecular dynamics. Journal of Molecular Graphics, 14(1), 33–38. 10.1016/0263-7855(96)00018-5 [DOI] [PubMed] [Google Scholar]
- Inbar, Y., Schneidman-Duhovny, D., Dror, O., Nussinov, R., & Wolfson, H. J. (2007, April). Deterministic pharmacophore detection via multiple flexible alignment of drug-like molecules. Paper presented at the Annual International Conference on Research in Computational Molecular Biology (RECOMB), Oakland, CA. [DOI] [PMC free article] [PubMed] [Google Scholar]
- Iwata-Yoshikawa, N., Okamura, T., Shimizu, Y., Hasegawa, H., Takeda, M., & Nagata, N. (2019). TMPRSS2 contributes to virus spread and immunopathology in the airways of murine models after coronavirus infection. Journal of Virology, 93(6), e01815. 10.1128/JVI.01815-18 [DOI] [PMC free article] [PubMed] [Google Scholar]
- Jin, Z., Du, X., Xu, Y., Deng, Y., Liu, M., Zhao, Y., Zhang, B., Li, X., Zhang, L., Peng, C., Duan, Y., Yu, J., Wang, L., Yang, K., Liu, F., Jiang, R., Yang, X., You, T., Liu, X., … Yang, H. (2020). Structure of Mpro from COVID-19 virus and discovery of its inhibitors. Nature, 582(7811), 289–293. 10.1038/s41586-020-2223-y [DOI] [PubMed] [Google Scholar]
- Kaeppler, U., Stiefl, N., Schiller, M., Vicik, R., Breuning, A., Schmitz, W., Rupprecht, D., Schmuck, C., Baumann, K., Ziebuhr, J., & Schirmeister, T. (2005). A new lead for nonpeptidic active-site-directed inhibitors of the severe acute respiratory syndrome coronavirus main protease discovered by a combination of screening and docking methods. Journal of Medicinal Chemistry, 48(22), 6832–6842. 10.1021/jm0501782 [DOI] [PubMed] [Google Scholar]
- Kim, T. S., Heinlein, C., Hackman, R. C., & Nelson, P. S. (2006). Phenotypic analysis of mice lacking the TMPRSS2-encoded protease. Molecular and Cellular Biology, 26(3), 965–975. 10.1128/MCB.26.3.965-975.2006 [DOI] [PMC free article] [PubMed] [Google Scholar]
- Koes, D. R., & Camacho, C. J. (2011). Pharmer: Efficient and exact pharmacophore search. Journal of Chemical Information and Modeling, 51(6), 1307–1314. 10.1021/ci200097m [DOI] [PMC free article] [PubMed] [Google Scholar]
- Koes, D. R., & Camacho, C. J. (2012). ZINCPharmer: Pharmacophore search of the ZINC database. Nucleic Acids Research, 40(Web Server issue), W409–W414. 10.1093/nar/gks378 [DOI] [PMC free article] [PubMed] [Google Scholar]
- Kumar, A., & Zhang, K. Y. (2015). Hierarchical virtual screening approaches in small molecule drug discovery. Methods (San Diego, California), 71, 26–37. 10.1016/j.ymeth.2014.07.007 [DOI] [PMC free article] [PubMed] [Google Scholar]
- Kumari, R., Kumar, R., Consortium, O. S. D. D., & Lynn, A, Open Source Drug Discovery Consortium. (2014). g_mmpbsa-A GROMACS tool for high-throughput MM-PBSA calculations. Journal of Chemical Information and Modeling, 54(7), 1951–1962. 10.1021/ci500020m [DOI] [PubMed] [Google Scholar]
- Laskowski, R. A., MacArthur, M. W., Moss, D. S., & Thornton, J. M. (1993). PROCHECK: A program to check the stereochemical quality of protein structures. Journal of Applied Crystallography, 26(2), 283–291. 10.1107/S0021889892009944 [DOI] [Google Scholar]
- Laskowski, R. A., & Swindells, M. B. (2011). LigPlot+: Multiple ligand–protein interaction diagrams for drug discovery. ACS Publications. [DOI] [PubMed] [Google Scholar]
- Lemkul, J. (2019). From proteins to perturbed Hamiltonians: A suite of tutorials for the GROMACS-2018 molecular simulation package [article v1. 0. Living Journal of Computational Molecular Science, 1(1), 5068. 10.33011/livecoms.1.1.5068 [DOI] [Google Scholar]
- Li, G., & De Clercq, E. (2020). Therapeutic options for the 2019 novel coronavirus (2019-nCoV). Nature Reviews. Drug Discovery, 19(3), 149–150. 10.1038/d41573-020-00016-0 [DOI] [PubMed] [Google Scholar]
- Li, W., Moore, M. J., Vasilieva, N., Sui, J., Wong, S. K., Berne, M. A., Somasundaran, M., Sullivan, J. L., Luzuriaga, K., Greenough, T. C., Choe, H., & Farzan, M. (2003). Angiotensin-converting enzyme 2 is a functional receptor for the SARS coronavirus. Nature, 426(6965), 450–454. 10.1038/nature02145 [DOI] [PMC free article] [PubMed] [Google Scholar]
- Lipinski, C. (2002). Poor aqueous solubility—An industry wide problem in drug discovery. American Pharmaceutical Review, 5(3), 82–85. [Google Scholar]
- Maass, P., Schulz-Gasch, T., Stahl, M., & Rarey, M. (2007). Recore: A fast and versatile method for scaffold hopping based on small molecule crystal structure conformations. Journal of Chemical Information and Modeling, 47(2), 390–399. 10.1021/ci060094h [DOI] [PubMed] [Google Scholar]
- Marchler-Bauer, A., Bo, Y., Han, L., He, J., Lanczycki, C. J., Lu, S., Chitsaz, F., Derbyshire, M. K., Geer, R. C., Gonzales, N. R., Gwadz, M., Hurwitz, D. I., Lu, F., Marchler, G. H., Song, J. S., Thanki, N., Wang, Z., Yamashita, R. A., Zhang, D., … Bryant, S. H. (2017). CDD/SPARCLE: Functional classification of proteins via subfamily domain architectures. Nucleic Acids Research, 45(D1), D200–D203. 10.1093/nar/gkw1129 [DOI] [PMC free article] [PubMed] [Google Scholar]
- Matsuyama, S., Nagata, N., Shirato, K., Kawase, M., Takeda, M., & Taguchi, F. (2010). Efficient activation of the severe acute respiratory syndrome coronavirus spike protein by the transmembrane protease TMPRSS2. Journal of Virology, 84(24), 12658–12664. 10.1128/JVI.01542-10 [DOI] [PMC free article] [PubMed] [Google Scholar]
- Muegge, I. (2002). Pharmacophore features of potential drugs. Chemistry - A European Journal, 8(9), 1976–1981. [DOI] [PubMed] [Google Scholar]
- Niu, C., Yin, J., Zhang, J., Vederas, J. C., & James, M. N. (2008). Molecular docking identifies the binding of 3-chloropyridine moieties specifically to the S1 pocket of SARS-CoV Mpro. Bioorganic & Medicinal Chemistry, 16(1), 293–302. 10.1016/j.bmc.2007.09.034 [DOI] [PMC free article] [PubMed] [Google Scholar]
- O'Boyle, N. M., Banck, M., James, C. A., Morley, C., Vandermeersch, T., & Hutchison, G. R. (2011). Open Babel: An open chemical toolbox. Journal of Cheminformatics, 3(1), 33. 10.1186/1758-2946-3-33 [DOI] [PMC free article] [PubMed] [Google Scholar]
- Oprea, T. I., Bauman, J. E., Bologa, C. G., Buranda, T., Chigaev, A., Edwards, B. S., Jarvik, J. W., Gresham, H. D., Haynes, M. K., Hjelle, B., Hromas, R., Hudson, L., Mackenzie, D. A., Muller, C. Y., Reed, J. C., Simons, P. C., Smagley, Y., Strouse, J., Surviladze, Z., … Sklar, L. A. (2011). Drug repurposing from an academic perspective. Drug Discovery Today Therapeutic Strategies, 8(3–4), 61–69. 10.1016/j.ddstr.2011.10.002 [DOI] [PMC free article] [PubMed] [Google Scholar]
- OriginLab. (2018). Origin, (version 2018)[computer software]. OriginLab Corporation Northampton. [Google Scholar]
- Pandey, B., Grover, S., Kaur, J., & Grover, A. (2019). Analysis of mutations leading to para-aminosalicylic acid resistance in Mycobacterium tuberculosis. Scientific Reports, 9(1), 1–15. 10.1038/s41598-019-48940-5 [DOI] [PMC free article] [PubMed] [Google Scholar]
- Pollastri, M. P. (2010). Overview on the rule of five. Current Protocols in Pharmacology, 49(1), 12–11. 10.1002/0471141755.ph0912s49 [DOI] [PubMed] [Google Scholar]
- Rao, K. N., Anita, R. C., Sangeetha, R., Anirudha, L., & Subramnay, H. (2016). Crystal structure of serine protease hepsin in complex with inhibitor. To be published. RCSB PDB. Deposited: 2015-07-06. Released: 2016-07-06. https://doi.org/10.2210/pdb5CE1/pdb. [Google Scholar]
- Remmert, M., Biegert, A., Hauser, A., & Söding, J. (2011). HHblits: Lightning-fast iterative protein sequence searching by HMM-HMM alignment. Nature Methods, 9(2), 173–175. 10.1038/nmeth.1818 [DOI] [PubMed] [Google Scholar]
- Robson, B. (2020). COVID-19 Coronavirus spike protein analysis for synthetic vaccines, a peptidomimetic antagonist, and therapeutic drugs, and analysis of a proposed achilles’ heel conserved region to minimize probability of escape mutations and drug resistance. Computers in Biology and Medicine, 121, 103749. 10.1016/j.compbiomed.2020.103749 [DOI] [PMC free article] [PubMed] [Google Scholar]
- Salentin, S., Schreiber, S., Haupt, V. J., Adasme, M. F., & Schroeder, M. (2015). PLIP: Fully automated protein-ligand interaction profiler. Nucleic Acids Research, 43(W1), W443–W447. 10.1093/nar/gkv315 [DOI] [PMC free article] [PubMed] [Google Scholar]
- Sánchez-Linares, I., Pérez-Sánchez, H., Cecilia, J. M., & García, J. M. (2012). High-throughput parallel blind virtual screening using BINDSURF. BMC Bioinformatics, 13(Suppl 14), S13. 10.1186/1471-2105-13-S14-S13 [DOI] [PMC free article] [PubMed] [Google Scholar]
- Schneidman-Duhovny, D., Dror, O., Inbar, Y., Nussinov, R., & Wolfson, H. J. (2008). PharmaGist: A webserver for ligand-based pharmacophore detection. Nucleic Acids Research, 36(Web Server issue), W223–W228. 10.1093/nar/gkn187 [DOI] [PMC free article] [PubMed] [Google Scholar]
- Schüttelkopf, A. W., & Van Aalten, D. M. (2004). PRODRG: A tool for high-throughput crystallography of protein–ligand complexes. Acta Crystallographica Section D Biological Crystallography, 60(8), 1355–1363. 10.1107/S0907444904011679 [DOI] [PubMed] [Google Scholar]
- Shatsky, M., Shulman-Peleg, A., Nussinov, R., & Wolfson, H. J. (2006). The multiple common point set problem and its application to molecule binding pattern detection. Journal of Computational Biology: A Journal of Computational Molecular Cell Biology, 13(2), 407–428. 10.1089/cmb.2006.13.407 [DOI] [PubMed] [Google Scholar]
- Sheahan, T. P., Sims, A. C., Zhou, S., Graham, R. L., Pruijssers, A. J., Agostini, M. L., Leist, S. R., Schäfer, A., Dinnon, K. H., Stevens, L. J., Chappell, J. D., Lu, X., Hughes, T. M., George, A. S., Hill, C. S., Montgomery, S. A., Brown, A. J., Bluemling, G. R., Natchus, M. G., … Baric, R. S. (2020). An orally bioavailable broad-spectrum antiviral inhibits SARS-CoV-2 in human airway epithelial cell cultures and multiple coronaviruses in mice. Science Translational Medicine, 12(541), eabb5883. 10.1126/scitranslmed.abb5883 [DOI] [PMC free article] [PubMed] [Google Scholar]
- Shulla, A., Heald-Sargent, T., Subramanya, G., Zhao, J., Perlman, S., & Gallagher, T. (2011). A transmembrane serine protease is linked to the severe acute respiratory syndrome coronavirus receptor and activates virus entry. Journal of Virology, 85(2), 873–882. 10.1128/JVI.02062-10 [DOI] [PMC free article] [PubMed] [Google Scholar]
- Trott, O., & Olson, A. J. (2010). AutoDock Vina: Improving the speed and accuracy of docking with a new scoring function, efficient optimization, and multithreading. Journal of Computational Chemistry, 31(2), 455–461. 10.1002/jcc.21334 [DOI] [PMC free article] [PubMed] [Google Scholar]
- Turner, P. (2005). XMGRACE, Version 5.1.25. Center for Coastal and Land-Margin Research, Oregon Graduate Institute of Science and Technology. [Google Scholar]
- Varma, M. V. S., Khandavilli, S., Ashokraj, Y., Jain, A., Dhanikula, A., Sood, A., Thomas, N. S., Pillai, O., Sharma, P., Gandhi, R., Agrawal, S., Nair, V., & Panchagnula, R. (2004). Biopharmaceutic classification system: A scientific framework for pharmacokinetic optimization in drug research. Current Drug Metabolism, 5(5), 375–388. 10.2174/1389200043335423 [DOI] [PubMed] [Google Scholar]
- Vedani, A., Dobler, M., Hu, Z., & Smieško, M. (2015). OpenVirtualToxLab-A platform for generating and exchanging in silico toxicity data. Toxicology Letters, 232(2), 519–532. 10.1016/j.toxlet.2014.09.004 [DOI] [PubMed] [Google Scholar]
- Verschueren, K. H., Pumpor, K., Anemüller, S., Chen, S., Mesters, J. R., & Hilgenfeld, R. (2008). A structural view of the inactivation of the SARS coronavirus main proteinase by benzotriazole esters. Chemistry & Biology, 15(6), 597–606. 10.1016/j.chembiol.2008.04.011 [DOI] [PMC free article] [PubMed] [Google Scholar]
- Wang, C., Horby, P. W., Hayden, F. G., & Gao, G. F. (2020). A novel coronavirus outbreak of global health concern. The Lancet, 395(10223), 470–473. 10.1016/S0140-6736(20)30185-9 [DOI] [PMC free article] [PubMed] [Google Scholar]
- Waterhouse, A., Bertoni, M., Bienert, S., Studer, G., Tauriello, G., Gumienny, R., Heer, F. T., de Beer, T. A. P., Rempfer, C., Bordoli, L., Lepore, R., & Schwede, T. (2018). SWISS-MODEL: Homology modelling of protein structures and complexes. Nucleic Acids Research, 46(W1), W296–W303. 10.1093/nar/gky427 [DOI] [PMC free article] [PubMed] [Google Scholar]
- World Health Organization (WHO). (2020. a). Coronavirus disease 2019 (COVID-19): situation report, 76. WHO. https://www.who.int/docs/default-source/coronaviruse/situation-reports/20200405-sitrep-76-covid-19.pdf?sfvrsn=6ecf0977_4. [Google Scholar]
- World Health Organization (WHO). (2020. b). Coronavirus disease 2019 (COVID-19): situation report, 106. WHO. https://www.who.int/docs/default-source/coronaviruse/situation-reports/20200505covid-19-sitrep-106.pdf?sfvrsn=47090f63_2. [Google Scholar]
- Wiederstein, M., & Sippl, M. J. (2007). ProSA-web: Interactive web service for the recognition of errors in three-dimensional structures of proteins. Nucleic Acids Research, 35(Web Server issue), W407–W410. 10.1093/nar/gkm290 [DOI] [PMC free article] [PubMed] [Google Scholar]
- Wu, Q., Peng, Z., Zhang, Y., & Yang, J. (2018). COACH-D: Improved protein-ligand binding sites prediction with refined ligand-binding poses through molecular docking. Nucleic Acids Research, 46(W1), W438–W442. 10.1093/nar/gky439 [DOI] [PMC free article] [PubMed] [Google Scholar]
- Yamamoto, M., Matsuyama, S., Li, X., Takeda, M., Kawaguchi, Y., Inoue, J-i., & Matsuda, Z. (2016). Identification of nafamostat as a potent inhibitor of middle east respiratory syndrome coronavirus S protein-mediated membrane fusion using the split-protein-based cell-cell fusion assay. Antimicrobial Agents and Chemotherapy, 60(11), 6532–6539. 10.1128/AAC.01043-16 [DOI] [PMC free article] [PubMed] [Google Scholar]
- Yang, J., Roy, A., & Zhang, Y. (2013. a). BioLiP: a semi-manually curated database for biologically relevant ligand-protein interactions. Nucleic Acids Research, 41(Database issue), D1096–D1103. 10.1093/nar/gks966 [DOI] [PMC free article] [PubMed] [Google Scholar]
- Yang, J., Roy, A., & Zhang, Y. (2013. b). Protein-ligand binding site recognition using complementary binding-specific substructure comparison and sequence profile alignment. Bioinformatics, 29(20), 2588–2595. 10.1093/bioinformatics/btt447 [DOI] [PMC free article] [PubMed] [Google Scholar]
- Zhexin, X. (2006). Advances in homology protein structure modeling. Current Protein & Peptide Science, 7(3), 217–227. [DOI] [PMC free article] [PubMed] [Google Scholar]
- Zhou, P., Yang, X.-L., Wang, X.-G., Hu, B., Zhang, L., Zhang, W., Si, H.-R., Zhu, Y., Li, B., Huang, C.-L., Chen, H.-D., Chen, J., Luo, Y., Guo, H., Jiang, R.-D., Liu, M.-Q., Chen, Y., Shen, X.-R., Wang, X., … Shi, Z.-L. (2020). A pneumonia outbreak associated with a new coronavirus of probable bat origin. Nature, 579(7798), 270–273. 10.1038/s41586-020-2012-7 [DOI] [PMC free article] [PubMed] [Google Scholar]
- Zhu, L., George, S., Schmidt, M. F., Al-Gharabli, S. I., Rademann, J., & Hilgenfeld, R. (2011). Peptide aldehyde inhibitors challenge the substrate specificity of the SARS-coronavirus main protease. Antiviral Research, 92(2), 204–212. 10.1016/j.antiviral.2011.08.001 [DOI] [PMC free article] [PubMed] [Google Scholar]
- Zhu, N., Zhang, D., Wang, W., Li, X., Yang, B., Song, J., Zhao, X., Huang, B., Shi, W., Lu, R., Niu, P., Zhan, F., Ma, X., Wang, D., Xu, W., Wu, G., Gao, G. F., & Tan, W., China Novel Coronavirus Investigating and Research Team. (2020). A novel coronavirus from patients with pneumonia in China, 2019. The New England Journal of Medicine, 382(8), 727–733. 10.1056/NEJMoa2001017 [DOI] [PMC free article] [PubMed] [Google Scholar]


