Abstract
Due to its extreme sensitivity and fingerprint specificity, surface enhanced Raman spectroscopy (SERS) is a powerful tool for substance identification. Developments in portable low-cost SERS substrates and handheld Raman spectrometers enable SERS analysis at sample origin, with great potential benefit to field-work applications in numerous disciplines. This study reports a procedure which incorporates sample collection, isolation, and SERS identification of airborne solids on a single inexpensive substrate. This procedure, vacuum filtration-paper chromatography–SERS (VF-PC-SERS), utilizes a porous filter paper decorated with plasmonic nanoparticles which we call nanopaper. The porous fiber structure facilitates both the vacuum filter powder capture and the isolation of components by paper chromatography, while the nanoplasmonic coating enhances Raman signal. One potentially high-impact application of VF-PC-SERS is field analysis of hazardous or illicit materials. This study demonstrates a proof-of-concept for VF-PC-SERS using powdered rhodamine 6G (R6G) dispersed in air, resulting in 100% detection accuracy (true positive rate) at R6G levels as low as 0.6 mg/m3. Analysis of R6G contaminated with topsoil or lactose resulted in specific identification of R6G in powder mixtures containing as little as 0.1 wt. % R6G. This study demonstrates the feasibility of VF-PC-SERS as a safer procedure to identify hazardous substances at the point of sample origin.
Keywords: powder collection, SERS, nanopaper, paper chromatography, powder identification, VF-PC-SERS
1. Introduction
Field identification of chemicals is vital to many applications, especially in situations which involve screening potentially hazardous substances, such as explosive or toxic chemicals. Hazard identification faces the added challenge of safely collecting and processing samples. For example, field analysis of seized narcotics by law enforcement agents can result in exposure and potential overdose [1–5]. The presence of other materials in impure field samples often means that samples must be purified before analysis. This further increases the danger because each operation performed on the sample adds another potential for toxic exposure. Current methods for the identification of suspicious or hazardous substances usually involve transporting samples to a laboratory for analysis with ELISA and GC-MS [6] or field testing with colorimetric assays, which have low specificity and could require the collection of potentially lethal sample quantities [5]. Thus, there is a critical need for an analytical device which enables the identification of unknown substances at the point of sample origin, while minimizing the risk of exposure to hazardous materials.
Raman spectroscopy is an ideal alternative for chemical detection because it can provide fingerprint molecular identification of multiple species simultaneously. Furthermore, portable and handheld Raman instrumentation is available, making it suitable for either laboratory or field work. However, despite its high specificity, standard Raman spectroscopy has limited use in trace detection due to its inherently weak signal which is easily overwhelmed by the fluorescence background, especially in dilute or complex samples. This weak signal can be remedied by the use of surface enhanced Raman spectroscopy (SERS), which utilizes an engineered solid substrate composed of noble metal nanostructures to amplify the Raman signal by a factor of 102 – 1010 [7, 8]. The degree of enhancement depends strongly on the composition and geometry of the substrate, as well as the target molecule’s proximity to the substrate surface [9, 10]. Currently, most SERS substrates are fabricated as nanostructure films formed on rigid solid supports by various methods [11], including self-assembly [12, 13], templated assembly [14], and nanolithography [15]. Previous studies have demonstrated the ability of SERS to detect trace levels of toxic narcotic compounds, even when mixed with other drugs [16, 17].
The near unparalleled combination of sensitivity and specificity achieved by SERS enables a wide range of potential applications for trace chemicals analysis; however, the advantages of SERS are not without price. The need for an engineered substrate introduces additional materials, labor, and cost to the analysis and the need for intimate chemical contact between the substrate and the sample necessitates additional sample preparation. On rigid substrates, SERS tests are generally performed by collecting and dissolving the sample, depositing the solution on the substrate, washing, drying, and finally acquiring spectra [18]. Background fluorescence and spectral interference in complex samples may necessitate additional separation procedures before depositing the sample on the SERS substrate. This means that SERS analysis requires not only a substrate and a spectrometer, but also sample collection equipment, solvents, clean glassware, separations equipment, pipettes, and other laboratory paraphernalia. This is impractical for field analysis; ideally, a field-ready SERS assay would require only a sample, a substrate, and a spectrometer. Each additional apparatus used increases the risk of a human error resulting in hazard exposure or sample contamination.
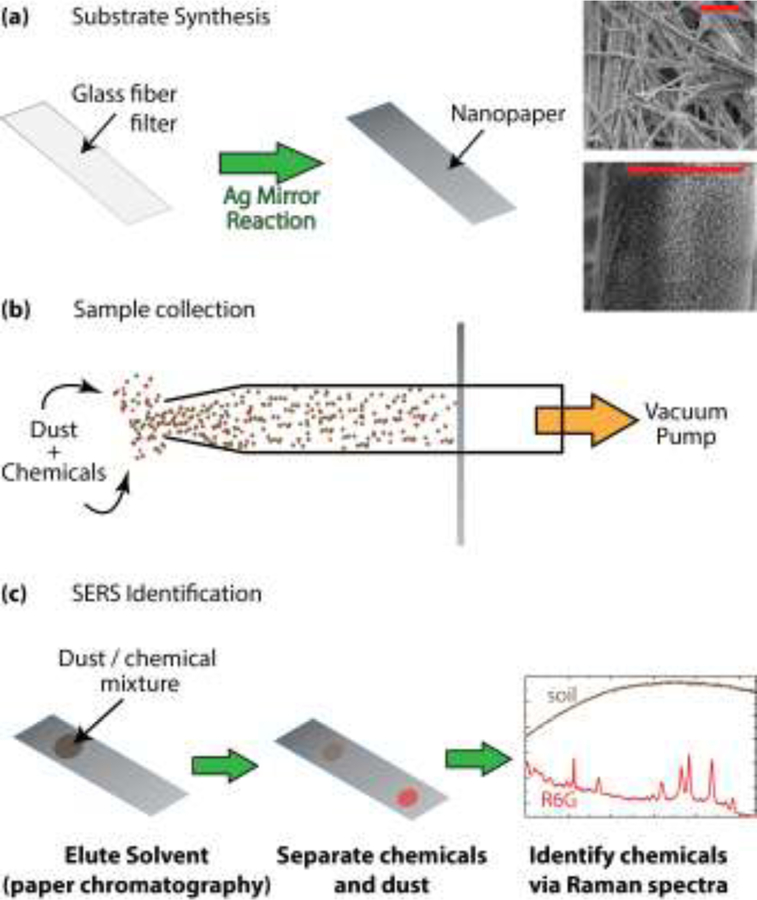
In our previous study [19], we reported a strategy to simplify separation and identification of complex mixtures by performing paper chromatography (PC) directly on a SERS substrate in a method called PC-SERS (Fig. 1). The substrate, called nanopaper, is simple and inexpensive to produce; it is composed of a glass microfiber filter coated with a dense layer of silver nanoparticles which impart SERS enhancement. By depositing chemical mixtures on one end of a nanopaper strip, eluting the strip with a solvent, and measuring the SERS spectra at different locations on the strip, mixture components can be unambiguously identified. The effectiveness of this strategy was demonstrated for mixtures of organic dyes and for carotenoids in vegetable extracts. The separation protocol occurs on the SERS substrate; no additional equipment or reagents are necessary beyond a small quantity of solvent. Compared to assays that require off-substrate sample cleanup, the use of nanopaper and PC-SERS in field analysis could improve portability and decrease cost. This strategy could also reduce hazardous exposure because sample manipulation only occurs when immobilized on a solid surface.
Figure 1.
Overview of VF-SERS system. (a) Nanopaper synthesis, with SEM images of nanopaper morphology (scale bars = 3 μm); (b) Nanopaper is used as a filter to collect particulates from the air; (c) simple and rapid on-filter separation enables identification of filtered chemical species.
A further study of the uses and properties of nanopaper reveal that, in addition to its functions of separator and signal enhancer, it can be used as a sample collector. Nanopaper pores can capture solids and the microfiber structure easily wicks up liquids, allowing it to be used as a swab or dipstick. A more interesting application, however, is to employ nanopaper as a filter to capture analytes. Previous studies have reported using porous SERS substrates as filters for isolation and SERS identification of trace substances in liquid, including aqueous tyrosine, pesticides, organic dyes, and milk adulterants (melamine, sodium sulfocyanate, dicyandiamide), among others [20–24]. While these methods offer valuable strategies for trace analysis of liquid samples by SERS, filtration is utilized for purification by membrane extraction rather than for sample collection.
In this study, we report the use of nanopaper for solid powder collection, purification, and identification using vacuum filtration – paper chromatography – SERS (VF-PC-SERS). To accomplish VF-PC-SERS, a nanopaper filter is installed on a vacuum pump and used to collect solid particles dispersed in the surrounding air (Fig. 1). After collection, solvent is eluted through the nanopaper to achieve close contact between the sample and the SERS substrate and, in the case of impure samples, to achieve chromatographic separation. Eluted samples are then analyzed using SERS. Experiments in this study were performed in a laboratory setting with a benchtop Raman spectrometer for proof-of-concept, but the procedure could be easily performed in the field; in the presence of an airborne powder, the only necessary materials are nanopaper, a vacuum cleaner, a small volume of solvent, and a portable Raman spectrometer.
2. Materials and Methods
2.1. Materials
Potassium hydroxide pellets, ammonium hydroxide solution (28–30%), rhodamine 6G (95%), and fentanyl (1.0 mg/mL in methanol) were purchased from Sigma-Aldrich. 2-propanol (99.9%), methanol (99.9%), silver nitrate (99.9995%), and binder-free glass microfiber filters (Whatman grade 934-AH, 110 circles) were purchased from Fisher Scientific. D-glucose (99.5%) and D-lactose (99.9%) were purchased from VWR International. Garden soil was purchased at a local hardware store.
2.2. Nanopaper fabrication and characterization
Nanopaper was fabricated as previously reported, without modification [19]. Briefly, an aqueous solution of ammonia and silver nitrate was activated by mixing with potassium hydroxide; then, glass microfiber filters were fully submerged in the silver solution. The silver mirror reaction was initiated by rapidly adding an aqueous glucose solution to the reaction vessel and shaking for several minutes. After the reaction was complete, nanopaper sheets were rinsed thoroughly with water and with 2-propanol, then stored immersed in 2-propanol. Before use in VF-PC-SERS experiments, nanopapers were air dried and cut into 1 cm × 2 cm rectangular sample strips.
2.3. Vacuum filtration experiments
To remove water from the powder samples and allow them to more easily disperse into the air, R6G, D-lactose, and topsoil were dried in a nitrogen purged oven at 70 °C. The mass of each powder was measured hourly until no mass change was observed, which occurred after about 6 h. Topsoil was sifted to remove wood fragments and other objects larger than several millimeters. After drying, a Beckmann Coulter Particle Size Analyzer LS 13320 was used to characterize the particle size distribution for each powder. Immediately prior to vacuum filtration experiments, powders were removed from the drying oven and weighed out into a petri dish. For experiments involving mixed powders, they were stirred until the sample appeared homogeneous.
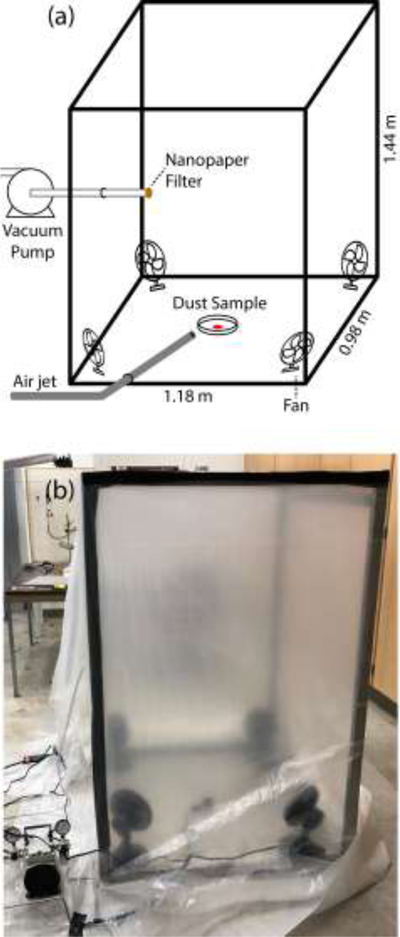
The collection chamber was constructed by draping polyethylene sheeting over a rectangular metal frame, with an electric fan placed in each corner to maintain air circulation (Fig. 2). A vacuum pump was connected to the chamber by inserting the intake tube through a small slit in the center of one chamber wall, and compressed air was delivered to the center of the chamber floor through a tube inserted at the floor of the adjacent wall. The total volume of the chamber was 1.67 m3. To set up vacuum filtration experiments, the vacuum pump was switched on and adjusted to a pressure differential of 50 kPa. A nanopaper filter strip was then placed over the vacuum inlet and a petri dish containing the powder specimen was placed in the center of the chamber floor. Then, the chamber was closed off and the electric fans were switched on. To initiate collection, the powders were dispersed into a dust cloud by pulsing a valve permitting compressed air to disperse the sample in the chamber. Vacuum filtration proceeded for either 60 s or 20 s, after which the fans were switched off and the nanopaper filter strip was removed for PC-SERS analysis.
Figure 2.
(a) A schematic of the vacuum collection chamber; (b) A photograph of the chamber.
2.4. Paper chromotography-SERS analysis
After vacuum filtration, the bottom edge of each sample strip was dipped into methanol and eluted until the solvent front fully cleared the circular region where the vacuum line had been placed. The sample strips were then dried briefly in an oven at 70 °C and transferred to the spectrometer for SERS acquisition.
Raman measurements were collected using a Thermo Scientific DXR Raman microscope (Thermo Fisher Scientific, Inc.) equipped with 780 nm diode laser excitation, a 10x objective lens, a Rayleigh rejection filter, a diffraction grating (4.7—8.7 cm–1 resolution), and a CCD detector. For experiments with 60 s VF duration, 50 spectra were acquired from a regular grid near the solvent front, using color to help select the grid location. In experiments with reduced (20 s) VF duration, spectra were instead acquired along the center of the nanopaper strip, without regard to visual cues. 5 accumulations of 1 s were used, and spectra were acquired at ≤ 1 mW laser power to avoid sample heating. Spectra were processed to remove artifacts and baseline contributions and to reduce spectral noise. After processing each spectrum, peak intensities were recorded for the R6G peak near 612 cm−1, and the mean intensity was calculated for each VF-PC-SERS sample strip.
3. Results and discussion
3.1. Nanoplasmonic Paper & SERS measurement
Nanopaper synthesis resulted in the formation of a dense layer of silver nanoparticles on the surfaces of the glass microfiber filter precursor. The silver nanoparticles caused the filter to change color from white to brown and imparted a strong SERS enhancement effect to the material. The nanopaper retained the filtering and chromatographic capabilities of the original glass fiber filters, and it demonstrated good stability and longevity when stored immersed in 2-propanol and shielded from exposure to light. In our previous study, we found that removing the nanopaper from storage conditions did not cause the SERS enhancement to degrade in the timescale of the experiments (minutes to hours). For further information, a complete characterization of the nanopaper substrate was reported in our previous study [19].
During this proof-of-concept study, all vacuum filtration experiments were performed using solid R6G as the target substance, due to its low toxicity. The underlying purpose of this work is to use a single substrate for collection and SERS enhancement, so powders, including R6G, lactose, and topsoil, were subjected to SERS analysis. While acquiring the SERS spectra of powders, we found that particles deposited on the nanopaper filter had insufficient contact with the surface to benefit from signal enhancement (Fig. S1). The solid phase Raman spectrum of R6G was weak and dominated by fluorescent background. It was necessary to dissolve the powder, either by adding a drop of solvent or by employing paper chromatography, to obtain satisfactory SERS spectra. A variety of solvents could be used, but we chose methanol for its quick evaporation and because R6G is easily soluble in methanol. Once dissolved on the substrate, R6G powder had a strong SERS signal (Fig. S1). The peak near 612 cm−1 on the R6G SERS spectrum was strong and well defined, so this peak intensity was used to indicate the presence of R6G. Solid D-lactose and soil powders did not have strong Raman spectra (Fig. S1). Upon addition of solvent, D-lactose and soil still did not yield observable SERS spectra. This was because topsoil does not dissolve in methanol and D-lactose dissolves only sparingly in methanol, resulting in a lack of close contact between the powders and the plasmonic surface.
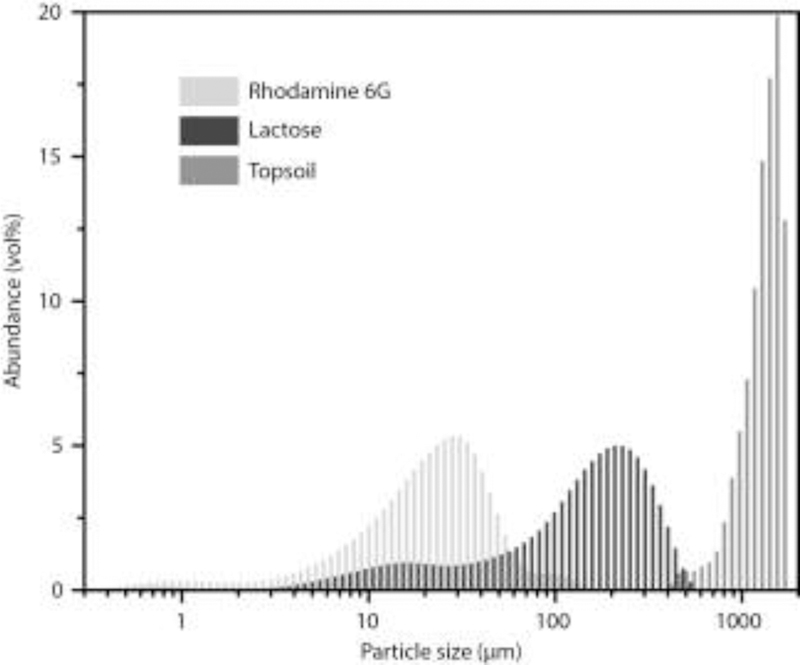
For sample collection by vacuum filtration to be effective, the filter pore size must be compatible with the particle size of the target powder. Therefore, R6G, D-lactose, and topsoil, were characterized by particle size distribution. The results showed that all samples had left-skewed size distributions (Fig. 3). R6G had the finest grain size, with a median diameter of 22.5 μm. D-lactose particles were larger with a median diameter of 158.1 μm. The topsoil contained some very large particles that were outside the range of the particle size analyzer; however, among particles that were within the instrumental range, the median diameter was 1380 μm. According to the manufacturer, the glass fiber filter that serves as the nanopaper precursor has a typical particle retention of 1.5 μm. Therefore, the nanopaper filter is capable of retaining all lactose and soil particles as well as > 99% of the R6G.
Figure 3.
Particle size distribution of the 3 powder species used in VF-PC-SERS experiments (the topsoil distribution excludes some particles that were beyond the instrumental range).
3.2. Collection & identification of airborne chemical powders via vacuum filtration
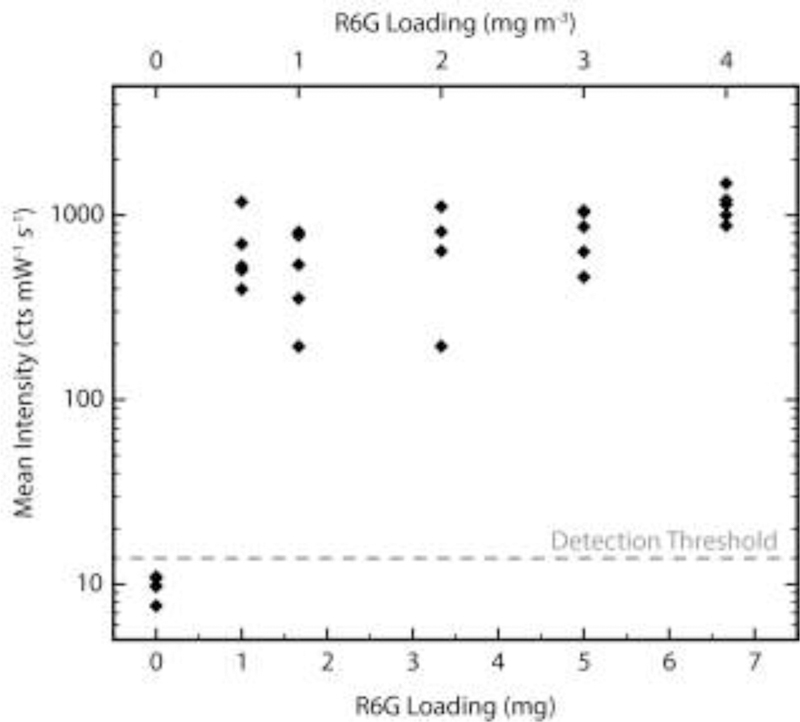
To test the R6G detection capability of VF-PC-SERS, the protocol was implemented with varying amounts of R6G powder loaded into the collection chamber. Sample loadings of 6.7, 5, 3.3, 1.7, and 1 mg (equivalently 4, 3, 2, 1, and 0.6 mg/m3) were tested with a VF duration of 60 s, with 5 experimental replicates for each loading. After each experiment, a negative control was performed with no R6G to determine whether residual R6G would affect the following experiment. Upon removal from the vacuum filtration chamber, examination of the nanopaper sample strips by eye did not show the presence of R6G; however, particles were visible by microscope and upon elution with methanol, a bright pink band migrated with the solvent front (Fig. S2). SERS analysis at the solvent front of these samples showed an identifiable peak near 612 cm−1, confirming the presence of R6G. None of the negative control samples exhibited a colored band during elution, and none showed any reliable R6G peaks (Fig. 4).
Figure 4.
R6G detection by VF-PC-SERS. Each point represents the mean intensity at 612 cm−1 for a nanopaper sample strip. The detection threshold is set at 3 standard deviations above the mean of the negative controls.
The mean SERS intensity of samples containing R6G was similar at all R6G loadings tested. This could be because even the lowest loading saturated the SERS-active surfaces of the nanopaper. In this case, additional R6G would benefit less from SERS and have little effect on the overall signal. To test this, we deposited aqueous R6G solutions on nanopaper samples and measured the SERS response (Fig. S3). The results showed that as more R6G was deposited on the nanopaper, the corresponding increase in SERS intensity diminished; beyond 1 μg, additional R6G did not increase the SERS intensity, indicating saturation of SERS-active surfaces. This maximum intensity value agreed with the intensities observed in VF-PC-SERS experiments. The saturation level of 1 μg means that even at the lowest loading tested, VF-PC-SERS experiments could present regions with surface saturation if the filtration captures as low as 0.1% of the total R6G load.
The consistency in SERS intensity implies that the dynamic range for this system is narrow (between 0 and 0.6 mg m−3 R6G) and lies outside the conditions tested. This means that the protocol is not suitable for quantitative detection. This is not a major setback for many potential applications of VF-PC-SERS; for rapid identification of illicit or hazardous substances in the field, qualitative detection is sufficient. Positive qualitative detection is achieved when the mean intensity of a VF-PC-SERS experiment exceeds a detection threshold, which we define as 3 standard deviations above the mean of the negative controls. Figure 4 shows that with 60 s VF duration, VF-PC-SERS achieved 100% true positive rate at R6G loadings. It is also useful to define a qualitative limit of detection as the lowest analyte loading which reliably results in positive detection. If reliable detection is at 100% true positive rate, then the qualitative limit of detection for this experiment is ≤ 0.6 mg m-3.
To further test the limits of our qualitative detection, we reduced the VF duration to 20 s and repeated the VF-PC-SERS protocol for R6G loadings of 10, 5, 1, and 0 mg (equivalently 6, 3, 0.6, and 0 mg m−3). With reduced vacuum time, fewer particles were collected on the nanopaper surface, reducing the R6G signal. Loadings of 6 and 3 mg m−3 maintained 100% true positive rate, but at 0.6 mg m−3, detection became unreliable (Fig. S4). Therefore, for 20 s filtration duration, the qualitative limit of detection was between 0.6—3 mg m-3.
3.3. Detection in complex matrices
VF-PC-SERS provides a means for sample collection and we envision applications outside the laboratory, which often involve unclean, diluted, or otherwise adulterated substances. Therefore, the method must be able to collect potentially contaminated samples and identify the substance of interest. To simulate the collection and identification of adulterated substances, we mixed R6G powder with two diluents: topsoil and D-lactose powder. Topsoil was chosen to demonstrate specificity in generally unclean environments, such as outdoors, and lactose was selected as a common diluent for illegally distributed controlled substances [25]. In specificity experiments, filtration duration was 60 s and R6G loading remained constant at 5 mg while the diluent loading varied. Lactose and topsoil were tested at 5, 7.5, 11.7, 20, 45, 95, and 1000 mg loadings, corresponding to powder compositions of 50, 40, 30, 20, 10, 5, and 0.5% R6G (w/w), respectively. Topsoil was also tested at 5 g, or a powder composition of 0.1% R6G (w/w). Three experimental replicates were performed for each loading of both diluents, after which a negative control was performed wherein the chamber was loaded with the same level of diluent containing no R6G.
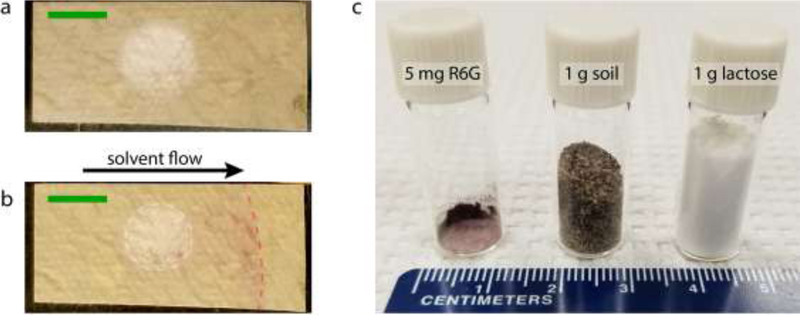
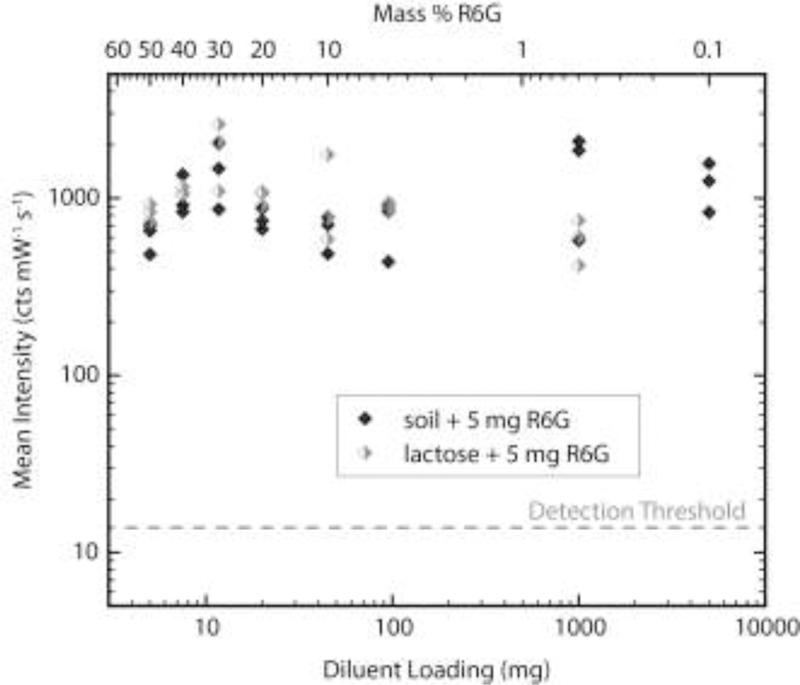
Vacuum filtration of contaminated samples resulted in accumulation of R6G and the diluent powder on the nanopaper surface. For diluent loadings ≥ 95 mg, the accumulation could be seen by eye (Fig. 5). After elution with methanol, in which lactose is only sparingly soluble, a distinct pink colored band separated from the collection area, migrating with the solvent front. This visual indicator of R6G was not observed in any negative control samples. SERS analysis at the solvent front showed strong intensity at 612 cm−1 in all non-control samples and showed negligible intensity at 612 cm−1 in all control samples (Fig. 6).
Figure 5.
VF-PC-SERS specificity demonstration. (a) VF-PC-SERS test strip after collection in a chamber loaded with 5 mg R6G mixed with 1 g lactose, scale bar 5 mm; (b) The same VF-PC-SERS test strip after elution by methanol, exhibiting separation of lactose and R6G. The direction of solvent flow during PC, the boundary of the vacuum collection region, and the location of the solvent front are annotated, scale bar 5 mm; (c) Photograph illustrating relative amounts of R6G and diluents used in specificity experiments.
Figure 6.
Specificity analysis of VF-PC-SERS. Each point shows the mean SERS intensity at 612 cm−1 for a nanopaper sample strip. Each experiment was performed in a chamber loaded with 5 mg R6G mixed with the diluent loading displayed. The detection threshold is carried over from Fig. 4.
The SERS results of Fig. 6 demonstrate that VF-PC-SERS is a robust platform for the detection of R6G despite severe contamination by multiple diluents. No decrease in SERS intensity was observed as diluent loading was increased. Because all contaminant loadings resulted in correct identification of R6G, the specificity limit was not fully determined; we only report that R6G identification is specific for powder mixtures ≥ 0.5% in lactose and ≥ 0.1% in topsoil. This result compares favorably with the published thermal desorption direct analysis in real time mass spectrometry (TD-DART-MS), which could detect solid fentanyl dispersed in dirt simulant at 0.1wt. % [5].
4. Conclusions
In this investigation, we have demonstrated that nanopaper can be used as a tri-functional substrate to (1) capture solids dispersed in air, (2) separate the captured materials by chromatography, and (3) enhance their Raman scattering signal to allow SERS identification. The combination of these functions makes VF-PC-SERS a simple and rapid method, with each function being compatible with on-site analysis of solid specimens. Although only one target species, R6G, was tested in our VF-PC-SERS experiments, the promising detection accuracy we observed indicates good potential for use in more applied scenarios, including narcotics testing. Our future efforts will extend this study to include actual hazard chemicals (such as fentanyl and its analogs), testing the system remotely using robotic vacuum cleaners and handheld Raman spectrometers, and developing a single-use VF-PC-SERS cartridge incorporating a nanopaper test strip and elution solvent. Future study will also thoroughly investigate how humidity, airborne pollutants, and other environmental exposure concerns affect the nanopaper stability and the VF-PC-SERS performance. Once these modifications are fully developed, VF-PC-SERS could become a significant asset in the on-site analysis of chemical residues.
Supplementary Material
Research Highlights.
Sample collection, isolation, identification combined on nanopaper substrate
Powder detection sensitivity better than 0.6 mg/m3
Reliable identification of target chemical in powder mixtures as low as 0.1 wt. %
Footnotes
Publisher's Disclaimer: This is a PDF file of an unedited manuscript that has been accepted for publication. As a service to our customers we are providing this early version of the manuscript. The manuscript will undergo copyediting, typesetting, and review of the resulting proof before it is published in its final citable form. Please note that during the production process errors may be discovered which could affect the content, and all legal disclaimers that apply to the journal pertain.
Supplementary Materials: The following are available online, Figure S1: Raman spectra of powders used in VF-PC-SERS demonstrations Figure S2: Darkfield microscopy images of nanopaper used as a vacuum filter for R6G powder, Figure S3: SERS intensity vs mass of R6G deposited on nanopaper, Figure S4: True positive rate of R6G detection by VF-PC-SERS with 20 s vacuum filtration duration.
References
- [1].Poklis A, Fentanyl: A Review for Clinical and Analytical Toxicologists, Journal of Toxicology: Clinical Toxicology, 33(1995) 439–47. [DOI] [PubMed] [Google Scholar]
- [2].Hedegaard H, Bastian BA, Trinidad JP, Spencer M, Warner M. Drugs Most Frequently Involved in Drug Overdose Deaths: United States, 2011–2016. N.V.S. Reports; vol. 67 no. 9 Hyatsville, MD: National Center for Health Statistics, 2018. [PubMed] [Google Scholar]
- [3].Schumann H, Erickson T, Thompson TM, Zautcke JL, Denton JS, Fentanyl epidemic in Chicago, Illinois and surrounding Cook County, Clinical Toxicology, 46(2008) 501–6. [DOI] [PubMed] [Google Scholar]
- [4].Kuhlman JJ Jr, Kuhlman JJ, McCaulley R, Valouch TJ, Behonick GS, Fentanyl Use, Misuse, and Abuse: A Summary of 23 Postmortem Cases, Journal of analytical toxicology, 27(2003) 499–504. [DOI] [PubMed] [Google Scholar]
- [5].Sisco E, Verkouteren J, Staymates J, Lawrence J, Rapid detection of fentanyl, fentanyl analogues, and opioids for on-site or laboratory based drug seizure screening using thermal desorption DART-MS and ion mobility spectrometry, Forensic Chemistry, 4(2017) 108–15. [DOI] [PMC free article] [PubMed] [Google Scholar]
- [6].Influx of Fentanyl-laced Counterfeit Pills and Toxic Fentanyl-related Compounds Further Increases Risk of Fentanyl-related Overdose and Fatalities Centers for Disease Control and Prevention, 2016. https://emergency.cdc.gov/han/han00395.asp.
- [7].Kneipp K, Wang Y, Kneipp H, Perelman LT, Itzkan I, Dasari RR, et al. , Single Molecule Detection Using Surface-Enhanced Raman Scattering (SERS), Physical Review Letters, 78(1997) 1667–70. [Google Scholar]
- [8].Nie S, Emory SR, Probing Single Molecules and Single Nanoparticles by Surface-Enhanced Raman Scattering, Science, 275(1997) 1102. [DOI] [PubMed] [Google Scholar]
- [9].Sharma B, Fernanda Cardinal M, Kleinman SL, Greeneltch NG, Frontiera RR, Blaber MG, et al. , High-performance SERS substrates: Advances and challenges, MRS Bulletin, 38(2013) 615–24. [Google Scholar]
- [10].Tiwari VS, Oleg T, Darbha GK, Hardy W, Singh JP, Ray PC, Non-resonance SERS effects of silver colloids with different shapes, Chemical Physics Letters, 446(2007) 77–82. [Google Scholar]
- [11].Fan M, Andrade GFS, Brolo AG, A review on the fabrication of substrates for surface enhanced Raman spectroscopy and their applications in analytical chemistry, Analytica Chimica Acta, 693(2011) 7–25. [DOI] [PubMed] [Google Scholar]
- [12].Wang H, Levin CS, Halas NJ, Nanosphere Arrays with Controlled Sub-10-nm Gaps as Surface-Enhanced Raman Spectroscopy Substrates, Journal of the American Chemical Society, 127(2005) 14992–3. [DOI] [PubMed] [Google Scholar]
- [13].Liz-Marzán LM, Tailoring Surface Plasmons through the Morphology and Assembly of Metal Nanoparticles, Langmuir, 22(2006) 32–41. [DOI] [PubMed] [Google Scholar]
- [14].Liberman V, Yilmaz C, Bloomstein TM, Somu S, Echegoyen Y, Busnaina A, et al. , A Nanoparticle Convective Directed Assembly Process for the Fabrication of Periodic Surface Enhanced Raman Spectroscopy Substrates, Advanced Materials, 22(2010) 4298–302. [DOI] [PubMed] [Google Scholar]
- [15].Jensen TR, Malinsky MD, Haynes CL, Van Duyne RP, Nanosphere Lithography: Tunable Localized Surface Plasmon Resonance Spectra of Silver Nanoparticles, The Journal of Physical Chemistry B, 104(2000) 10549–56. [Google Scholar]
- [16].Leonard J, Haddad A, Green O, Birke RL, Kubic T, Kocak A, et al. , SERS, Raman, and DFT analyses of fentanyl and carfentanil: Toward detection of trace samples, Journal of Raman Spectroscopy, 48(2017) 1323–9. [Google Scholar]
- [17].Haddad A, Comanescu MA, Green O, Kubic TA, Lombardi JR, Detection and Quantitation of Trace Fentanyl in Heroin by Surface-Enhanced Raman Spectroscopy, Analytical Chemistry, 90(2018) 12678–85. [DOI] [PubMed] [Google Scholar]
- [18].Restaino SM, White IM, A critical review of flexible and porous SERS sensors for analytical chemistry at the point-of-sample, Analytica Chimica Acta, (2018). [DOI] [PubMed]
- [19].Weatherston JD, Seguban RKO, Hunt D, Wu H-J, Low-Cost and Simple Fabrication of Nanoplasmonic Paper for Coupled Chromatography Separation and Surface Enhanced Raman Detection, ACS Sensors, 3(2018) 852–7. [DOI] [PubMed] [Google Scholar]
- [20].Cheng M-L, Tsai B-C, Yang J, Silver nanoparticle-treated filter paper as a highly sensitive surface-enhanced Raman scattering (SERS) substrate for detection of tyrosine in aqueous solution, Analytica Chimica Acta, 708(2011) 89–96. [DOI] [PubMed] [Google Scholar]
- [21].Fateixa S, Raposo M, Nogueira HIS, Trindade T, A general strategy to prepare SERS active filter membranes for extraction and detection of pesticides in water, Talanta, 182(2018) 558–66. [DOI] [PubMed] [Google Scholar]
- [22].Meng Y, Lai Y, Jiang X, Zhao Q, Zhan J, Silver nanoparticles decorated filter paper via self-sacrificing reduction for membrane extraction surface-enhanced Raman spectroscopy detection, Analyst, 138(2013) 2090–5. [DOI] [PubMed] [Google Scholar]
- [23].Yu WW, White IM, A simple filter-based approach to surface enhanced Raman spectroscopy for trace chemical detection, Analyst, 137(2012) 1168–73. [DOI] [PMC free article] [PubMed] [Google Scholar]
- [24].Li D, Lv DY, Zhu QX, Li H, Chen H, Wu MM, et al. , Chromatographic separation and detection of contaminants from whole milk powder using a chitosan-modified silver nanoparticles surface-enhanced Raman scattering device, Food Chemistry, 224(2017) 382–9. [DOI] [PubMed] [Google Scholar]
- [25].Miller M, The Determination of Excipient Sugar Diluents in Illicit Preparations Containing Heroin by Gas Chromatography, (1972). [PubMed]
Associated Data
This section collects any data citations, data availability statements, or supplementary materials included in this article.


