Abstract
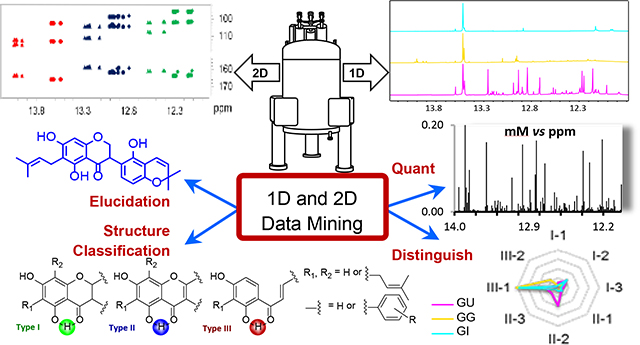
Utilizing the distinct HMBC crossed-peak patterns of lower-field range (LFR; 11.80‒14.20 ppm) hydroxyl singlets, presented NMR methodology characterizes flavonoid metabolomes both qualitatively and quantitatively. It enables simultaneous classification of the structural types of 5-OH flavonoids and biogenetically related 2’-OH chalcones, as well as quantification of individual metabolites from 1H NMR spectra, even in complex mixtures. Initially, metabolite-specific LFR 1D 1H and 2D HMBC patterns were established via literature mining and experimental data interpretation, demonstrating that LFR HMBC patterns encode the different structural types of 5-OH flavonoids/2’-OH chalcones. Taking advantage of the simplistic multiplicity of the H,H-uncoupled LFR 5-/2’-OH singlets, individual metabolites could subsequently be quantified by peak fitting quantitative 1H NMR (PF-qHNMR). Metabolomic analysis of enriched fractions from three medicinal licorice (Glycyrrhiza) species established proof-of-concept for distinguishing three major structural types and eight subtypes in biomedical applications. The method identified fifteen G. uralensis (GU) phenols from the six possible subtypes of 5,7-diOH (iso)flav(an)ones with 6-, 8-, and non-prenyl substitution, including the new 6-prenyl-licoisoflavanone (1) and two previously unknown compounds (4 and 7). Relative (100%) qNMR established quantitative metabolome patterns suitable for species discrimination and plant metabolite studies. Absolute qNMR with combined external and internal (solvent) calibration (ECIC) identified and quantified 158 GU metabolites. HMBC-supported qHNMR analysis of flavonoid metabolomes (“flavonomics”) empowers the exploration of structure-abundance-activity relationships of designated bioactivity. Its ability to identify and quantify numerous metabolites simultaneously and without identical reference materials opens new avenues for natural product discovery and botanical quality control and can be adopted to other flavonoid- and chalcone containing taxa.
Graphical Abstract
Metabolomic analysis continues to emerge as a methodology capable of advancing our understanding of the complexity of plant-derived (traditional) biomedicines. Metabolomic approaches mainly build on NMR and/or MS detection,1 identification via MSn driven databases such as GNPS, and quantification vs identical reference standards,2–4 assuming availability. Unless covered unambiguously in databases, the NMR and MS signals of the structurally demanding and biosynthetically more highly evolved metabolites remain “dark chemical matter”.5 Their accurate identification relies on preparative isolation in quantity and purity that permits full structure elucidation, including absolute stereochemistry, and collectively represents a widely recognized bottleneck.6
The present approach takes advantage of the unique chemical shift (δ) and simplistic multiplicity of the 5/2’-OH 1H NMR singlets often observed in flavonoids and chalcones, prominent plant metabolites that have been associated with a host of biological functions. The approach utilizes these distinctive lower-field range (LFR) 1H NMR signals to establish 2D NMR correlation patterns that can classify and even identify known and unknown compounds in complex mixtures, with enhanced confidence and without individual purification. Moreover, due to the lack of H,H-coupling, 5/2’-OH signals are clean singlets amenable to Lorentzian/Gaussian deconvolution. This permits qHNMR quantification of individual metabolites in complex mixtures, without calibration with identical reference standards.
Plant (poly)phenols including chalcones, (iso)flavonoids, and related poly-hydroxylated aromatics are structurally and biologically diverse metabolites.7,8 The 5-OH flavonoids and 2’-OH chalcones constitute ~60% of all reported plant (poly)phenols and, less surprisingly, ~75% of congeners reported as “antioxidative” natural products (NPs).7,9 Remarkably, their phenolic OH 1H resonances are ignored widely in structural analysis,10 even intramolecularly bound hydrogens with exposed chemical shifts, such as 5/2’-OH that interact with neighboring C-4/C-1 carbonyls, respectively. One likely reason for this omission is the relative instability of their unmasked chemical shifts, which depend on concentration, temperature, pH, and water content. Moreover, their “broad singlet” nature is generally not considered as useful structural information. Importantly, they are not observable in protic deuterated solvents due to exchange.
However, in dry aprotic solvents such as DMSO-d6, most exchangeable hydrogens exhibit sharp resonances, especially intramolecularly hydrogen bonded hydrogens, unless elevated temperature, intermediate energy barriers, or exchange rate lead to high rotation rates.11 The utility of LFR signals12 has been demonstrated for the direct quantification of major phenolics in oregano and olive extracts.13,14 Following a systematic evaluation of pH, temperature, and concentration, low pH was determined to reduce LFR line widths effectively. Low-temperature optimization is intrinsically limited by DMSO freezing. As OH hydrogens confound the H,H-coupling patterns essential for relative stereochemical assignments, observation of (unexchanged) OH signals in glycosidic metabolites overcomplicates most 1H NMR spectra beyond utility.
While H/D exchange via D2O addition can overcome such information excess, OH signals encode key structural information in their chemical shifts and nJH,C patterns, especially for strong intramolecular H-bonds such as those of 5-OH in flavonoids and 2’-OH in chalcones that slow down or resist exchange.15 Their stability results from the alteration of electronic clouds, bond lengths, and second-order stabilization energies (ΔE(2)) in the planar H-bond structures. The resulting O1H LFRs with δH values of 10~15 ppm reflect strong deshielding by the adjacent carbonyl and the aromatic A-ring. Considering the relative scarcity of non-exchangeable hydrogens in NPs, these O1H resonances provide opportune structural information rather than undesirable complication. In fact, the LFR section of 1H NMR spectra is conceptually similar to pure shift NMR16 each hydrogen exhibits a singlet, dispersion is maximized, and precise quantification is readily achievable via singlet deconvolution.
In our continued efforts to build NMR metabolomic tools (Section S1, Supporting Information), the favorable LFR characteristics inspired their utilization for establishing (iso-)flavonoid and chalcone A- and C-ring partial structures via the HMBC correlation patterns of LFR hydrogens with nearby carbons. Termed 2D NMR Barcoding, 2D HMBC cross-peak patterns have been shown to be diagnostic for ~150 Actaea/Cimicifuga triterpene metabolites.17 The current study combines 1D 1H NMR data mining with 2D NMR Barcoding concepts to build LFR HMBC patterns that link the characteristic δH values of LFRs with metabolite (partial) structures via the three possible 5-/2’-O1H HMBC correlations. Supported by LC-MS analyses, we demonstrate that 1D 1H LFR resonance patterns can decipher and quantitate (poly-)phenolic metabolomes.
Reflecting the importance of prenylated (iso-)flavonoids and chalcones, and in line with our mission to enhance botanical reproducibility and integrity, this study focuses on licorice, arguably the most widely used botanical material worldwide. Being derived from Glycyrrhiza uralensis (GU), G. glabra (GG), and G. inflata (GI), and despite distinct metabolomes with >400 reported compounds of broad structural diversity [terpenoids, (iso-)flavonoids, chalcones, alkaloids],18 pharmacopeias worldwide enlist all three licorice species. As the phenolic metabolome plays a key role in the species-specific health benefits,19,20 an LC-UV method has been developed to control the flavonoid-to-chalcone ratio as well as content.21 The invariable limitations caused by UV response factors and need for single compound calibration in LC quantitation can be overcome by the universal detection and streamlined calibration capabilities of qHNMR.22 Aimed at the holistic analysis of licorice preparations, this study demonstrates the feasibility of concurrent qualitative and quantitative metabolomic analysis of a multitude of 5-/2’-OH Glycyrrhiza phenols by qNMR.
EXPERIMENTAL SECTION
Sample Preparation
Extraction of ten grams each of DNA-verified licorice roots/stolons with EtOH:iso-PrOH:water (90:5:5) yielded licorice extracts GU, GG, and GI. Each was fractionated on XAD-2 eluting with H2O (WF), 50% MeOH (50% MF), MeOH (MF), and acetone (AF). The target metabolites enriched in the MF. For validation, GU-MF was further fractionated via semi-preparative ODS-HPLC into twenty subfractions, GU-MF-1~20, and GU-MF-18 was further separated over Sephadex LH-20 column to yield GU-MF-18–1.
NMR Data Mining
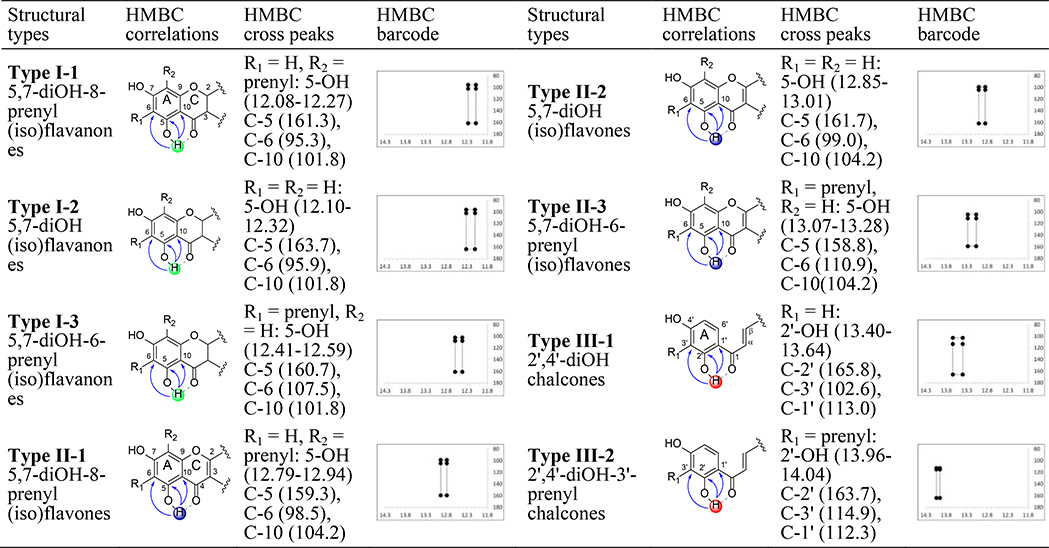
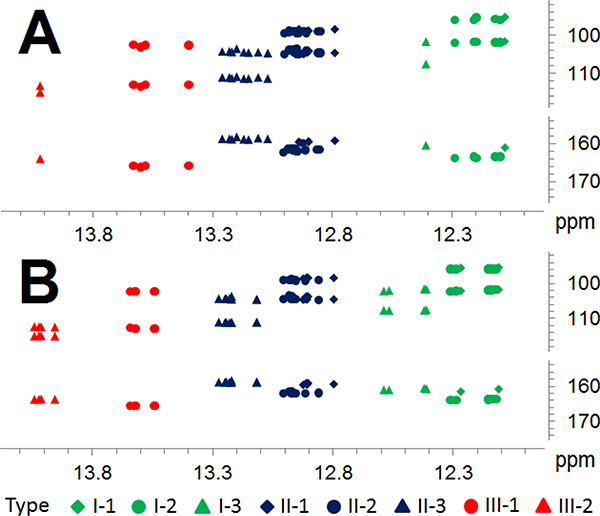
Survey of the literature up to Apr 5, 2018, for the three species, GU, GG, and GI, was undertaken in SciFinder (SI, Flowchart of Literature Mining) with two criteria: (i) compounds or constituents reported from “licorice”; (ii) 5-OH flavonoids and 2’-OH chalcones in “licorice”. This yielded 76 compounds, 41 of which had reported 1H and 13C NMR data in DMSO-d6 (SI, Results of Literature Mining). Structural classification gave three main types and eight subtypes: 5-OH (iso)flavanones (type I, 3 subtypes), 5-OH (iso)flavones (type II, 3 subtypes), and 2’-OH chalcones (type III, 2 subtypes). The HMBC patterns of 41 compounds (Figures 1 and 2A) involved correlations of 5-O1H with 13C-5/6/10 nuclei in flavonoids, and 2’-O1H and 13C-1’/2’/3’ with chalcones. HMBC patterns of congeners with different substitutions were established by mining literature data and interpreting experimental NMR data (Figures 1 and 2; SI, Tables S3 and S4). The experimental chemical shifts of 5-OH/2’-OH hydrogens and correlating carbons in GU-MF, GG-MF, and GI-MF (Figure 2B and SI Table S4), and GU-MF-11, 12, GU-MF-14~20 (SI, Table S5) were acquired in DMSO-d6.
Figure 1.
The different types of flavonoids/chalcones in licorice with their partial structures as well as their HMBC cross peaks expressed as δH, δC in ppm and as barcodes (δH 11.8–14.3 ppm, δC 80–180 ppm), gleaned from both literature and experimental data.
Figure 2.
The LFR (11.8‒14.3 ppm) HMBC correlations of 41 licorice flavonoids/chalcones from GU, GG, and GI mined from the literature (A) vs experimental data (B) from the three licorice fractions GU-MF, GG-MF, and GI-MF. Colors identify the three main flavonoid/chalcone types, shapes the subtypes.
Quantitative NMR
qHNMR analysis employed the “100%” relative (rel-qHNMR) and the combined external/internal calibration (ECIC) absolute (abs-qHNMR) methods, using calculation spreadsheets freely available at qnmr.com. The later used the residual solvent signals23 (0.139% residual 1H in the DMSO-d6, SI spreadsheet) as IC to quantify each 5-/2’-OH LFR singlet in the enriched GU-MF. Baseline correction used least-square polynomial fitting and deconvolution of broad humps. Quantified LFR singlets were picked with 0.008 minimum height (MH) and 1.0 RMS criteria, and the corresponding 11.80~14.20 ppm range was deconvoluted with the line fitting (LF) function of NutsPro v20100424 (Acorn NMR, Livermore, CA, USA).
RESULS AND DISCUSSION
Literature Mining of HMBC Patterns
To retrieve 76 flavonoids/chalcones belonging to eight structural subtypes in “licorice”, 3,000+ licorice publications were mined systematically (see Experimental Section). SciFinderR searches of the 76 compound names and CAS numbers led to 150,000+ hits, which were refined to 30,000+ hits with the term “isolate”. Further refinement probed for (a) available 1H and 13C NMR data; (b) DMSO-d6 as solvent (acetone-d6, MeOH-d4, and CDCl3 were also used); and (c) inclusion of 1H LFR resonances. Almost all reported licorice (GU, GG, GI) phenols were 5,7-/2’,4’-di-oxygenated, with free 5,7-/2’,4’-di-OH species accounting for ~90% of the compounds.
While 1H and/or 13C chemical shifts were reported frequently, only 41 5,7-/2’,4’-diOH phenols in 18 publications met all criteria. Depending on the deshielding effects of the adjacent C-4/C-1 carbonyl and the aromatic A-ring, the intramolecularly H-bonded 5-/2’-OH hydrogens resonate as dispersed LFR singlets at 10~15 ppm in three main groups, reflecting the variation of the A-/C-rings and A-ring/C3-bridge in flavonoids and chalcones, respectively, as follows (Figure 2A and SI, Table S3): δH 12.08~12.41 for 5,7-diOH (iso)flavanones (type I); δH 12.79~13.26 for 5,7-diOH (iso)flavones (type II); and δH 13.40~14.02 for 2’,4’-diOH chalcones (type III). Although the dispersion of the correlating 13C signals (C5/C6/C10 in flavonoids; C1’/C2’/C3’ in chalcones) falls into a limited range, their HMBC correlations were still highly characteristic: not only did they reveal all three types, I-III, but they also distinguished eight subtypes consistent with the A-ring substitution: I-1~3 and II-1~3 in 6-/8-/non-prenyl flavonoids and III-1~2 in 3’-/non-prenyl chalcones (Figure 2A and SI, Table S3).
Establishing Metabolomic HMBC Patterns
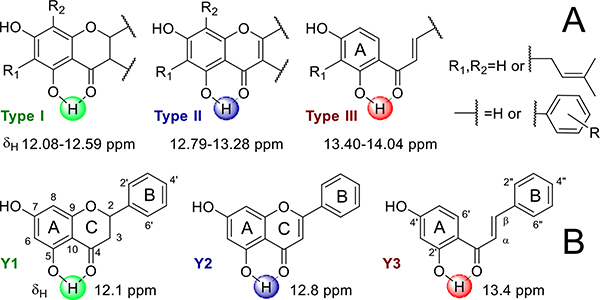
The abundance of LFR singlets and corresponding HMBC cross-peaks in the XAD-2 100% MeOH fractions (MF) of GU, GG, and GI indicated high enrichment of 5-OH flavonoid/2’-OH chalcone metabolites. The water fraction (WF) was devoid of these metabolites. NMR spectra of 50% MeOH (50% MF) and acetone (AF) fractions showed the presence of the target compounds, but much fewer structural types and smaller amounts than that of MF, particularly in AF. As predicted by the literature mining of HMBC patterns, the experimental LFR signals of the 5-/2’-OH phenols in GU/GG/GI MF grouped as: δH 12.11~12.59, 12.80~13.28, and 13.54~14.04 for the main types I-III (Figure 1B and SI, Table S4); and further into the eight subtypes I-1~3, II-1~3, and III-1~2 (Figure 2B and SI, Table S4). Integration of mined literature 1D NMR and acquired 1D and HMBC data fully established the distinctive HMBC patterns of 5-/2’-OH LFR hydrogens of the three types and eight subtypes of licorice phenolic metabolites (Figures 1and 3A).
Figure 3.
Chemical shifts of the LFR 5-/2’-OH hydrogens of the three main types of Glycyrrhiza flavonoids/chalcones based on literature and experimental data (A) and chemical shifts and structures of three model compounds, Y1, Y2, and Y3 (B).
HMBC Pattern Validation via HPLC Fractions
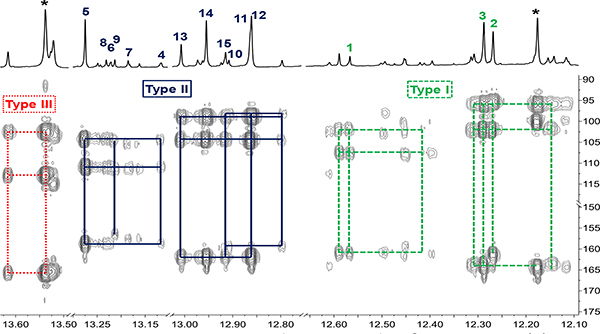
To validate the HMBC flavonoid pattern methodology, HPLC analysis focused on GU-MF, which compared to GU-WF/−50%MF/-AF, as well as, GG-MF and GI-MF, exhibited the highest abundance of target metabolites (Figure 4; SI, Figures S5 and S6). The GU-MF HMBC patterns confirmed that the LFR 1H singlets clusters δH between 12.14~13.62 correspond to three main types (I: 12.14~12.59; II: 12.80~13.28; III: 13.54~13.62) and seven subtypes (I-1: ~12.27; I-2: 12.14~12.32; I-3: 12.41~12.59; II-1: 12.80~12.92; II-2: 12.86~13.01; II-3: 13.12~13.28; III-1: 13.54~13.62; Figure 4).
Figure 4.
HMBC spectrum (600 MHz) of GU-MF with assignments of the three main types and individual metabolites. *Denotes metabolite absent in the HPLC subfractions.
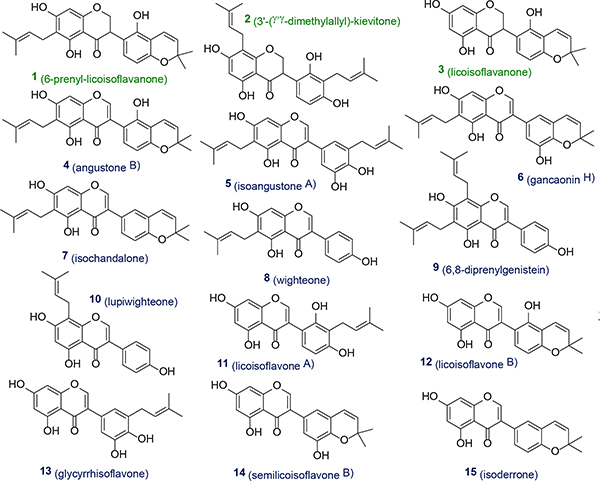
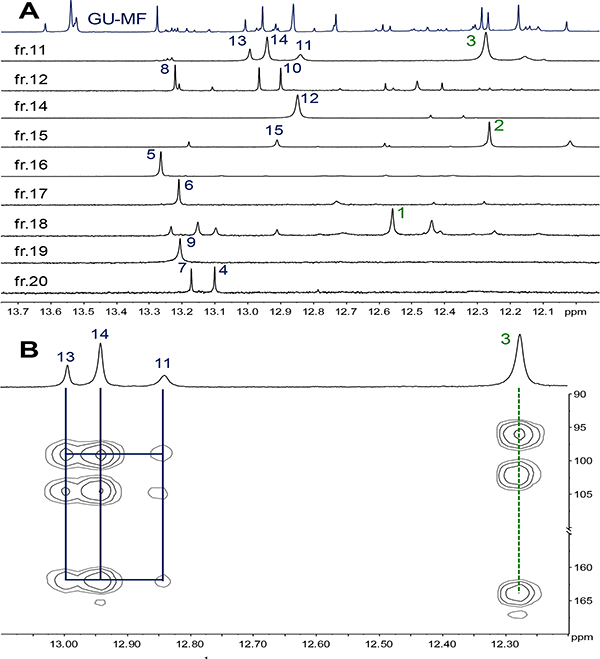
To elucidate individual structures via less complex mixtures, HPLC GU-MF produced 20 subfractions by (GU-MF-1~20; SI, Figure S8). By combining HMBC, HSQC, and COSY as well as HR-MS data unambiguous elucidated fifteen 5-OH flavonoids from these mixtures without further purification (Figure 5), including the new 6-prenyl-licoisoflavanone, 1, and 4+7 previously unknown from GU. The structural diversity of three isoflavonones (1‒3) and twelve isoflavones (4‒15) partitioned into six subtypes (I-1 [2], I-2 [3], I-3 [1], II-1 [10], II-2 [11‒15], and II-3 [4‒8]) according to HMBC patterns (SI, Table S5), demonstrating that the LFR-bearing bulk metabolome in nine GU-MFs (11, 12, 14‒20) contained fifteen compounds (Figure 6A). While the LFR signal of 9 resonated in the type II-3 region, its HMBC spectrum revealed that the 5-OH to C-5/6/10 cross-peak pattern differed from the others in the group. Particularly C-5 exhibited a ~2 ppm upfield shift. Detailed analysis of its HMBC correlations elucidated 9 as a 6,8-diprenyl flavonoid.
Figure 5.
The 15 identified metabolites in GU-MF-11, 12, and 14~20.
Figure 6.
LFR of the 1H NMR spectra of GU-MF and its fractions GU-MF-11, 12, and 14~20 with assignments of the 15 identified flavonoids (A) and expansions of the 1H and HMBC spectra (500 MHz) of GU-MF-11 (B).
Structure Elucidation of 5-OH Flavonoids
The structural types of 3, 11, 14, and 13 were assigned via 1H and HMBC spectra (SI, Figures S17‒21, S24) of GU-MF-11 (Figure 6B), as four major 5-OH flavonoids: one subtype I-2 5,7-dihydroxy (iso)flavonone (δH 12.28, 1H, s, 5-OH, δC 163.9, C-5; 96.0, C-6; 102.1, C-10), and three subtype II-2, 5,7-dihydroxy (iso)flavones (δH 12.84, 1H, s, 5-OH with δC 162.0, C-5; 98.9, C-6; 104.7, C-10; δH 12.94, 1H, s, 5-OH with δC 162.0, C-5; 99.1, C-6; 104.5, C-10; and δH 12.99, 1H, s, 5-OH with δC 162.0, C-5; 99.0, C-6; 104.6, C-10). The four 5-OH signals could be assigned to 3 (δH 12.28), 11 (δH 12.84), 14 (δH 12.94), and 13 (δH 12.99) on the basis of peak area ratios and HMBC correlations.
The 1H and HSQC spectra of GU-MF-11 (Figures S17‒21 and S23) revealed one methylene (δH 4.52, 1H, t, J = 11.0 Hz, H-2a; 4.41, 1H, dd, J = 11.0, 5.5 Hz, H-2b; δC 69.6, C-2), one methine (δH 4.28, 1H, dd, J = 11.0, 5.5 Hz, H-3; δC 46.2, C-3), two AB-coupled aromatic (δH 6.27, 1H, d, J = 8.3 Hz, H-5’; 6.83, 1H, d, J = 8.3 Hz, H-6’; δC 107.7, C-5’; 129.9, C-6’), and one pair of olefinic hydrogens (δH 6.68, 1H, d, J = 10.0 Hz, H-1”; 5.67, 1H, d, J = 10.0 Hz, H-2”; δC 116.8, C-1”; 128.9, C-2”). Their peak areas matched that of the δH 12.28 singlet. The COSY spectrum confirmed the presence of three spin systems (SI, Figure S22, bold bonds). HMBC correlations (SI, Figure S24) from H-5’ to C-1’ (δC 115.6), C-3’ (δC 110.3), and C-4’ (δC 152.7); from H-6’ to C-2’ (δC 150.7) and C-4’ (δC 152.7) established the 1’,2’,3’,4’-tetra-substituted B-ring of 3. The HMBC cross-peaks from H-1” to C-2’ (δC 150.7), C-4’ (δC 152.7), and C-3” (δC 75.2), and from H-2” to C-3’ (δC 110.3) and C-3” (δC 75.2) revealed that the 3’-prenyl group in 3 was cyclized. While 2’-OH vs 4’-OH cyclization could not be distinguished directly from the acquired NMR data, comparison with data reported for licoisoflavonone24 showed a close match in the B-ring resonances. Therefore, the B-ring prenyl of 3 had a connection with 4’-OH. Considering the negative high resolution ESIMS (SI, Figure S27) at m/z 353.1045 [M − H]− (calcd for C20H17O6-, 353.1031), 3 was identified as licoisoflavanone.24
The HSQC spectrum of GU-MF-11 (SI, Figure S23) revealed three 1H-integral singlets (δH-2 8.11, 8.30, 8.23; δC-2 155.4, 154.0, 153.8, respectively) with the same peak area as δ5-OH at 12.84 in 11, 12.94 in 14, and 12.99 in 13, respectively, indicating 11, 14, and 13 to be isoflavones. The COSY and HSQC spectra (SI, Figures S22 and S23) exhibited two AB-coupled aromatic hydrogens for the B-ring of 11 (δH 6.38, 1H, d, J = 8.2 Hz, H-5’; 6.75, 1H, d, J = 8.2 Hz, H-6’; δC 106.6, C-5’; 128.5, C-6’), and AX aromatic systems in the B-rings of 14 (δH 6.91, 1H, brs, H-2’; 6.72, 1H, brs, H-6’; δC 116.8, C-2’; 117.3, C-6’) and 13 (δH 6.88, 1H, brs, H-2’; 6.68, 1H, brs, H-6’; δC 113.8, C-2’; 120.3, C-6’). This established 1’,2’,3’,4’ vs. 1’,3’,4’,5’ tetra-substituted B-rings in 11 vs. 14 and 13, respectively. Further proof came from HMBC correlations (SI, Figure S24): in 11, from H-5’ to C-1’ (δC 115.4), C-3’ (δC 109.4), and C-4’ (δC 156.4); and from H-6’ to C-3 (δC 121.1), C-2’ (δC 153.8), and C-4’ (δC 156.4); in 14, from H-2’ to C-3 (δC 122.2), C-3’ (δC 145.2), C-4’ (δC 140.1), and C-6’ (δC 117.3), and from H-6’ to C-3 (δC 122.2), C-2’ (δC 116.8), C-4’(δC 140.1), and C-1” (δC 121.8); and in 13, from H-2’ to C-3’ (δC 144.2), C-4’ (δC 143.1), and C-6’ (δC 120.3), and from H-6’ to C-2’ (δC 113.8), C-4’ (δC 143.1), and C-1” (δC 28.1). One double bond (δH 6.37, 1H, d, J = 9.7 Hz, H-1”; 5.74, 1H, d, J = 9.7 Hz, H-2”; δC 121.8, C-1”; 131.1, C-2”) indicated that 14 carrying a 2,2-dimethylpyran ring like in semilicoisoflavone B.24 Taking into account the high resolution ESI-MS ions at m/z 353.1034 [M − H]− (calcd for C20H17O6-, 353.1031) for 11 and 13, and m/z 351.0869 [M − H]− (calcd for C20H15O6- 351.0874) for 14 (SI, Figures S26, S28 and S29), their structures were determined as licoisoflavone A (11),24 semilicoisoflavone B (14),24 and glycyrrhisoflavone (13).25
Structure Verification of 5-OH Flavonoids
Using analogous methodology as for 3, 11, 13, and 14 in GU-MF-11, the 1H and HMBC spectra (SI, Figures S69, S70, S73) of GU-MF-18 identified 1 as a major 5,7-dihydroxy-6-prenyl (iso)flavanone of subtype I-3. Its elucidation as a 5,7-dihydroxy-6-prenyl isoflavanone from its NMR and MS data (SI, Figures S69‒75) was corroborated by purifying 1 from GU-MF-18 via Sephadex LH-20 gel chromatography and subsequent NMR and MS data analysis (GU-MF-18–1; SI, Figures S76‒83). Although licoisoflavanone C26 was reported recently with planar structure identical to 1, the NMR data were different (SI, Tables S1+S2). Careful re-analysis of the reported 1D/2D NMR spectra of licoisoflavanone C (SI in ref. 26) revealed that its structure should be revised to that of relicoisoflavanone C (SI, Tables S1+S2, Figures S2 and S4). This prompted re-analysis of licoisoflavanone B with the current methodology: considering its planar structure given in ref. 26, its 5-OH chemical shift should lead to subtype I-1 classification (12.08–12.27 ppm). However, the reported LSR of δH 12.57, fell outside the subtype I-1 interval (12.08–12.27 ppm) and rather into the subtype I-3 group (12.41–12.59 ppm). After detailed re-analysis of the 1D and 2D NMR data of licoisoflavanone B from the SI in ref. 26, and comparison with data of relicoisoflavanone C and 1 (SI, Tables S1 and S2, Figures S1 and S3), the structure of licoisoflavanone B should be revised to 1 and consistently named as relicoisoflavanone B. These cases demonstrate that the LFR HMBC methodology can quickly verify the types and even the full structures of 5-OH flavonoids, ultimately by comparison of just the 5-OH chemical shifts when backed by comprehensive HMBC data.
Metabolomic Perspectives from HMBC Patterns
Prior reviews of 1H NMR data of flavones,27 isoflavones,28 and flavanones29 concluded that the chemical shifts of 5-OH hydrogens in isoflavones are indicative of C-6 or C-8 prenylation.30,31 However, exact δ differences have not been reported, neither has such a diagnosis been attempted for all structural types I~III, including (iso)flav(an)ones and chalcones. The present study closes this gap by providing structural evidence for 5-OH (iso)flavanones (type I; 3 subtypes), 5-OH (iso)flavones (type II; 3 subtypes), and 2’-OH chalcones (type III; 2 subtypes) from licorice species. Utilizing a combination of literature mined and experimental data, we demonstrate below that the shifts of the readily accessible singlets of the 5-/2’-OH LFR hydrogens and their three HMBC correlating carbons permit the identification of individual metabolites, even in a complex mixture.
Additional variants of 5,7-/2’,4’-diOH phenols reported from licorice are: flavonols,24,32,33 their 3-O-methyl derivatives24,33 and 3-O-glycosides,34,35 dihydrochalcones, and α–hydroxyl dihydrochalcones.36 While flavanonols have not been reported from licorice, they were also considered in this study to achieve a more comprehensive metabolomic coverage. Mapping of their structural diversity used literature NMR data from structures with identical A- and B-rings (SI, Figure S7) and revealed the following types and characteristic LFR shifts: flavanone (δH 12.20),37 isoflavanone (δH 12.18),38 flavanonol (δH 11.92),39 flavone (δH 12.95),40 isoflavone (δH 12.95),24 flavonol (δH 12.48),24 its 3-O-methyl derivative (δH 12.70),41 its 3-O-glycoside (δH 12.60),42 dihydrochalcone (δH 12.63),43 chalcone (δH 13.58),24 and α–hydroxyl dihydrochalcone (δH 12.20).44 This indicated that differences in 5-/2’-OH hydrogen bonding and deshielding effects of adjacent groups generate relatively narrow, diagnostic 1H chemical shift regions for the LFR hydrogens of almost all structural types. Exceptions are flavanones and α–hydroxyl dihydrochalcones, exhibiting LFR overlap. HMBC data can act as a valuable supplementary method by distinguishing structural types with LFR region overlap, provided the three correlating carbons are sufficiently different.37,38,45 Current limitations are posed by flavanones vs. isoflavanones, which share close chemical shifts in both the 5-O1H and the three corresponding 13C resonances,37,38 and, to a lesser degree, flavones vs. isoflavones, which have a noticeable but small (~1 ppm) chemical shift difference for C-10.24,40
C-glycosides of 5,7-dihydroxy-flavones (6-/8-mono-C- and 6,8-di-C-glycosides) are another major class of licorice phenols.24,35,46–48 While structurally distinct from types I~III, their 5-OH chemical shifts are coincidentally similar to those of subtypes III-1 and II-3, but can still be distinguished by their HMBC patterns. An example is the common NPs, isovitexin (6-C) and vitexin (8-C), which have been found in GG.47,48 While the LFR hydrogen of isovitexin49 (δH 13.53, 5-OH) resonates together with subtype III-1 metabolites (13.40~13.64 ppm, 2’-OH), its HMBC pattern (δC C-5, 161.2, C-6, 108.8, C-10, 103.4; type III-1: δC C-2’, 165.8, C-3’, 102.6, C-1’, 113.0) distinguish it readily from vitexin49 (δH 13.14, 5-OH; δC C-5, 161.0, C-6, 98.1, C-10, 104.0) as well as from subtype II-3 metabolites (δH 13.07‒13.28, 5-OH; δC C-5, 158.8, C-6, 110.9, C-10, 104.2).
Factors Driving LFR Chemical Shift Dispersion
To achieve a theoretical explanation for effects that drive the distinct LFR chemical shift patterns in the environment of the 5-/2’-O1H hydrogens in the type I‒III phenols, three model compounds with identical A- and B-rings were studied by Natural Bond Orbital analysis (Figure 3B): pinocembrin (Y1, type I, δ5-OH 12.10),50 chrysin (Y2, type II, δ5-OH 12.80),51 and 2’,4’-dihydroxy-chalcone (Y3, type III, δ2’-OH 13.40).52 The results (SI, Table S6) showed that the second-order stabilization energies increase as the hydrogen bond length decreases from Y1 to Y2 and Y3. This is consistent with the observed increase of δ5-/2’-OH in the same order. Interestingly, the 5-/2’-OH hydrogen electron density is less important than expected as the calculated natural charges did not correlate with the NMR observations.
Reference-independent Metabolome Quantification by qHNMR
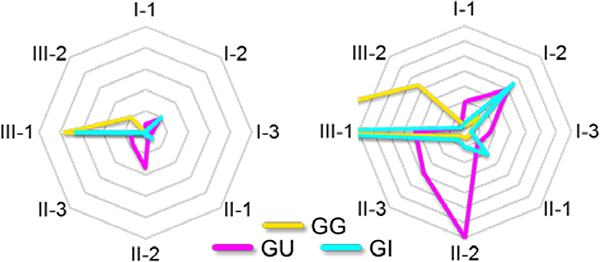
Simultaneous identification and quantification capabilities make 2D NMR/qNMR a great tandem for metabolomic analysis in biomedical botanical standardization. Even without absolute external and/or internal calibration (EC/IC/ECIC), the relative qHNMR method53 can generate meaningful quantitative profiles of all detected metabolomes by calculating the molar fraction of all detected metabolites, as the inherent response factor in qNMR is unity, making 100% rel-qHNMR a literal “omics” method. Thus, as summarized in the radar graphs in Figure 7, the accessibility and simplicity of the 5-/2’-OH LFR singlets of the flavonoids and chalcones (“flavonome”) provides direct access to both the ratios of all (sub)types of licorice phenols (SI, Tables S4 and S10), as well as the relative concentration of each individual metabolite within the flavonome. Notably, structural (sub)type distribution in the G. species is highly diagnostic: in GI, subtypes I-2 (20%) and III-1 (66%) alone comprise 86% of the flavonome. While GG also has two main subtypes, III-1 at 76% and III-2 at 20%, one subtype and their ratio differ remarkably from GI. The GU distribution pattern contrasts both GI and GG with a much larger and quantitatively almost evenly distributed flavonome diversity, containing seven of eight subtypes: 33% of II-2, 4~18% of the others. Collectively, extension of HMBC pattern flavonoid (sub)type identification with qHNMR analysis established joint qualitative/quantitative relationships reflecting distribution and abundance of each (sub)type. Visualized as discerning patterns (Figure 7), they readily distinguish all investigated G. species.
Figure 7.
Radar graphs show the relative abundance (scaled to 100% [left] and 33% [right]) of the eight structural subtypes (I-1/2/3, II-1/2/3, III-1/2) in fractions MF of the three Glycyrrhiza species, GU (magenta), GG (orange), and GI (cyan).
Moreover, absolute quantitation (in μM) of individual metabolites was achieved via combined external and internal calibration (ECIC) qHNMR, where each deconvoluted LFR resonance area was related to that of the residual solvent signal as IC, calibrated via non-deuterated DMSO as EC.23 The singlet character of the LFR resonances facilitated their deconvolution via Lorentzian-Gaussian line fitting, which generated 318 quantifiable signals in the 2.3 ppm LFR interval. Fitting outcomes showed that their signal-to-noise ratio (SNR) was not only linear to absolute area (SI, Absolute Quantitation), but also meaningful for qNMR validation: 287 of the 318 fitted signals had SNRs above the LOD, 158 above the LOQ.54 As LFR hydrogens are strongly H-bound and lack detectable (long-range) H,H coupling, only sharp singlets with a width at their base of <3.0 Hz were deemed suitable and reflecting single metabolites. Thus, the enriched fraction, GU-MF, contained 158 qNMR-quantifiable flavonoids/chalcones. Their molarities ranged from 199.9 to 1.1 μM, with an average concentration of 18.2 μM. Notably, the chemical shifts of the LFR signals of the 15 metabolites identified via HPLC subfractionation and HMBC pattern analysis (SI, Structure Elucidation of 5-OH Flavonoids) matched within 0.02 ppm and exhibited concentrations of 164.0~14.7 μM.
Finally, each absolute amount of all 15 unambiguously identified metabolites was determined using deconvoluted peak areas generated from the above line fittings: the most abundant metabolite in GU-MF, licoisoflavone B (12), was present at 164.02 μM, i.e., 34.67 μg (0.14% w/w) in the NMR sample, the least abundant, angustone B (4), was only 3.49 μg (0.01%). The total concentration of all 15 metabolites was 1109.23 μM, thus accounting for 38.5% of the flavonome. Interestingly, when using the average molecular weight of the 15 metabolites to estimate the total flavonome content, they would be much underestimated at only 0.66 mg (2.60% w/w) of the NMR sample.
Dynamic Residual Complexity of Flavonomes
While metabolite loss due to irreversible absorption in solid phase chromatography remains one major challenge in analytical chemistry, additional variations can result from dynamic change of metabolites during the isolation procedure (Dynamic Residual Complexity), associated with both losses and gains that are particularly significant for trace metabolites. This study provides supporting evidence for this conclusion as, e.g., the two major signals at 13.538 and 12.177 ppm (Figure 4, highlighted with asterisks, 12.7% total flavonome content), did not have detectable counterparts in the HPLC subfractions (Figure 6A). Based on the mined HMBC patterns, the 13.538 ppm signal was likely a type III 2’-OH chalcone, making it highly likely that interconversion to a flavanone and loss of the 5-OH function occurred during sample handling and purification.55–57 Although the 12.177 ppm signal was located in the type I region, its ca 100 ppm HMBC cross-peak did not match the type I-typical pattern. In fact, it indicated that the metabolite did not belong to any of the eight structural types covered by the mined and available experimental data. Although this structure could not be elucidated unambiguously, it could be deduced that it possesses a β-OH keto substructure, which is sufficiently reactive to interconvert to another type of metabolites under loss of the LFR O1H signal. One plausible structure is that of a chalcone with different substitution than those captured by types I~III. To confirm this, future studies would have to employ particularly careful sample handling to minimize dynamic chemical changes.
CONCLUSIONS
Notably, the number of metabolites detectable by direct qNMR of crude and enriched samples (Figure 4) was greater than the preparative HPLC isolation yield. Collectively, this nurtures the general conception that compounds that typically are isolated and, thus, reported from plant extracts are mostly major and stable metabolites. This has important implications for NP discovery and biomedical research: while required for unambiguous structural assignment, isolates represent a limited fraction of the plant metabolome. These abundance and chemical stability constraints conversely limit not only the coverage of chemical complexity achievable for any investigated organism, but also the accessible bandwidth of the biological profiles, especially in the relatively likely case where a trace component with elevated potency turns out to be the active component.58 This highlights an important application of the presented HMBC and qHNMR metabolomic approach for the study of complex bioactives.
While often overlooked, phenolic hydroxyl groups capable of strong intramolecular H-bonding are powerful analytical tools: giving rise to “true singlet” LFR signals, they are highly valuable targets for metabolomic NMR analysis. Their apparent information deficiency is a misconception: as shown, combined LFR-HMBC-qNMR enables the simultaneous ID and quantification of many flavonome chemotypes, without need for prior high-resolution separation and/or isolation of identical calibrants. As demonstrated for the three pharmacopoeial licorice species, this methodology can transform genus-specific botanical integrity analysis, particularly for (poly)phenol-rich genera.
The presented LFR-HMBC-qNMR approach also advances the identification of unknowns, a major obstacle in metabolomics. It has application potential in metabolomic structural analysis as it connects simple, highly disperse NMR signals from readily accessible 1D 1H NMR experiments with structurally distinct information gleaned from long-range correlating 13C resonance patterns. Successive qNMR analysis can translate this advanced NMR-based metabolite ID into quantitative information, taking full advantage of the unity response factor and calibration capabilities (relative/EC/IC/ECIC) of qNMR.
The ability to characterize the majority of natural flavonomes, 5-OH flavonoids and 2’-OH chalcones, qualitatively and quantitatively, in complex mixtures, and in a single analysis advances metabolomic analysis of plant (poly)phenols (“flavonomics”) and readily adoptable to other taxa. As demonstrated, LFR-qNMR enables the unprecedented metabolomic botanical standardization for >150 compounds and can go beyond the unambiguously identified metabolites (15 flavonoids in the present study) via the structural assignments.
Finally, the essential role of reported NMR data, used to build the HMBC patterns and elucidate/verify structures, highlights the critical importance of unambiguous assignments and sharing of interpreted, digital, and raw NMR data in analytical, organic, and NPs chemistry.59 Considering that flavonoids/chalcones are highly studied metabolites, the expansion of their (NMR) knowledge base and organized data collections bears a potential for immediate application, including in biomedicine.
Supplementary Material
ACKNOWLEDGMENT
This research was supported by ODS, NCCIH, and NIGMS/NIH through grants P50 AT000155 and P41 GM068944. The 500 MHz NMR spectrometer (GXIB) was partially funded by the Bagui Scholar Program, Guangxi Zhuang Autonomous Region, China.
Footnotes
Notes
The authors declare no competing financial interest.
This paper represents part 36 of the series on Residual Complexity and Bioactivity (go.uic.edu/residualcomplexity).
Supporting Information
The Supporting Information is available free of charge on the ACS Publications website at DOI: [10.10.21/tbd]. Details of the experimental workflow and structure elucidation/verification. Raw NMR data (FIDs) and qNMR calculation spreadsheets are made available at DOI:10.7910/DVN/NFQNJQ.
REFERENCES
- (1).Bingol K; Brüschweiler R Two Elephants in the Room: New Hybrid Nuclear Magnetic Resonance and Mass Spectrometry Approaches for Metabolomics. Curr. Opin. Clin. Nutr. Metab. Care 2015, 18 (5), 471–477. [DOI] [PMC free article] [PubMed] [Google Scholar]
- (2).Ulrich EL; Akutsu H; Doreleijers JF; Harano Y; Ioannidis YE; et al. BioMagResBank. Nucleic Acids Res. 2008, 36 (Database), D402–D408. [DOI] [PMC free article] [PubMed] [Google Scholar]
- (3).Wishart DS; Jewison T; Guo AC; Wilson M; Knox C; et al. HMDB 3.0--The Human Metabolome Database in 2013. Nucleic Acids Res. 2013, 41 (D1), D801–D807. [DOI] [PMC free article] [PubMed] [Google Scholar]
- (4).Cui Q; Lewis IA; Hegeman AD; Anderson ME; Li J; et al. Metabolite identification via the Madison Metabolomics Consortium Database. Nat. Biotechnol. 2008, 26, 162–164. [DOI] [PubMed] [Google Scholar]
- (5).Bingol K; Bruschweiler-Li L; Li D; Zhang B; Xie M; Brüschweiler R Emerging New Strategies for Successful Metabolite Identification in Metabolomics. Bioanalysis 2016, 8 (6), 557–573. [DOI] [PMC free article] [PubMed] [Google Scholar]
- (6).Robinette SL; Brüschweiler R; Schroeder FC; Edison AS NMR in Metabolomics and Natural Products Research: Two Sides of the Same Coin. Acc. Chem. Res. 2012, 45 (2), 288–297. [DOI] [PMC free article] [PubMed] [Google Scholar]
- (7).Pietta P-G Flavonoids as Antioxidants. J. Nat. Prod. 2000, 63 (7), 1035–1042. [DOI] [PubMed] [Google Scholar]
- (8).Daglia M Polyphenols as Antimicrobial Agents. Curr. Opin. Biotechnol. 2012, 23 (2), 174–181. [DOI] [PubMed] [Google Scholar]
- (9).Azimova SS; Vinogradova VI Natural Compounds: Flavonoids; Springer New York: New York, NY, 2013. [Google Scholar]
- (10).Nam J-W; Phansalkar RS; Lankin DC; Bisson J; McAlpine JB; et al. Subtle Chemical Shifts Explain the NMR Fingerprints of Oligomeric Proanthocyanidins with High Dentin Biomodification Potency. J. Org. Chem. 2015, 80 (15), 7495–7507. [DOI] [PMC free article] [PubMed] [Google Scholar]
- (11).Phansalkar RS; Nam J-W; Chen S-N; McAlpine JB; Napolitano JG; et al. A Galloylated Dimeric Proanthocyanidin From Grape Seed Exhibits Dentin Biomodification Potential. Fitoterapia 2015, 101, 169–178. [DOI] [PMC free article] [PubMed] [Google Scholar]
- (12).Rao VSR; Foster JF On the Conformation of the D-Glucopyranose Ring in Maltose and in Higher Polymers of D-Glucose. J. Phys. Chem. 1963, 67 (4), 951–952. [Google Scholar]
- (13).Charisiadis P; Kontogianni VG; Tsiafoulis CG; Tzakos AG; Gerothanassis IP Determination of Polyphenolic Phytochemicals Using Highly Deshielded –OH 1H-NMR Signals. Phytochem. Anal. 2017, 28 (3), 159–170. [DOI] [PubMed] [Google Scholar]
- (14).Charisiadis P; Exarchou V; Troganis AN; Gerothanassis IP Exploring the “Forgotten”–OH NMR Spectral Region in Natural Products. Chem. Commun. 2010, 46 (20), 3589–3591. [DOI] [PubMed] [Google Scholar]
- (15).Exarchou V; Troganis A; Gerothanassis IP; Tsimidou M; Boskou D Do strong intramolecular hydrogen bonds persist in aqueous solution? Variable temperature gradient 1H, 1H–13C GE-HSQC and GE-HMBC NMR studies of flavonols and flavones in organic and aqueous mixtures. Tetrahedron 2002, 58 (37), 7423–7429. [Google Scholar]
- (16).Zangger K Pure shift NMR. Prog. Nucl. Magn. Reson. Spectrosc. 2015, 86–87, 1–20. [DOI] [PubMed] [Google Scholar]
- (17).Qiu F; McAlpine JB; Lankin DC; Burton I; Karakach T; et al. 2D NMR Barcoding and Differential Analysis of Complex Mixtures for Chemical Identification: The Actaea Triterpenes. Anal. Chem. 2014, 86 (8), 3964–3972. [DOI] [PMC free article] [PubMed] [Google Scholar]
- (18).Zhang Q; Ye M Chemical Analysis of the Chinese Herbal Medicine Gan-Cao (licorice). J. Chromatogr. A 2009, 1216 (11), 1954–1969. [DOI] [PubMed] [Google Scholar]
- (19).Hajirahimkhan A; Simmler C; Dong H; Lantvit DD; Li G; et al. Induction of NAD(P)H:Quinone Oxidoreductase 1 (NQO1) by Glycyrrhiza Species Used for Women’s Health: Differential Effects of the Michael Acceptors Isoliquiritigenin and Licochalcone A. Chem. Res. Toxicol. 2015, 28 (11), 2130–2141. [DOI] [PMC free article] [PubMed] [Google Scholar]
- (20).Dunlap TL; Wang S; Simmler C; Chen S-N; Pauli GF; et al. Differential Effects of Glycyrrhiza Species on Genotoxic Estrogen Metabolism: Licochalcone A Downregulates P450 1B1, whereas Isoliquiritigenin Stimulates It. Chem. Res. Toxicol. 2015, 28 (8), 1584–1594. [DOI] [PMC free article] [PubMed] [Google Scholar]
- (21).Simmler C; Jones T; Anderson JR; Nikolić DC; van Breemen RB; et al. Species-specific Standardisation of Licorice by Metabolomic Profiling of Flavanones and Chalcones. Phytochem. Anal. 2014, 25 (4), 378–388. [DOI] [PMC free article] [PubMed] [Google Scholar]
- (22).Simmler C; Napolitano JG; McAlpine JB; Chen S-N; Pauli GF Universal Quantitative NMR Analysis of Complex Natural Samples. Curr. Opin. Biotechnol. 2014, 25, 51–59. [DOI] [PMC free article] [PubMed] [Google Scholar]
- (23).Mo H; Raftery D Solvent Signal as an NMR Concentration Reference. Anal. Chem. 2008, 80 (24), 9835–9839. [DOI] [PMC free article] [PubMed] [Google Scholar]
- (24).Ji S; Li Z; Song W; Wang Y; Liang W; et al. Bioactive Constituents of Glycyrrhiza uralensis (Licorice): Discovery of the Effective Components of a Traditional Herbal Medicine. J. Nat. Prod. 2016, 79 (2), 281–292. [DOI] [PubMed] [Google Scholar]
- (25).Salem MM; Werbovetz KA Isoflavonoids and Other Compounds from Psorothamnus arborescens with Antiprotozoal Activities. J. Nat. Prod. 2006, 69 (1), 43–49. [DOI] [PubMed] [Google Scholar]
- (26).Lin Y; Kuang Y; Li K; Wang S; Ji S; Chen K; Song W; Qiao X; Ye M Nrf2 Activators From Glycyrrhiza inflata and Their Hepatoprotective Activities against CCl4-induced Liver Injury in Mice. Bioorg. Med. Chem. 2017, 25 (20), 5522–5530. [DOI] [PubMed] [Google Scholar]
- (27).Fukai T; Nomura T Revised Structures of Albanins D and E, Geranylated Flavones from Morus alba. Heterocycles 1991, 32 (3), 499–510. [Google Scholar]
- (28).Fukai T; Wang Q-H; Takayama M; Nomura T Structures of Five New Prenylated Flavonoids, Gancaonins L, M, N, O, and P from Aerial Parts of Glycyrrhiza uralensis. Heterocycles 1990, 31 (2), 373–382. [Google Scholar]
- (29).Fukai T; Nomura T Structure of 6- or 8-Isoprenoid Substituted Flavanone: Chemical Shift of the Hydrogen-bonded Hydroxyl Group. Heterocycles 1990, 31 (10), 1861–1872. [Google Scholar]
- (30).Fukai T; Nishizawa J; Nomura T Variations in the Chemical Shift of the 5-Hydroxyl Proton of Isoflavones; Two Isoflavones from Licorice. Phytochemistry 1994, 36 (1), 225–228. [Google Scholar]
- (31).Tahara S; Ingham JL; Hanawa F; Mizutani J 1H NMR Chemical Shift Value of the Isoflavone 5-hydroxyl Proton as a Convenient Indicator of 6-Substitution or 2’-Hydroxylation. Phytochemistry 1991, 30 (5), 1683–1689. [Google Scholar]
- (32).Yuldashev MP Flavonoids of the Epigeal Part of Glycyrrhiza uralensis. Chem. Nat. Compd. 1998, 34 (4), 508–509. [Google Scholar]
- (33).Jia SS; Liu D; Zheng XP; Zhang Y; Li YK Two New Isoprenyl Flavonoids from the Leaves of Glycyrrhiza uralensis Fisch. Chin. Chem. Lett. 1992, 3 (3), 189–190. [PubMed] [Google Scholar]
- (34).Bai H; Li W; Koike K; Pei Y; Dou D; et al. A New Prenylated Flavone from the Leaves of Glycyrrhiza uralensis Cultivated in China. Heterocycles 2004, 63 (9), 2091–2095. [Google Scholar]
- (35).Biondi DM; Rocco C; Ruberto G Dihydrostilbene Derivatives from Glycyrrhiza glabra Leaves. J. Nat. Prod. 2005, 68 (7), 1099–1102. [DOI] [PubMed] [Google Scholar]
- (36).Kuroda M; Mimaki Y; Honda S; Tanaka H; Yokota S; Mae T Phenolics from Glycyrrhiza glabra Roots and Their PPAR-γ Ligand-binding Activity. Bioorg. Med. Chem. 2010, 18 (2), 962–970. [DOI] [PubMed] [Google Scholar]
- (37).Jeon SH; Chun W; Choi YJ; Kwon YS Cytotoxic Constituents from the Bark of Salix hulteni. Arch. Pharm. Res. 2008, 31 (8), 978–982. [DOI] [PubMed] [Google Scholar]
- (38).Soidinsalo O; Wähälä K Synthesis of Phytoestrogenic Isoflavonoid Disulfates. Steroids 2004, 69 (10), 613–616. [DOI] [PubMed] [Google Scholar]
- (39).Zheng Z-P; Liang J-Y; Hu L-H Water-Soluble Constituents of Cudrania tricuspidata (Carr.) Bur. J. Integr. Plant Biol. 2006, 48 (8), 996–1000. [Google Scholar]
- (40).Li W; Dai R-J; Yu Y-H; Li L; Wu C-M; et al. Antihyperglycemic Effect of Cephalotaxus sinensis Leaves and GLUT-4 Translocation Facilitating Activity of Its Flavonoid Constituents. Biol. Pharm. Bull. 2007, 30 (6), 1123–1129. [DOI] [PubMed] [Google Scholar]
- (41).Hayashi K; Komura S; Isaji N; Ohishi N; Yagi K Isolation of Antioxidative Compounds from Brazilian Propolis: 3, 4-Dihydroxy-5-prenylcinnamic Acid, a Novel Potent Antioxidant. Chem. Pharm. Bull. 1999, 47 (11), 1521–1524. [Google Scholar]
- (42).Kishore PH; Reddy MVB; Gunasekar D; Murthy MM; Caux C; Bodo B A New Coumestan from Tephrosia calophylla. Chem. Pharm. Bull.) 2003, 51 (2), 194–196. [DOI] [PubMed] [Google Scholar]
- (43).Siddaiah V; Rao CV; Venkateswarlu S; Subbaraju GV A Concise Synthesis of Polyhydroxydihydrochalcones and Homoisoflavonoids. Tetrahedron 2006, 62 (5), 841–846. [Google Scholar]
- (44).Li N; Liu F; Ni H; Meng D; Zhang, et al. Isolation and Identification on Chemical Constituents of Residue of Glycyrrhiza inflata Batal. J. Shenyang Pharm. Univ 2011, 28 (5), 368–370, 379. [Google Scholar]
- (45).Acuña AU; Amat-Guerri F; Morcillo P; Liras M; Rodríguez B Structure and Formation of the Fluorescent Compound of Lignum nephriticum. Org. Lett. 2009, 11 (14), 3020–3023. [DOI] [PubMed] [Google Scholar]
- (46).Li W; Asada Y; Yoshikawa T Flavonoid Constituents from Glycyrrhiza glabra Hairy Root Cultures. Phytochemistry 2000, 55 (5), 447–456. [DOI] [PubMed] [Google Scholar]
- (47).Litvinenko VI; Kovalev IP Glycoflavonoids of Glycyrrhiza glabra I. Saponaretin and Vitexin. Chem. Nat. Compd. 1967, 3 (1), 47–48. [Google Scholar]
- (48).Naeem S; Shireen E; Bano K; Barlow DJ Ligand-based Screening of Chemical Constituents of Glycyrrhiza glabra in Search of Inhibitors of Xanthine Oxidase. Int. J. Biol. Biotechnol. 2012, 9 (3), 257–262. [Google Scholar]
- (49).Lin Y-L; Kuo Y-H; Shiao M-S; Chen C-C; Ou J-C Flavonoid Glycosides from Terminalia catappa L. J. Chin. Chem. Soc. 2000, 47 (1), 253–256. [Google Scholar]
- (50).An N; Yang S-L; Zou Z-M; Xu L-Z Flavonoids of Alpinia officinarum. Chin. Tradit. Herb. Drugs 2006, 37 (5), 663–664. [Google Scholar]
- (51).Wang J; Zhao B; Xu H; Zhao M; Tang W; et al. S. Study on Chemical Constituents of Scutelliaria regeliana. China J. Chin. Mater. Medica 2011, 36 (23), 3270–3275. [PubMed] [Google Scholar]
- (52).Zhang Y; Mei R; Liu X; Liu G; Wu B Chemical Constituents of Empetrum nigrum var. japonicum. Chin. Tradit. Herb. Drugs 2014, 45 (16), 2293–2298. [Google Scholar]
- (53).Pauli GF; Chen S-N; Simmler C; Lankin DC; Gödecke T; et al. Importance of Purity Evaluation and the Potential of Quantitative 1H NMR as a Purity Assay. J. Med. Chem. 2014, 57 (22), 9220–9231. [DOI] [PMC free article] [PubMed] [Google Scholar]
- (54).Gödecke T; Napolitano JG; Rodríguez-Brasco MF; Chen S-N; Jaki BU; et al. Validation of a Generic Quantitative 1H NMR Method for Natural Products Analysis. Phytochem. Anal. 2013, 24 (6), 581–597. [DOI] [PMC free article] [PubMed] [Google Scholar]
- (55).Shimokoriyama M Interconversion of Chalcones and Flavanones of a Phloroglucinol-type Structure. J. Am. Chem. Soc. 1957, 79 (15), 4199–4202. [Google Scholar]
- (56).Furlong JJP; Nudelman NS Mechanism of Cyclization of Substituted 2’-Hydroxychalcones to Flavanones. J. Chem. Soc. Perkin Trans. 2 1985, No. 5, 633–639. [Google Scholar]
- (57).Furlong JJP; Nudelman NS Cyclization of Substituted 2’-Hydroxychalcones to Flavanones. Solvent and Isotope Effects. J. Chem. Soc. Perkin Trans. 2 1988, No. 7, 1213–1217. [Google Scholar]
- (58).Choules MP; Bisson J; Gao W; Lankin DC; McAlpine JB; et al. Quality Control of Therapeutic Peptides by 1H NMR HiFSA Sequencing. J. Org. Chem. 2019, 84 (6), 3055–3073. [DOI] [PMC free article] [PubMed] [Google Scholar]
- (59).McAlpine JB; Chen S-N; Kutateladze A; MacMillan JB; Appendino G; et al. The Value of Universally Available Raw NMR Data for Transparency, Reproducibility, and Integrity in Natural Product Research. Nat. Prod. Rep. 2019, 36 (1), 35–107. [DOI] [PMC free article] [PubMed] [Google Scholar]
Associated Data
This section collects any data citations, data availability statements, or supplementary materials included in this article.


