

Abstract
Genetic-driven deregulation of the Wnt pathway is crucial but not sufficient for colorectal cancer (CRC) tumourigenesis. Here, we show that environmental glutamine restriction further augments Wnt signaling in APC mutant intestinal organoids to promote stemness and leads to adenocarcinoma formation in vivo via decreasing intracellular alpha-ketoglutarate (aKG) levels. aKG supplementation is sufficient to rescue low-glutamine induced stemness and Wnt hyperactivation. Mechanistically, we found that aKG promotes hypomethylation of DNA and histone H3K4me3, leading to an upregulation of differentiation-associated genes and downregulation of Wnt target genes, respectively. Using CRC patient-derived organoids and several in vivo CRC tumour models, we show that aKG supplementation suppresses Wnt signaling and promotes cellular differentiation, thereby significantly restricting tumour growth and extending survival. Together, our results reveal how metabolic microenvironment impacts Wnt signaling and identify aKG as a potent antineoplastic metabolite for potential differentiation therapy for CRC patients.
Keywords: colon cancer, Wnt signaling, glutamine, cancer metabolism, epigenetics
INTRODUCTION
Colorectal cancer (CRC) remains the second leading cause of cancer-associated deaths with more than a million people in the United States alone living with the disease 1. Hyperactivation of the Wnt pathway due to adenomatous polyposis coli (APC) mutations occur in 80% of human CRC and is a crucial initiating step in carcinogenesis that disrupts cellular differentiation and promotes rapid proliferation 2,3. However, genetic-driven Wnt deregulation only drives the formation of benign polyps and is insufficient to promote carcinoma 4,5. While the accumulation of mutations in other oncogenes and tumour suppressor genes has been implicated in CRC progression, emerging evidences suggest that non-genetic factors, such as the microenvironment, can contribute to optimal Wnt activation and support oncogenic transformation in CRC 6–9.
Colon cancer cells are subjected to diverse metabolic fluctuations in gut microenvironment, yet little is known about the role of metabolism in regulating Wnt signaling and CRC tumourigenesis. It is well established that overactive Wnt signaling through the regulation of metabolic enzymes and transcription factors can directly reprogram metabolic pathways to support rapid proliferation. For example, LEF/ TCF/ β-catenin transcription complexes through the upregulation of pyruvate dehydrogenase kinase 1 (Pdk1) and the lactate transporter (Mct1) can divert glycolytic glucose toward the production of lactate which stimulates angiogenesis at tumour sites 10,11. Consequently, Wnt-mediated aerobic glycolysis can render cancer cells more dependent on glutamine metabolism to meet an elevated bioenergetic demand and support the biosynthesis of macromolecules. A recent study demonstrates that human CRC tumours exhibit an increased uptake and catabolism of glutamine compared to healthy tissues consistent with this idea 12. Furthermore, around 30% of circulating glutamine is consumed in the gut, suggesting intestinal cells utilize exogenous glutamine as a preferred fuel source to support intestinal regeneration and integrity 13. Therefore, the increased glutamine dependency in CRC tumours, in addition to an already high glutamine demand by normal intestinal cells, may exhaust the local nutrient supply leading to intratumoural glutamine starvation. Glutamine catabolism in proliferative cells in part supports the biosynthesis of alpha ketoglutarate (aKG) to replenish TCA cycle intermediates 14. Importantly, glutamine and aKG levels have been shown to play an important role in metabolic homeostasis, reactive oxygen species (ROS) control and epigenetic regulation in both normal and cancer cells 15–17. While the Wnt pathway’s effect on metabolism is well established, it remains largely unknown how changing metabolism, such as glutamine levels, modulate oncogenic signaling pathways and cancer progression.
In this study, we measure how changing glutamine and aKG levels affects oncogenic Wnt signaling and cancer cell differentiation using primary intestinal organoids and CRC mouse models. We demonstrate that while low glutamine concentrations drive Wnt hyperactivation to enhance intestinal stemness and tumourigenicity, the supplementation of a glutamine-derived metabolite, aKG, is sufficient to suppress Wnt signaling and promotes terminal differentiation via epigenetic reprogramming. Collectively, we provide compelling evidence for the crucial role of glutamine and aKG homeostasis in regulating oncogenic Wnt signaling and CRC progression.
RESULTS
Environmental glutamine restriction hyperactivates Wnt signaling and blocks cellular differentiation
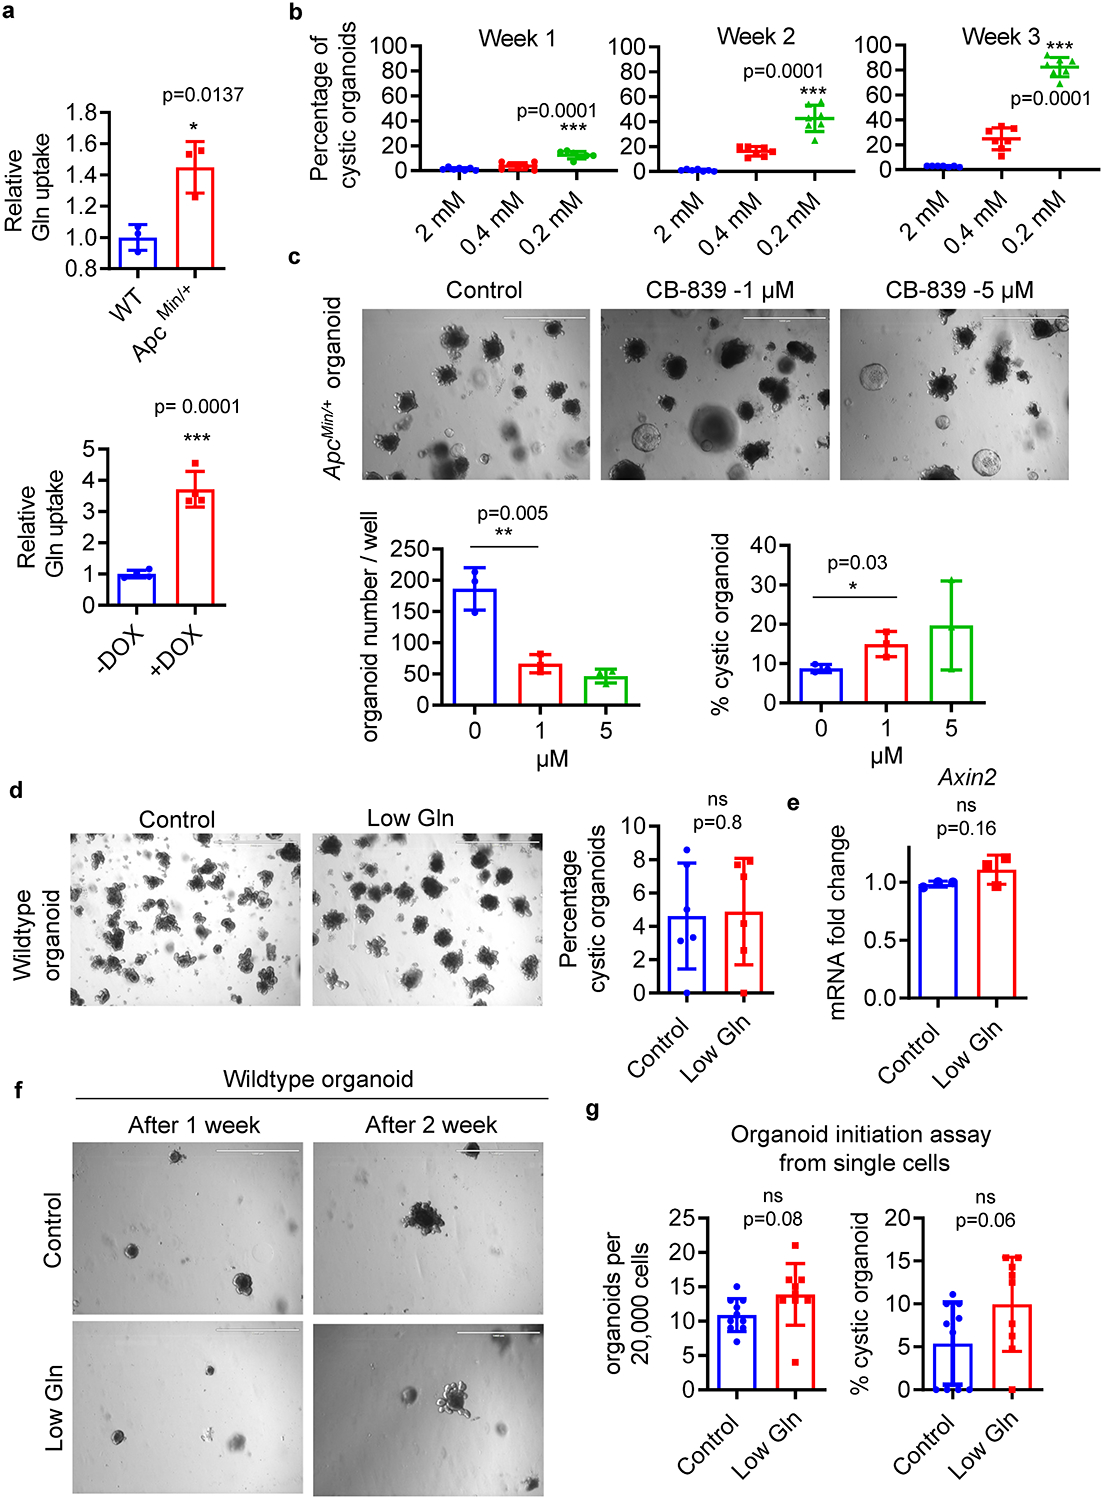
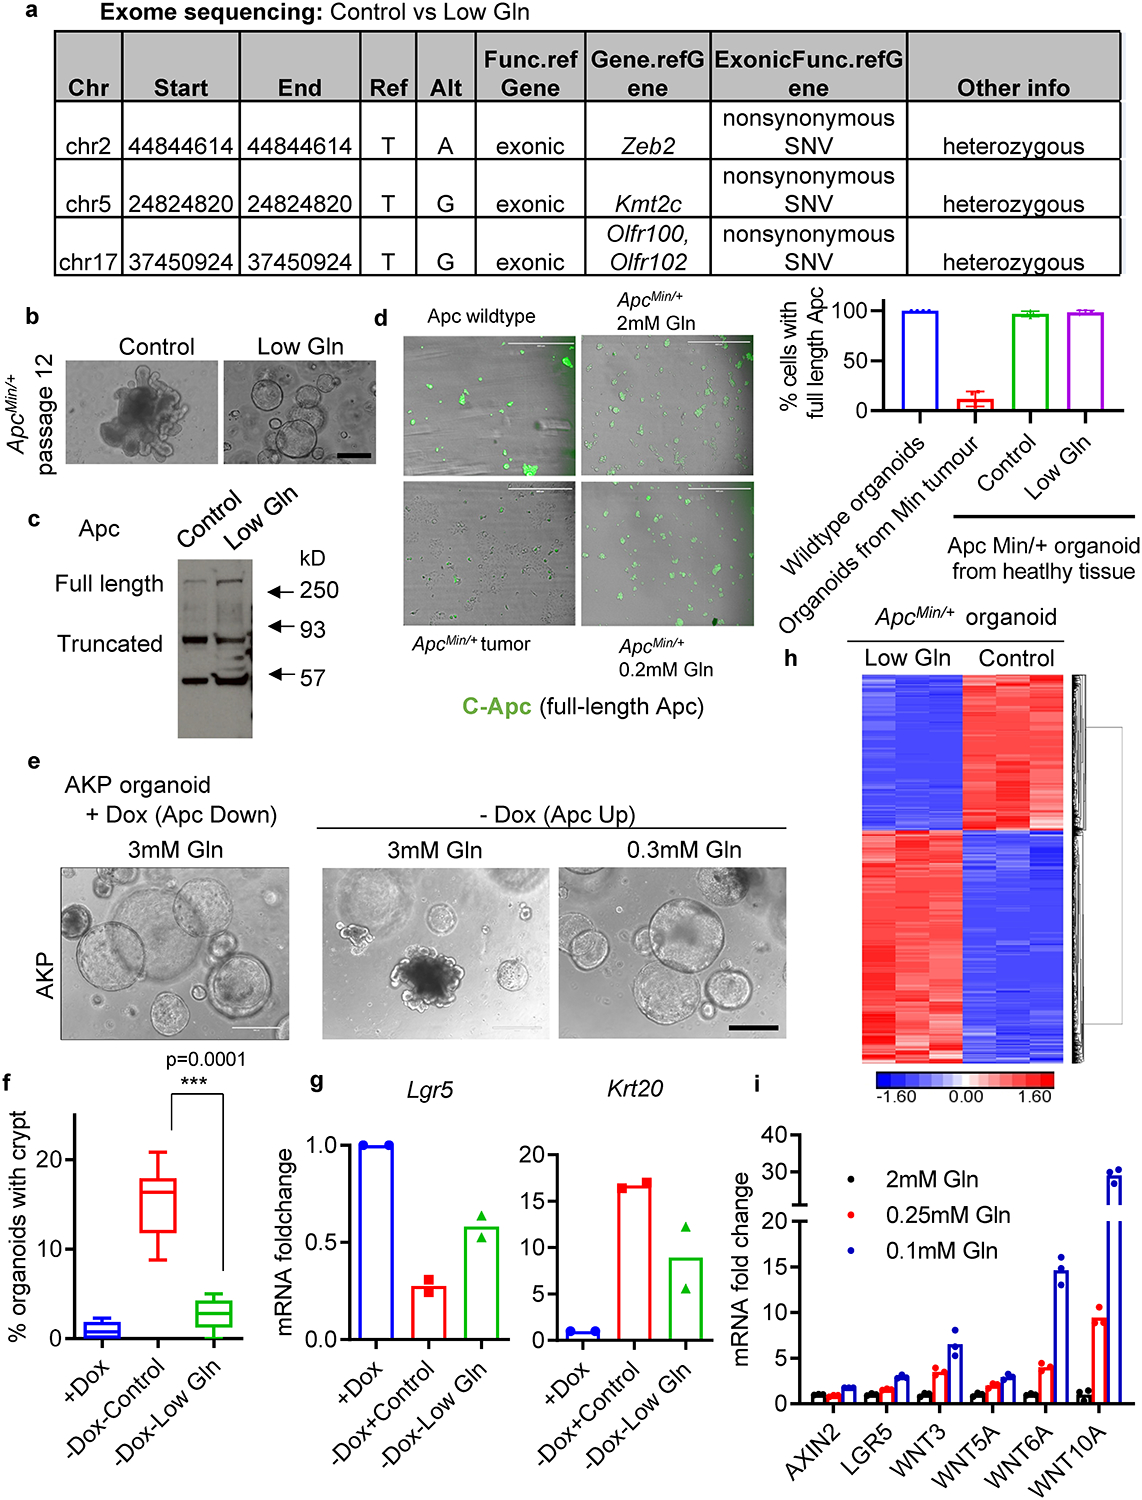
Accumulating evidence suggests colon cancer cells rapidly consume glutamine to support cell survival and proliferation 18. In agreement with this evidence, we found a significant increase in glutamine uptake in organoids with hyperactive Wnt signaling (Extended Data Fig. 1a). To determine potential changes in glutamine levels in CRC in vivo, we measured glutamine concentrations in mouse intestinal tumours. We observed that glutamine concentrations were significantly lower in intestinal tumours from heterozygous APC mutant (ApcMin/+) mice compared to healthy tissues (Fig. 1a). This phenomenon is also observed in human tumours and may be due to increased glutamine utilization in CRC tumour12,19. To examine how this environmental glutamine restriction influences CRC progression, we generated ApcMin/+ small intestinal organoids that recapitulate the genetic background of tumour-initiating cells. We found that low glutamine transformed ApcMin/+ organoids with well-defined crypts into cystic organoids, which are less differentiated, in a dose and time dependent manner (Fig. 1b and Extended Data Fig.1b) 20. We also observed a modest increase in the cystic phenotype of ApcMin/+ organoids treated with a glutaminase inhibitor (Extended Data Fig. 1c). In contrast, metabolic stress had minimal effects on cellular differentiation and the expression of Wnt target genes from wild-type organoids (Extended Data Fig. 1d–g). Further examination revealed that glutamine-starved ApcMin/+ organoids exhibit increased expression of the stem cell marker Lgr5 along with active β-catenin suggesting an increase in stemness (Fig. 1c). Moreover, expression of the differentiation marker Krt20 and activity of the alkaline phosphatase enzyme Alpi were reduced, indicating decreased cellular differentiation in response to glutamine starvation (Fig. 1d).
Figure 1. Environmental glutamine restriction hyperactivates Wnt signaling and blocks cellular differentiation.
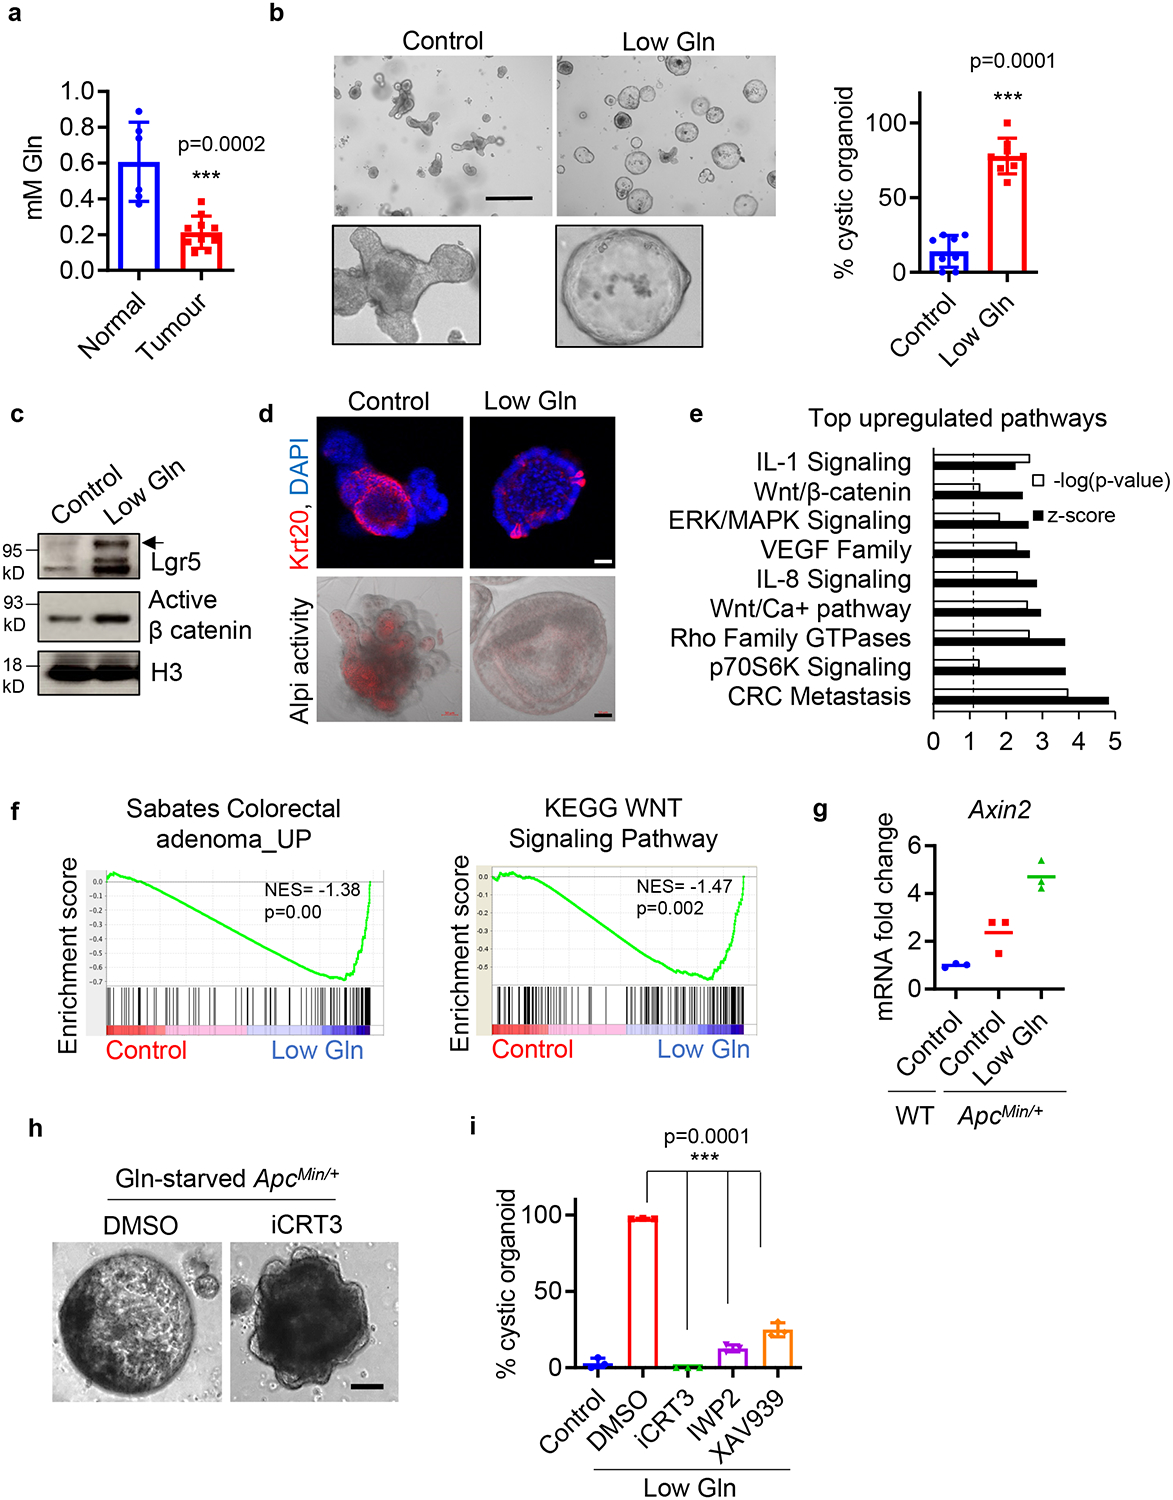
(a) Glutamine levels in intestinal tumours from ApcMin/+ mice (n=10 mice) and normal intestinal tissues of wildtype mice (n=6 mice). Data represent means ± SD, p value was determined by two-tailed unpaired Student’s t-test. (b) Representative brightfield images and percentage of cystic morphology in ApcMin/+ small intestine organoids cultured in control (3mM) or low glutamine (0.3 mM) medium after 4–6 passages (n=8 biologically independent cell cultures). Data represent means ± SD, p value was determined by two-tailed unpaired Student’s t-test. (c) Immunoblots for stem cell marker Lgr5 and active β catenin, the results are representative of two independent experiments. (d) Immunofluorescent images for intestinal differentiation markers Krt20 and Alpi enzyme activity in ApcMin/+ organoids cultured in control (3mM) or low glutamine (0.3 mM) medium. The results are representative of three biologically independent samples. (e) IPA analysis of top upregulated pathways and (f) GSEA analysis between control organoids versus glutamine-starved (1 week) organoids from RNA sequencing (n=3 biologically independent samples). Dotted line in e indicates threshold of significance (p = 0.05) and p values were determined by a Right-Tailed Fisher’s Exact Test. (g) qPCR analysis of Axin2 in wildtype organoids and ApcMin/+ organoids cultured in control and low glutamine (0.3 mM) medium. n= 3 technical replicates with a line marking the mean value. The experiment was repeated twice independently with similar results. (h) Representative brightfield images of glutamine-starved organoids treated with 5 μM iCRT3 for 1 week from three biologically independent samples. (i) Percentage of cystic organoids of control and glutamine-starved organoids treated with 10 μM of indicated Wnt inhibitors for 4 days (n=3 biologically independent samples). Data represent means ± SD and p values were determined by two-tailed unpaired Student’s t-test. Scale bars, 400 μm (b), 50 μm (d), 100 μm (h). Unprocessed gels for c and source data for a, b, g, i are available.
Using whole exome sequencing, we did not find genetic alterations in CRC driver pathways in glutamine-starved organoids, consistent with previous findings that cultured organoids are genetically and phenotypically stable (Extended Data Fig. 2a) 4. Thus, it appears that genetic instability and other mutations do not contribute to low-glutamine induced stemness. Moreover, we detected full-length wildtype Apc protein in glutamine-starved ApcMin/+ organoids (Extended Data Fig. 2b, c). Consistently, glutamine withdrawal did not reduce the percentage of cells expressing wildtype Apc based on immunofluorescence staining for the C-terminus of Apc, which specifically recognizes wildtype Apc protein (Extended Data Fig. 2d). Together, these data suggest glutamine deprivation induces stemness in heterozygous ApcMin/+ cells instead of providing a selective advantage for cells that lost the wild-type Apc allele. To further confirm that the effect of low glutamine on stemness is independent of Apc mutation status, we examined the effect of low glutamine on organoids with Apc knockdown, Kras activation and p53 deletion (AKP) in which Apc expression can be controlled by a doxycycline inducible Apc shRNA. Consistent with the finding in ApcMin/+ organoids, glutamine deprivation drastically delayed intestinal differentiation and maintained stemness, regardless of Apc status as observed via organoid morphology and gene expression (Extended Data Fig. 2e–g).
To better understand how low glutamine alters cellular differentiation, we performed whole transcriptome sequencing in ApcMin/+ organoids. We observed a global reprogramming of gene expression in intestinal organoids in response to glutamine restriction (Extended Data Fig. 2h). Pathway analyses revealed the top upregulated pathways in glutamine-starved organoids are associated with CRC progression or metastasis including Wnt, Mapk, Rho, Vegf, Il1 and Il8 (Fig. 1e) 21,22. Interestingly, glutamine-starved organoids displayed upregulation of CRC-associated genes and hyperactivation of Wnt signaling as determined by GSEA analysis and the expression of the Wnt target gene Axin2 (Fig. 1f, g). In addition, glutamine restriction in SW620 colon cancer cells harboring an APC mutation induced the expression of the Wnt target genes AXIN2 and LGR5 in addition to Wnt ligands in a dose-dependent manner (Extended Data Fig. 2i). Furthermore, blockade of Wnt signaling with iCRT3, a small molecule inhibitor of the Wnt pathway, partially reversed cellular differentiation in glutamine-starved ApcMin/+ organoids indicated by the ability to re-form crypts (Fig. 1h). Similarly, other Wnt inhibitors, IWP2 and XAV939, also blocked the formation of the stem-like cystic organoids upon glutamine deprivation (Fig. 1i). Taken together, these results demonstrate that a glutamine restricted environment promotes Wnt signaling and stemness in ApcMin/+ organoids.
Glutamine restriction promotes enhanced self-renewal and niche independence in ApcMin/+ organoids
It has been shown that APC mutation alone is not sufficient to promote cancer 4. Thus, we asked whether metabolic inputs contribute to the oncogenic development in CRC. To test this, we examined the self-renew ability of organoids from single cells cultured under low glutamine conditions (Fig. 2a) 23. We found that glutamine-starved ApcMin/+ organoids exhibited enhanced self-renewal based on the secondary organoids they produced along with increased proliferative capacity based on total cell numbers (Fig. 2b), while no significant effect was found in Apc wildtype organoids (Extended Data Fig. 1f, g). Furthermore, glutamine restriction allowed these organoids to survive and grow independent of “stem cell niche” factors such as R-Spondin, Egf and Noggin even though there was a large reduction in secondary organoid formation in growth-factor free medium compared to fully supplemented medium (Fig. 2c). In contrast, none of the control organoids survived in the medium lacking these factors. Together, these results suggest that exposure to low glutamine promotes stemness and niche independence in precancerous ApcMin/+organoids.
Figure 2. Glutamine restriction promotes self-renewal and niche independence in ApcMin/+ organoids.
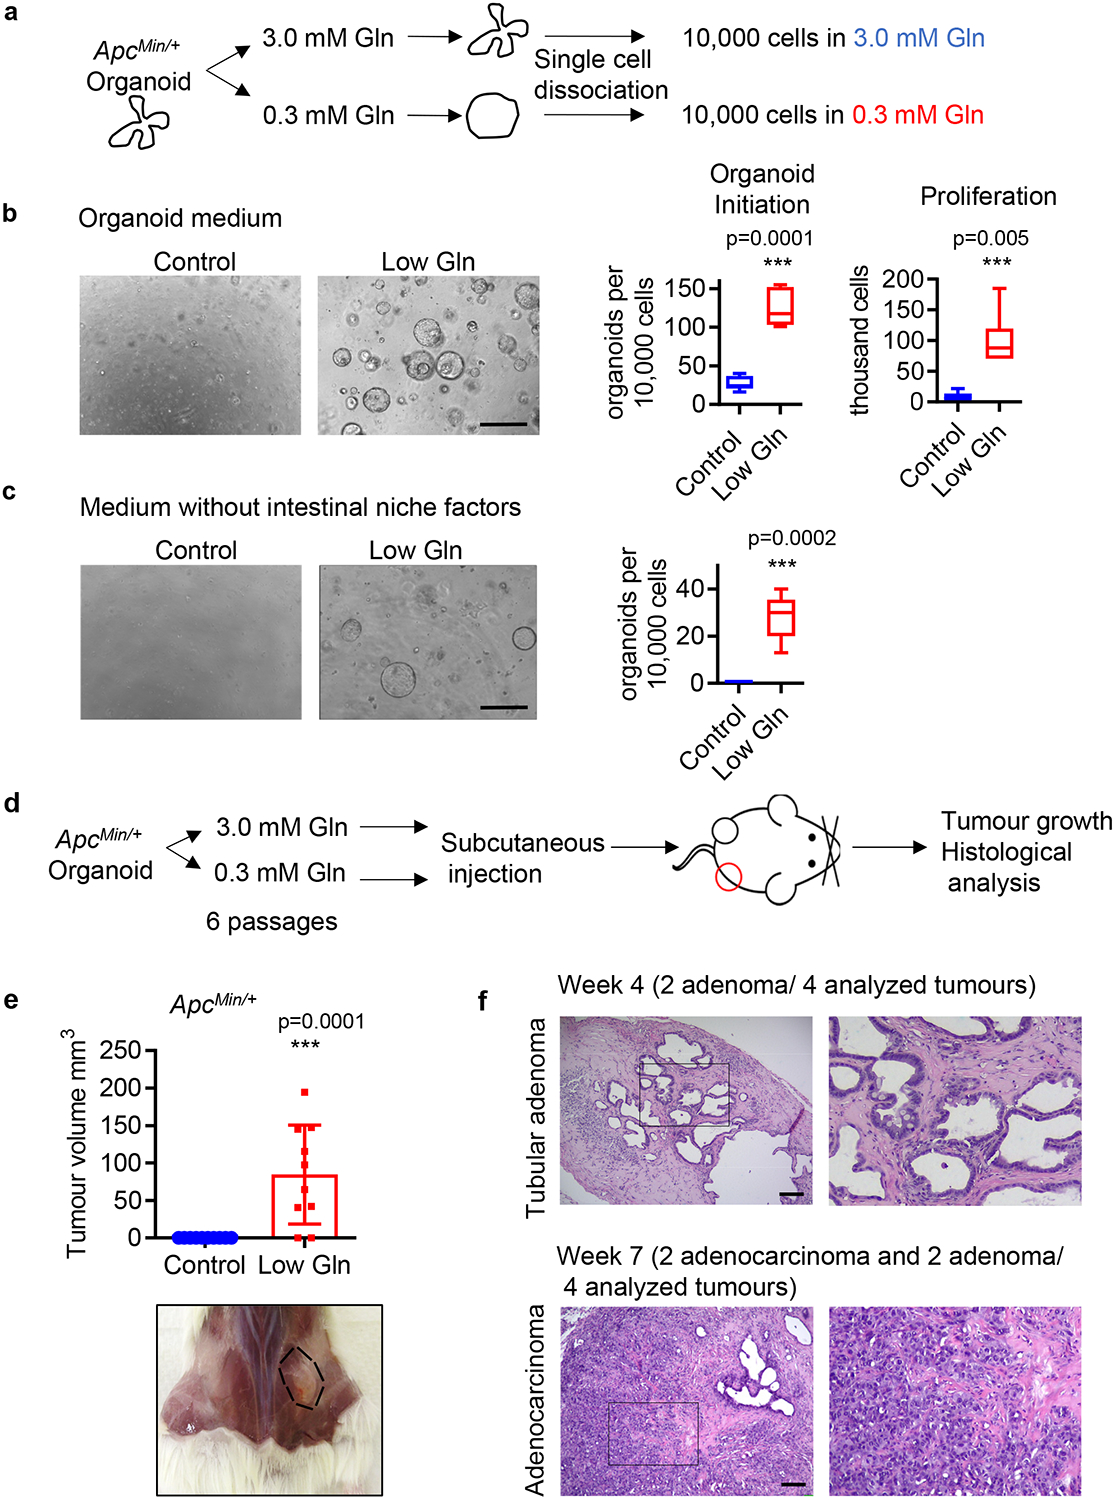
(a) Schematic of experimental design of organoid initiation assay from single cells. (b) Representative brightfield images of secondary organoid formation and cell proliferation after 1 week are shown (n= 8 biologically independent cultures for organoid initiation; n= 6 biologically independent cultures for proliferation). (c) Representative brightfield images of secondary organoid formation after 1 week in medium without R-Spondin, Egf and Noggin are shown (n= 5 biologically independent cultures). Box plots in b, c show the maximum, third quartile, median, first quartile and minimum values, and the p values were determined by two-tailed unpaired Student’s t-test. (d) Schematic of experimental procedure to establish subcutaneous xenograft tumours with ApcMin/+ organoids. (e) Tumour volume of subcutaneous xenografts generated with control organoids or glutamine-starved organoids harvested 2 weeks after injection (n=10 mice). Data represent means ± SD, p value was determined by two-tailed unpaired Student’s t-test. (f) Representative H&E staining of n= 4 tumours generated from glutamine-starved organoids. Scale bars, 400 μm (b, c), 40 μm (f). Source data are available for b, c, e.
To test whether pre-exposure to glutamine starvation promotes the tumourigenicity of ApcMin/+ organoids in vivo, we injected control organoids and glutamine-starved organoids into the flanks of immunodeficient mice and let them develop (Fig. 2d). While paired control ApcMin/+ organoids failed to engraft, glutamine-starved organoids formed visible lesions with features of tubular adenoma in the subcutaneous environment where intestinal niche factors are not found (Fig. 2e). Remarkably, the tumours, while limited in size, eventually developed into poorly differentiated adenocarcinomas based on histological analysis (Fig. 2f). Thus, our results suggest that glutamine limitation enhances the stemness and tumourigenicity of Apc mutant cells.
aKG supplementation rescues low glutamine-induced stemness and suppresses Wnt signaling to restore cellular differentiation
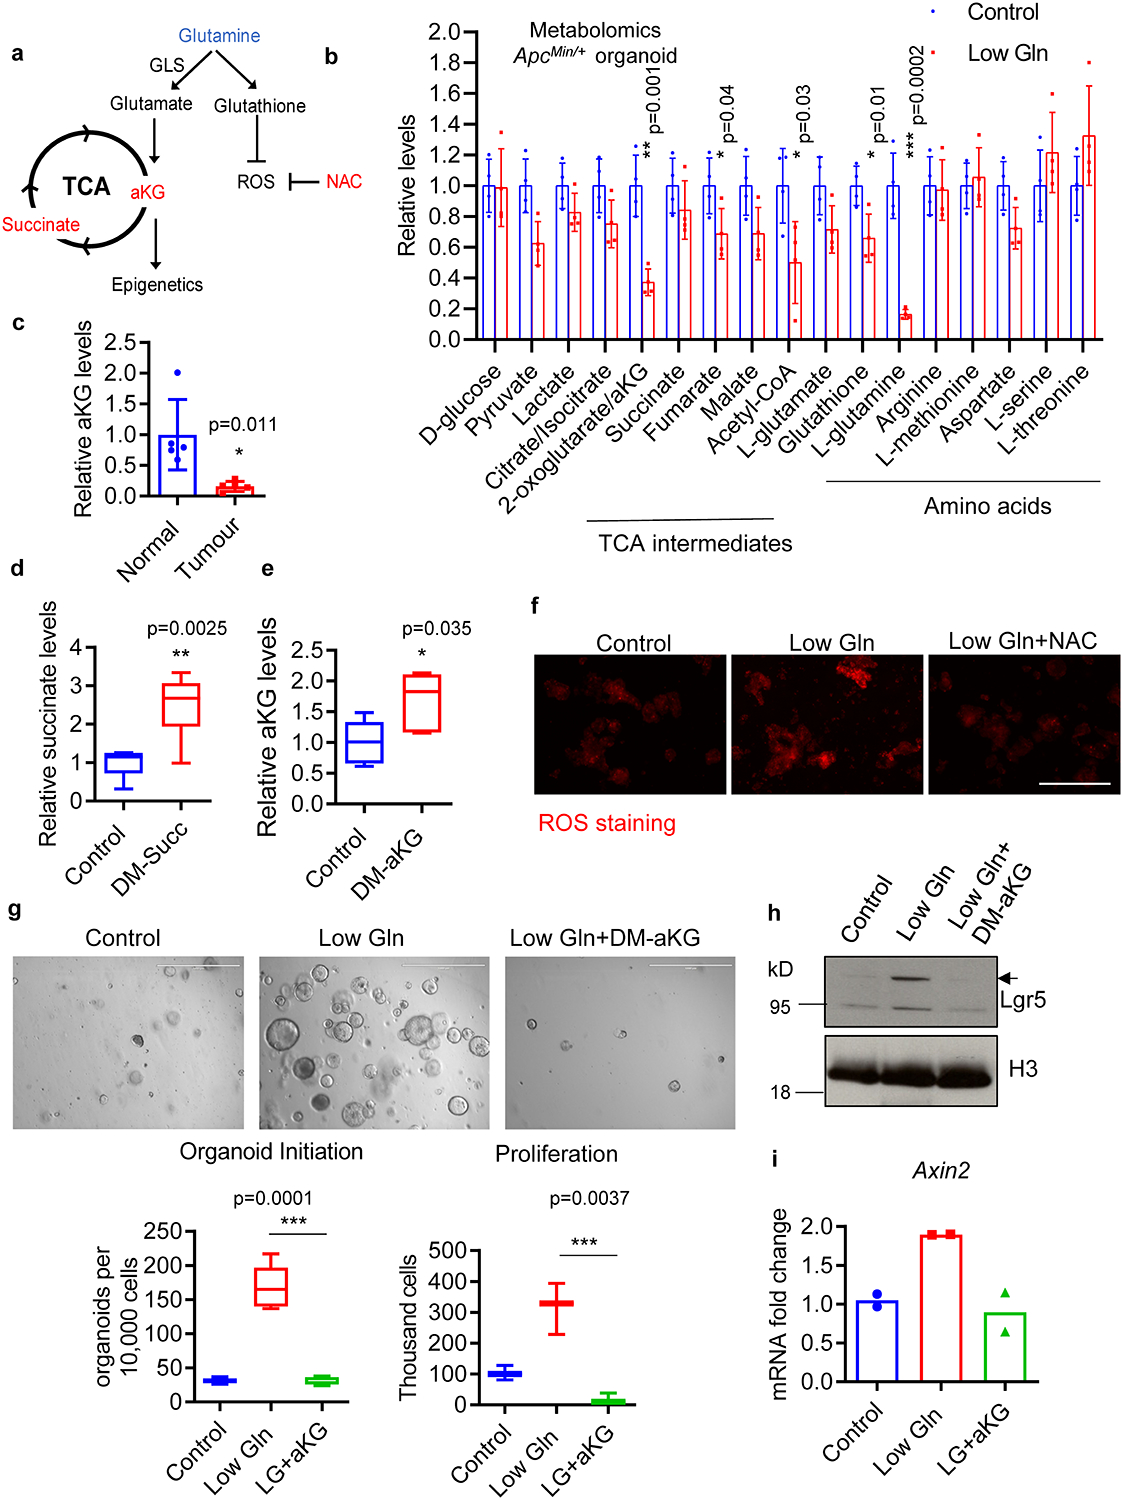
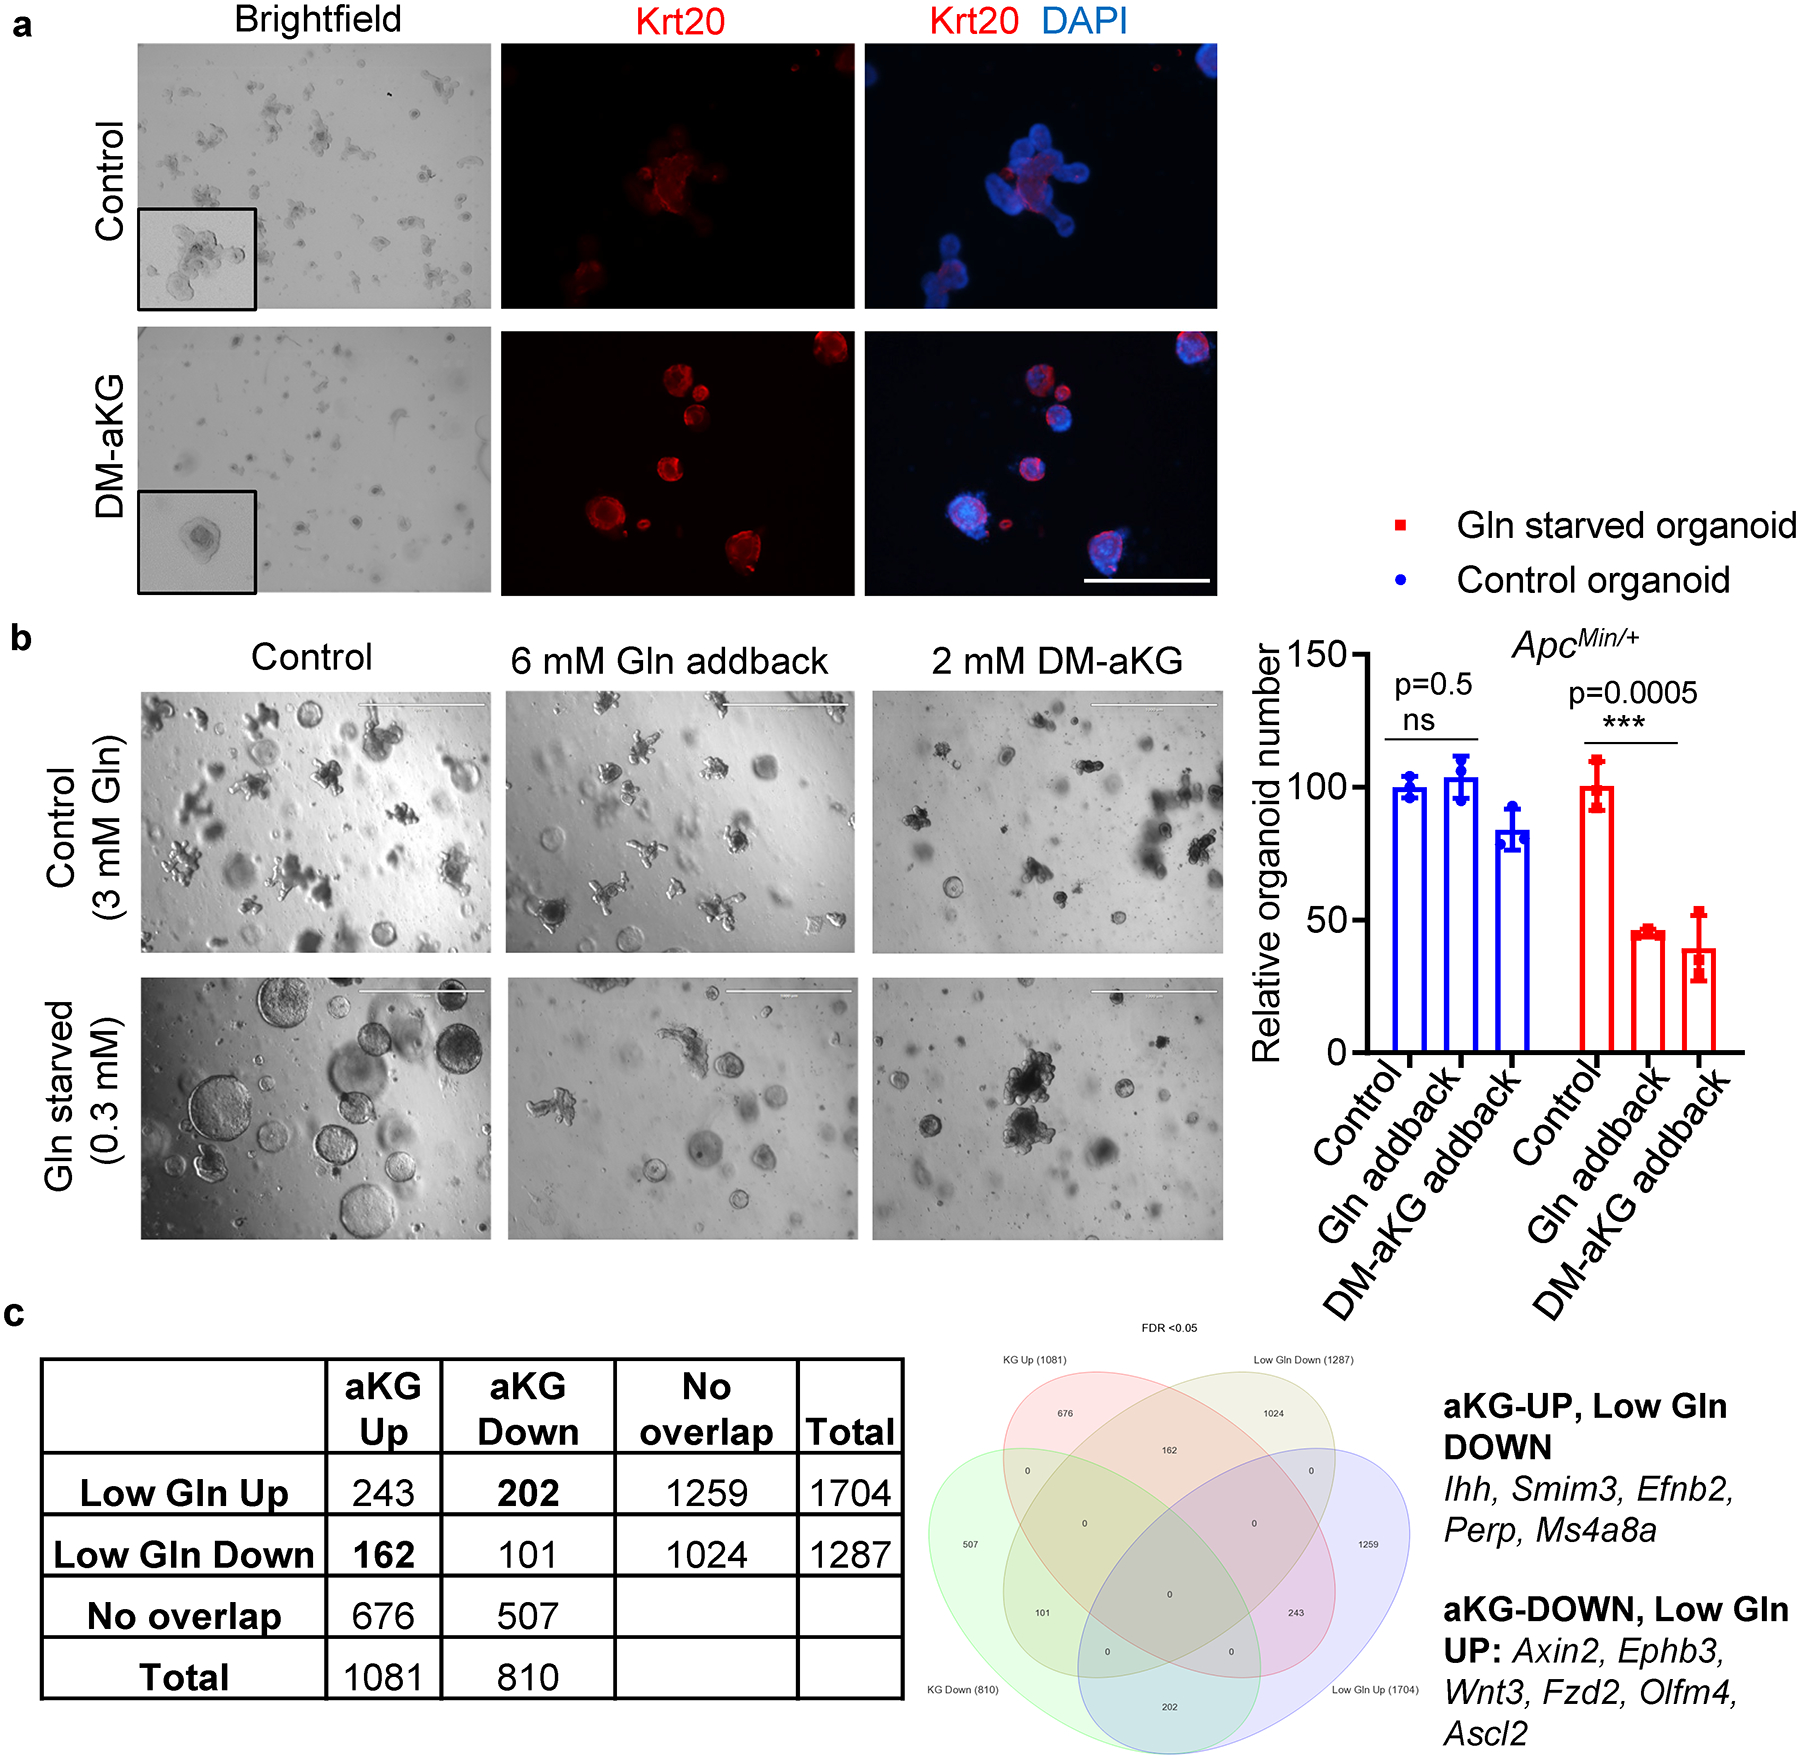
In cancer and highly proliferative cells, glutamine metabolism contributes to several biological processes, including the TCA cycle, ROS regulation and epigenetic modifications (Extended Data Fig. 3a) 18. Metabolomic analysis revealed that glutamine deprivation in ApcMin/+ organoids leads to decreased levels of glutathione and many TCA intermediate metabolites including aKG (Extended Data Fig. 3b). Consistently, we found that aKG levels dramatically decreased in the tumours collected from ApcMin/+ mice (Extended Data Fig. 3c). To further determine the mechanism by which glutamine metabolism affects organoid differentiation, we supplemented low glutamine medium with N-acetyl cysteine (NAC), an antioxidant; cell permeable succinate (DM-succinate), a TCA intermediate; and cell-permeable aKG (DM-aKG), a TCA intermediate with epigenetic modification potential (Extended Data Fig. 3d–f). We found both NAC and DM-succinate exerted limited ability to restore cellular differentiation, whereas DM-aKG alone was sufficient to inhibit the stem-like cystic morphology and partially rescued crypt formation in glutamine-starved ApcMin/+ organoids (Fig. 3a, b). In addition, aKG supplementation was sufficient to reverse low glutamine’s effect on intestinal stemness and expression of Wnt target genes (Extended Data Fig. 3g–i). We found that aKG alone induced expression of the differentiation marker Krt20 in ApcMin/+ organoids, suggesting cellular differentiation can be induced in response to the metabolite’s addition (Extended Data Fig. 4a). To further understand the anti-tumourigenic effect of glutamine and aKG, we compared the effect of glutamine supplementation on organoids with or without pre-exposure to glutamine starvation. We found that increased glutamine levels did not significantly affect the growth and differentiation processes of organoids that had not previously experienced low glutamine conditions. Interestingly, re-supplementation of glutamine or aKG suppressed growth and promoted cellular differentiation of organoids that have adapted to the chronic low glutamine conditions (Extended Data Fig. 4b).
Figure 3. aKG supplementation rescues low-glutamine induced stemness and suppresses Wnt signaling.
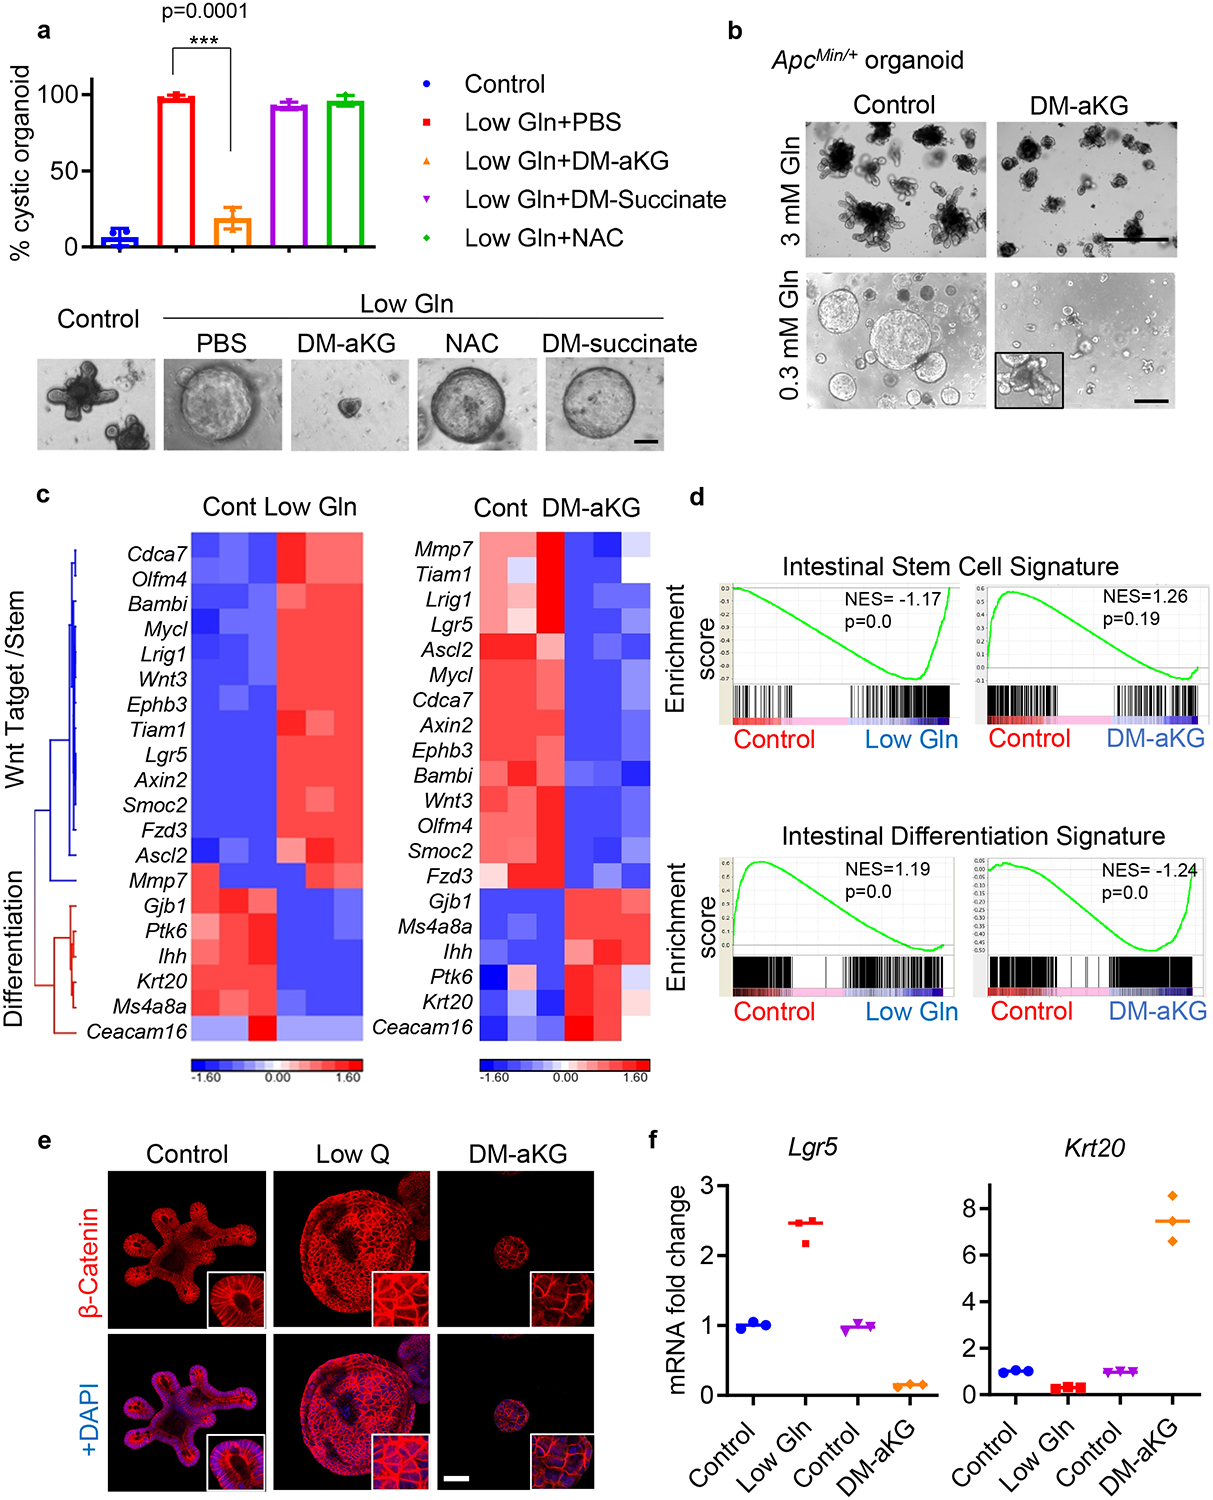
(a) Percentage of cystic organoid morphology and representative brightfield images of control organoids and glutamine-starved ApcMin/+ organoids supplemented with PBS control, 3 mM DM-αKG, 3 mM DM-succinate, or 5 mM NAC for 3 days (n=3 biologically independent cell cultures). Data represent means ± SD, p value was determined by two-tailed unpaired Student’s t-test. (b) Brightfield images of control organoids and glutamine-starved ApcMin/+ organoids treated with 3.5 mM DM-aKG for 3 days. Results are representative of 3 biologically independent samples. (c) Heat map of gene expression profile from RNA sequencing data and (d) GSEA analysis of ApcMin/+ organoids cultured in control (3 mM glutamine), low glutamine (0.3 mM glutamine) or with 3.5 mM DM-aKG medium (n=3 biologically independent RNA samples). The nominal p values in d are the statistical significance of the enrichment score analyzed by GSEA. (e) Representative immunofluorescence for active β-catenin from 3 biologically independent samples. (f) qPCR analysis for Lgr5 and Krt20 expression in ApcMin/+ organoids cultured in low glutamine medium or treated with 3.5 mM DM-aKG. n=3 technical replicates with a line marking the mean value. The experiment was repeated three times independently with similar results. Scale bars, 100 μm (a), 400 μm (b), 50 μm (e). Source data are available for a, f.
We next compared the transcriptional change induced in organoids under low glutamine and DM-aKG treatment. We found that aKG supplementation antagonized Wnt signaling and promoted the expression of differentiation-related genes, while glutamine deprivation displayed an opposite effect on gene expression (Fig. 3c, Extended Data Fig. 4c & Supplementary Table 1). GSEA analyses revealed that glutamine starvation and DM-aKG treatment have opposing influences on intestinal stemness and differentiation based on their respective expression profiles (Fig. 3d). We next tested whether low glutamine and aKG supplementation regulate Wnt signaling by examining β-catenin and Lgr5 levels in organoids. Glutamine starvation increased the levels and nuclear localization of β-catenin and elevated Lgr5 expression while DM-aKG treatment displayed an opposite effect (Fig. 3e, f). Together, these findings suggest that glutamine restriction favors Wnt signaling and stemness whereas supplementation of aKG is able to reverse this as indicated by decreased Wnt signaling and increased intestinal differentiation.
aKG supplementation promotes DNA and histone hypomethylation at genes related to intestinal differentiation and Wnt signaling
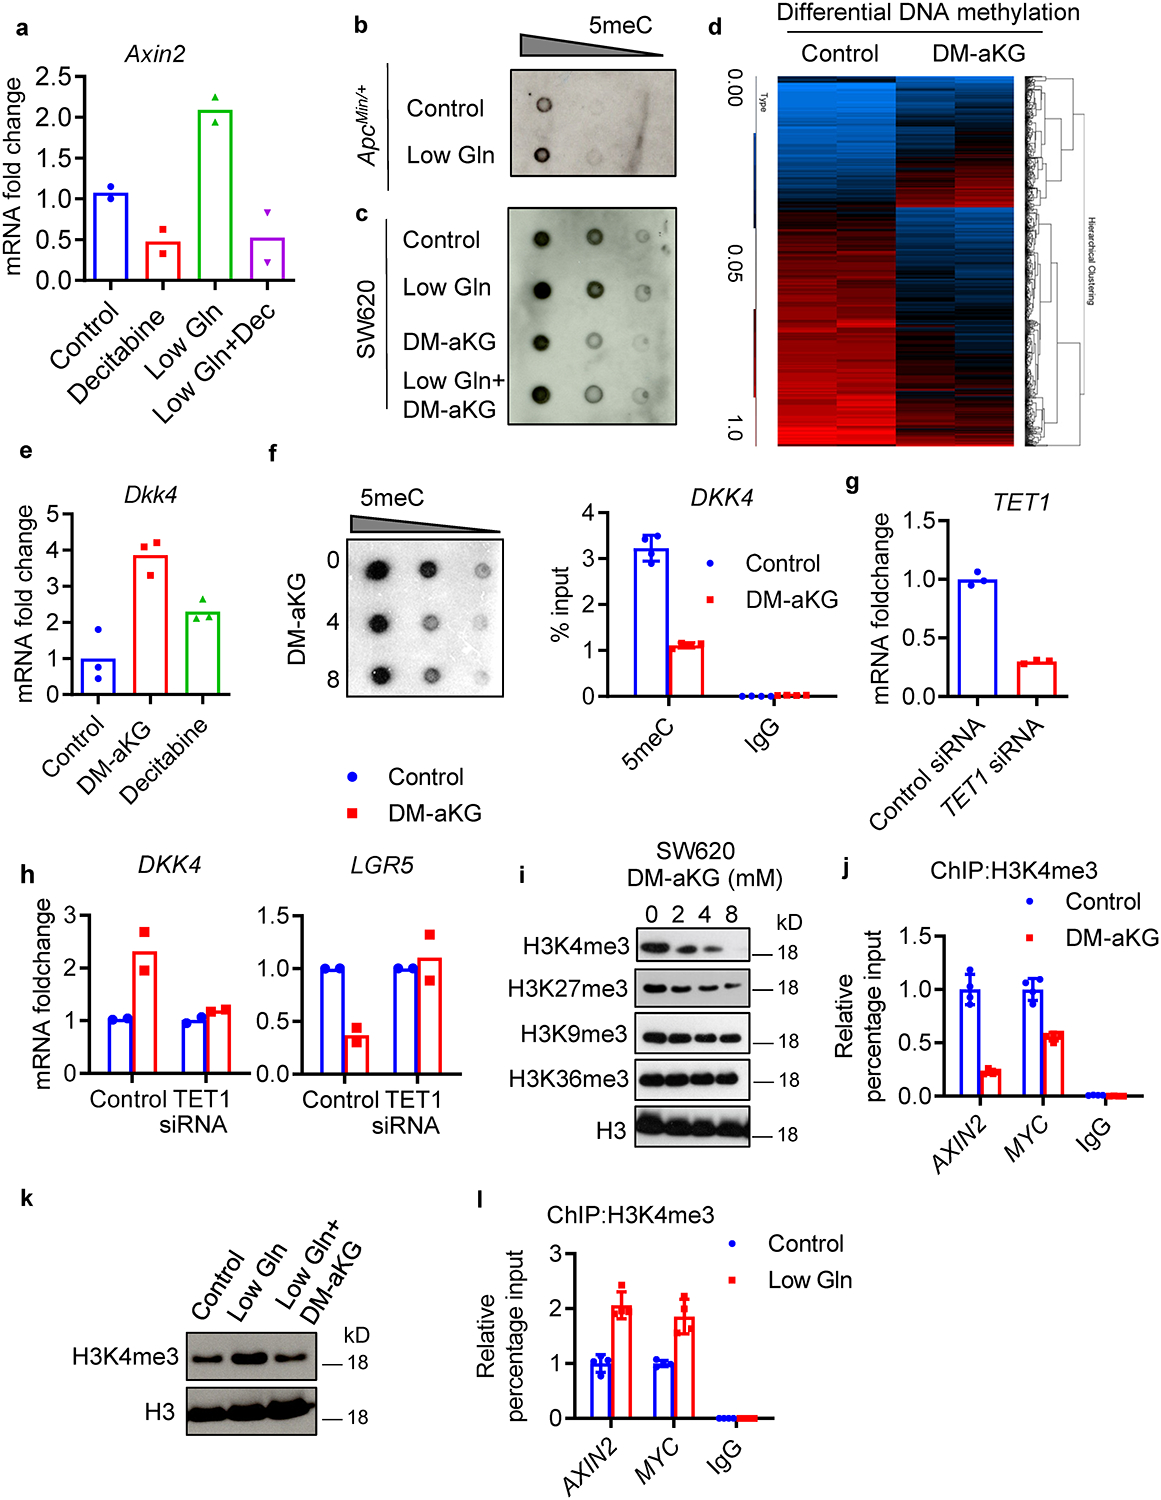
aKG is an essential co-factor for various chromatin modifying enzymes including the Ten-eleven translocation (TET) methylcytosine dioxygenase enzymes which demethylate DNA and Jumonji C (JmjC)-domain-containing histone demethylases 17. Aberrant DNA methylation, especially hypermethylation at the promoters of tumour suppressor genes and Wnt antagonist genes, has been shown to contribute to CRC oncogenesis 15,24–26. We found that inhibition of DNA methylation with Decitabine, a DNA hypomethylating agent, blocked Axin2 induction in glutamine-starved organoids, indicating potential crosstalk between epigenetics and Wnt signaling mediated by intracellular aKG levels (Extended Data Fig. 5a). Consistently, low glutamine promoted DNA hypermethylation which was reversed by aKG addition as shown by 5-methyl cytosine dot blot analysis (Extended Data Fig. 5b, c). Next, we performed reduced representation bisulfite sequencing (RRBS) to analyze the genome-wide methylation profile in organoids. We found that DM-aKG treatment alone resulted in minimal DNA hypermethylation but drastic DNA hypomethylation, indicating a hyperactivity of the Tet enzymes (Fig. 4a). A volcano plot demonstrates the most differentially methylated genes are hypomethylated while a much smaller subset of genes are hypermethylated in response to DM-aKG treatment (Fig. 4b). Moreover, gene ontology analysis showed that aKG supplementation promotes DNA hypomethylation in genes involved in cellular differentiation, immune response and metabolism (Fig. 4c). Strikingly, global transcriptome remodeling took place with a larger percentage of genes upregulated upon DM-aKG treatment (Fig. 4d). The integration of the DNA methylation sequencing and the transcriptome profile in a Starburst plot identified 293 genes with DNA hypomethylation and increased gene expression upon DM-aKG treatment (Fig. 4e & Supplementary Table 2). Among these are differentiation-associated genes identified by overlapping with an intestinal differentiation signature and genes often hypermethylated in CRC including Ndrg4 and Stox2 27. Moreover, we found genes with tumour suppressive functions including Bbc3 and Bax also affected by DM-aKG treatment (Fig. 4f). Consistently, methylation EPIC microarray analyses revealed that aKG supplementation resulted in drastic DNA hypomethylation in human CRC cells, especially at regions of genes associated with intestinal differentiation (Extended Data Fig. 5d and Supplementary Table 3).
Figure 4. aKG supplementation leads to DNA hypomethylation of genes related to differentiation and Wnt inhibition.
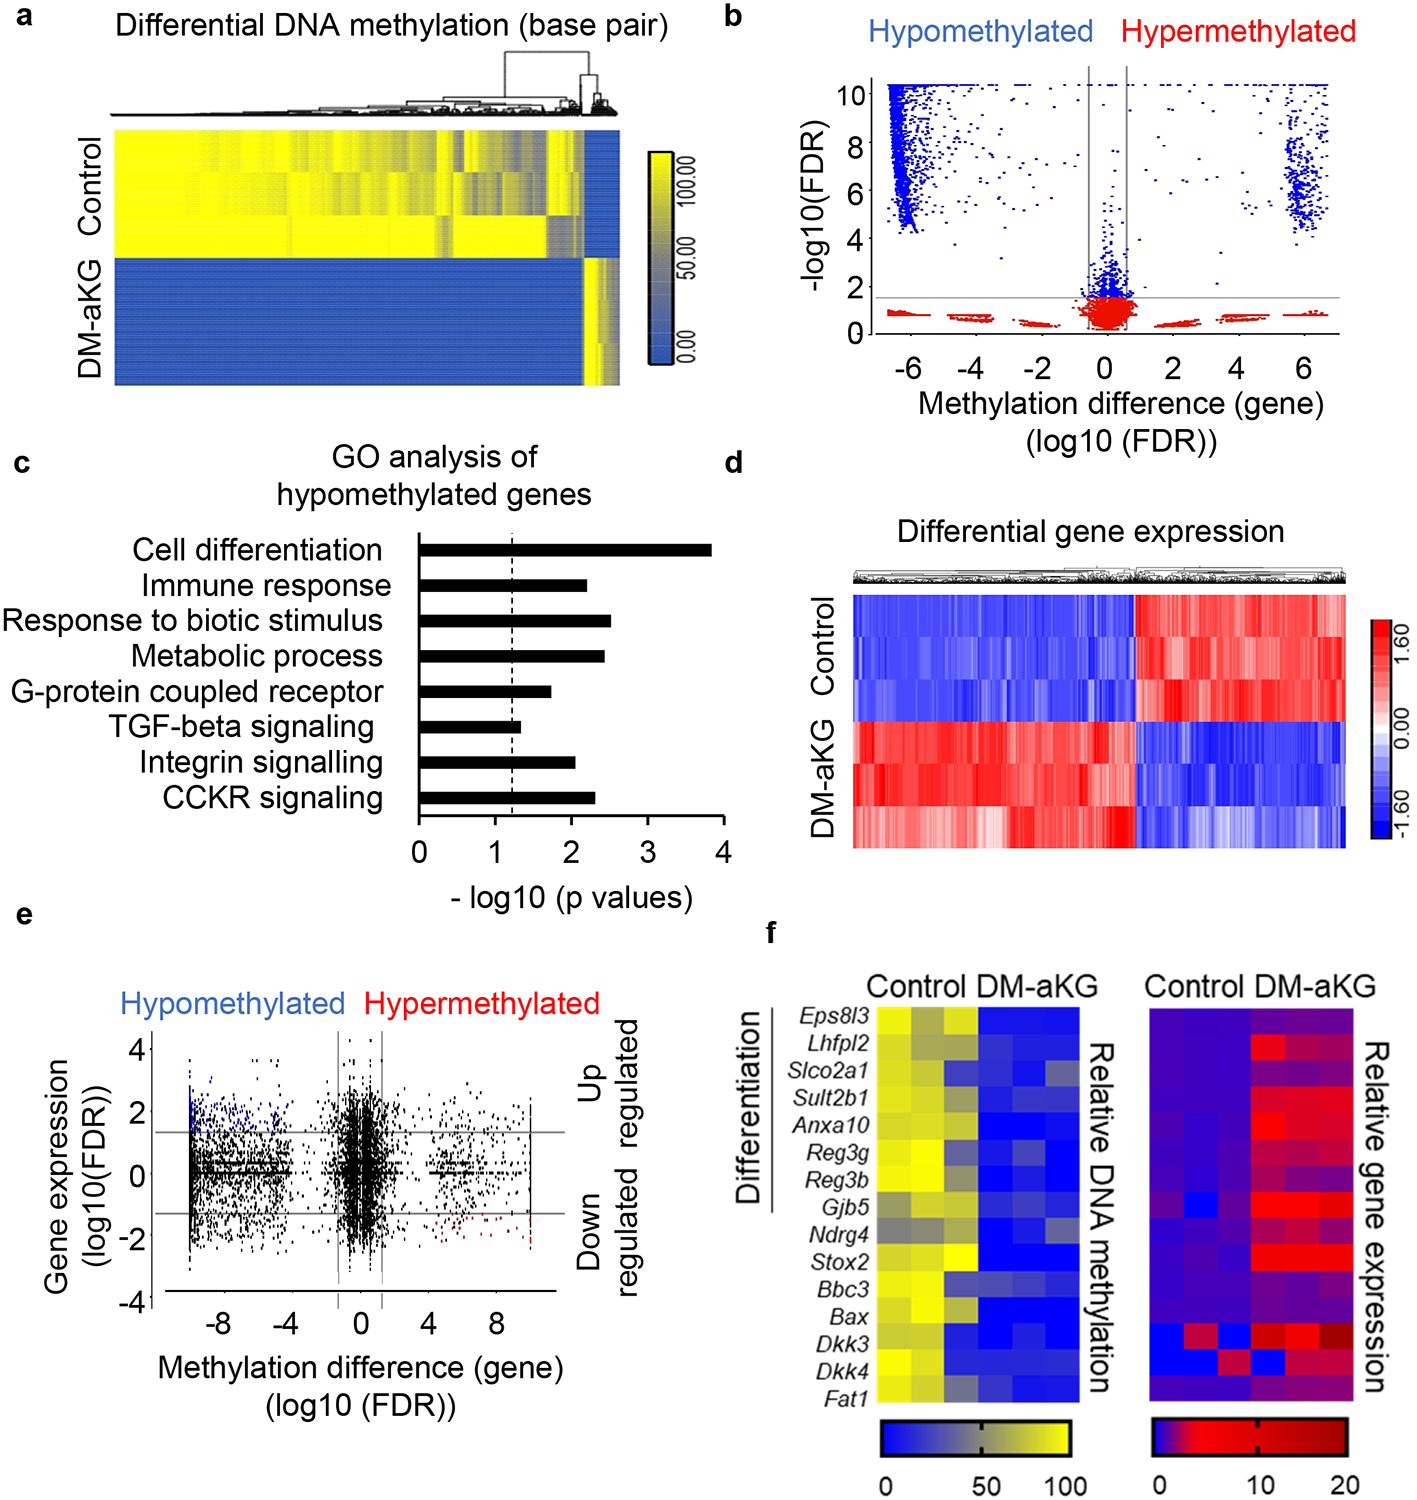
(a) Heatmap showing base pairs with differential DNA methylation based on RRBS sequencing (n=3 biologically independent samples). (b) Volcano plot showing genes with affected DNA methylation between the control and DM-aKG (3.5mM) treated ApcMin/+ organoids, DNA methylation difference is plotted on the x-axis and p values are plotted on the y-axis (n=3 biologically independent samples). Different methylation pattern between samples are detected using ANOVA with FDR adjusted p-value <0.05 and +/−1.5-fold change on methylation percentage. The average of methylation difference of significant (FDR adjusted p-value) differential methylation sites was calculated. (c) Panther gene ontology analysis of hypomethylated genes in DM-aKG treated organoids (n=3 biologically independent samples). Dotted line indicates threshold of significance (p = 0.05) and p values were calculated by GO enrichment analysis software. (d) Hierarchical clustering of differential gene expression in control and DM-aKG treated ApcMin/+ organoids (n=3 biologically independent samples). (e) Starburst plot for comparison between DNA methylation and gene expression. The black line represents the cutoff of FDR adjusted p values < 0.05. Blue dots represent genes with DNA hypomethylation and upregulated expression, red dots represent genes with DNA hypermethylation and downregulated expression between control and DM-aKG treated ApcMin/+ organoids (n=3 biologically independent samples). Different methylation pattern between samples are detected using ANOVA with FDR adjusted p-value <0.05. (f) Heatmap showing selected genes with decreased DNA methylation at upstream regions and upregulated expression in ApcMin/+ organoids upon DM-aKG treatment (n=3 biologically independent samples).
We also found that aKG reshaped epigenetic marks on genes related to Wnt signaling. For example, aKG treatment induced DNA-demethylation and upregulation of Dkk3 and Dkk4, Wnt antagonists that block Wnt ligand-receptor interaction, and Fat1 which interferes with the nuclear localization and transcriptional activity of β-catenin (Fig. 4f) 28. Consistently, Dkk4, which has been shown to suppress Wnt signaling in APC mutant CRC cells, was upregulated in organoids upon aKG or DNA methylation inhibitor treatment (Extended Data Fig. 5e) 29. Similarly, we confirmed aKG promoted global DNA demethylation, particularly on the upstream region of DKK4 in CRC cells (Extended Data Fig. 5f). We found knocking down Tet1 blocked Dkk4 induction and partially inhibited the effect of aKG on the expression of stemness marker Lgr5 (Extended Data Fig.5 g, h), supporting that aKG-mediated DNA demethylation is in part through Tet enzymes.
In addition to DNA methylation, previous studies suggest that histone methylation is also regulated by intracellular aKG levels 15,30. Consistently, we found that aKG supplementation drives drastic hypomethylation of histone marks in CRC cells, especially H3K4 trimethylation (H3K4me3) which is associated with active transcription (Extended Data Fig. 5i). Chromatin immunoprecipitation assays reveal that aKG supplementation led to the loss of H3K4me3 on Wnt target genes, consistent with previous studies showing that H3K4 plays a crucial role in the regulation of Wnt target genes in CRC cells (Extended data Fig. 5j) 31,32. In contrast, low glutamine conditions led to increased H3K4me3 levels, specifically at the loci of Wnt target genes (Extended Data Fig. 5k, l). Taken together, these results suggest that aKG promotes DNA hypomethylation to induce the expression of differentiation-related genes and H3K4 hypomethylation to suppress the expression of Wnt target genes.
aKG supplementation drives terminal differentiation and suppresses growth of patient-derived colon tumour organoids
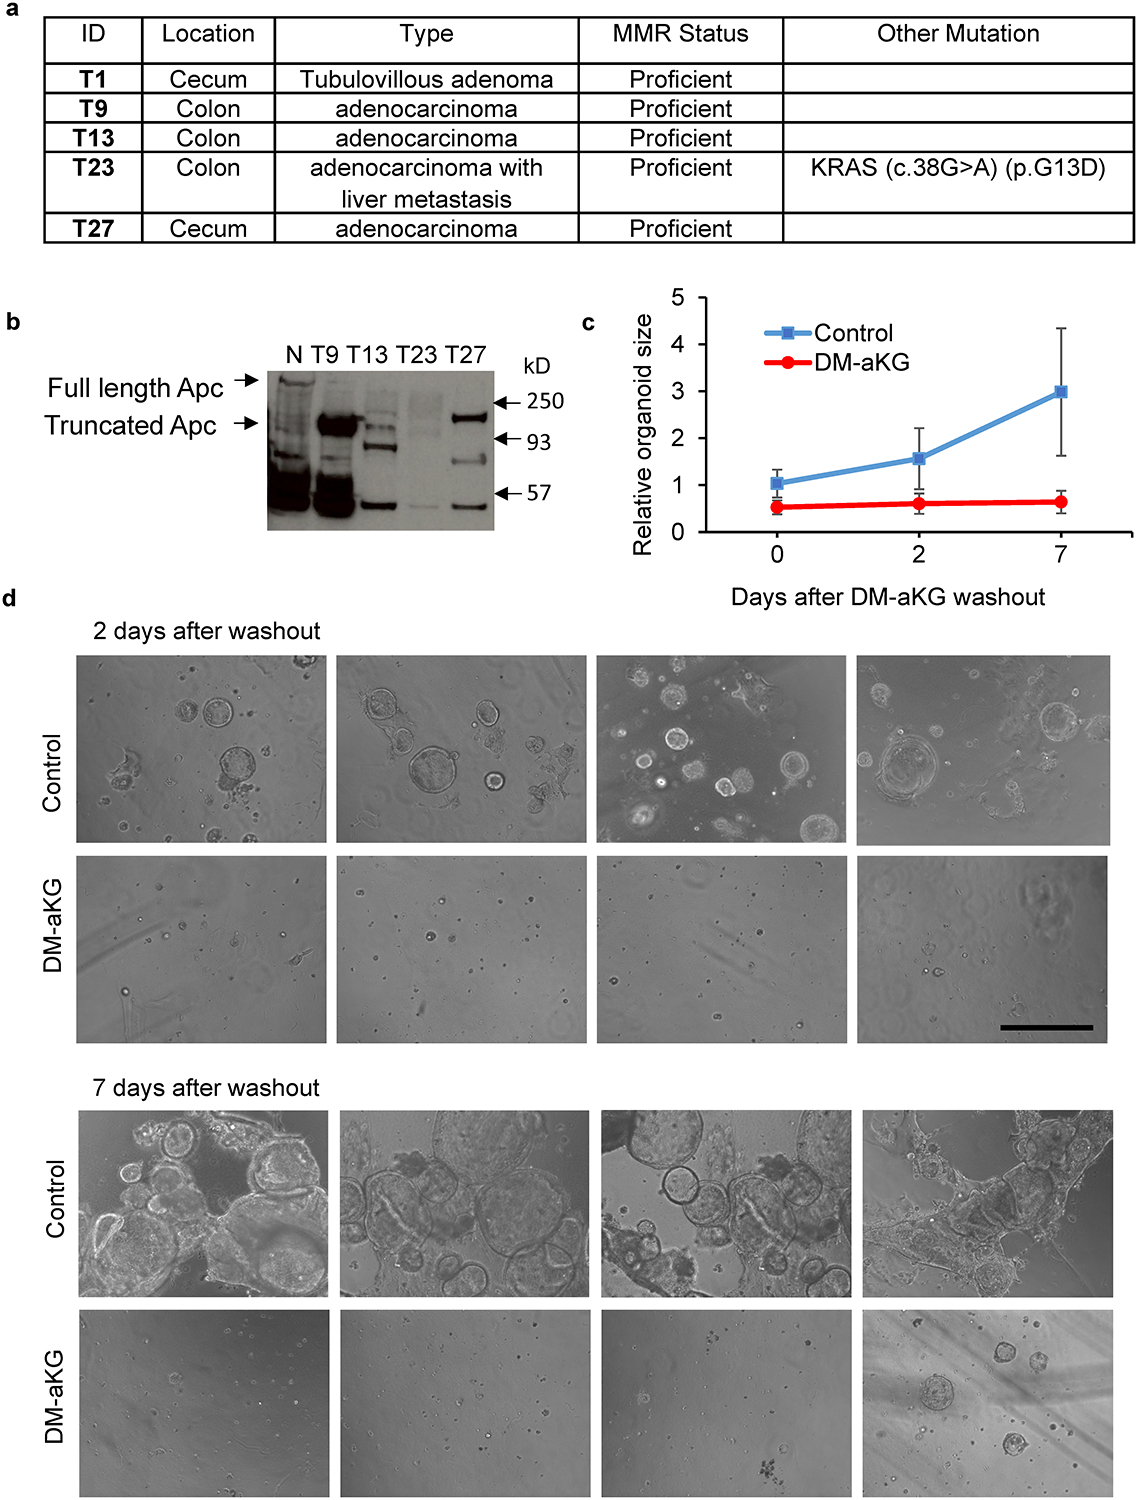
As cellular dedifferentiation drives CRC pathogenesis and therapeutic resistance, reinforcement of terminal differentiation is a promising therapeutic approach that has gained success in other cancers that arise similarly from differentiation dysfunction 7,33,34. Since aKG supplementation has resulted in remarkable responses in mouse organoids in terms of promoting cellular differentiation, we generated a panel of patient-derived organoids (PDOs) to test the therapeutic potential of aKG supplementation in human CRC cells (Extended data Fig. 6a, b). We found that DM-aKG treatment inhibited the initiation and growth of a panel of PDOs (Fig 5a). In addition, DM-aKG treatment significantly reduced organoid size and blocked cystic morphology in PDOs (Fig. 5b). Also, aKG-treated PDOs highly expressed intestinal differentiation markers including Krt20 and Muc2 compared to the control organoids (Fig. 5c). Rather than inducing cytotoxicity, treatment with aKG arrested the cancer organoids in a terminally differentiated state with a limited proliferative potential that persisted even after the metabolite was washed out (Fig. 5d & Extended Data Fig. 6c, d). Consistent with the response in mouse intestinal organoids, we found that Wnt signaling was suppressed and differentiation-related genes were partly induced upon aKG treatment in PDOs (Fig. 5e). Drug response profiling in PDOs has been shown to accurately predict clinical responses in patients with gastrointestinal cancer 35. Therefore, aKG supplementation with the ability to suppress Wnt signaling and induce cellular differentiation in PDOs represent a potential therapeutic opportunity for the treatment of colon cancer.
Figure 5. aKG supplementation drives terminal differentiation and suppresses growth of patient-derived colon tumour organoids.
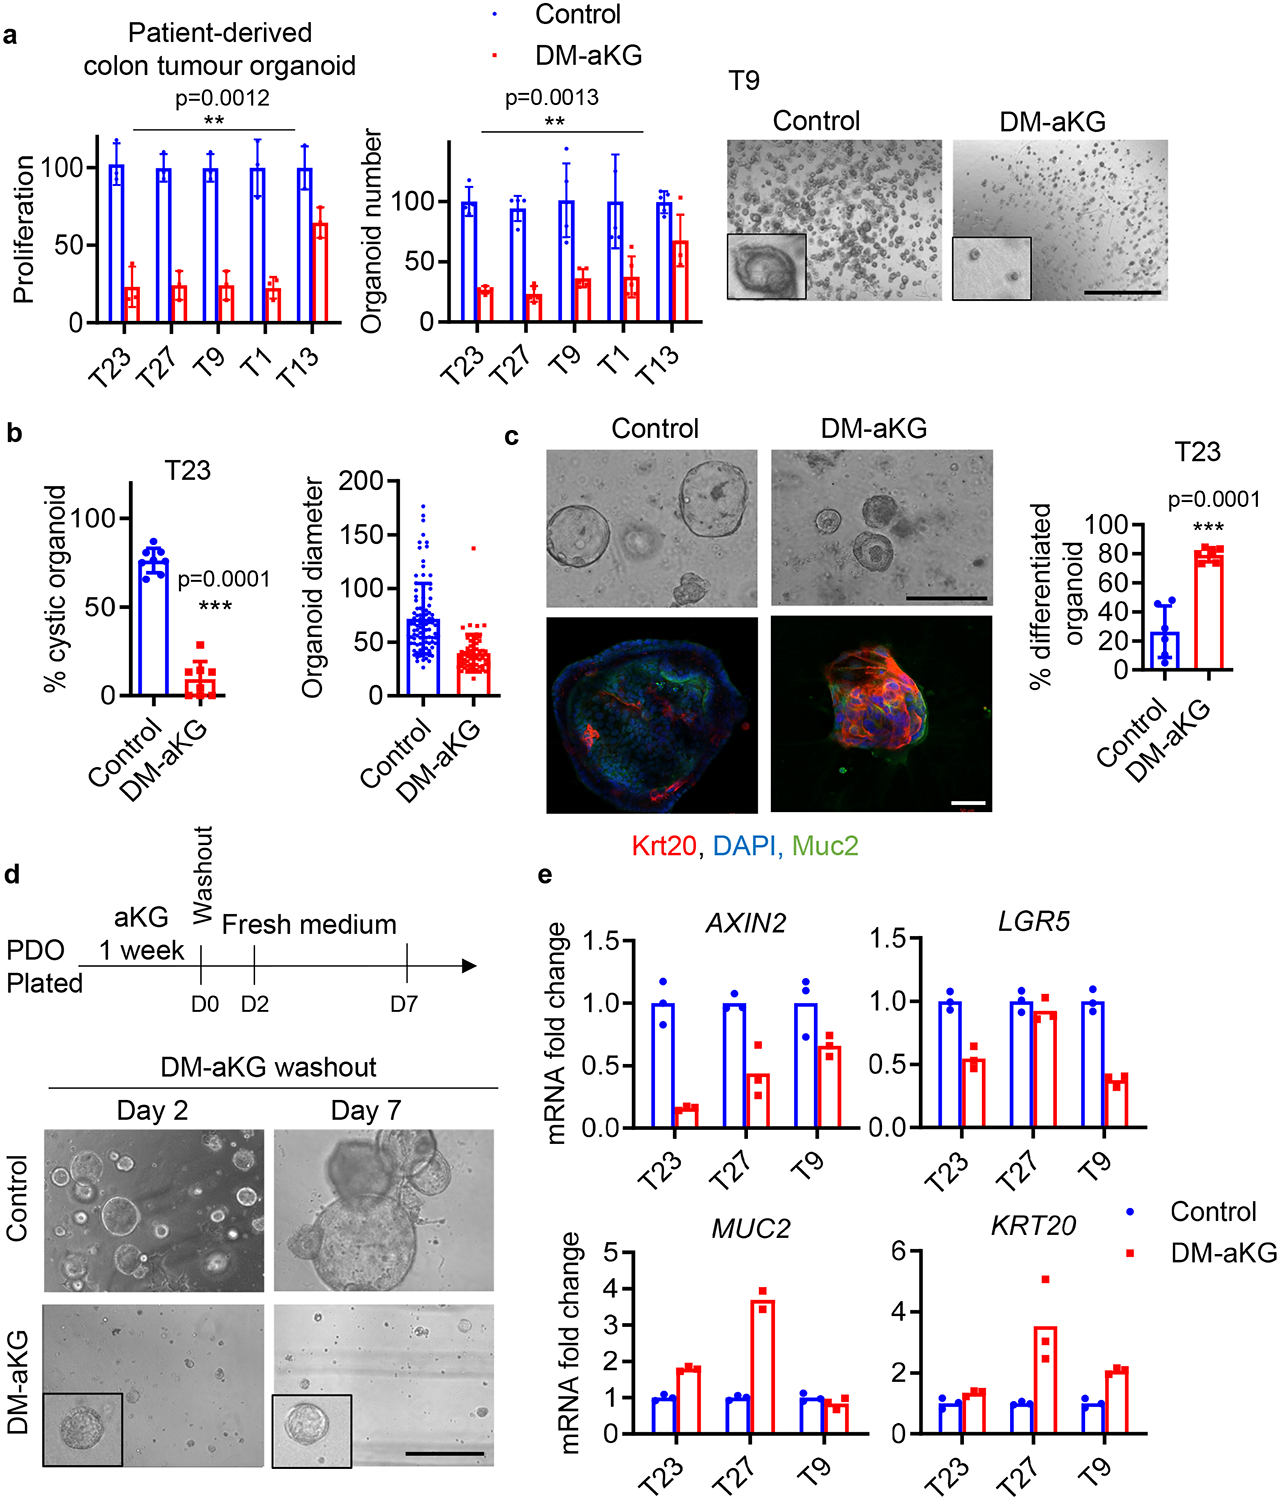
(a) Titer-Glo proliferation assay and relative organoid number of a panel of PDOs treated with 6 mM DM-aKG for 7 days (n=3 biologically independent samples). Representative brightfield images of T9 PDOs after DM-aKG treatment are shown. Data represent means ± SD, p values were determined by two-tailed paired Student’s t-test between control and treated group. (b) Percentage of cystic organoids (n= 8 biologically independent cultures) and relative organoid size of T23 PDOs (n=95 organoids in control group; n=62 organoids in DM-aKG treated group) treated with DM-aKG as determined by ImageJ. Data represent means ± SD, p values were determined by two-tailed unpaired Student’s t-test. (c) Brightfield images and immunofluorescent staining for the indicated differentiation markers of T23 PDOs following 6 mM DM-aKG treatment for 7 days, and the percentage of differentiated organoids as determined by Krt20 staining was shown (n=6 biologically independent cultures). Data represent means ± SD, p values was determined by two-tailed unpaired Student’s t-test. (d) Representative images of T23 PDOs treated with DM-aKG followed by wash-out. Results are representative of three independent cell cultures. (e) qPCR analysis of the indicated genes in different PDOs treated with 6mM DM-aKG for 7 days, n=3 technical replicates. Scale bars, 1000 μm (a), 200 μm and 50 μm (c), 400 μm (d). Source data are available for a-c, e.
aKG supplementation inhibits the growth of highly mutated CRC xenograft tumours in vivo.
In addition to Wnt dysregulation, CRC tumours commonly acquire mutations in other oncogenic pathways, including KRAS (43 % human CRC) and P53 (54 % human CRC) that contribute to cancer progression and drug resistance 36. While the effect of aKG supplementation in ApcMin/+ organoids is dramatic, the accumulation of these genetic mutations could render cancer cells insensitive to the metabolite. Thus, we tested the therapeutic potential for aKG supplementation in tumours with an activating Kras mutation, Apc loss and p53 disruption, as a model for human CRC. In poorly differentiated AKP organoids, we found that DM-aKG treatment restricted organoid growth and induced cellular differentiation as indicated by the ability of organoids to re-form crypts without restoring Apc expression (Fig. 6a, b). Importantly, DM-aKG treatment either by IP injection or in the drinking water suppressed the growth of mouse subcutaneous xenograft tumours generated from AKP organoids (Fig. 6c). Histological analysis revealed that DM-aKG treated tumours were predominantly occupied by stromal cells while control AKP organoids grew out as invasive carcinomas (Fig. 6d). To further validate these results, we tested the effect of aKG on another xenograft tumour model generated from SW620 human colon cancer cells harboring mutations in the APC, KRAS, TP53 and SMAD4 genes. We found that DM-aKG treatment increased intratumoural aKG levels and limited tumour growth (Fig. 6 e,f). Consistently, aKG treatment in vivo suppressed the expression of Wnt target genes in SW620 xenograft tumours (Fig. 6g). Together, these findings suggest that aKG supplementation is effective for the treatment of CRC tumours bearing other oncogenic mutations in addition to APC.
Figure 6. aKG supplementation inhibits the growth of highly mutated CRC tumours in vivo.
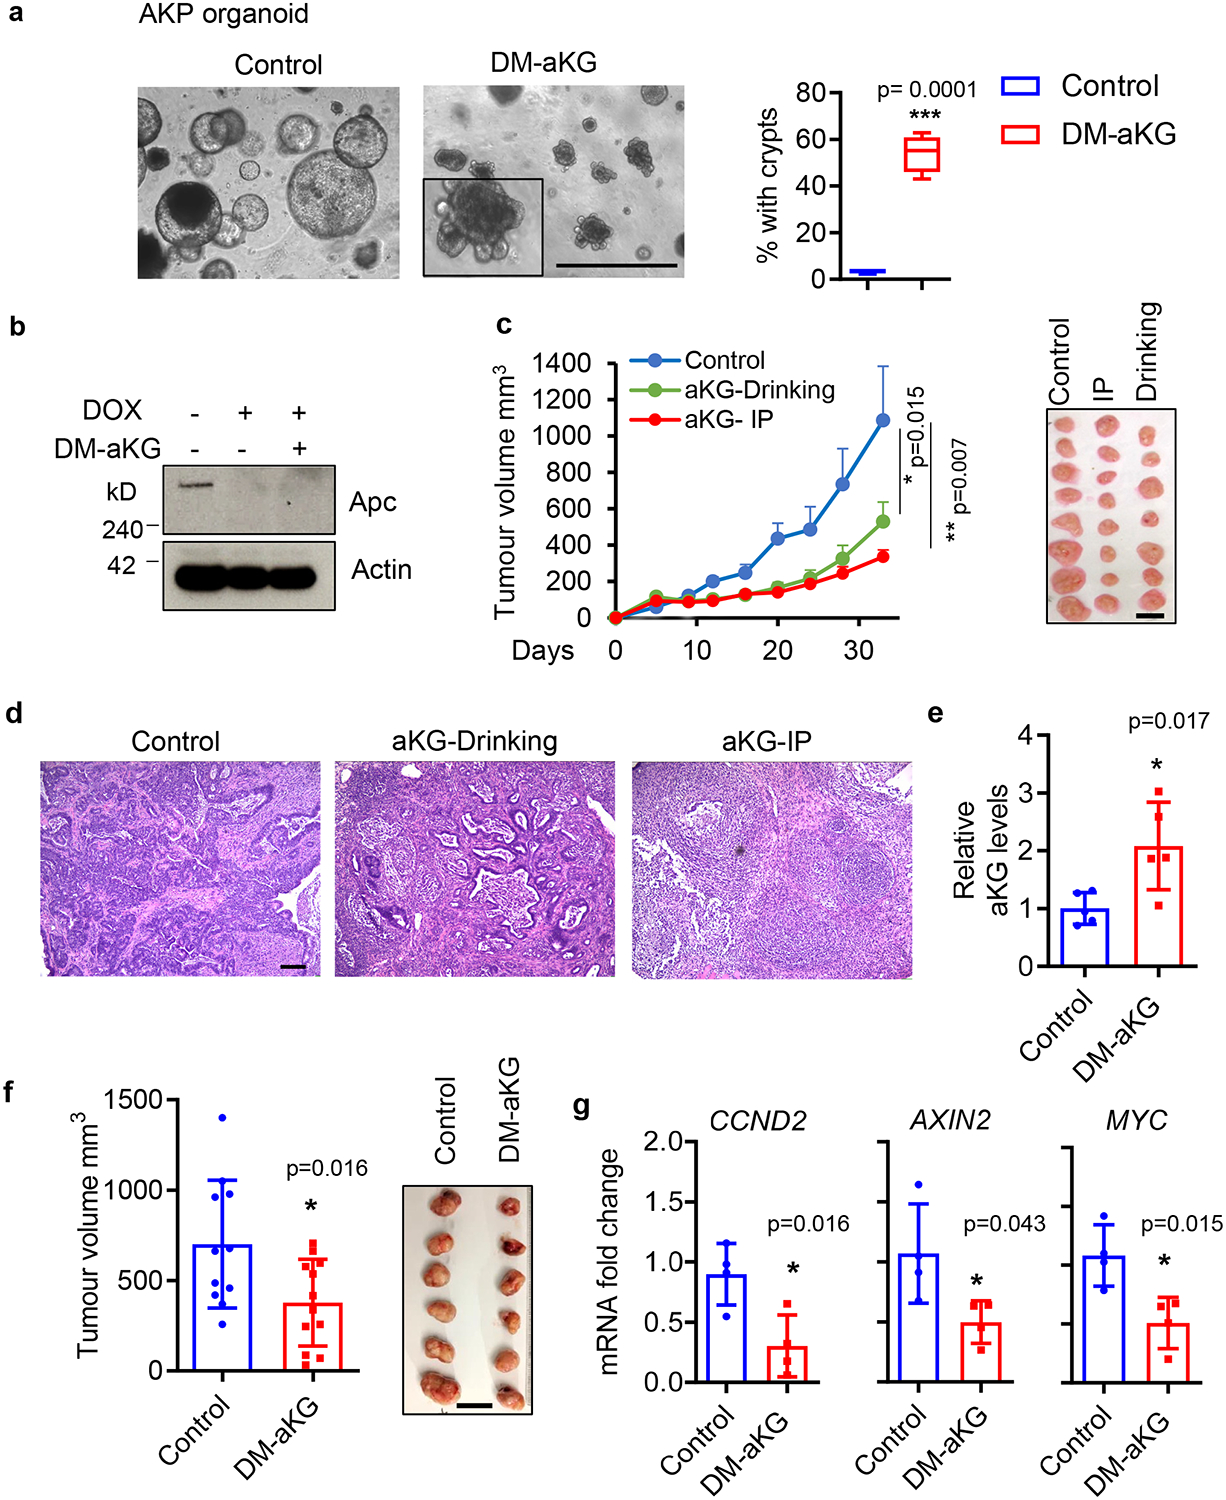
(a) Brightfield images of shApc /KrasG12D/p53fl/fl (AKP) small intestine organoids treated with 3 mM DM-aKG for 3 days, the percentage of organoids with crypts are shown (n=4 biologically independent cultures). Box plots show the maximum, third quartile, median, first quartile and minimum values, and the p value was determined by two-tailed unpaired Student’s t-test. (b) Immunoblot of Apc in AKP organoids upon DM-aKG treatment. The results are representative of two independent experiments. (c) Tumour volume of xenograft tumours established with AKP organoids treated with 600 mg/kg DM-aKG via IP injection daily or 25 mg/ml in drinking water (n=8 tumours per group). Data represent means + SEM, p values at day 20 are shown and were determined by two-tailed unpaired Student’s t-test. (d) H&E staining of control AKP tumour and DM-aKG treated tumours. Results are representative of 3 tumours per group. (e) Relative aKG levels in xenograft tumours established with SW620 colon cancer cells treated with 400 mg/kg DM-aKG by IP injection daily (n=5 tumours per group). (f) Tumour volume measured after DM-aKG treatment for 23 days (n=11 tumours per group). (g) qPCR analysis of Wnt target genes in SW620 xenograft tumours treated with DM-aKG or vehicle control (n=4 tumours per group). Data in e-g represent means ± SD, p values were determined by two-tailed unpaired Student’s t-test. Scale bars, 1000 μm (a), 20 mm (c,f), 100 μm (d). Unprocessed gels are available for b and source data are available for a, c, e-g.
aKG suppresses Wnt signaling and inhibits tumour initiation in ApcMin/+ mice
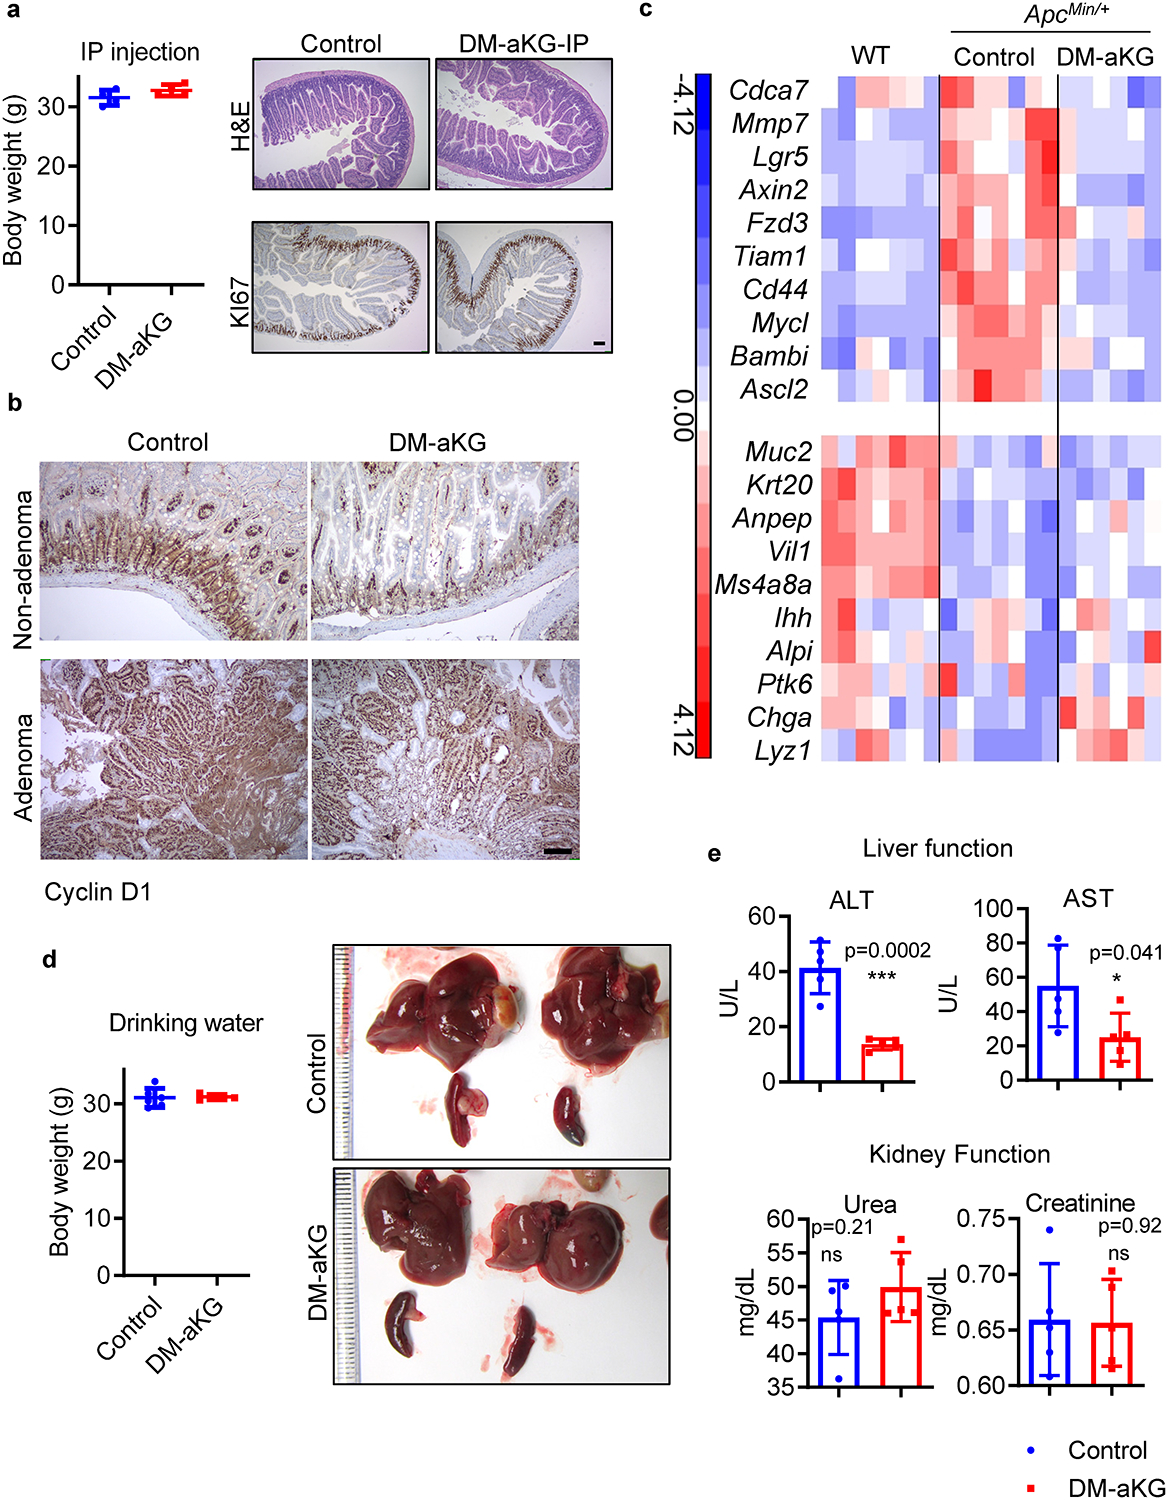
Combating tumour initiation and preventing recurrence is a clinical challenge in CRC 37. Thus, we evaluated the effects of aKG treatment in intestinal neoplasia using the ApcMin/+ mouse, a model that develops spontaneous intestinal tumours due to Wnt deregulation 38. DM-aKG treatment via IP injection raised aKG levels in the intestine without significantly affecting the body weight or intestinal homeostasis in healthy wildtype mice, suggesting DM-aKG dosage used here is well-tolerated (Fig. 7a & Extended Data Fig.7a). Strikingly, DM-aKG treatment in ApcMin/+ mice partially protected against tumour-associated weight loss and significantly reduced tumour numbers (Fig. 7b–d). To gain better insight into how aKG modulates tumour initiation, we performed whole transcriptome sequencing of the intestinal tissue of mice treated with DM-aKG. ApcMin/+ mice displayed extensive hyperactivation of genes compared to the wild-type mice. Interestingly, DM-aKG treatment in the ApcMin/+ mice alone suppressed a significant majority of these genes in Cluster 8 (Fig. 7e). Gene analysis of Cluster 8 revealed gene networks involved in Wnt signaling, angiogenesis, and other oncogenic pathways suggesting that aKG treatment may suppress many cancer-associated genes to inhibit tumour initiation and progression in the ApcMin/+ mice (Fig. 7f). The suppression of Wnt signaling and stemness induced upon DM-aKG treatment was confirmed via GSEA analysis, IHC staining of β-catenin, and gene expression of stem cell markers (Fig. 7g–i). To further address whether aKG-reduced oncogenic gene expression occurs in both adenomas and non-adenomatous crypts, we performed IHC staining for Cyclin D1, in which the expression is reduced upon DM-aKG treatment based on the RNA sequencing profile. We found that DM-aKG treatment in vivo led to reduced Cyclin D1 expression in both tumour regions and non-adenomatous crypts (Extended Data Fig. 7b). In addition, aKG treatment suppressed the expression of Wnt target genes and partially rescued the expression of differentiation-related genes (Extended Data Fig. 7c). In order to achieve a more direct and continuous delivery of aKG, we tested the therapeutic potential of DM-aKG supplementation in drinking water. We found that supplementation of DM-aKG in the drinking water had no observed effect on the general health of the mice, including body weight, liver function and kidney function (Extended Data Fig. 7d, e). Strikingly, we found that over 90 % of ApcMin/+ control mice developed rectal bleeding at day 50, an indication of intestinal tumours, while only 23% of the mice with aKG supplementation in the drinking water had rectal bleeding (Fig. 7j). Importantly, Kaplan-Meier survival curves revealed a significant extension in the survival of ApcMin/+ mice with DM-aKG supplementation (Fig. 7k). Together, our data demonstrate that aKG represses Wnt signaling restricting tumour initiation and improving survival.
Figure 7. aKG supplementation is an effective therapeutic intervention in a mouse model of intestinal cancer.
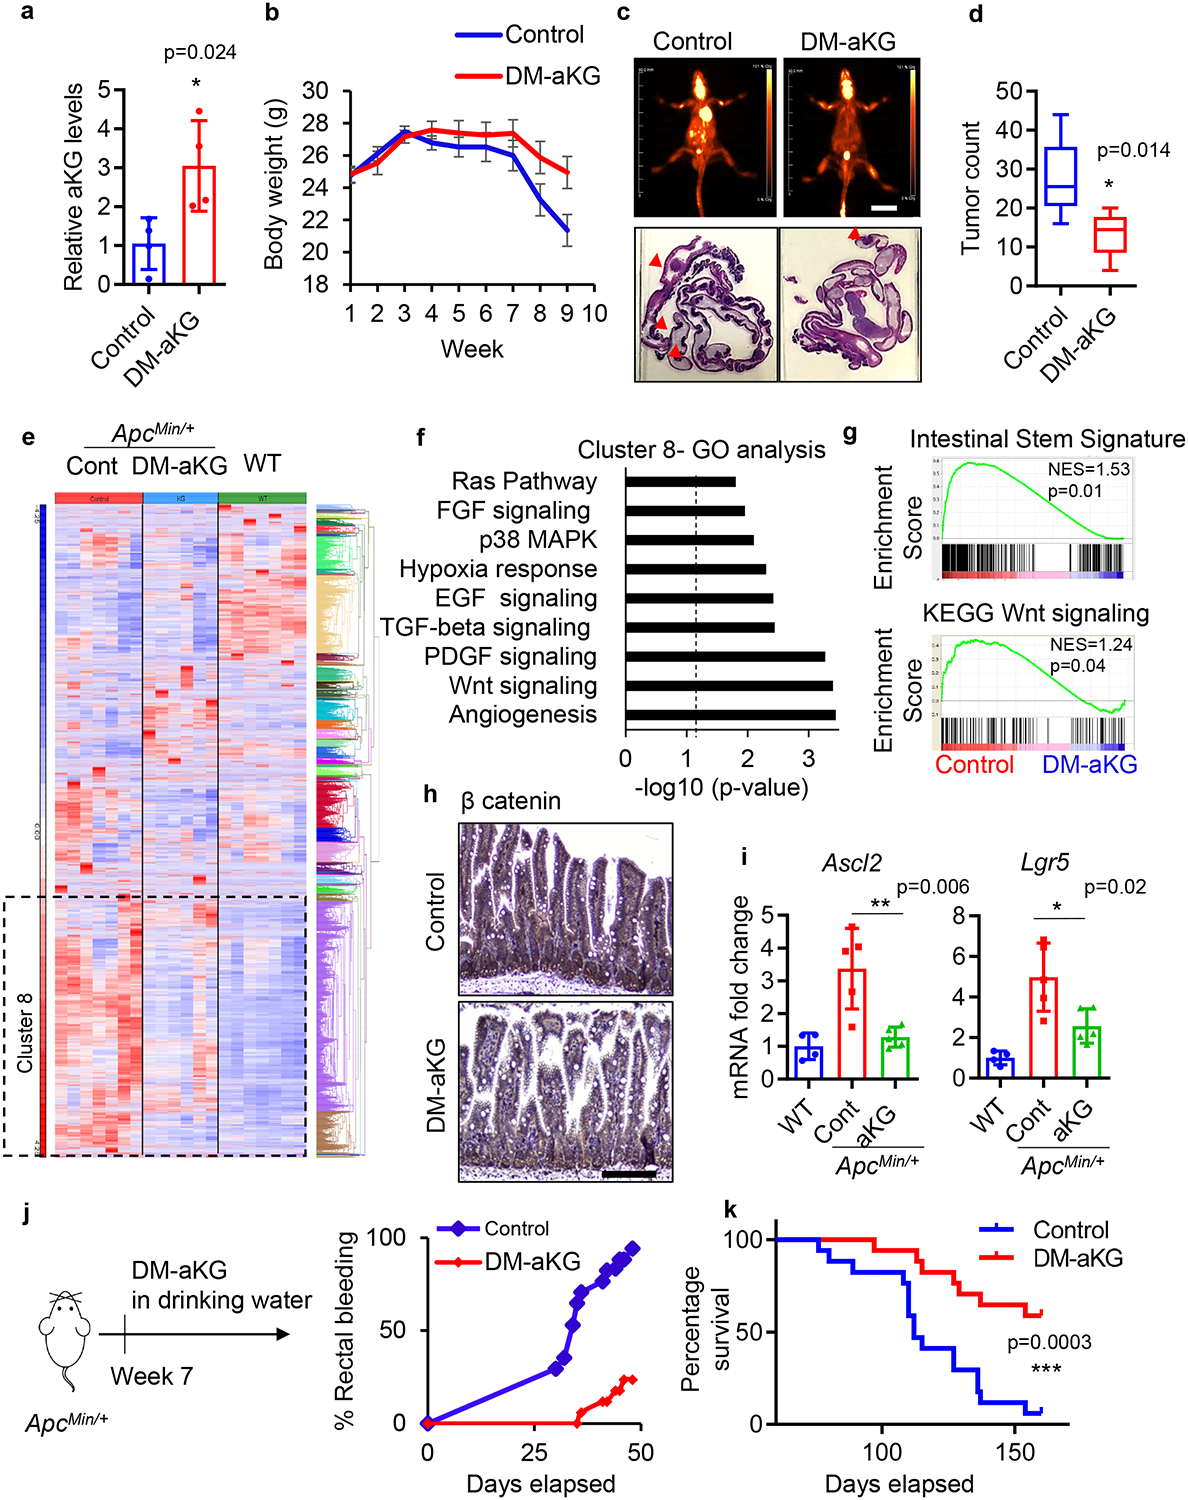
(a) Relative aKG levels in intestinal tissues of ApcMin/+ mice treated with 400 mg/kg DM-aKG via IP injection or vehicle control (n=4 mice per group). Data represent means ± SD, p value was determined by two-tailed unpaired Student’s t-test. (b) Body weight of ApcMin/+ mice treated with DM-aKG or vehicle control (n=8 mice per group), data represent means ± SEM. (c) PET scan images at day 70 after treatment (top panels) and H&E images of intestinal tissues of ApcMin/+ mice treated with DM-aKG (bottom panels). The results are representative of 3 mice per group. (d) Number of visible intestinal tumours (n=6 mice per group) in ApcMin/+ mice treated with DM-aKG or vehicle control. Box plots show the maximum, third quartile, median, first quartile and minimum values, and the p value was determined by two-tailed unpaired Student’s t-test. (e) Hierarchical clustering of gene expression from RNA sequencing data in tumour-free intestinal tissues of wildtype B6 mice, ApcMin/+ mice and ApcMin/+ mice treated with DM-aKG (n= 7 mice in control group, 6 mice in DM-aKG treated group, 7 mice in wildtype group). (f, g) Panther gene ontology enrichment analysis of cluster 8 and GSEA analysis for the indicated gene signatures between control ApcMin/+ mice and DM-aKG treated mice (n= 7 mice in control group and 6 mice in DM-aKG treated group). Dotted line in f indicate threshold of significance (p = 0.05) and p values were calculated by GO enrichment analysis software. The nominal p values in g are the statistical significance of the enrichment score analyzed by GSEA software. (h) IHC staining for β-catenin of ApcMin/+ mice treated with vehicle control or DM-aKG. The results shown are representative of 3 mice per group. (i) qPCR analysis of stem/Wnt target genes (n=5 tumours for ApcMin/+ mice and n= 4 tumours for wildtype mice). Data represent means ± SD, p values were determined by two-tailed unpaired Student’s t-test. (j) Percentage of rectal bleeding, an indication of intestinal tumours, and (k) percentage survival of ApcMin/+ mice supplemented with 15 mg/ml DM-aKG in the drinking water (n=17 mice per group). The p value in k was determined by Log-rank (Mantel-Cox) test. Scale bars, 20 mm (c), 100 μm (h). Source data are available for a, b, d and i-k.
DISCUSSION
Despite enormous progress in understanding the molecular carcinogenesis of colon cancer, the crosstalk between environmental factors and colon cancer development including Wnt signaling hyperactivation remains unclear. Here, we demonstrate the glutamine-aKG axis contributes to Wnt signaling and cellular differentiation in colon cancer. These findings shed light on the role of the metabolic environment in tumour progression and provide a potential therapeutic opportunity using metabolites for CRC treatment.
We found glutamine concentration is dramatically depleted in mouse intestinal tumours compared to healthy tissues, consistent with previous studies using metabolomic analysis comparing glutamine levels in colon patient samples with healthy tissues 19. Additionally, intratumoural glutamine deficiency is also observed in other solid tumours including hepatomas, melanomas, pancreatic carcinomas and sarcomas 39,40. In the case of CRC, Wnt-driven metabolic reprogramming may contribute to rapid glutamine utilization, which might eventually deplete the local supply leading to a period of glutamine deprivation observed in tumours 10,41. Glutamine is a vital nutrient that supports the survival of cancer cells, making glutamine metabolism an attractive target for cancer therapy 18. While complete withdrawal of glutamine may inhibit cancer cell growth, our studies suggest that tumour cells residing in chronic low glutamine conditions may become well adapted to this stressful metabolic environment 42–45. While our finding raises a potential paradoxical role for glutamine in tumour growth, it is important to consider that tumour development is a highly dynamic process. For example, oxygen is required for cancer cell proliferation, yet, it has been well established that hypoxia induces cancer stemness and drug resistance 46,47. Interestingly, hyperbaric oxygen treatment can exert some antitumour effects on xenograft tumours 48–50. Similarly, our studies suggest that acute increases in glutamine/aKG levels could be detrimental to tumour cells that have been exposed to low glutamine and adapted to these conditions.
Our data indicate that chronic glutamine restriction further activates Wnt signaling to promote cancer dedifferentiation in cells with Apc mutation. This finding is consistent with emerging evidence suggesting that other environmental factors contribute to the optimal activation of Wnt signaling in addition to genetic alterations 9,51–55. Nearly 50% of people will develop intestinal polyps at some point in their lifetime, yet only a small fraction of these benign lesions eventually develop into invasive tumours 56. It has been shown that multiple genetic mutations including APC, KRAS, P53 or SMAD are implicated in this process, yet whether non-genetic factors also contribute to the oncogenic transformation of CRC is less understood 57,58. We found glutamine restriction endows Apc mutant intestinal organoids with the ability to grow independent of intestinal niche factors and form adenocarcinoma tumours in vivo via epigenetic reprogramming. Moreover, our data suggest that the effect of low glutamine on Wnt and intestinal stemness are more profound in cells with predisposed genetic alterations compared to those from wild type cells. Thus, an altered metabolic microenvironment such as glutamine deficiency, through potentiating Wnt signaling and dedifferentiation, may ultimately contribute to tumour progression rather than initiation in CRC. We also found that low glutamine augments Wnt signaling and stemness through the depletion of intracellular aKG. Importantly, increasing intracellular aKG levels antagonized oncogenic Wnt signaling and facilitated terminal differentiation via epigenetic reprogramming in intestinal organoids and PDOs. It was previously shown that aKG induces de-differentiation and stemness by installing a hypomethylation state in embryonic stem cells 15. However, other studies also have reported the effect of aKG in driving differentiation in other cell types including iPS cells and melanoma cells 16,30. Thus, the metabolic regulation of cellular fate may also depend on the tissue of origin.
While the molecular pathogenesis of colorectal cancer is well characterized, clinical efforts to inhibit the Wnt pathway remain unsuccessful 59,60. As such, treatment regimens for advanced CRC still depend heavily on chemotherapies. Many Wnt signaling inhibitors exert detrimental effects on normal intestinal homeostasis and other tissues where physiological Wnt plays a crucial role in somatic stem cell maintenance 33. Thus, the ability to safely modulate Wnt signaling to restore terminal differentiation in colon cancer cells presents a promising therapeutic approach for colon cancer. Indeed, cancer therapies that promote terminal cellular differentiation yield impressive clinical outcomes. For example, the all-trans retinoic acid in combination with chemotherapy drives terminal differentiation resulting in a cure rate of more than 80% in patients with promyelocytic leukemia 34. Similarly, our results indicate that aKG could be used as a therapeutic agent to suppress Wnt signaling and drive CRC differentiation. This approach could represent a less aggressive therapy for the treatment of colon cancer. In conclusion, our work provides a potential therapeutic direction to harness the potency of aKG in driving intestinal differentiation to improve the clinical outcomes of patients with CRC.
METHODS
Mouse intestinal crypt isolation and organoid culture
Intestinal crypts from 6–8 week-old ApcMin/+ mice and ApcWT mice (Jackson Laboratory) were isolated from tumour-free small intestinal tissues based on a previous study 61. No intestinal tumours were detected in the young ApcMin/+ mice that were used for organoid generation. The isolated crypts were cultured in IntestiCult™ organoid media containing EGF, Noggin and R-Spondin (Stemcell, 06005) supplemented with penicillin/streptomycin and Primocin and mixed at 1:1 ratio with Growth Factor Reduced Matrigel (Corning, 356230). 50 μL of the organoid mix was plated into a pre-warmed 48-well plate followed by 10-minute incubation at 37°C to polymerize the matrigel. 200 μL of room temperature intestinal organoids medium was added on the side of the well to cover the Matrigel. For organoid maintenance, the medium was changed every other day, and the organoids were passaged 1:5 every week. To passage the organoids, the culture medium was removed and the matrigel was dissociated in EDTA-PBS and incubated briefly in EDTA-PBS at room temperature for 10 minutes on a rocking platform. For subcloning assays, organoids were dissociated into single cells using TrypLE (ThermoFisher, 12605036). For glutamine starvation experiments, DMEM/F-12 medium- No glutamine (Gibco, 21331020) was used as a basal media and L-glutamine (Corning, 25–005) was added back to the desired concentration. Small intestinal shApc/Kras/p53−/− organoids were cultured with 500 ng/ml doxycycline, and kindly provided by the Lukas Dow laboratory (Weill Cornell Medicine).
Patient-derived colon isolation and organoid culture
Colonic human tissue was collected following surgical resection with informed consent and IRB approval at St. Joseph Hospital Orange (Orange, CA). All patients were diagnosed with colorectal cancer and diagnosis was confirmed by a pathologist. Detailed diagnosis of participants were included in extended data Figure 6a and the tissues were obtained from the following donors: T1 from a 74 year-old male donor, T9 from a 48 year-old female donor, T13 from a 69 year-old female donor, T23 from a 83 year old male donor, and T27 from a 72 year-old male donor. Establishment and culture of organoids was performed based on a previous study 62. Tumour Organoids were grown in basement membrane extract (Cultrex PathClear BME Type 2) with medium consisting of: 50 % advanced DMEM/F12 (supplemented with penicillin/streptomycin, 10mM HEPES, Glutamax, and Primocin), 20% R-Spondin conditioned medium (from Cultrex Rspo1-expressing cells, Trevigen), 10% Noggin conditioned medium (from HEK293 cells stably transfected with pcDNA3 NEO mouse Noggin insert, kindly provided by Dr. Hans Clevers Laboratory), 20% Expansion medium 5x (final concentrations in medium of the following 1x B27, 1.25 mM n-Acetyl Cysteine, 10 mM Nicotinamide, 50 ng/ml human EGF, 10 nM Gastrin, 500 nM A83–01, 3 μM SB202190, 10 nM Prostaglandine E2). The VENTANA MMR IHC Panel was used as a qualitative immunohistochemistry (IHC) test for light microscopic assessment of mismatch repair (MMR) proteins (MLH1, PMS2, MSH2, and MSH6) and BRAF V600E proteins in formalin-fixed, paraffin-embedded colorectal cancer (CRC) tissue sections. The OptiView DAB IHC Detection Kit was used with MLH1, MSH2, MSH6 and BRAF V600E, and the OptiView DAB IHC Detection Kit with OptiView Amplification Kit was used for PMS2 detection. Methodology for BRAF, KRAS, NRAS mutation analysis was as follows: DNA was isolated from cells or microdissection-enriched FFPE tissue, mutation evaluation by high-sensitivity Sanger sequencing bidirectional method from Neogenomics (Aliso Viejo, CA).
Cell culture, reagents and siRNA transfection
SW620 cells (ATCC) were cultured in Dulbecco’s Modified Eagle Medium (DMEM, Corning) supplemented with 10% fetal bovine serum (FBS; Gemini Bio-Products) with penicillin/ streptomycin (Gemini Bio-Products) at 37 °C with 5 % CO2. For glutamine starvation experiments, DMEM-No glutamine (Corning) and 10 % dialyzed FBS (Gemini Bio-Products) were used to make glutamine-free media. For cell proliferation assays, cells were cultured in a 96-well plate for treatment. Relative cell number was determined by CellTiter-Glo assay (Promega) according to the manufacturer’s protocol. For siRNA transfection, ON-TARGET plus Human TET1 siRNA (Dharmacon, L-014635-03-0005) or control siRNA (Dharmacon) was used in the presence of RNAi Max lipofectamine reagent (Invitrogen). DM-aKG treatment was performed two days after transfection. Reagents: Dimethyl α-ketoglutarate (Sigma, 349631), N-Acetyl-L-cysteine/NAC (Sigma, A7250), Dimethyl-succinate (Sigma), iCRT3 (Millipore, 219332), IWP2 (Stemgent 04–0034), XAV939 (Sigma, X3004), CB-839 (Selleckchem, 7655).
Metabolite, ALT and AST measurement assay
For glutamine measurement from tissues or tumours, 20–40 mg of frozen/fresh tissue was homogenized in ice-cold 70% ethanol by Precellys 24 homogenizer, and the supernatant was collected and dried using a SpeedVac Vacuum Concentrator. The pellet was collected and suspended in water (1 μL water per mg of fresh tissue). The concentration of glutamine in the solution was then determined by the EnzyChrom Glutamine Assay Kit (BioAssay Systems) according to the manufacturer’s protocol. For aKG measurement, Alpha Ketoglutarate Assay Kit (Abcam) was used according to the manufacturer’s protocol for colorimetric assay without the deproteinization step. Intracellular succinate was measured using Succinate assay kit (Abcam) and ROS levels were detected using Cellular ROS Assay Red Kit (Abcam, 186027). For ALT and AST measurement in mouse serum, EnzyChrom™ Alanine Transaminase Assay Kit and EnzyChromTM Aspartate Transaminase Assay Kit from Bioassays were used according to the manufacturer’s protocol.
Metabolomics:
Metabolite extraction was performed as previous described 63. Briefly, organoids after treatment were washed with NaCl buffer and 1 ml of 80% methanol/water (HPLC grade) was added to the cell pellet on dry ice. The pellet was then transferred to −80°C freezer for 15 min to further inactivate enzymes. The metabolite extract was dried by speed vacuum. The samples were prepared and analyzed by Liquid chromatography–mass spectrometry (LC-MS) at Duke University (Durham, NC) and described previously 64.
Immunofluorescence and Immunohistochemistry
For C-terminus APC staining, organoids were digested into single cells and cultured in glass chamber with organoid medium supplemented with 10% FBS overnight. Organoids after treatment were fixed with 4% formaldehyde for 10 minutes at room temperature followed by blocking with 1% BSA at 4°C overnight. The organoids were stained with primary antibodies against KRT20 (Cell Signaling, 13063), Non-phospho (Active) β-catenin (Cell Signaling, 19807), Muc2 (Abcam, 11197), C-terminus APC, clone 28.9 (Millipore, 3786) or DAPI (ThermoFisher, D1306) at 4°C overnight. Secondary antibodies, goat anti-rabbit Alexa Fluor 488 (Invitrogen, 11037) and goat anti-mouse Alexa Fluor 594 (Invitrogen, A11029), were purchased from Millipore-Sigma. Alkaline Phosphatase activity was determined by Red Alkaline Phosphatase Substrate Kit (Vector, SK5100). Images were captured with 20x magnification by using a Zeiss LSM 700 Confocal Microscope and the ZEN Blue image acquisition software. IHC staining were performed on sections prepared from formalin fixed and paraffin-embedded tissue by San Diego Pathology Group (San Diego, CA) and UCI experimental tissue resource pathology core.
RNA extraction, quantitative real-time PCR
Total RNA was extracted and purified using Trizol (Invitrogen) or RNeasy kit (Qiagen) according to the manufacturer’s protocol. qScript cDNA synthesis kit (Quanta Biosciences) was used to make cDNA. Quantitative real-time PCR were performed using SYBR-Green PCR master mix (Quanta Biosciences) and a BioRad real-time PCR machine. Relative gene expression was normalized to rRNA ribosomal 18S or Actin. The primers used in the study are listed in Supplementary table 4.
RNA and DNA sequencing
RNA sequencing: Kapa RNA mRNA HyperPrep kit (Kapa Biosystems, Cat KR1352) was used for RNA sequencing library preparation. 100 ng of total RNA from each sample was used for polyA RNA enrichment using magnetic oligo-dT beads. cBot cluster generation system (Illumina) with HiSeq SR Cluster V4 Kit was used to prepare library templates for sequencing. Sequencing run was performed using Illumina HiSeq 2500 with HiSeq SBS V4 Kits. Real time analysis 2.2.38 (RTA) software was used to process the image analysis and base calling. RNA-seq sequences are aligned to mouse genome (mm10) using HISAT2 and RNA-seq expression level were measured as RPKM using Partek Genomic Suite software (v6.6). Different expressed genes were detected using Partek GS’s RNA-seq pipeline. The significantly different expressed genes were detected using FDR adjusted p-value <0.05 and +/−1.5-fold change as cutoff.
GSEA analysis was based on the following gene sets: Wnt signaling: KEGG_WNT_SIGNALING_PATHWAY (M19428), Intestinal stem cell signature and intestinal differentiation signature from a previous study 65.
RRBS-seq sequencing: The RRBS-seq sequencing libraries were prepared with City of Hope IGC modified protocol. Briefly, 250 ng of genomic DNA was digested with the methylation insensitive restriction enzyme MspI (NEB) at 37°C overnight, and followed by incubation at 80 °C for 20 minutes to inactivate MspI. In the same reaction tube, Klenow Fragment (3′→5′ exo-minus; NEB) and dNTP was added and incubated at 37°C for 40 minutes to repair MspI digested DNA and add dAMP to the 3’ end. Illumina methylated adapters and T4 DNA ligase (Promega) were added in the same tube for an overnight ligation. 1.6xAmpureXp beads purification was used for the cleanup after the ligation. EZ DNA Methylation-Gold kit (Zymo Resarch, Cat. D5005) was used for the DNA bisulfite conversion. Bisulfite converted DNA was amplified with a 12 cycle of PCR with Pfu Turbo Cx Hotstart DNA Polymerase (Agilent). The final PCR products were run on 6% TBE acrylamide gels and DNA fragments with size from 160–500 bp (insert size 40–380 bp) were excised and eluted in EB buffer. RRBS-seq library templates were prepared for sequencing with Illumina HiSeq PE Cluster V4 Kit, sequencing runs were performed in the paired end mode of 101cycle on Illumina HiSeq 2500 with HiSeq SBS V4 Kits. Real-time analysis (RTA) 2.2.38 software was used to process the image analysis and base calling. RRBS-seq sequences were aligned to mouse genome using novocraft’s Novoalign (V3.08.02). The bisulphite reference sequence was generated based on mm10 genome sequence using Novocraft’s novoindex with bisulphite mode. The alignment results were used to detect CpG Methylation site using Novocraft’s novomyethyl tool. Each sample type has three biological replications and the results of each biology replication were merged to generate the total methylation sites list. Most of the CpG methylation sites are close to gene region (+/−20 Kbps) and over 80% of the methylation sites are located close to gene regions. Different methylation pattern between samples are detected using ANOVA with FDR adjusted p-value <0.05 and +/−1.5-fold change on methylation percentage. To identify the methylation status at the gene level, the average of methylation difference of significant (FDR adjusted p-value) differential methylation sites was calculated.
DNA methylation profiling microarray: DNA was extracted from SW620 cells after DM-aKG treatment by DNeasy Blood & Tissue Kit. DNA methylation profiling was performed using Infinium MethylationEPIC BeadChip Kit (Illumina) according to manufacturer’s protocol at The UCSD IGM Genomics Center.
Exome sequencing: 250 ng genomic DNA was fragmented using Covaris S220 (Covaris, Woburn, MA) with the 200 bp peak setting. The fragmented DNA was end-repaired and ligated to Illumina adaptor oligonucleotides with Kapa Hyper Prep Kit (KAPA Biosystems, Wilmington, MA; Cat.KK8504). Ligation products were purified and amplified with a 7 cycle of PCR. The enriched PCR products were subject to the exome capture procedure using the SureSelecXT mouse All Exon kit (Agilent, Technologies, Santa Clara, CA; Cat 5190–4641) according to manufacturer’s protocols. The captured products were further amplified with an 8-cycle of PCR. Exome-seq library templates were prepared for sequencing with Illumina HiSeq PE Cluster V4 Kit as described in RRBS sequencing. Whole exome capturing and sequencing on target regions designed by Agilent SureSelect Mouse All Exon V1 were performed. The circular binary segmentation (CBS) algorithm was used to identify abnormal copy number change between samples. Read depth of coverage in each exon region was calculated, and log2-based coverage difference was further adjusted by subtracting the mean of log2-based coverage difference between y. The outcome was smoothed and segmented to identify potential copy number change between the samples. Among the potential copy number change, only the segments that span across at least 2 markers and are at least log2 (1.5) distance away from the mean copy number level was retained.
Immunoblotting
Following treatment, organoids and cells were harvested in ice cold PBS, lysed in RIPA buffer containing protease and phosphatase inhibitor (Thermo Scientific) and followed by brief sonication. Equal amount of protein, as measured by BCA protein assay, were loaded into precast NuPAGE Bis-Tris gels (Life Technologies) followed by transfer onto nitrocellulose or PVDF membrane. After blocking with 5% milk-PBS, membranes were incubated with primary antibody overnight at 4°C with shaking followed by horseradish-peroxidase-conjugated secondary antibodies for 1 hour at room temperature. The signal was visualized by Western Lightning Plus-ECL (PerkinElmer). The antibodies used are LGR5 (Abcam, 75732), Non-phospho/ Active β-Catenin (Cell Signaling, 19807), Histone H3 (Cell Signaling, 4499), Apc (Millipore, MABC202), H3K4me3 (Cell Signaling, 9751), H3K27me3 (Cell Signaling, 9733) H3K9me3 (Cell Signaling, 13969), H3K36me3 (Cell Signaling, 4909).
For Dot blot assay, DNeasy Blood & Tissue Kit (Qiagen) was used to isolate genomic DNA. After incubation at 95 °C for 5 minutes, equal amount of DNA was loaded onto a positively charged nylon membrane (Amersham Hybond-N+; GE Healthcare). The membrane was UV cross-linked and blocked in 5 % milk-PBS followed by incubation with anti-5 methyl-cytosine (Millipore, MABE146) overnight at 4 °C. After the secondary antibody incubation for 1 hour at room temperature, the signal was visualized using Western Lightning Plus-ECL (Perkin-Elmer).
MeDIP and ChIP.
For methylated DNA immunoprecipitation (MeDIP), genomic DNA following DM-aKG treatment was isolated using DNeasy Blood & Tissue Kit (Qiagen) and sonicated to yield 300–1000 bp DNA fragments. The sonicated DNA was immunoprecipitated with a monoclonal antibody against 5-methylcytosine (Millipore, MABE146) for 3 hours or IgG at 4 °C with shaking. DNA complexes was pulled down using Protein A Agarose and purified with PCR purification kit. The DNA was then analyzed by RT-qPCR with the MeDIP-hDKK4 primers listed in Supplementary table 4.
The chromatin immunoprecipitation assay (ChIP) was performed using a ChIP assay kit (Millipore) according to the manufacturer’s guideline. Cells after treatment were cross-linked with 1% formaldehyde followed by sonication to yield 200–1000bp DNA fragments. 1 μg of H3K4me3 antibody or IgG was used for each overnight immunoprecipitation with rotation at 4°C. The DNA was then analyzed by RT-qPCR with the primer listed in Supplementary table 4.
Animal study
All animal procedures and experiments were performed in compliance with ethical guidelines approved by the Institutional Animal Care and Use Committee at the University of California, Irvine, under the protocol number AUP-17–222. Sample size was generally chosen based on preliminary data indicating the variance within each group and the differences between groups. No statistical method was used to predetermine sample size.
Xenotransplantation of organoids in mice: APC mutant organoids cultured in low glutamine (0.3 mM) condition and paired control organoids with similar passage were cultured for one week. Organoids were expanded in organoid culture DMEM/F12 medium containing (Recombinant Murine EGF 50 ng/ml (Peprotech), Recombinant murine Wnt-3A 100 ng/ml (Millipore GF-160), Recombinant Murine Noggin 50 ng/ml (R&D system), 20% R-Spondin conditioned medium (from Rspo1-expressing cells, Trevigen), penicillin, and streptomycin. Organoids were dissociated into single cell with TrypLE (Thermofisher), and 1 million cells, suspended in cold Matrigel and DMEM/F12 (1:1 ratio), were injected subcutaneously into the flanks of 10-week-old male NSG (NOD scid gamma) mice bred at UCI animal facility (n=10 mice). Control organoids were injected into the left flank and low glutamine organoids were injected into the right flank. The established tumours were collected and fixed for subsequent histological analysis. To generate xenograft tumours with AKP organoids, 7-week-old athymic nude male mice (NCr-Foxn1nu, Taconic Laboratories, Rensselaer, NY) were injected subcutaneously into both flanks with 0.5 × 10⁶ cells of AKP organoids in DMEM/F12 media and Matrigel (1:1 ratio), n=12 mice. The mice were treated with doxycycline in drinking water at 0.5 mg/ml with sucrose to turn on Apc shRNA. After the tumours were established (around 100 mm3), the mice were randomized into groups treated with PBS control, 600 mg/kg DM-aKG by intraperitoneal injection, or 25 mg/ml DM-aKG in drinking water. SW620 xenograft tumours were generated with 1 × 10⁶ cells in 8-week-old athymic nude male mice, n=12 mice. After tumour engraftment, the mice were randomized into groups treated with control PBS or with 600 mg/kg DM-aKG by intraperitoneal injection four times per week. SW620 xenograft tumours were generated with 1 × 10⁶ cells in 8-week-old athymic nude male mice. After tumour engraftment, the mice were randomized into groups treated with PBS control or DM-aKG by intraperitoneal injection.
DM-aKG treatment in ApcMin/+ mice: 5–8 week-old C57BL/6J-ApcMin/J mice were obtained from Jackson laboratory (MIN-002020). ApcMin/+ mice were bred by crossing the Male ApcMin/+ mice with female wild-type C57BL/6J mice. APC mutant genotyping was determined by Transnetyx Inc. 8–9 week ApcMin/+ mice were treated with 400 mg/kg DM-aKG by intraperitoneal injection (n=16 male mice) or in drinking water supplemented with 15 mg/ml of DM-aKG (n=17 male mice and 19 female mice) (Sigma-349631 or TCI Chemical-K0013). For DM-aKG in drinking water experiment, DM-aKG supplemented water was replaced every other day for 8–9 week ApcMin/+ mice. Survival endpoint was determined by established parameters including 25 % of body weight loss, pale extremities, hunching, poor body condition/dehydration, lethargy and/or irreversible rectal relapse. For 18F-FDG PET imaging of ApcMin/+, mice were fasted overnight and 100μCi FDG was i.v. injected and PET images were taken 1-hour post injection.
Statistical analysis and reproducibility
Graphic representation and statistical analysis such as unpaired Student’s t-test was calculated by Graphpad Prism 7 or Excel and used to determine the statistical significance of differences between means (* p < 0.05, ** p < 0.01, *** p < 0.001). Results are shown as averages; error bars represent standard deviation (SD) or standard error of the mean (SEM) if indicated. p-value for mice survival study was determined by Log-rank (Mantel-Cox) test in Graphpad. No statistical method was used to predetermine sample size. For the animal study, mice were randomly assigned to the groups before treatments and the investigators were blinded to allocation of mice into different treatment groups. For the survival study, two female APCMin/+ mice that developed large mammary tumours were euthanized and were excluded from the survival study based on pre-established exclusion criteria. The investigators were not blinded to outcome assessment. For tumour analysis, at least three or more independent tumours from each group were used for the analysis. Experimental reports in the study were reliably reproduced in at least two independent experiments or by multiple biologically independent replicates.
Reporting Summary
Further information on research design is available in the Nature Research Reporting Summary linked to this article.
Data availability
DNA and RNA sequencing data that support the findings of this study have been deposited in the Gene Expression Omnibus (GEO) under accession code GSE140270. Super Series GSE140270 is composed of the following SubSeries: GSE140263, GSE140264, GSE140265 GSE140266 GSE140267 GSE140269. Metabolomics raw data have been included in Supplementary Table 5. Source data for Fig. 1–3, 5–7 and Extended Data Fig.1–7 have been provided as Source Data files. All other data supporting the findings of this study are available from the corresponding author on reasonable request.
Extended Data
Extended Data Fig. 1. The effect of glutamine starvation on ApcMin/+ and wildtype organoids.
(a) Relative glutamine uptake in ApcMin/+ organoids and wildtype organoids (n=3 biologically independent samples) and relative glutamine uptake in AKP organoids upon doxycycline addition (n=4 biologically independent samples). (b) Percentage of cystic organoid in ApcMin/+ organoids upon glutamine deprivation (0.2 mM and 0.4 mM) overtime (n=7 biologically independent cultures). (c) Percentage of cystic organoids and organoid number of ApcMin/+ organoids treated with CB-839 for 1 week (n=3 biologically independent cultures). (d) Percentage of wildtype organoids with cystic morphology after 4 passages in low glutamine conditon (n=6 biologically independent cultures). (e) qPCR analysis of Axin2 in wildtype organoids cultured in control or low glutamine medium for 1 week. Data from n=3 independent experiments with a line marking the mean value. (f, g) Control and glutamine-starved wildtype organoids were dissociated into single cells, and equal number of organoid-derived cells were cultured in organoid medium with 3 mM or 0.3 mM glutamine (low gln). Secondary organoid formation and percentage of cystic organoids are shown (n=9 biologically independent cultures). Data in a-e, g represent means +/− SD, p values were determined by two-tailed unpaired Student’s t-test. Scale bars, 1000 μm (c, d, f). Source data are provided for a-e, g.
Extended Data Fig. 2. Genetic alterations do not contribute to low-glutamine induced stemness.
(a) Identified genetic alterations in glutamine-starved ApcMin/+ organoids compared to paired control organoids as determined by exome sequencing. (b) Brightfield images of control and glutamine-starved ApcMin/+organoids after 12 passages. Results are representative of three biologically independent cultures. (c) Immunoblotting for full length and truncated Apc protein in control and glutamine starved ApcMin/+ organoids after 8 passages. Results are representative of three independent experiments. (d) Representative images and percentage of cells with full-length Apc protein based on immunofluorescent staining with C-terminus Apc antibody in wildtype organoids, tumour organoids derived from adenomas derived in ApcMin/+ mice, and ApcMin/+organoids from healthy tissues in control medium and upon glutamine deprivation (n=4 biologically independent cultures), data represent means +/− SD. (e, f) Representative images and percentage of shApc /KrasG12D/p53fl/fl (AKP) organoid with crypts cultured in control or low glutamine medium for 10 days (n=5 biologically independent cultures). (g) qPCR analysis of Krt20 and Lgr5 in a similar experiment described in e after 3 days of glutamine deprivation. Data from n=2 independent experiments with a line marking the mean value. (h) Hierarchical clustering of significant differentiated gene expression of ApcMin/+ organoids cultured in control or low-glutamine medium (n=3 biologically independent samples). (i) qPCR analysis of the indicated genes in SW620 colon cancer cells (n=3 technical replicates and data represent means) cultured in medium with the indicated glutamine concentration for 3 days. A single experiment is shown that is representative of two independent experiments with similar results. Scale bars, 200 μm (b), 400 μm (d, e). Unprocessed blot images for c and source data for d, f, g, i are provided.
Extended Data Fig. 3. The role of aKG in low-glutamine induced stemness.
(a) Schematic diagram of glutamine metabolism. (b) Relative metabolite levels as measured by LC-MS in ApcMin/+ organoids cultured in control and low glutamine medium (n=4 biologically independent samples). (c) Relative aKG levels in intestinal tumours from ApcMin/+ mice and normal intestinal tissues of wildtype mice (n=5 mice per group). Data in b, c represent means +/− SD, and p values were determined by two-tailed unpaired Student’s t-test. (d, e) Relative intracellular aKG and succinate levels in ApcMin/+ organoids upon DM-aKG (n=5 biologically independent samples) or DM-succinate supplementation (n=6 biologically independent samples). (f) Immunofluorescent staining for ROS in ApcMin/+ organoids under low glutamine or low glutamine medium supplemented with NAC. Results are representative from three biologically independent samples. (g) Control organoids, glutamine-starved organoids treated with or without 3.5 mM DM-aKG were dissociated into single cells. An equal number of organoid-derived cells were cultured, and secondary organoid formation (n=6 biologically independent cultures) and cell proliferation (n=3 biologically independent cultures) were measured after 1 week and are shown. p values were determined by two-tailed unpaired Student’s t-test. (h) Immunoblotting for Lgr5 and (i) qPCR analysis for Axin2 expression in ApcMin/+ organoid cultured in control and low glutamine medium with or without DM-aKG (n= 2 independent experiments with a line marking the mean value). Box plots in d, e, g show the maximum, third quartile, median, first quartile and minimum values, and the p values were determined by two-tailed unpaired Student’s t-test. Scale bar, 400 μm (f), 1000 μm (g). Unprocessed blot images for h and source data for b-e and g, i are provided.
Extended Data Fig. 4. The effect of aKG and glutamine supplementation on intestinal differentiation.
(a) Representative brightfield images and immunofluorescent staining of the differentiation marker Krt20 in ApcMin/+ organoids treated with 3 mM DM-aKG for 3 days. Results are representative of three independent experiments. (b) Representative images and relative organoid number of control ApcMin/+ organoid or glutamine-starved ApcMin/+ organoids upon 2 mM DM-aKG treatment or 6mM glutamine addition for 1 week (n=3 biologically independent cultures). Data represent means +/− SD, and the p values were determined by two-tailed unpaired Student’s t-test. (c) Overlapping gene expression profile of ApcMin/+ organoids cultured in low glutamine medium or treated with aKG reveals opposing regulation on Wnt target genes and intestinal differentiation related genes. Scale bars, 1000 μm (Brightfield), 200 μm (Immunofluorescence). Source data are provided for b.
Extended Data Fig. 5. aKG promotes hypomethylation of histone and DNA in CRC cells.
(a) qPCR analysis of Axin2 in control and glutamine-starved organoids treated with 1 μM decitabine for 3 days. Data from n=2 independent experiments with a line marking the mean value. (b, c) Dot blot analysis of 5meC levels in ApcMin/+ organoids in control and low glutamine medium and SW620 cells in control, low glutamine medium or low glutamine medium supplemented with 8mM DM-aKG. Results are representative from two independent experiments. (d) Heatmap of the differential methylated regions (different methylated ratio >+/−20%) in SW620 cells upon 8 mM DM-aKG treatment for 3 days. Beta value of the methylation ratio are shown (top) (n= 2 biologically independent samples). (e) qPCR analysis of Dkk4 in ApcMin/+ organoids treated with 3.5 mM DM-aKG or 1 μM decitabine (n=3 technical replicates). A repeat experiment showed similar results. (f) Dot blot analysis of 5meC levels in SW620 cells treated with DM-aKG (left), MeDIP experiment with 5meC antibody for DKK4 promoter in SW620 cells upon 8 mM DM-aKG treatment (right). Data show means ± SD of n=4 technical replicates. Results are representative of two independent experiments. (g) qPCR analysis of TET1 expression in SW620 cells transfected with control siRNA or TET1 siRNA (data show means of n=3 technical replicates). (h) qPCR analysis of DKK4 and LGR5 expression in control SW620 cells or TET1 siRNA knockdown cells following DM-aKG treatment. Data from n=2 independent experiments with a line marking the mean value. (i) Representative immunoblot of histone methylation in SW620 cells treated with DM-aKG from two independent experiments. (j) ChIP analysis of H3K4 levels on promoter regions of AXIN2 and MYC in SW620 cells in response to 8mM DM-aKG treatment for 3 days (n=4 technical replicates). (k) Representative immunoblot of H3K4me3 in SW620 cells in control, low-glutamine medium or low glutamine medium supplemented with 8 mM DM-aKG from two independent experiments. (l) ChIP analysis of H3K4me3 levels on promoter regions of AXIN2 and MYC in SW620 cells in response to glutamine starvation after 1 week (n=4 technical replicates). Results in j and l represent means ± SD and are representative of two independent experiments. Unprocessed blot images are provided for b, c, f, i and k. Source data are provided for a, e-h, j, and l.
Extended Data Fig. 6. DM-aKG treatment inhibits initiation and growth of PDOs.
(a) Clinical information on PDOs used in the study. (b) Immunoblot probed for Apc protein in different PDOs. (c) Relative organoid size (n=50 organoids) and (d) representative images of four biologically independent cultures of T23 PDO treated with 6 mM DM-aKG for 7 days, followed by metabolite wash-out and subsequent culture for 7 days. Data in c represent means ± SD. Scale bar, 400 μm (d). Unprocessed blot images for b and source data for c is provided.
Extended Data Fig. 7. The effect of DM-aKG treatment in mice.
(a) Body weight and histological analysis of wildtype mice treated with 400 mg/kg DM-aKG via IP injection for more than 2 months (n=4 mice per group). (b) Representative IHC staining for Cyclin D1 in intestinal tissues collected from ApcMin/+ mice treated with DM-aKG from three mice per group. (c) Gene expression analysis from RNA sequencing performed on the intestinal tissues of wildtype mice (n=7 mice), ApcMin/+ mice (n=7 mice), and ApcMin/+ mice treated with DM-aKG (n=6 mice). (d) Body weight changes and images of liver and spleen from ApcMin/+ mice treated with DM-aKG (n=5 mice per group). (e) Liver and kidney function of wildtype mice treated with 15 mg/ml DM-aKG supplemented in drinking water for more than 4 months (n=5 mice per group). Data shown in a, d, e are means +/− SD. The p values in e were determined by two-tailed unpaired Student’s t-test. Source data are provided for a, d, e.
Supplementary Material
ACKNOWLEDGMENTS
We thank members of the Kong laboratory and Waterman laboratory, E.J. Stanbridge for helpful comments on the manuscript. We thank D.T. Florina for assistance with animal experiments and L. Dow Laboratory (Weill Cornell) for the AKP organoids. This research was supported by funds from NIH: R01CA183989 and R01GM132142 to M.K.; R01CA17765 to M.L.W. and R.A.E.; U54CA217378 to M.L.W; American Cancer Society (grant number RSG-16-085-01-TBE) to M.K.; E.A.H. is supported by American Cancer Society (PFDDC-132846). A.N.H. is supported by NSF grant DGE-1321846 and NIH T32CA009054. Research reported here includes work carried out in Core Facilities, supported by the NIH under grant number P30CA062203.
Footnotes
COMPETING INTERESTS
The authors declare no competing interests.
REFERENCES
- 1.Torre LA et al. Global cancer statistics, 2012. CA: a cancer journal for clinicians 65, 87–108, doi: 10.3322/caac.21262 (2015). [DOI] [PubMed] [Google Scholar]
- 2.Fearon ER Molecular Genetics of Colorectal Cancer. Annual Review of Pathology: Mechanisms of Disease 6, 479–507, doi: 10.1146/annurev-pathol-011110-130235 (2011). [DOI] [PubMed] [Google Scholar]
- 3.Schepers A & Clevers H Wnt signaling, stem cells, and cancer of the gastrointestinal tract. Cold Spring Harbor perspectives in biology 4, a007989, doi: 10.1101/cshperspect.a007989 (2012). [DOI] [PMC free article] [PubMed] [Google Scholar]
- 4.Drost J et al. Sequential cancer mutations in cultured human intestinal stem cells. Nature 521, 43–47, doi: 10.1038/nature14415 (2015). [DOI] [PubMed] [Google Scholar]
- 5.Kinzler KW & Vogelstein B Lessons from hereditary colorectal cancer. Cell 87, 159–170 (1996). [DOI] [PubMed] [Google Scholar]
- 6.Fearon ER & Vogelstein B A genetic model for colorectal tumorigenesis. Cell 61, 759–767 (1990). [DOI] [PubMed] [Google Scholar]
- 7.de Sousa e Melo F et al. A distinct role for Lgr5(+) stem cells in primary and metastatic colon cancer. Nature 543, 676–680, doi: 10.1038/nature21713 (2017). [DOI] [PubMed] [Google Scholar]
- 8.Medema JP Targeting the Colorectal Cancer Stem Cell. The New England journal of medicine 377, 888–890, doi: 10.1056/NEJMcibr1706541 (2017). [DOI] [PubMed] [Google Scholar]
- 9.Vermeulen L et al. Wnt activity defines colon cancer stem cells and is regulated by the microenvironment. Nature cell biology 12, 468–476, doi: 10.1038/ncb2048 (2010). [DOI] [PubMed] [Google Scholar]
- 10.Pate KT et al. Wnt signaling directs a metabolic program of glycolysis and angiogenesis in colon cancer. The EMBO journal 33, 1454–1473, doi: 10.15252/embj.201488598 (2014). [DOI] [PMC free article] [PubMed] [Google Scholar]
- 11.Gao P et al. c-Myc suppression of miR-23a/b enhances mitochondrial glutaminase expression and glutamine metabolism. Nature 458, 762–765, doi: 10.1038/nature07823 (2009). [DOI] [PMC free article] [PubMed] [Google Scholar]
- 12.Huang F, Zhang Q, Ma H, Lv Q & Zhang T Expression of glutaminase is upregulated in colorectal cancer and of clinical significance. International journal of clinical and experimental pathology 7, 1093–1100 (2014). [PMC free article] [PubMed] [Google Scholar]
- 13.Kim MH & Kim H The Roles of Glutamine in the Intestine and Its Implication in Intestinal Diseases. International journal of molecular sciences 18, doi: 10.3390/ijms18051051 (2017). [DOI] [PMC free article] [PubMed] [Google Scholar]
- 14.Le A et al. Glucose-independent glutamine metabolism via TCA cycling for proliferation and survival in B cells. Cell metabolism 15, 110–121, doi: 10.1016/j.cmet.2011.12.009 (2012). [DOI] [PMC free article] [PubMed] [Google Scholar]
- 15.Carey BW, Finley LW, Cross JR, Allis CD & Thompson CB Intracellular alpha-ketoglutarate maintains the pluripotency of embryonic stem cells. Nature 518, 413–416, doi: 10.1038/nature13981 (2015). [DOI] [PMC free article] [PubMed] [Google Scholar]
- 16.Pan M et al. Regional glutamine deficiency in tumours promotes dedifferentiation through inhibition of histone demethylation. Nature cell biology 18, 1090–1101, doi: 10.1038/ncb3410 (2016). [DOI] [PMC free article] [PubMed] [Google Scholar]
- 17.Tran TQ, Lowman XH & Kong M Molecular Pathways: Metabolic Control of Histone Methylation and Gene Expression in Cancer. Clinical cancer research : an official journal of the American Association for Cancer Research 23, 4004–4009, doi: 10.1158/1078-0432.CCR-16-2506 (2017). [DOI] [PMC free article] [PubMed] [Google Scholar]
- 18.Altman BJ, Stine ZE & Dang CV From Krebs to clinic: glutamine metabolism to cancer therapy. Nature reviews. Cancer 16, 749, doi: 10.1038/nrc.2016.114 (2016). [DOI] [PubMed] [Google Scholar]
- 19.Denkert C et al. Metabolite profiling of human colon carcinoma--deregulation of TCA cycle and amino acid turnover. Molecular cancer 7, 72, doi: 10.1186/1476-4598-7-72 (2008). [DOI] [PMC free article] [PubMed] [Google Scholar]
- 20.Schuijers J et al. Ascl2 acts as an R-spondin/Wnt-responsive switch to control stemness in intestinal crypts. Cell stem cell 16, 158–170, doi: 10.1016/j.stem.2014.12.006 (2015). [DOI] [PubMed] [Google Scholar]
- 21.Gregorieff A & Clevers H Wnt signaling in the intestinal epithelium: from endoderm to cancer. Genes & development 19, 877–890, doi: 10.1101/gad.1295405 (2005). [DOI] [PubMed] [Google Scholar]
- 22.Voronov E & Apte RN IL-1 in Colon Inflammation, Colon Carcinogenesis and Invasiveness of Colon Cancer. Cancer microenvironment : official journal of the International Cancer Microenvironment Society 8, 187–200, doi: 10.1007/s12307-015-0177-7 (2015). [DOI] [PMC free article] [PubMed] [Google Scholar]
- 23.Sato T et al. Single Lgr5 stem cells build crypt–villus structures in vitro without a mesenchymal niche. Nature 459, 262, doi:10.1038/nature0793510.1038/nature07935https://www.nature.com/articles/nature07935#supplementary-informationhttps://www.nature.com/articles/nature07935#supplementary-information (2009). [DOI] [PubMed] [Google Scholar]
- 24.Tse JWT, Jenkins LJ, Chionh F & Mariadason JM Aberrant DNA Methylation in Colorectal Cancer: What Should We Target? Trends Cancer 3, 698–712, doi: 10.1016/j.trecan.2017.08.003 (2017). [DOI] [PubMed] [Google Scholar]
- 25.Kim R, Sheaffer KL, Choi I, Won KJ & Kaestner KH Epigenetic regulation of intestinal stem cells by Tet1-mediated DNA hydroxymethylation. Genes & development 30, 2433–2442, doi: 10.1101/gad.288035.116 (2016). [DOI] [PMC free article] [PubMed] [Google Scholar]
- 26.Tse JWT, Jenkins LJ, Chionh F & Mariadason JM Aberrant DNA Methylation in Colorectal Cancer: What Should We Target? Trends Cancer 3, 698–712, doi: 10.1016/j.trecan.2017.08.003 (2017). [DOI] [PubMed] [Google Scholar]
- 27.Ashktorab H & Brim H DNA Methylation and Colorectal Cancer. Current colorectal cancer reports 10, 425–430, doi: 10.1007/s11888-014-0245-2 (2014). [DOI] [PMC free article] [PubMed] [Google Scholar]
- 28.Morris LG et al. Recurrent somatic mutation of FAT1 in multiple human cancers leads to aberrant Wnt activation. Nature genetics 45, 253–261, doi: 10.1038/ng.2538 (2013). [DOI] [PMC free article] [PubMed] [Google Scholar]
- 29.Baehs S et al. Dickkopf-4 is frequently down-regulated and inhibits growth of colorectal cancer cells. Cancer letters 276, 152–159, doi: 10.1016/j.canlet.2008.11.003 (2009). [DOI] [PubMed] [Google Scholar]
- 30.TeSlaa T et al. alpha-Ketoglutarate Accelerates the Initial Differentiation of Primed Human Pluripotent Stem Cells. Cell metabolism 24, 485–493, doi: 10.1016/j.cmet.2016.07.002 (2016). [DOI] [PMC free article] [PubMed] [Google Scholar]
- 31.Salz T et al. hSETD1A regulates Wnt target genes and controls tumor growth of colorectal cancer cells. Cancer research 74, 775–786, doi: 10.1158/0008-5472.can-13-1400 (2014). [DOI] [PMC free article] [PubMed] [Google Scholar]
- 32.Sierra J, Yoshida T, Joazeiro CA & Jones KA The APC tumor suppressor counteracts beta-catenin activation and H3K4 methylation at Wnt target genes. Genes & development 20, 586–600, doi: 10.1101/gad.1385806 (2006). [DOI] [PMC free article] [PubMed] [Google Scholar]
- 33.Ring A, Kim YM & Kahn M Wnt/catenin signaling in adult stem cell physiology and disease. Stem cell reviews 10, 512–525, doi: 10.1007/s12015-014-9515-2 (2014). [DOI] [PMC free article] [PubMed] [Google Scholar]
- 34.Degos L & Wang ZY All trans retinoic acid in acute promyelocytic leukemia. Oncogene 20, 7140–7145, doi: 10.1038/sj.onc.1204763 (2001). [DOI] [PubMed] [Google Scholar]
- 35.Vlachogiannis G et al. Patient-derived organoids model treatment response of metastatic gastrointestinal cancers. Science 359, 920–926, doi: 10.1126/science.aao2774 (2018). [DOI] [PMC free article] [PubMed] [Google Scholar]
- 36.Dow LE et al. Apc Restoration Promotes Cellular Differentiation and Reestablishes Crypt Homeostasis in Colorectal Cancer. Cell 161, 1539–1552, doi: 10.1016/j.cell.2015.05.033 (2015). [DOI] [PMC free article] [PubMed] [Google Scholar]
- 37.De Rosa M et al. Genetics, diagnosis and management of colorectal cancer (Review). Oncology reports 34, 1087–1096, doi: 10.3892/or.2015.4108 (2015). [DOI] [PMC free article] [PubMed] [Google Scholar]
- 38.Moser AR et al. ApcMin: a mouse model for intestinal and mammary tumorigenesis. European journal of cancer 31A, 1061–1064 (1995). [DOI] [PubMed] [Google Scholar]
- 39.Kamphorst JJ et al. Human pancreatic cancer tumors are nutrient poor and tumor cells actively scavenge extracellular protein. Cancer research 75, 544–553, doi: 10.1158/0008-5472.CAN-14-2211 (2015). [DOI] [PMC free article] [PubMed] [Google Scholar]
- 40.Roberts E, Caldwell AL & et al. Amino acids in epidermal carcinogenesis in mice. Cancer research 9, 350–353 (1949). [PubMed] [Google Scholar]
- 41.Miyo M et al. Metabolic Adaptation to Nutritional Stress in Human Colorectal Cancer. Scientific reports 6, 38415, doi: 10.1038/srep38415 (2016). [DOI] [PMC free article] [PubMed] [Google Scholar]
- 42.Reid MA et al. The B55alpha subunit of PP2A drives a p53-dependent metabolic adaptation to glutamine deprivation. Mol Cell 50, 200–211, doi: 10.1016/j.molcel.2013.02.008 (2013). [DOI] [PubMed] [Google Scholar]
- 43.Tran TQ et al. Tumor-associated mutant p53 promotes cancer cell survival upon glutamine deprivation through p21 induction. Oncogene 36, 1991–2001, doi: 10.1038/onc.2016.360 (2017). [DOI] [PMC free article] [PubMed] [Google Scholar]
- 44.Yang Y et al. MiR-135 suppresses glycolysis and promotes pancreatic cancer cell adaptation to metabolic stress by targeting phosphofructokinase-1. Nat Commun 10, 809, doi: 10.1038/s41467-019-08759-0 (2019). [DOI] [PMC free article] [PubMed] [Google Scholar]
- 45.Lowman XH et al. p53 Promotes Cancer Cell Adaptation to Glutamine Deprivation by Upregulating Slc7a3 to Increase Arginine Uptake. Cell Rep 26, 3051–3060.e3054, doi: 10.1016/j.celrep.2019.02.037 (2019). [DOI] [PMC free article] [PubMed] [Google Scholar]
- 46.Carnero A & Lleonart M The hypoxic microenvironment: A determinant of cancer stem cell evolution. BioEssays : news and reviews in molecular, cellular and developmental biology 38 Suppl 1, S65–74, doi: 10.1002/bies.201670911 (2016). [DOI] [PubMed] [Google Scholar]
- 47.Sullivan R, Pare GC, Frederiksen LJ, Semenza GL & Graham CH Hypoxia-induced resistance to anticancer drugs is associated with decreased senescence and requires hypoxia-inducible factor-1 activity. Molecular cancer therapeutics 7, 1961–1973, doi: 10.1158/1535-7163.mct-08-0198 (2008). [DOI] [PubMed] [Google Scholar]
- 48.Raa A et al. Hyperoxia retards growth and induces apoptosis and loss of glands and blood vessels in DMBA-induced rat mammary tumors. BMC cancer 7, 23, doi: 10.1186/1471-2407-7-23 (2007). [DOI] [PMC free article] [PubMed] [Google Scholar]
- 49.Stuhr LE et al. Hyperoxia retards growth and induces apoptosis, changes in vascular density and gene expression in transplanted gliomas in nude rats. Journal of neuro-oncology 85, 191–202, doi: 10.1007/s11060-007-9407-2 (2007). [DOI] [PubMed] [Google Scholar]
- 50.Stępień K, Ostrowski RP & Matyja E Hyperbaric oxygen as an adjunctive therapy in treatment of malignancies, including brain tumours. Med Oncol 33, 101–101, doi: 10.1007/s12032-016-0814-0 (2016). [DOI] [PMC free article] [PubMed] [Google Scholar]
- 51.Miyoshi Y et al. Somatic mutations of the APC gene in colorectal tumors: mutation cluster region in the APC gene. Human molecular genetics 1, 229–233 (1992). [DOI] [PubMed] [Google Scholar]
- 52.Voloshanenko O et al. Wnt secretion is required to maintain high levels of Wnt activity in colon cancer cells. Vol. 4 (2013). [DOI] [PMC free article] [PubMed] [Google Scholar]
- 53.Schneikert J, Grohmann A & Behrens J Truncated APC regulates the transcriptional activity of beta-catenin in a cell cycle dependent manner. Human molecular genetics 16, 199–209, doi: 10.1093/hmg/ddl464 (2007). [DOI] [PubMed] [Google Scholar]
- 54.Pai R et al. Prostaglandin E2 transactivates EGF receptor: a novel mechanism for promoting colon cancer growth and gastrointestinal hypertrophy. Nature medicine 8, 289–293, doi: 10.1038/nm0302-289 (2002). [DOI] [PubMed] [Google Scholar]
- 55.Janssen KP et al. APC and oncogenic KRAS are synergistic in enhancing Wnt signaling in intestinal tumor formation and progression. Gastroenterology 131, 1096–1109, doi: 10.1053/j.gastro.2006.08.011 (2006). [DOI] [PubMed] [Google Scholar]
- 56.Jemal A et al. Global cancer statistics. CA: a cancer journal for clinicians 61, 69–90, doi: 10.3322/caac.20107 (2011). [DOI] [PubMed] [Google Scholar]
- 57.Seshagiri S et al. Recurrent R-spondin fusions in colon cancer. Nature 488, 660–664, doi: 10.1038/nature11282 (2012). [DOI] [PMC free article] [PubMed] [Google Scholar]
- 58.Cancer Genome Atlas N Comprehensive molecular characterization of human colon and rectal cancer. Nature 487, 330–337, doi: 10.1038/nature11252 (2012). [DOI] [PMC free article] [PubMed] [Google Scholar]
- 59.Krishnamurthy N & Kurzrock R Targeting the Wnt/beta-catenin pathway in cancer: Update on effectors and inhibitors. Cancer treatment reviews 62, 50–60, doi: 10.1016/j.ctrv.2017.11.002 (2018). [DOI] [PMC free article] [PubMed] [Google Scholar]
- 60.Jimeno A et al. A First-in-Human Phase I Study of the Anticancer Stem Cell Agent Ipafricept (OMP-54F28), a Decoy Receptor for Wnt Ligands, in Patients with Advanced Solid Tumors. Clinical cancer research : an official journal of the American Association for Cancer Research 23, 7490–7497, doi: 10.1158/1078-0432.ccr-17-2157 (2017). [DOI] [PubMed] [Google Scholar]
- 61.O’Rourke KP, Ackerman S, Dow LE & Lowe SW Isolation, Culture, and Maintenance of Mouse Intestinal Stem Cells. Bio-protocol 6, e1733 (2016). [DOI] [PMC free article] [PubMed] [Google Scholar]
- 62.van de Wetering M et al. Prospective derivation of a living organoid biobank of colorectal cancer patients. Cell 161, 933–945, doi: 10.1016/j.cell.2015.03.053 (2015). [DOI] [PMC free article] [PubMed] [Google Scholar]
- 63.Tran TQ et al. Glutamine deficiency induces DNA alkylation damage and sensitizes cancer cells to alkylating agents through inhibition of ALKBH enzymes. PLoS Biol 15, e2002810, doi: 10.1371/journal.pbio.2002810 (2017). [DOI] [PMC free article] [PubMed] [Google Scholar]
- 64.Liu X, Ser Z & Locasale JW Development and quantitative evaluation of a high-resolution metabolomics technology. Analytical chemistry 86, 2175–2184, doi: 10.1021/ac403845u (2014). [DOI] [PMC free article] [PubMed] [Google Scholar]
- 65.Tong K et al. Degree of Tissue Differentiation Dictates Susceptibility to BRAF-Driven Colorectal Cancer. Cell reports 21, 3833–3845, doi: 10.1016/j.celrep.2017.11.104 (2017). [DOI] [PMC free article] [PubMed] [Google Scholar]
Associated Data
This section collects any data citations, data availability statements, or supplementary materials included in this article.
Supplementary Materials
Data Availability Statement
DNA and RNA sequencing data that support the findings of this study have been deposited in the Gene Expression Omnibus (GEO) under accession code GSE140270. Super Series GSE140270 is composed of the following SubSeries: GSE140263, GSE140264, GSE140265 GSE140266 GSE140267 GSE140269. Metabolomics raw data have been included in Supplementary Table 5. Source data for Fig. 1–3, 5–7 and Extended Data Fig.1–7 have been provided as Source Data files. All other data supporting the findings of this study are available from the corresponding author on reasonable request.