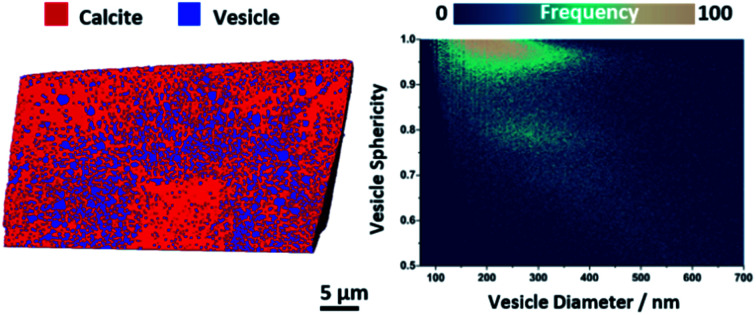
 Ptychographic X-ray computed tomography visualizes the effects crystallography and solution composition have on occlusion motif and occlusion density of crystalline nanocomposites.
Abstract
Single crystals containing nanoparticles represent a unique class of nanocomposites whose properties are defined by both their compositions and the structural organization of the dispersed phase in the crystalline host. Yet, there is still a poor understanding of the relationship between the synthesis conditions and the structures of these materials. Here ptychographic X-ray computed tomography is used to visualize the three-dimensional structures of two nanocomposite crystals – single crystals of calcite occluding diblock copolymer worms and vesicles. This provides unique information about the distribution of the copolymer nano-objects within entire, micron-sized crystals with nanometer spatial resolution and reveals how occlusion is governed by factors including the supersaturation and calcium concentration. Both nanocomposite crystals are seen to exhibit zoning effects that are governed by the solution composition and interactions of the additives with specific steps on the crystal surface. Additionally, the size and shape of the occluded vesicles varies according to their location within the crystal, and therefore the solution composition at the time of occlusion. This work contributes to our understanding of the factors that govern nanoparticle occlusion within crystalline materials, where this will ultimately inform the design of next generation nanocomposite materials with specific structure/property relationships.
Introduction
Nanocomposites are an exciting class of materials, where the ability to engineer compositions and structures at the nano- and meso-scales promises the ability to tailor electrical, optical, mechanical and catalytic properties, and to create multifunctionality.1–11 One strategy for creating these materials is by dispersing nanoparticles within a continuous host matrix. While this approach has been widely explored for polymers,1,12–14 occlusion within inorganic matrices offers additional challenges,11,15,16 where it is frequently difficult to control the microstructure and nanoparticles frequently accumulate at the grain boundaries in polycrystalline host matrices.17
Incorporation of pre-made nanoparticles within single crystal hosts can potentially overcome these problems. However, simple co-precipitation of salts such as NaCl or borax in aqueous solutions,18–20 and calcite (CaCO3)21–23 in the presence of nanoparticles typically results in low levels of occlusion (under 1 wt%). Superior occlusion can be achieved by functionalizing the nanoparticles with polymers that can act as steric stabilizers and promote binding to the surface of the host crystal. This approach has been demonstrated for the occlusion of nanoparticles including magnetite (Fe3O4), gold and organic nano-objects in calcite and ZnO.24–28 Nanoparticle aggregation is less significant in organic solvents, such that successful occlusion has been achieved of Pt nanoparticles in MOFs29 and PbS particles in methylammonium lead iodide perovskites.4,30
In all of these cases, the properties of these single crystal nanocomposites are dependent not only on their compositions, but also on their 3D structures. In principle, this enables control over material properties, where the size, shape, loading and distribution of the species occluded within the crystal matrix can all be varied. However, achieving this degree of control remains challenging because (i) our understanding of the fundamental mechanisms governing occlusion remains limited and (ii) there are inherent technical difficulties associated with visualising the 3D spatial organisation of the nanocomposite over extended volumes at an appropriate resolution. Techniques such as confocal fluorescence microscopy or optical microscopy can provide information about the average distribution of fluorescent or colored additives within a crystal, but the resolution is frequently insufficient to identify the locations of individual nano-sized or molecular additives.31,32 Serial sectioning and successive electron microscopy of samples can be carried out to build a tomographic image, but is both destructive and prone to artefacts.23 While significant advances have been made in electron tomography,33,34 this technique remains limited in the size of sample that can be studied, such that it is difficult to correlate the locations of the occlusions with the morphology of the host crystal.
Here, we use a model system comprising calcite single crystals incorporating two contrasting additives – diblock copolymer worms, and silica-loaded diblock copolymer vesicles – to investigate the parameters controlling the distribution of these species within a crystal host. Cryo-ptychographic X-ray computed tomography (PXCT) was used to visualize the internal structures of entire crystals. This non-destructive coherent diffraction imaging technique provides 3D quantitative electron density maps of extended specimens,35–39 and therefore enables the precise locations of the occluded nanoparticles to be correlated with the crystal morphology and structure. Our results not only reveal two forms of nanoparticle zoning, but also show that the size and shape of the additives incorporated vary according to their location within the crystal. This work provides important new insights into the influence of the crystal growth conditions and crystal/additive interactions on additive occlusion, where this will ultimately enable the design of nanocomposite materials with specific structure/property relationships.
Results and discussion
Polymer nano-objects and nanocomposite synthesis
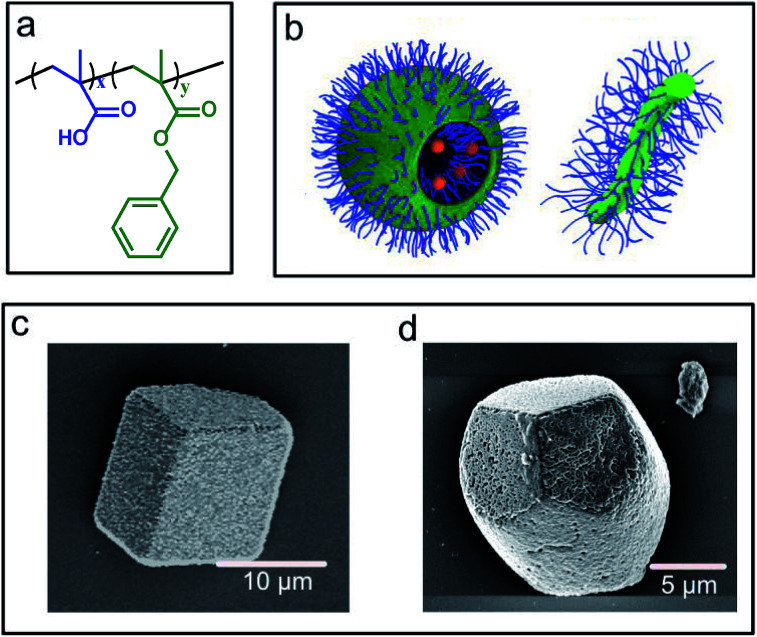
Poly(methacrylic acid)x–poly(benzyl methacrylate)y (PMAAx–PBzMAy) diblock copolymer worms and vesicles were selected for this study because they offer strongly contrasting morphologies and sizes. These nanoparticles were prepared using polymerisation-induced self-assembly and are known to occlude within calcite due to the anionic surface character of the poly(methacrylic acid) stabiliser chains (Fig. 1a and b).25,40 For consistency with previous studies,40 silica nanoparticles were incorporated within the vesicles during their synthesis. The PMAA69–PBzMA200 vesicles (subscripts refer to the mean degree of polymerisation of each block) possess an intensity-average diameter of 232 nm but ranged in size from 100 to 600 nm, as determined by dynamic light scattering.40 The PMAA71–PBzMA150 worms possessed average diameters of ≈30 nm and lengths of > 1 μm as determined by transmission electron microscopy (TEM) (Fig. S1†).25
Fig. 1. (a) Generic chemical structure of the PMAAx–PBzMAy diblock copolymer nano-objects used in the study. (b) Schematic representation of PMAA69–PBzMA200 vesicles and PMAA71–PBzMA150 worms. (c) SEM images of vesicle/calcite and a (d) worm/calcite composite single crystals.
Nanocomposites were precipitated using the ammonia diffusion method (ADM),41 where a calcium chloride solution containing the diblock copolymer nano-objects is exposed to gaseous carbon dioxide and ammonia. This results in the formation of calcite (CaCO3) single crystals occluding the polymer nano-objects, where the polymorph was confirmed using Raman microscopy (Fig. S1†). The two types of nanocomposite crystals exhibited distinct morphologies (Fig. 1c and d). The vesicle/calcite crystals retained the rhombohedral morphology of pure calcite, while the worm/calcite crystals were elongated along the c-axis, possessed rough surfaces, and their apexes were each capped by three smooth {104} faces. These crystal morphologies reflect the differing degree of interaction of the anionic carboxylate groups on the copolymer particles with the growing crystals. Occlusion levels of ≈15–20 wt% for the worms25 and ≈25 wt% for the vesicles40 were estimated using thermogravimetric analysis (TGA) (Fig. S2†).
Ptychographic tomography of nanocomposites
The spatial organization of the worms and vesicles within individual calcite crystals were determined using cryo-ptychographic X-ray computed tomography (cryo-PXCT) at –180 °C.35,37,42 These measurements were carried out by randomly selecting crystals that were 10–50 μm in diameter, and mounting them on custom-made tomography pins (Fig. S3†). The resulting quantitative electron density tomograms possess a sample-average spatial resolution of 62 nm for the worm/calcite crystal and 56 nm for the vesicle/calcite crystal (Fig. S4†). The resolution is therefore more than sufficient to characterise the morphologies of the vesicles. For any analysis where the resolution is insufficient (e.g. of vesicle morphologies) the analysis was restricted to larger –resolvable- vesicles. It is noted that the area of the nanocomposite crystals in closest proximity to the tomography pin is omitted from the tomogram, giving an apparent truncation. For further method and sample-synthesis related information please refer to the accompanying ESI.†
Ptychographic tomography of a vesicle/calcite nanocomposite
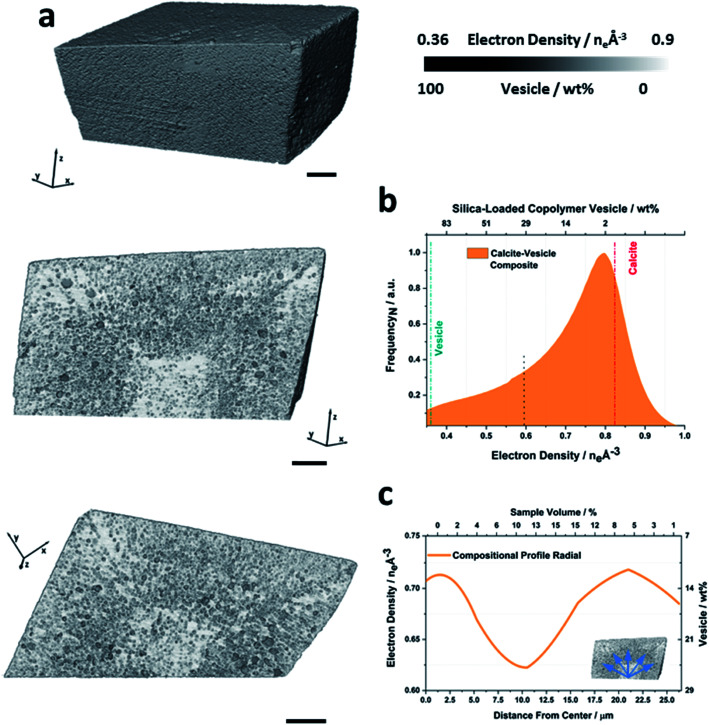
Fig. 2a shows a volume rendering, and two orthogonal slices through the electron density tomogram of a calcite crystal containing vesicles. The rhombohedral sample morphology that is apparent in the volume rendering is fully consistent with the SEM image shown in Fig. 1c. The orthoslices through the crystal reveal the locations of the vesicles in the calcite host and show that they are distributed in a non-uniform manner (Fig. 2a). The corresponding electron density histogram is shown in Fig. 2b, on which the theoretical electron densities of the two components of the nanocomposite – calcite (0.82 eA–3) and silica-loaded copolymer vesicle (0.36 eA–3) – are marked. As the physical density and composition of calcite and vesicles is known, their implied electron densities can be used to determine both the local, and the total volume fraction (or mass fraction) of the occluded vesicles. That this can be achieved without having to fully resolve the polymer nano-objects is due to the samples simple 2-component nature and the quantitative aspect of PXCT. Based on this analysis, the PXCT data suggest that this calcite crystal occludes ≈17 wt% vesicles, which is in reasonable agreement with the TGA data. The deviation between these values may arise from crystal-to-crystal variations.
Fig. 2. Ptychographic X-ray computed tomography of a calcite nanocomposite crystal occluding diblock copolymer vesicles. (a) Volume rendering of and orthoslices through the electron density tomogram of a calcite crystal occluding silica-loaded copolymer vesicles (PMAA69–BzMA300). Both orthoslices are shown with a single color scale ranging from black to white, where this is representative of the electron density value or the approximate weight percent of vesicles. (b) Corresponding histogram, where the electron densities of the reference components and the applied segmentation thresholds are marked. (c) Radial distribution profiles showing the volume averaged compositional variation of the nanocomposite as a function of distance from the crystal center (blue arrows). The scale bars are 5 μm, the voxel size is (16.6 nm)3 and measurements were conducted under cryogenic conditions.
Orthoslices through the tomogram clearly show that the crystal comprises a vesicle-poor (<10 wt% vesicles) rhombohedral core of diameter ≈12 μm, surrounded by a ≈ 12 μm thick vesicle-rich (≈23 wt% vesicles) zone. There is then a second, vesicle-poor zone, which increases slightly in vesicle content in the outermost layer (≈15 wt% vesicles, Movie S1†). These radial variations in vesicle occlusion efficacy are illustrated in Fig. 2c, which provides a radially-averaged electron density profile, expressed in terms of the distance from the proposed nucleation center of the crystal.
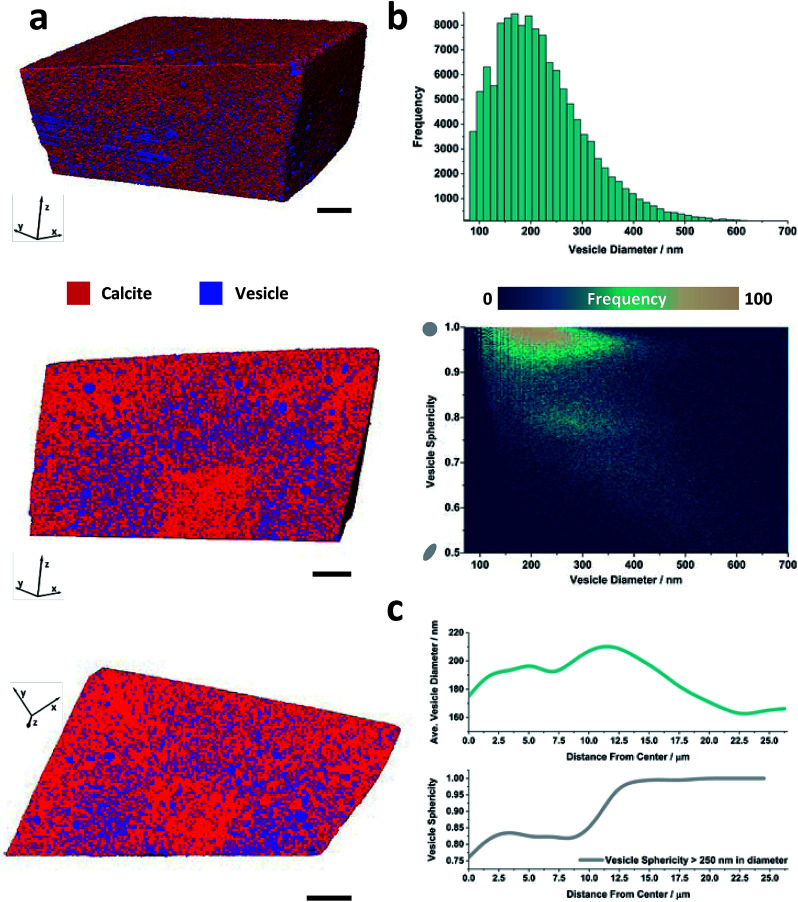
More information about the occluded vesicles was then obtained by applying a segmentation threshold to separate the calcite host from the vesicles, and then characterizing the diameter and sphericity Ψ of individual vesicles. A cut-off value of 50 vol% vesicle (or <0.6 eA–3) was applied and the segmentation was refined through the application of morphological operators to ensure that entire vesicles were included in the analysis. The segmented volume rendering and orthoslices provided in Fig. 3a show the locations of individual vesicles within the crystal matrix. The average inter-vesicle spacing was determined to be ≈300 nm (Fig. S5†), and on average the vesicles retain their solution sphericity (Ψ ≈ 0.98) and mean diameters of 210 nm upon occlusion. The occluded vesicle size distribution is an almost perfect match to that in solution (Fig. 3b), which demonstrates that the vesicles experience minimal aggregation or deformation during occlusion. A bivariate histogram of vesicle size vs. sphericity reveals that if significant shape changes do occur, they principally affect larger vesicles (Fig. 3b). Finally, given the rhombohedral symmetry of calcite and the corresponding morphology of the composite crystal we investigated the radial dependency of vesicle size and sphericity from the nucleation centre, i.e. the vesicle-poor core, to the composite crystal exterior (Fig. 3c). Evident from these distributions is that, although larger vesicles are preferentially occluded in zones of higher occlusion density (i.e. the zone immediately surrounding the low vesicle density core), the vesicle sphericity increases from the core of the nanocomposite crystal to its outer surface.
Fig. 3. Threshold segmented tomography of a calcite nanocomposite crystal occluding diblock copolymer vesicles. (a) Volume rendering of and orthoslices through the threshold-segmented tomogram. The segmentation threshold used to separate the calcite host (red) from the dispersed silica-loaded vesicles (blue) was ∼0.6 eA–3. (b) Vesicle size distribution and bivariate histogram showing the number of vesicles as a function of diameter and sphericity. (c) Radial distribution profiles showing the variations in the volume averaged vesicle diameter and sphericity of larger vesicles as a function of the distance from the composite center. Scale bars are 5 μm and the voxel size is (16.6 nm).3.
Ptychographic tomography of a worm/calcite nanocomposite
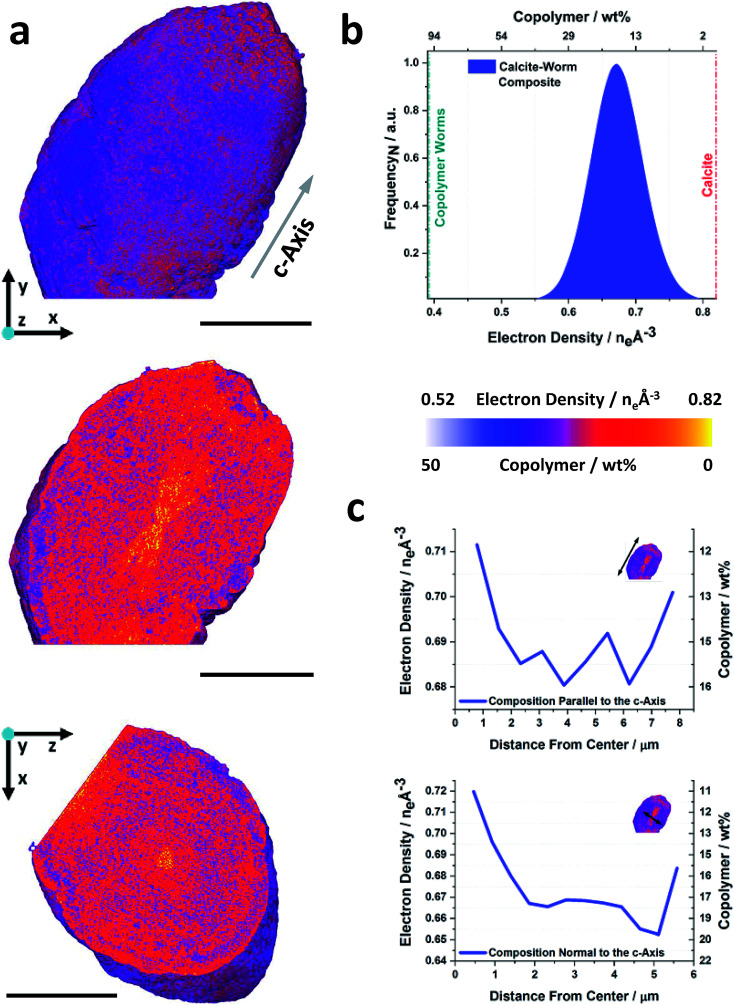
The volume rendering of the electron density tomogram of a worm/calcite crystal and the corresponding orthoslices are shown in Fig. 4a. The elongated morphology is in excellent agreement with the SEM image and the average electron density suggests a composition of ≈16 wt% polymer worms (Fig. 4b), which again agrees well with the TGA analysis (18 wt%). However, in contrast to the vesicle/calcite crystal, the orthoslices reveal that this crystal possesses both a radial and directional variation in occlusion. A worm-poor zone (≈10 wt% worms) is evident, which takes the form of an hourglass whose axis runs parallel to the crystallographic c-axis. This hourglass shape is a common zoning effect in single crystals, where the symmetry is consistent with the nucleation point lying at the centre of the hourglass.
Fig. 4. Ptychographic X-ray computed tomography of a calcite nanocomposite crystal occluding diblock copolymer worms. (a) Volume rendering, and orthoslices through the electron density tomogram of a calcite crystal occluding copolymer worms (PMAA70–BzMA150). Common to both orthoslices is a single color scale ranging from white to yellow, where this is representative of the electron density value or weight percent of copolymer. (b) Electron density histogram, electron densities of the reference components are indicated. (c) Radial distribution profiles showing the compositional variation parallel and normal to the crystallographic c-axis as a function of distance from the composite center. The scale bars are 5 μm, the voxel size is (38.8 nm)3 and the measurements were conducted under cryogenic conditions.
This zone is surrounded by a worm-rich zone (≈18 wt% worms), followed by an outer worm-poor layer (≈12 wt% worms) which follows the form of the hourglass core. The occlusion pattern is therefore more complex than that of the vesicle/calcite crystals, as is also shown in the averaged electron density line profiles shown in Fig. 4c. These data confirm that higher occlusion occurs in the equatorial zone and that occlusion is lower in the direction of elongation (the c-axis) (Movie S2†). No further segmentation of these data was carried out as the spatial resolution was insufficient to fully resolve the worms within the host crystal.
Origin of zoning effects
Two forms of zoning are observed in these nanocomposite crystals. The first derives from selective interaction of the polymer nano-objects with the growth steps on the calcite surface and is observed in the worm/calcite crystals only. The morphology of these crystals – which are elongated along the c-axis and exhibit rough faces in the equatorial zone – derives from preferential binding of these additives to the acute step edges.43 This interaction is also apparent in the zoning pattern within the crystal, where the worms are again concentrated in the equatorial zone. This form of zoning is termed intra-sectoral zoning and is recognized for a range of ions including Mg2+, Mn2+, Sr2+ and SO42– (ref. 44–46) and also dye molecules in calcite.43
The second zoning effect is observed as a radial variation in the number density of occluded species. This appears as a low-occlusion core, surrounded by a higher occlusion zone. The occlusion density is principally determined by two factors, (i) the conformation of the anionic PMAA stabiliser chains, which is governed by the Ca2+/carboxylate molar ratio and (ii) the growth rate. Considering the first of these factors, greater conformational freedom of the PMAA chains is associated with superior occlusion. The behaviour of weak polyelectrolyte brushes (such as PMAA) in the presence of monovalent and divalent ions has been well-studied.47–49 Ca2+ ions interact strongly with anionic carboxylate groups, leading to more compact chain conformations and promoting bridging between neighbouring carboxylate groups. This behaviour is strongly dependent on the solution conditions, where subtle changes in the Ca2+ concentration can lead to sudden contraction or expansion of the PMAA stabiliser chains.
For a given copolymer concentration, efficient nanoparticle occlusion is thus determined by the calcium ion concentration, with higher concentrations leading to more compact PMAA chains and poor occlusion. The radial variation in occlusion observed in the calcite/vesicle crystals can therefore be attributed to the reduction in calcium ions that occurs during crystallisation. There is a relatively high Ca2+ concentration at the outset of crystallization which limits occlusion. The chains then recover their conformational freedom as the Ca2+ concentration decreases, leading to increased occlusion. We recently reported a similar effect when systematically varying the length of the anionic stabiliser chains for the occlusion of anionic cross-linked vesicles within calcite.50 As the conformation freedom is greater for longer stabilizer chains, vesicles stabilized by short chains were only incorporated near the outer surface of calcite crystals (when the Ca2+ concentration was low), while longer stabiliser chains led to extensive vesicle occlusion.
Finally, that both the worm/calcite and vesicle/calcite crystals exhibit a further decrease in occlusion close to the surface of the crystals can be attributed to the slowed crystal growth as crystallization terminates. For most additives, occlusion is limited by their residence time on the crystal surface. Occlusion is therefore favored at higher supersaturation, when an additive is rapidly engulfed before it has time to desorb.51
Influence of occlusion process on incorporated additives
Our data also provide a unique opportunity to evaluate the effect of occlusion on the polymer nano-objects themselves. The average sphericity of the incorporated vesicles decreases significantly with an increase in the vesicle size. While the smaller vesicles retain near perfect sphericity, larger vesicles >250 nm in diameter can undergo significant shape changes and elongate during occlusion (Fig. 3b and c). This can be attributed to the higher curvature of the smaller vesicles, which makes them harder to deform. However, the limitations in spatial resolution need to be taken into consideration when defining the sphericity of the smallest vesicles. Changes in shape have also been observed previously when polymer micelles were occluded in calcite, where the soft micelle flattens as it adsorbs to the crystal surface.24,52
Conclusions
The occlusion of additives ranging from small molecules,7,32,53,54 to polymers,34,55,56 to organic and inorganic nanoparticles,4,5,8,18,22,24,26,28 in single crystals provides a unique strategy for creating new materials with tailor-made properties. However, to fully profit from this approach, it is necessary to control the composition and structure of these nanocomposites. This can only be achieved by determining how occlusion is governed by the synthesis conditions and the interplay between the additive chemistry and the host crystal. Ideally, this is achieved by characterizing the 3D structures of such nanocomposite crystals. Here, we have demonstrated that this can be achieved using cryo-PXCT, which enabled us to non-destructively map the 3D distribution of copolymer worms and vesicles occluded within entire micron-sized calcite crystals. Our results reveal a non-uniform distribution of the nanoparticles that is governed by the synthesis conditions and the crystallography of the host crystal, and a local variation in the vesicle loading of up to 100 wt%. This new insight into occlusion mechanisms will ultimately enable us to develop occlusion strategies to design and fabricate new nanocomposite materials with improved optical, structural and mechanical properties, where analyses of structure/property relationships are often made based on an assumption of a spatially uniform structure.
Author contributions
The manuscript was written through contributions of all authors. All authors have given approval to the final version of the manuscript.
Funding sources
The work of JI and WK is supported by funding from the Swiss National Science Foundation (SNF), grants 200021, 179886 and 153556. MAL is supported by a Leeds International Research Scholarship. We thank the Engineering and Physical Sciences Research Council (EPSRC) for funding under grant EP/P005233/1 (DCG and FCM) and EP/P005241/1 (YN and SPA). We also acknowledge an EPSRC Programme Grant (EP/R018820/1) which funds the Crystallization in the Real World consortium (FCM and YYK). Instrumentation was supported by SNF (R'EQUIP, 145056, “OMNY”) and the Competence Centre for Materials Science and Technology (CCMX) of the ETH-Board, Switzerland.
Conflicts of interest
There are no conflicts to declare.
Supplementary Material
Acknowledgments
We thank X. Donath and Andreas Menzel for technical support at the cSAXS beamline. We would further like to thank Jesse N. Clark, Xiaowen Shi and David A. Shapiro for help with the initial PXCT experiments.
Footnotes
†Electronic supplementary information (ESI) available: Materials and methods, further characterization of the crystals and polymers, supporting data for the ptychography analysis and two movies. See DOI: 10.1039/c9sc04670d
References
- Zhang S. J., Pelligra C. I., Feng X. D., Osuji C. O. Adv. Mater. 2018;30(18):23. doi: 10.1002/adma.201705794. [DOI] [PubMed] [Google Scholar]
- Hao Y. N., Wang X. H., Bi K., Zhang J. M., Huang Y. H., Wu L. W., Zhao P. Y., Xu K., Lei M., Li L. T. Nano Energy. 2017;31:49–56. [Google Scholar]
- Chen A. P., Su Q., Han H., Enriquez E., Jia Q. X. Adv. Mater. 2019;31(4):1803241. doi: 10.1002/adma.201803241. [DOI] [PubMed] [Google Scholar]
- Ning Z., Gong X., Comin R., Walters G., Fan F., Voznyy O., Yassitepe E., Buin A., Hoogland S., Sargent E. H. Nature. 2015;523:324–328. doi: 10.1038/nature14563. [DOI] [PubMed] [Google Scholar]
- Green D. C., Holden M. A., Levenstein M. A., Zhang S. H., Johnson B. R. G., de Pablo J. G., Ward A., Botchway S. W., Meldrum F. C. Nat. Commun. 2019;10:206. doi: 10.1038/s41467-018-08214-6. [DOI] [PMC free article] [PubMed] [Google Scholar]
- Nan C.-W., Jia Q. MRS Bull. 2015;40(9):719–724. [Google Scholar]
- Kim Y. Y., Carloni J. D., Demarchi B., Sparks D., Reid D. G., Kunitake M. E., Tang C. C., Duer M. J., Freeman C. L., Pokroy B., Penkman K., Harding J. H., Estroff L. A., Baker S. P., Meldrum F. C. Nat. Mater. 2016;15(8):903–912. doi: 10.1038/nmat4631. [DOI] [PubMed] [Google Scholar]
- Kulak A. N., Semsarilar M., Kim Y.-Y., Ihli J., Fielding L. A., Cespedes O., Armes S. P., Meldrum F. C. Chem. Sci. 2014;5:738–743. [Google Scholar]
- Marschall R. Adv. Funct. Mater. 2014;24(17):2421. [Google Scholar]
- Tamulevicius S., Meskinis S., Tamulevicius T., Rubahn H. G. Rep. Prog. Phys. 2018;81(2):024501. doi: 10.1088/1361-6633/aa966f. [DOI] [PubMed] [Google Scholar]
- Chen Z. H., Wang X., Qi Y. J., Yang S., Soares J., Apgar B. A., Gao R., Xu R. J., Lee Y., Zhang X., Yao J., Martin L. W. ACS Nano. 2016;10(11):10237–10244. doi: 10.1021/acsnano.6b05736. [DOI] [PubMed] [Google Scholar]
- Kotal M., Bhowmick A. K. Prog. Polym. Sci. 2015;51:127–187. [Google Scholar]
- Winey K. I., Vaia R. A. MRS Bull. 2007;32(4):314–319. [Google Scholar]
- Sarkar B., Alexandridis P. Prog. Polym. Sci. 2015;40:33–62. [Google Scholar]
- Bahlawane N., Kohse-Hoinghaus K., Weimann T., Hinze P., Rohe S., Baumer M. Angew. Chem., Int. Ed. 2011;50(42):9957–9960. doi: 10.1002/anie.201102489. [DOI] [PubMed] [Google Scholar]
- Biswas K., He J. Q., Zhang Q. C., Wang G. Y., Uher C., Dravid V. P., Kanatzidis M. G. Nat. Chem. 2011;3(2):160–166. doi: 10.1038/nchem.955. [DOI] [PubMed] [Google Scholar]
- Liu Y., Zhu X. F., Li M. R., O'Hayre R. P., Yang W. S. Nano Lett. 2015;15(11):7678–7683. doi: 10.1021/acs.nanolett.5b03668. [DOI] [PubMed] [Google Scholar]
- Adam M., Gaponik N., Eychmuller A., Erdem T., Soran-Erdem Z., Demir H. V. J. Phys. Chem. Lett. 2016;7(20):4117–4123. doi: 10.1021/acs.jpclett.6b01699. [DOI] [PubMed] [Google Scholar]
- Benad A., Guhrenz C., Bauer C., Eichler F., Adam M., Ziegler C., Gaponik N., Eychmuller A. ACS Appl. Mater. Interfaces. 2016;8(33):21570–21575. doi: 10.1021/acsami.6b06452. [DOI] [PubMed] [Google Scholar]
- Vorontsov D., Filonenko S., Kanak A., Okrepka G., Khalavka Y. CrystEngComm. 2017;19(45):6804–6810. [Google Scholar]
- Liu Y. J., Yuan W. T., Shi Y., Chen X. Q., Wang Y., Chen H. Z., Li H. Y. Angew. Chem., Int. Ed. 2014;53(16):4127–4131. doi: 10.1002/anie.201310712. [DOI] [PubMed] [Google Scholar]
- Liu Y. J., Zang H. D., Wang L., Fu W. F., Yuan W. T., Wu J. K., Jin X. Y., Han J. S., Wu C. F., Wang Y., Xing H. L. L., Chen H. Z., Li H. Y. Chem. Mater. 2016;28(20):7537–7543. [Google Scholar]
- Calvaresi M., Falini G., Pasquini L., Reggi M., Fermani S., Gazzadi G. C., Frabboni S., Zerbetto F. Nanoscale. 2013;5(15):6944–6949. doi: 10.1039/c3nr01568h. [DOI] [PubMed] [Google Scholar]
- Kim Y.-Y., Ganesan K., Yang P., Kulak A. N., Borukhin S., Pechook S., Ribeiro L., Kröger R., Eichhorn S. J., Armes S. P., Pokroy B., Meldrum F. C. Nat. Mater. 2011;10(11):890–896. doi: 10.1038/nmat3103. [DOI] [PubMed] [Google Scholar]
- Kim Y. Y., Semsarilar M., Carloni J. D., Cho K. R., Kulak A. N., Polishchuk I., Hendley C. T., Smeets P. J. M., Fielding L. A., Pokroy B., Tang C. C., Estroff L. A., Baker S. P., Armes S. P., Meldrum F. C. Adv. Funct. Mater. 2016;26(9):1382–1392. [Google Scholar]
- Kulak A. N., Grimes R., Kim Y. Y., Semsarilar M., Anduix-Canto C., Cespedes O., Armes S. P., Meldrum F. C. Chem. Mater. 2016;28(20):7528–7536. [Google Scholar]
- Kulak A. N., Yang P. C., Kim Y. Y., Armes S. P., Meldrum F. C. Chem. Commun. 2014;50(1):67–69. doi: 10.1039/c3cc47904h. [DOI] [PubMed] [Google Scholar]
- Ning Y., Fielding L., Nutter J., Kulak A., Meldrum F., Armes S. Angew. Chem., Int. Ed. 2019;58(13):4302–4307. doi: 10.1002/anie.201814492. [DOI] [PubMed] [Google Scholar]
- Lu G., Li S., Guo Z., Farha O. K., Hauser B. G., Qi X., Wang Y., Wang X., Han S., Liu X., DuChene J. S., Zhang H., Zhang Q., Chen X., Ma J., Loo S. C. J., Wei W. D., Yang Y., Hupp J. T., Huo F. Nat. Chem. 2012;4(4):310–316. doi: 10.1038/nchem.1272. [DOI] [PubMed] [Google Scholar]
- Han J. H., Luo S. P., Yin X. W., Zhou Y., Nan H., Li J. B., Li X., Oron D., Shen H. P., Lin H. Small. 2018;14(31):1801016. doi: 10.1002/smll.201801016. [DOI] [PubMed] [Google Scholar]
- Chien Y.-C., Masica D. L., Gray J. J., Nguyen S., Vali H., McKee M. D. J. Biol. Chem. 2009;284(35):23491–23501. doi: 10.1074/jbc.M109.021899. [DOI] [PMC free article] [PubMed] [Google Scholar]
- Marzec B., Green D. C., Holden M. A., Coté A. S., Ihli J., Khalid S., Kulak A., Walker D., Tang C., Duffy D. M., Kim Y.-Y., Meldrum F. C. Angew. Chem., Int. Ed. 2018;57(28):8623–8628. doi: 10.1002/anie.201804365. [DOI] [PMC free article] [PubMed] [Google Scholar]
- Nudelman F., de With G., Sommerdijk N. Soft Matter. 2011;7(1):17–24. [Google Scholar]
- Li H. Y., Xin H. L., Muller D. A., Estroff L. A. Science. 2009;326(5957):1244–1247. doi: 10.1126/science.1178583. [DOI] [PubMed] [Google Scholar]
- Dierolf M., Menzel A., Thibault P., Schneider P., Kewish C. M., Wepf R., Bunk O., Pfeiffer F. Nature. 2010;467(7314):436–439. doi: 10.1038/nature09419. [DOI] [PubMed] [Google Scholar]
- Wise A. M., Weker J. N., Kalirai S., Farmand M., Shapiro D. A., Meirer F., Weckhuysen B. M. ACS Catal. 2016;6(4):2178–2181. doi: 10.1021/acscatal.6b00221. [DOI] [PMC free article] [PubMed] [Google Scholar]
- Ihli J., Jacob R. R., Holler M., Guizar-Sicairos M., Diaz A., da Silva J. C., Ferreira Sanchez D., Krumeich F., Grolimund D., Taddei M., Cheng W. C., Shu Y., Menzel A., van Bokhoven J. A. Nat. Commun. 2017;8(1):809. doi: 10.1038/s41467-017-00789-w. [DOI] [PMC free article] [PubMed] [Google Scholar]
- Shapiro D. A., Yu Y.-S., Tyliszczak T., Cabana J., Celestre R., Chao W., Kaznatcheev K., Kilcoyne A. L. D., Maia F., Marchesini S., Meng Y. S., Warwick T., Yang L. L., Padmore H. A. Nat. Photonics. 2014;8(10):765–769. [Google Scholar]
- Ihli J., Diaz A., Shu Y., Guizar-Sicairos M., Holler M., Wakonig K., Odstrcil M., Li T., Krumeich F., Müller Gubler E. A., Cheng W.-C., van Bokhoven J. A., Menzel A. J. Phys. Chem. C. 2018;122(40):22920–22929. [Google Scholar]
- Ning Y., Whitaker D. J., Mable C. J., Derry M. J., Penfold N. J. W., Kulak A. N., Green D. C., Meldrum F. C., Armes S. P. Chem. Sci. 2018;9(44):8396–8401. doi: 10.1039/c8sc03623c. [DOI] [PMC free article] [PubMed] [Google Scholar]
- Ihli J., Bots P., Kulak A. N., Benning L. G., Meldrum F. C. Adv. Funct. Mater. 2013;23(15):1965–1973. [Google Scholar]
- Holler M., Raabe J., Diaz A., Guizar-Sicairos M., Wepf R., Odstrcil M., Shaik F. R., Panneels V., Menzel A., Sarafimov B., Maag S., Wang X., Thominet V., Walther H., Lachat T., Vitins M., Bunk O. Rev. Sci. Instrum. 2018;89(4):043706. doi: 10.1063/1.5020247. [DOI] [PubMed] [Google Scholar]
- Green D. C., Ihli J., Thornton P. D., Holden M. A., Marzec B., Kim Y.-Y., Kulak A. N., Levenstein M. A., Tang C., Lynch C., Webb S. E. D., Tynan C. J., Meldrum F. C. Nat. Commun. 2016;7:13524. doi: 10.1038/ncomms13524. [DOI] [PMC free article] [PubMed] [Google Scholar]
- Paquette J., Reeder R. J. Geology. 1990;18(12):1244–1247. [Google Scholar]
- Paquette J., Reeder R. J. Geochim. Cosmochim. Acta. 1995;59(4):735–749. [Google Scholar]
- Reeder R. J., Paquette J. Sediment. Geol. 1989;65(3–4):239–247. [Google Scholar]
- Mei Y., Ballauff M. Eur. Phys. J. E: Soft Matter Biol. Phys. 2005;16(3):341–349. doi: 10.1140/epje/i2004-10089-9. [DOI] [PubMed] [Google Scholar]
- Pincus P. Macromolecules. 1991;24(10):2912–2919. [Google Scholar]
- Schweins R., Huber K. Eur. Phys. J. E: Soft Matter Biol. Phys. 2001;5(1):117–126. [Google Scholar]
- Ning Y., Han L., Douverne M., Penfold N. J. W., Derry M. J., Meldrum F. C., Armes S. P. J. Am. Chem. Soc. 2019;141(6):2481–2489. doi: 10.1021/jacs.8b12291. [DOI] [PubMed] [Google Scholar]
- Chernov A. A., Modern Crystallography III, in Springer Series in Solid State Sciences, Springer-Verlag, 1984, vol. 36. [Google Scholar]
- Cho K. R., Kim Y. Y., Yang P. C., Cai W., Pan H. H., Kulak A. N., Lau J. L., Kulshreshtha P., Armes S. P., Meldrum F. C., De Yoreo J. J. Nat. Commun. 2016;7:10187. doi: 10.1038/ncomms10187. [DOI] [PMC free article] [PubMed] [Google Scholar]
- Brif A., Ankonina G., Drathen C., Pokroy B. Adv. Mater. 2013;26(3):477–481. doi: 10.1002/adma.201303596. [DOI] [PubMed] [Google Scholar]
- Borukhin S., Bloch L., Radlauer T., Hill A. H., Fitch A. N., Pokroy B. Adv. Funct. Mater. 2012;22(20):4216–4224. [Google Scholar]
- Schenk A. S., Zlotnikov I., Pokroy B., Gierlinger N., Masic A., Zaslansky P., Fitch A. N., Paris O., Metzger T. H., Colfen H., Fratzl P., Aichmayer B. Adv. Funct. Mater. 2012;22(22):4668–4676. [Google Scholar]
- Berman A., Addadi L., Weiner S. Nature. 1988;331(6156):546–548. [Google Scholar]
Associated Data
This section collects any data citations, data availability statements, or supplementary materials included in this article.


