Abstract
Background and Aims
Coastal wetlands have evolved to withstand stressful abiotic conditions through the maintenance of hydrologic feedbacks between vegetation production and flooding. However, disruption of these feedbacks can lead to ecosystem collapse, or a regime shift from vegetated wetland to open water. To prevent the loss of critical coastal wetland habitat, we must improve understanding of the abiotic–biotic linkages among flooding and wetland stability. The aim of this research was to identify characteristic landscape patterns and thresholds of wetland degradation that can be used to identify areas of vulnerability, reduce flooding threats and improve habitat quality.
Methods
We measured local- and landscape-scale responses of coastal wetland vegetation to flooding stress in healthy and degrading coastal wetlands. We hypothesized that conversion of Spartina patens wetlands to open water could be defined by a distinct change in landscape configuration pattern, and that this change would occur at a discrete elevation threshold.
Key Results
Despite similarities in total land and water cover, we observed differences in the landscape configuration of vegetated and open water pixels in healthy and degrading wetlands. Healthy wetlands were more aggregated, and degrading wetlands were more fragmented. Generally, greater aggregation was associated with higher wetland elevation and better drainage, compared with fragmented wetlands, which had lower elevation and poor drainage. The relationship between vegetation cover and elevation was non-linear, and the conversion from vegetated wetland to open water occurred beyond an elevation threshold of hydrologic stress.
Conclusions
The elevation threshold defined a transition zone where healthy, aggregated, wetland converted to a degrading, fragmented, wetland beyond an elevation threshold of 0.09 m [1988 North American Vertical Datum (NAVD88)] [0.27 m mean sea level (MSL)], and complete conversion to open water occurred beyond 0.03 m NAVD88 (0.21 m MSL). This work illustrates that changes in landscape configuration can be used as an indicator of wetland loss. Furthermore, in conjunction with specific elevation thresholds, these data can inform restoration and conservation planning to maximize wetland stability in anticipation of flooding threats.
Keywords: Aggregation, Anas fulvigula, coastal wetlands, ecological threshold, flooding stress, fragmentation, hummocks and hollows, hydrologic feedback, landscape configuration, non-linear response, regime shift, Spartina patens
INTRODUCTION
Coastal wetlands provide a bounty of ecosystem services, including water quality improvement, carbon sequestration, recreation and tourism, commercial fisheries habitat and storm surge protection, among others (Barbier et al., 2011). However, the sustainability of these key ecosystems is uncertain, especially along the Northern Gulf of Mexico where rapid and expansive wetland loss is clearly visible within a lifetime (Couvillion et al., 2011). In addition to numerous other ecosystem services, coastal wetlands along the Northern Gulf of Mexico provide critical habitat for ecologically important waterfowl species (Moon et al., 2015). Thus, to prevent the loss of these valuable resources, wetland conservation and restoration is a high priority for land managers in this region (Coastal Wetland Planning, Protection & Restoration Act, 1990; Esslinger and Wilson, 2001; Wilson, 2007; RESTORE Act, 2012).
To optimize wetland conservation and restoration planning, it is vital first to identify the mechanism(s) of wetland loss or degradation. Along the Northern Gulf of Mexico, where rates of relative sea level rise are higher than most places globally (Penland and Ramsey, 1990; Jankowski et al., 2017; Sweet et al., 2017) and natural hydrology is significantly altered (White and Tremblay, 1995; Turner, 2004), excessive flooding under saline conditions can lead to unfavourable biogeochemical conditions causing reduced plant growth and eventual mortality (Mendelssohn and Morris, 2002). Generally, as flooding depth and duration increase, marsh resilience declines (Stagg and Mendelssohn, 2011).
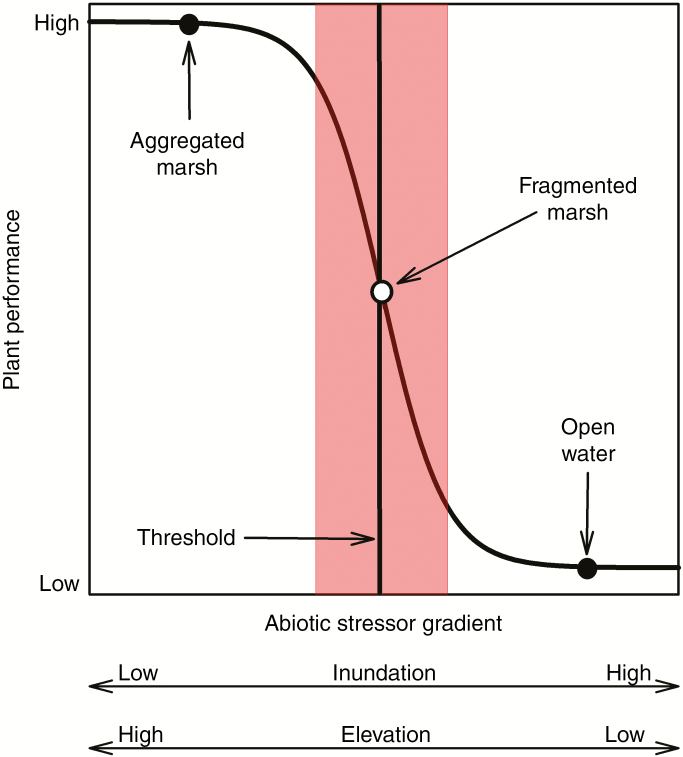
Although wetland plants have evolved to withstand stressful abiotic conditions at the terrestrial–aquatic interface, including variable flooding conditions and elevated salinity, the growth and survival of individual plant species are bound within a certain range of abiotic conditions (Rozema et al., 1988). Exceeding these bounds, or thresholds, can shift community composition to more tolerant species, creating distinct, and often predictable, zonation patterns along the gradient of increasing stress (Pennings et al., 2005). In some cases, changes in abiotic conditions can lead to an abrupt regime shift, defined by an ecological threshold (Scheffer, 2001). The rapid conversion from vegetated marsh to open water is characteristic of a non-linear relationship, where small changes in an abiotic factor (e.g. flooding or salinity) may lead to large changes in critical ecosystem properties (e.g. vegetation productivity and marsh stability) (Fig. 1) (Marani et al., 2010; Jiang et al., 2012; Osland et al., 2014). Ecological thresholds are common in coastal wetlands (Folke et al., 2004), and can be used to predict ecological responses to stressors, such as flooding (Morris et al., 2002; Kirwan and Megonigal, 2013; van Belzen et al., 2017).
Fig. 1.
Hypothesized threshold response of vegetation to a gradient of increasing flooding stress. The discrete elevation threshold is represented by a solid line and the shaded area represents the elevation threshold zone (i.e. area of maximum rate of change).
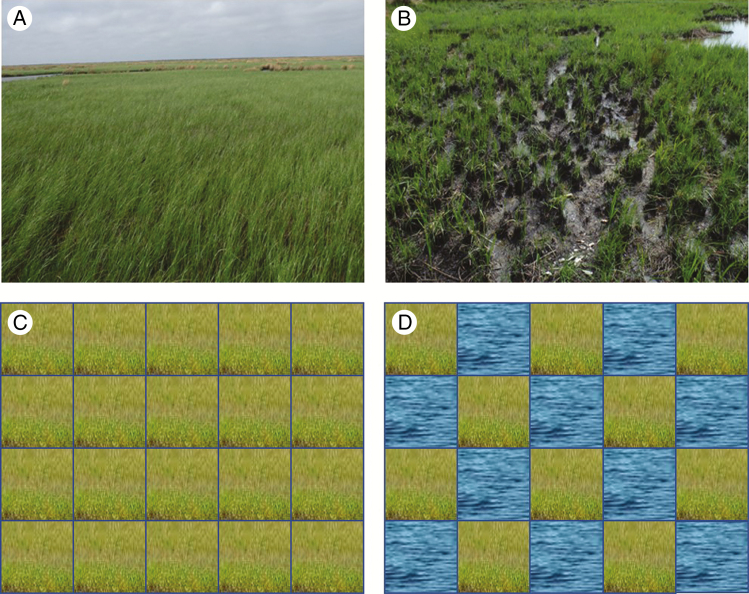
Coastal wetland conversion to open water represents a large component of wetland loss in the USA (National Oceanic and Atmospheric Administration, 2010), and may be described by distinct changes in spatial landscape patterns (Fig. 2) that are related to hydrologic and geomorphic feedbacks (Ganju et al., 2017). A substantial body of research has been published identifying ecophysiological and hydrogeomorphic mechanisms of wetland stability at the local scale (reviewed by Mendelssohn and Morris, 2002; Fagherazzi et al., 2012). More recent studies have illustrated that changes in spatial patterns of vegetation are not only a result of wetland degradation, but also a characteristic of the mechanisms controlling future wetland loss (Couvillion et al., 2016; Scheper et al., 2017). However, to date, very few studies have explicitly and quantitatively linked local- and landscape-scale mechanisms of wetland stability. Integrating landscape-scale spatial configuration patterns of vegetation with local hydrogeomorphic controls provides foundational knowledge that can be used to identify mechanisms of wetland sustainability that are relevant at broader spatial and temporal scales.
Fig. 2.
Process of wetland degradation represented by the relationship between wetland health (top panels) and landscape configuration (bottom panels). Healthy wetland (A) characterized by aggregated landscape (C), and degrading wetland (B) characterized by fragmented landscape (D). In the bottom panels, green represents land and blue represents water.
The aim of this research was to identify characteristic landscape patterns and hydrologic thresholds of Spartina patens (Aiton) Muhl marsh degradation that can be used to identify areas of vulnerability, reduce flooding threats and improve habitat quality. We investigated healthy and degrading S. patens marshes along the Northern Gulf of Mexico to test the following hypotheses: (1) coastal wetland degradation is characterized by a distinct change in landscape pattern, where degrading wetlands are associated with increasing fragmentation (Fig. 2); (2) increasing fragmentation is associated with flooding stress; and (3) the relationship between elevation and vegetation cover along the landscape transition is non-linear, and an ecological threshold delineates the conversion from healthy to degrading wetland (Fig. 1). Our hope is that the conclusions from this research can be used to support management of S. patens plant communities at risk of flooding stress.
MATERIALS AND METHODS
Study location
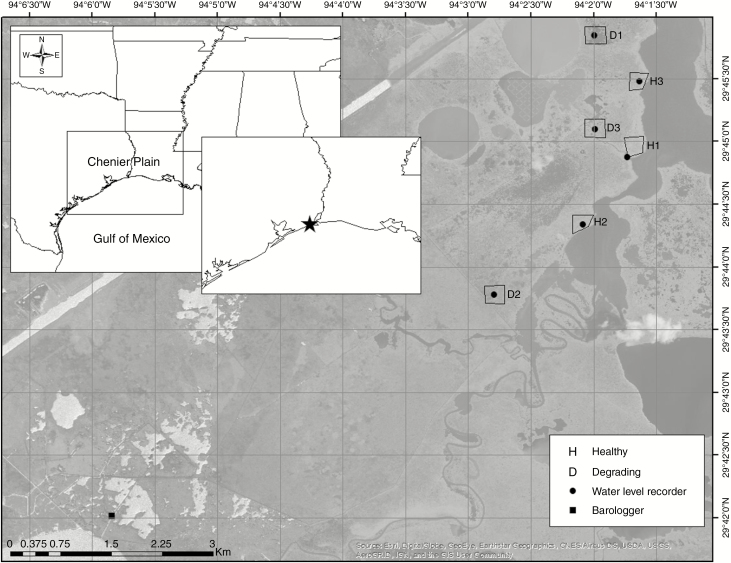
The study was conducted in coastal wetlands of the Chenier Plain along the Northern Gulf of Mexico (Fig. 3), which has an average tidal range of 0.33 m (NOAA https://tidesandcurrents.noaa.gov/datums.html?units=1&epoch=0&id=8770570&name=Sabine+Pass+North&state=TX; accessed 27 February 2019) and relative sea level trend of 5.86 mm year–1 (NOAA https://tidesandcurrents.noaa.gov/sltrends/; accessed 27 February 2019). Wetlands dominated by S. patens were selected within the McFaddin National Wildlife Refuge (NWR) and J.D. Murphree Wildlife Management Area (WMA), where coastal wetlands are protected and managed to provide habitat for migratory birds, especially waterfowl. For this study, we selected unmanaged wetlands, or sites that had not been manipulated within the last decade.
Fig. 3.
Location of study sites (polygons) representing healthy (H) and degrading (D) Spartina patens-dominated coastal wetlands along the Chenier Plain of the Northern Gulf of Mexico, USA.
To provide a baseline of knowledge characterizing wetland degradation, we compared landscape composition, environmental parameters and vegetation biomass among healthy and degrading S. patens-dominated wetlands. Three healthy and three degrading wetland sites (n = 6) were selected based upon habitat quality and initial estimates of vegetation cover abundance. Historically, healthy sites provided high quality habitat, such as higher bird counts and nesting sites for priority species, like Anas fulvigula (Mottled Duck), compared with poor quality habitat in the degrading sites (USFWS NWR A. fulvigula breeding pair survey, unpublished data). Additionally, initial field surveys indicated that vegetation cover was more abundant in the healthy sites compared with the degrading sites, which had a greater abundance of open water cover. Methods and results for preliminary surveys are available in Supplementary data Fig. S1.
Landscape data
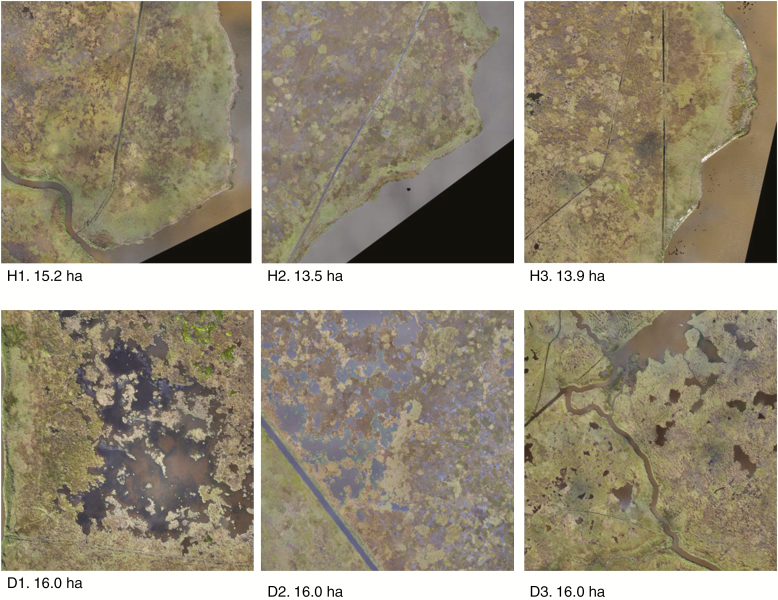
To assess differences in landscape composition in healthy vs. degrading sites, an unmanned aerial system (UAS) (3DR Solo + Ricoh GR II digital single lens camera) collected high-resolution imagery data from a polygon (13–16 ha) representing each of the six sites (Jones et al., 2018). Remotely sensed imagery data were collected during low tide on 6–8 November 2017 at an altitude of 106 m, in 5 s intervals and at a 3 cm resolution. The imagery data were incorporated into a seamless orthomosaic of natural colour from the red, green and blue visible light spectrum (Fig. 4). Individual orthomosaics were analysed to classify individual pixels into land and water categories. First, an unsupervised classification was performed using Erdas Imagine Version 16.00 software (Hexagon Geospatial, Madison, AL, USA) to group pixels together based on their spectral similarity. This analysis specified 75 classes, with a maximum of 50 iterations. After the automated classification was complete, each class was interpreted and grouped into either land or water categories. All areas characterized by emergent vegetation, wetland forest, scrub-shrub or uplands were classified as land, while open water, aquatics and unvegetated sediment were classified as water. Given the high resolution of the imagery data, a minimum mapping unit of 69 pixels was defined based upon our field criteria for identifying hollows, or the smallest water cover class (25 × 25 cm = 69 pixels). Following filtration at the minimum mapping unit, each individual image was manually analysed for an 8 h period by an expert photo interpreter to correct any misclassifications. An accuracy assessment, including a difference image creation and a quantitative accuracy assessment, was conducted according to Congalton (2001). For the quantitative accuracy assessment, 50 pixels were randomly selected from each cover class in each site and assessed for accuracy using photo interpretation (Supplementary data Fig. S2; Table S1). The final classified data were used to estimate relative land and water cover for each healthy and degrading site.
Fig. 4.
Seamless orthomosaic of natural colour imagery data collected from three healthy (H1–H3) and three degrading (D1–D3) sites. The total area of each polygon is noted below each site panel.
Ecological data
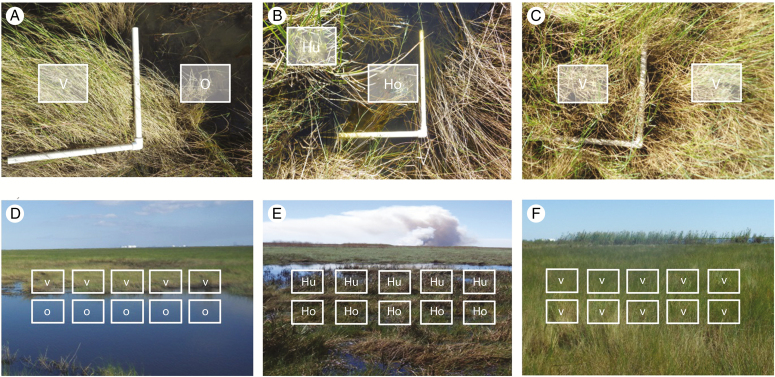
In the field, we also measured water elevation, marsh elevation and vegetation cover in the three healthy and three degrading sites to quantify contributions of environmental factors to S. patens degradation (Stagg et al., 2019). To capture potential thresholds of marsh stability, we established paired plots in three types of transition zones: (1) vegetated marsh transition to open water; (2) hummock transition to hollow; or (3) vegetated marsh remaining as vegetated marsh (Fig. 5, top panels). The vegetated/open water transitions and hummock/hollow transitions only occurred in the degrading sites, and the vegetated/vegetated transitions only occurred in the healthy sites (Fig. 5, bottom panels). A transition to open water was characterized by a vegetated plot on the marsh platform adjacent to open water (open water = unvegetated area ≥2 × 2 m). A hummock to hollow transition was characterized by the relative elevation of a vegetated area (hummock) adjacent to a bare area (hollow) on the marsh platform – a hollow was defined as an unvegetated area (≤25 × 25 cm) that is at least 10 cm lower than the adjacent vegetated area (Windham, 1999). Paired plots were randomly established in clear transition zones along transects that initiated from the water level recorder. Randomization of plot placement along the transects was ensured by using pre-selected, random, azimuth directions (0–360°) and distance intervals (0–20 m) to locate transition zones. Five paired plots were established in each relevant transition zone in each site (Fig. 5, bottom panels). In each degrading site (n = 3), five paired plots were established at the vegetated/open water transition, and five paired plots were established at the hummock/hollow transition (n = 20 plots per site) for a total of 60 plots in the degrading wetlands. In each healthy site (n = 3), five paired plots were established in vegetated/vegetated transition (n = 10 plots per site) for a total of 30 plots in the healthy wetlands, and a grand total of 90 plots.
Fig. 5.
Top panels: transition zones in degrading sites (A) vegetation (V) to open water (O), (B) hummock (Hu) to hollow (Ho), and transition zones in healthy sites (C) vegetation remaining as vegetation. Bottom panels: transect schematic illustrating paired plot placement along transition zones in degrading sites (D) vegetation (V) to open water (O), (E) hummock (Hu) to hollow (Ho), and transition zones in healthy sites (F) vegetation remaining as vegetation.
Within each 0.5 × 0.5 m paired plot, vegetation cover and marsh surface elevation were measured. When present, vegetation cover was estimated by measuring total live foliage, dead foliage and bare ground, with additional live species-level canopy percentage cover using a visual estimation method (Folse et al., 2014). Marsh surface elevation was measured and referenced to the 1988 North American Vertical Datum (NAVD88) geodetic datum to centimetre-level precision (1–4 cm) using real-time kinematic (RTK) surveying (Gao et al., 2005) with a Trimble R10 GNSS System (Trimble Navigation Limited, Sunnyvale, CA, USA; Chen et al., 2011), a real-time continuously operating reference station (CORS) network, and Trimble Business Center 2.5 software for data post-processing (Trimble Navigation Limited). Where relevant, conversions from the geodetic datum NAVD88 to the tidal datum mean sea level (MSL) (NAVD88 = 0.18 m MSL) were conducted using the nearest long-term NOAA tidal station, Sabine Pass North (Station ID 8770570, PID AV1014), located approx. 15 km from the study site (https://www.ngs.noaa.gov/Tidal_Elevation/index.xhtml).
Plot-scale flooding metrics were calculated using marsh elevation data collected from the paired plots and site-scale water elevation data. Water elevation data were collected from permanent water level recorders (Solinst® Canada Ltd, LT Levelogger® Edge model 3001), which were installed in October 2017 at each site and rectified to geodetic datum NAVD88 using RTK surveying methods. A single barometric recorder (Solinst® Canada Ltd, LT Barologger® Edge model 3001) was installed within 10 km of all six water level recorders to correct for variance in barometric pressure (Solinst Levelogger Software 4.3.1). Water level data were collected at 6 min intervals continuously over 1 year (October 2017–October 2018) and referenced to geodetic datum NAVD88. Minimum daily flood depth, an indicator of marsh drainage, was calculated as the difference between the daily minimum water elevation and the marsh surface elevation in each plot, and annual averages were calculated for the water year (October 2017–October 2018). As an indicator of flood frequency, percentage time flooded was calculated as the proportion of flood occurrence days during the water year (October 2017–October 2018). Daily flood occurrence was defined as the exceedance of the daily maximum water elevation above the marsh surface elevation in each plot.
Data analyses
To quantify the spatial configuration, or the arrangement and position of land and water within the wetland, isolated patches comprised of either land or water pixels were analysed to calculate two landscape metrics. Since the goal was to relate the integrity of the wetland landscape to site condition, we selected spatial configuration metrics that best reflected the landscape pattern of interest, aggregation (or alternatively, fragmentation), and the related process of wetland loss (Couvillion et al., 2016). The aggregation index quantifies aggregation and represents the tendency of a patch to equal neighbouring patches. The patch density index quantifies fragmentation and represents the tendency of a patch to differ from neighbouring patches (McGarigal, 2002; Supplementary data Table S2).
Simple correlation analyses were used to characterize relationships between spatial configuration metrics for land and water classes and the following environmental data: marsh surface elevation, minimum daily flood depth and percentage time flooded (Table 1). In the correlation matrix, land cover class metrics were paired with environmental data from the vegetated and hummock plots from both healthy and degrading sites (n = 6). Because open water and hollow plots were not identified in the healthy sites (Fig. 5F), water cover class metrics were paired with environmental data from the hollow and open water plots from the degrading sites (n = 3) for a total sample number of nine (n = 9) (Table 1).
Table 1.
Spatial configuration metrics calculated for land and water cover classes, marsh elevation (m NAVD88), annual average daily minimum flood depth (drainage) and annual average percentage time flooded (flooding frequency) collected in healthy and degrading Spartina patens marshes
| Site ID | Cover class | Patch number | Aggregation index | Patch density | Elevation (m, ±s.e.) | Daily minimum flood depth (m, ±s.e.) | %Time flooded (%, ±s.e.) |
|---|---|---|---|---|---|---|---|
| H1 | Land | 1519 | 99.1 | 9365 | 0.20 (0.01) | 0.17 (0.01) | 72 (6) |
| H2 | Land | 665 | 99.3 | 4108 | 0.24 (0.02) | 0.15 (0.02) | 66 (8) |
| H3 | Land | 109 | 99.4 | 730 | 0.21 (0.02) | 0.20 (0.02) | 82 (8) |
| D1 | Land | 2515 | 96.3 | 16 069 | 0.28 (0.01) | 0.16 (0.01) | 76 (1) |
| D2 | Land | 4082 | 98.6 | 26 202 | 0.22 (0.02) | 0.19 (0.02) | 84 (9) |
| D3 | Land | 2182 | 98.3 | 13 439 | 0.29 (0.01) | 0.10 (0.01) | 25 (2) |
| H1 | Water | 10 359 | 96.8 | 63 867 | – | – | – |
| H2 | Water | 13 753 | 98.8 | 84 976 | – | – | – |
| H3 | Water | 12 488 | 98.3 | 83 725 | – | – | – |
| D1 | Water | 25 850 | 95.4 | 165 161 | 0.04 (0.02) | 0.40 (0.02) | 100 (0) |
| D2 | Water | 16 438 | 96.1 | 105 515 | 0.06 (0.01) | 0.35 (0.03) | 100 (0) |
| D3 | Water | 36 493 | 94.6 | 224 765 | 0.08 (0.02) | 0.30 (0.04) | 84 (8) |
Detailed metric descriptions are available in Supplementary data Table S1.
We conducted a sigmoidal regression analysis to examine the relationship between marsh surface elevation and vegetation cover using data from transition zone paired plots with the following equation:
Where y = the ecological response variable (vegetation cover), x = the independent variable (marsh surface elevation), T = the inflection point, b = the function growth rate and c = the upper asymptote. To identify thresholds of marsh stability along the transition from vegetated marsh to open water, we calculated the local maxima of the first derivative (T), which represents the point of the maximum rate of change. The area of maximum rate of change (AMRC) was calculated as the area between the local maximum and minimum peaks of the second derivative (Hufkens et al., 2008; Frazier and Wang, 2013). Data analyses were performed in SAS 9.3 (SAS, 2011), and Rstudio (R Core Team, 2018).
RESULTS
Landscape patterns
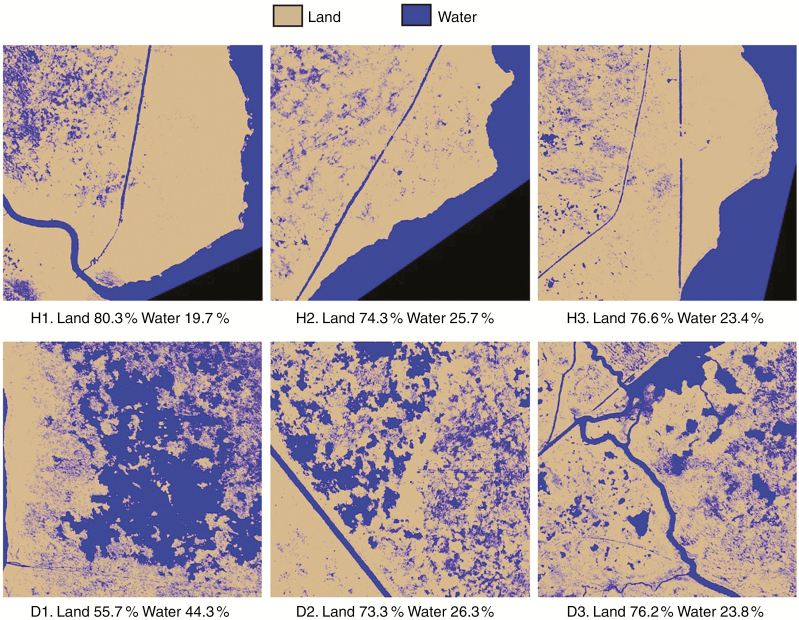
In the healthy sites, relative land cover of the polygons had a range of 74.3–80.3 %, compared with 55.7–76.2 % land cover in the degrading sites (Fig. 6). In the degrading sites, relative water cover had a range of 23.8–44.3 %, compared with 19.7–25.7 % water cover in the healthy sites (Fig. 6). Although there was a clear difference among healthy and degrading sites (H1 and D1) at the extremes of the observed range, there was significant overlap among most healthy and degrading sites, which had similar land to water ratios (H2, H3, and D2, D3).
Fig. 6.
Land–water classification of imagery data using a minimum mapping unit of 69 pixels (0.25 × 0.25 m) for each healthy (H1–H3) and degrading (D1–D3) site. Relative cover of land and water classes is noted below each site panel.
Despite similarities in total cover of land and water pixels, the spatial configuration, or location, of land and water pixels differed among healthy and degrading sites (Table 1). Degrading sites were generally more fragmented compared with healthy sites and had lower aggregation index scores. Furthermore, degrading sites had higher estimates for patch density, which increases with fragmentation, compared with healthy sites.
Abiotic–biotic linkages
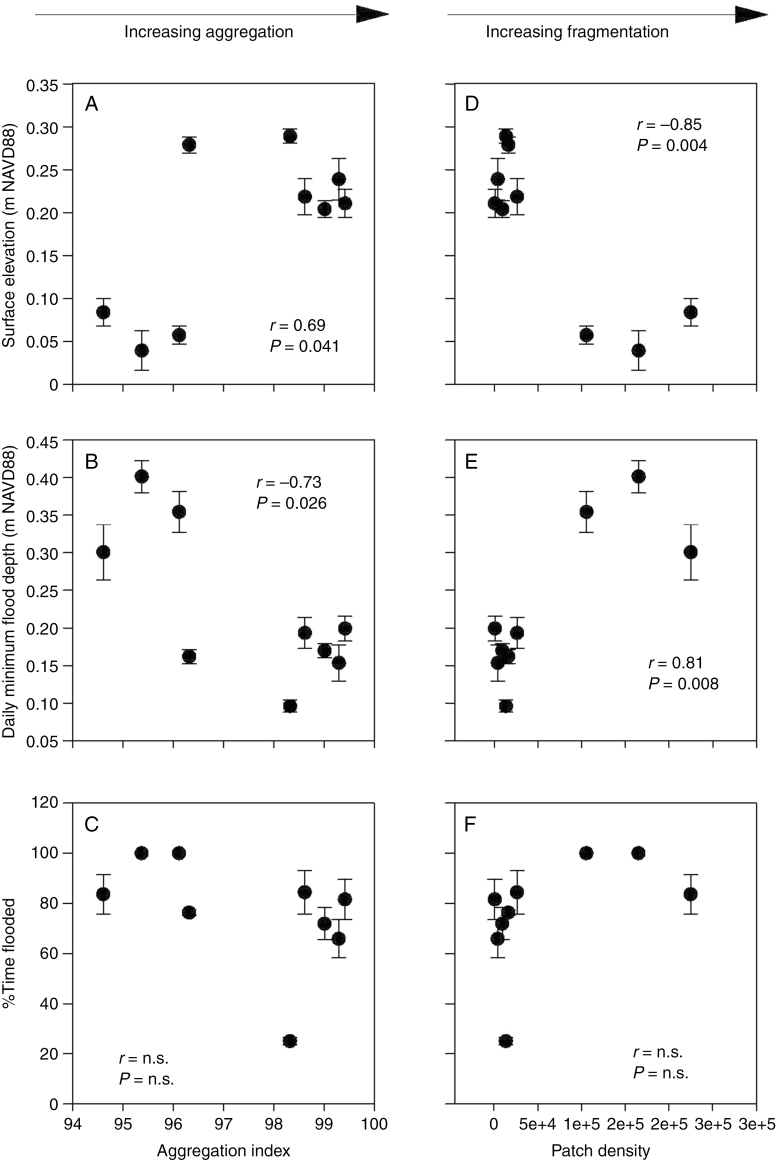
Spatial configuration metrics were significantly correlated with environmental parameters, including marsh surface elevation and daily minimum flood depth (drainage) (Fig. 7). Marsh elevation was positively correlated with the aggregation index, and negatively correlated with patch density. These data indicate that as marsh surface elevation increases, aggregation increases and fragmentation declines (Fig. 7A, D). As expected, flooding trends opposed elevation trends. For example, daily minimum flood depth, which is the inverse of marsh drainage, was negatively correlated with the aggregation index and positively correlated with patch density, a fragmentation metric (Fig. 7B, E). Flood frequency, or percentage time flooded, was not significantly correlated with either of the spatial correlation metrics (Fig. 7D, F). These data illustrate that lower elevation and poor drainage are associated with fragmented landscapes, whereas higher elevation and better drainage are associated with more solid, aggregated marsh landscapes (Fig. 7).
Fig. 7.
Scatter plots representing relationships among the aggregation index and (A) marsh surface elevation, (B) daily minimum flood depth and (C) %time flooded. Scatter plots representing relationships among patch density and (D) marsh surface elevation, (D) daily minimum flood depth and (F) %time flooded. Error bars represent the s.e., n = 9. r denotes the Pearson correlation coefficients between variables. n.s. = not significant (P > 0.05). Metric descriptions are available in Supplementary data Table S1.
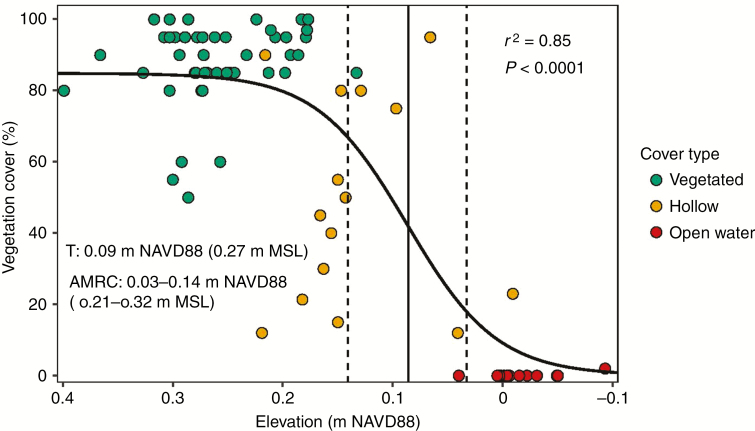
There was a significant positive sigmoidal relationship between marsh surface elevation and vegetation cover in S. patens marshes (Fig. 8). The discrete elevation threshold (T) for vegetation cover in S. patens marshes was 0.09 m NAVD88 (0.27 m MSL), with a transition zone (AMRC) between 0.03 m and 0.14 m (0.21 m and 0.32 m MSL). The data illustrate that as elevation declines past the transition zone boundaries, small changes in elevation lead to large and rapid declines in vegetation cover and ultimately conversion to open water.
Fig. 8.
The sigmoidal relationship between marsh surface elevation (m NAVD88) and vegetation cover (%) in Spartina patens marshes. Marsh observations (green circles) represent vegetation cover in vegetated areas of healthy marshes and hummock areas in degrading marshes. Hollow observations (yellow circles) represent vegetation cover in hollow areas of degrading marshes. Open water observations (red circles) represent vegetation cover in open water areas of degrading marshes. The discrete elevation threshold [i.e. threshold (T)] is represented by a solid line, and the dashed lines represent the elevation threshold zone boundaries [i.e. area of maximum rate of change (AMRC)].
DISCUSSION
As an emergent ecosystem property, the spatial organization of a landscape reflects underlying ecosystem processes and ecological function (Kupfer, 2011). Therefore, appropriate metrics of landscape configuration can be used to assess ecosystem health and habitat quality (O’Neill et al., 1997; Suir et al., 2013) and identify mechanisms of ecosystem change (Kupfer, 2012). In this study, we investigated the spatial configuration of land and water patches in coastal wetlands to identify trends in landscape patterns among healthy and degrading wetlands. We observed that wetland degradation was associated with increasing fragmentation. Healthy wetlands were more spatially consolidated or aggregated, and degrading wetlands were more fragmented. This trend is supported by Couvillion et al. (2016), who illustrated that fragmented wetlands were more vulnerable to further wetland loss. Not only does this indicate that aggregated wetlands contribute to landscape stability, but it also signifies that the process of fragmentation itself contributes to wetland loss. By further linking these landscape configuration patterns with abiotic conditions, such as flooding or sediment availability, we can gain an understanding of the conditions that promote fragmentation and ultimately wetland loss (Turner and Rao, 1990).
In this study, a key characteristic of fragmentation was the formation of hummocks and hollows, which only occurred in the degrading wetlands. We hypothesized that fragmentation in the degrading wetlands was associated with low elevation and high flooding stress. Hummock formation has been identified in other wetland ecosystems as a mechanism to avoid flooding stress. In tidal freshwater forested wetlands, trees are found growing more frequently on high-elevation hummocks, compared with low-elevation and frequently flooded hollows (Duberstein and Conner, 2009), and the presence of this microtopographic variation is an indicator of a healthy ecosystem (Connor et al., 2007). However, hummock and hollow formation in S. patens-dominated coastal marshes has been proposed as an indicator of degradation associated with sub-optimal flooding conditions (Stribling et al., 2006).
Spartina patens forms hummocks by concentrating roots under established ramets and effectively raising the rooting zone above the soil surface (Windham, 1999). The raised hummocks provide improved growing conditions, with regularly drained and aerated soils, that promote high rates of productivity (Stagg et al., 2017). Adjacent to the hummocks, the resultant low-lying hollows are characterized by poorly drained and anoxic soils containing little to no vegetation (Windham and Lathrop, 1999). This pronounced microtopographic variation is not observed in regularly flooded S. patens marshes, rather it is more characteristic of marshes that receive either too little (Windham, 1999) or too much flooding (Stribling et al., 2006).
The formation of hummocks and hollows in response to excessive flooding may be an initial indicator of marsh collapse, or a regime shift from vegetated marsh to open water, which is triggered by a disruption in the hydrologic feedbacks that maintain wetland elevation (Nyman et al., 1993). In poorly drained S. patens marshes, prolonged flooding in the hollows is reinforced by unfavourable biogeochemical conditions (low oxygen availability or high sulphide production) causing plant mortality (Mendelssohn et al., 1981) and subsequently wetland elevation loss (Cherry et al., 2009). Continued flooding leads to further peat collapse and pond formation until the marsh is completely submerged (DeLaune et al., 1994).
Hydrologic feedbacks have been extensively studied in coastal wetlands, where wetland stability is mediated through flooding controls on vegetation production, decomposition and sediment deposition (reviewed in Kirwan and Megonigal, 2013). These feedback mechanisms often include non-linear relationships (Morris et al., 2002), which have been used to identify sea-level rise thresholds of coastal wetland stability (Kirwan et al., 2010). However, the relationships between hydrology, spatial landscape configuration patterns and wetland stability have been understudied. We hypothesized that the relationship between elevation and vegetation cover along the transition from healthy marsh to open water was non-linear and sigmoidal in nature.
Non-linear responses to changing abiotic conditions are common in coastal wetlands (Feher et al., 2017), and can signify abrupt regime shifts (Andersen et al., 2008), such as the conversion of vegetated marsh to open water. In a non-linear sigmoidal relationship, the AMRC represents a transition zone where small changes in the independent (stress) variable cause disproportionately large ecological responses. For example, Gabler et al. (2017) observed transformative changes in wetland community plant structure associated with small changes in precipitation and temperature, representing transitions between graminoid-, succulent- and mangrove-dominated ecosystems. These transition zones are defined by discrete thresholds (T), which can be used to predict ecological responses to stressors (Osland et al., 2014). In the current study, vegetation cover declined significantly beyond an elevation threshold of 0.09 m NAVD88 (0.27 m MSL) and converted to open water beyond 0.03 m NAVD88 (0.21 m MSL). This abrupt decline in vegetation cover not only was defined by an elevation threshold, but was also associated with a distinct change in landscape configuration (fragmentation). Thus, the elevation thresholds defined here delineate a transition zone where hummock and hollow formation will lead to open water, or marsh collapse.
This bimodal behaviour of wetland collapse has been modelled extensively in coastal wetland ecosystems, where feedbacks between sedimentation, hydrology and vegetation productivity lead to the abrupt transition from vegetated marsh to mudflat or open water (Kirwan and Murray, 2007; Marani et al., 2007, 2010; Mariotti and Fagherazzi, 2010). However, empirical observations of threshold dynamics are less common, and coupling of biogeomorphic thresholds to spatial landscape patterns is even rarer (but see Ganju et al., 2017; Schepper et al., 2017). From the limited sample, it appears that variation in elevation thresholds for similar plant communities is not insignificant (Venice Lagoon –0.05 to 0.2 m MSL, Fagherazzi et al., 2006; The Scheldt Estuary 2.26 m MSL, Wang and Temmerman, 2013; and Texas Chenier Plain 0.27 m ASL, current study), indicating that characteristics of the local geomorphic setting (tidal range and sedimentation) are important predictors of these thresholds (Schoolmaster et al., 2018). These findings support the need for future research to identify local thresholds for individual estuaries.
Similarly, landscape metrics, such as those used in this study, are sensitive to scale (Wu, 2004), and analyses conducted at an alternative scale may have different outcomes. To identify the discrete transition from aggregated to fragmented marsh, high-resolution imagery (sub-metre) was necessary to capture the formation of hummocks and hollows. Relatively minor changes in spatial resolution (1–1.5 m) could significantly impact classifications of small water bodies (e.g. hollows) (Enwright et al., 2014), which may hinder threshold identification in these ecosystems. To promote wider implementation of these indicators for management and monitoring programmes, future research should continue to characterize unique thresholds and landscape patterns for individual estuaries, and further relate these findings to readily available (lower resolution) imagery.
Conclusions
The aim of this research was to identify characteristic spatial patterns and hydrologic thresholds of S. patens marsh degradation that can be used to identify areas of vulnerability, reduce flooding threats and improve habitat quality. This work describes the process of coastal wetland loss through changes in spatial landscape patterns, and clearly illustrates the importance of landscape-scale responses as indicators of coastal wetland loss. Our research links changes in landscape patterns to hydrology, demonstrating that progressive fragmentation is associated with degradation and flooding stress. As indicators of wetland degradation, managers can use changes in landscape configuration to identify areas that are vulnerable to flooding risk. Further, we identified a clear non-linear relationship between elevation and vegetation cover along the landscape transition and identified an elevation threshold that delineated the conversion from healthy marsh to open water. In coastal wetlands, coupling local biophysical responses and landscape-scale spatial patterns can be used to capture non-linear behaviour and provide indicators of ecosystem resilience that will allow managers to prevent a dramatic change in ecosystem state (van Belzen et al., 2017).
SUPPLEMENTARY DATA
Supplementary data are available online at https://academic.oup.com/aob and consist of the following. Figure S1: mean abundance of cover types along continuous transects in degrading and healthy Spartina patens marshes. Figure S2: difference image creation comparing automated and manual classification of land and water pixels in site D3. Table S1: quantitative accuracy assessment of land and water classification for each healthy and degrading site. Table S2: description of spatial configuration metrics calculated for healthy and degrading sites.
FUNDING
This work was supported by the USFWS NWR System, USFWS Science Applications, the USGS Science Support Program, the USGS Ecosystems Program, the USGS LandCarbon Program and the USGS Land Change Science R&D Program.
ACKNOWLEDGEMENTS
We would like to thank Douglas Head, Stephanie Goehring, Tiffany Lane and Bryan Carethers from USFWS Texas Chenier Plains NWR Complex for providing logistical and field support. We thank USFWS McFaddin NWR and J.D. Murphree WMA for land access. We are grateful to Kimberly Hamm and Claudia Laurenzano for assistance in manuscript preparation, and Nicholas Enwright (USGS) and the anonymous reviewers for their review of this manuscript. This work was supported by the USFWS NWR System, USFWS Science Applications, the USGS Science Support Program, the USGS Ecosystems Program, the USGS LandCarbon Program and the USGS Land Change Science R&D Program. Any use of trade, firm or product names is for descriptive purposes only and does not imply endorsement by the US Government. All supporting data presented in this paper are publicly archived at sciencebase.gov.
LITERATURE CITED
- Andersen T, Carstnesen J, Hernández-García E, Duarte CM. 2008. Ecological thresholds and regime shifts: approaches to identification. Trends in Ecology and Evolution 24: 49–57. [DOI] [PubMed] [Google Scholar]
- Barbier EB, Hacker DH, Kennedy C, Koch EW, Stier AC, Silliman BR. 2011. The value of estuarine and coastal ecosystem services. Ecological Monographs 81: 169–193. [Google Scholar]
- van Belzen J, van de Koppel J, Kirwan ML, et al. 2017. Vegetation recovery in tidal marshes reveals critical slowing down under increased inundation. Nature Communications 8: 15811. [DOI] [PMC free article] [PubMed] [Google Scholar]
- Chen X, Allison T, Cao W, et al. 2011. Trimble RTX, an innovative new approach for network RTK. In: Proceedings of the 24th International Technical Meeting of the Satellite Division of the Institute of Navigation. ION GNSS-2011 3: 2214–2219. [Google Scholar]
- Cherry JA, McKee KL, Grace JB. 2009. Elevated CO2 enhances biological contributions to elevation change in coastal wetlands by offsetting stressors associated with sea-level rise. Journal of Ecology 97: 67–77. [Google Scholar]
- Coastal Wetlands Planning, Protection & Restoration Act 1990. Public Law 101-646, Title III https://lacoast.gov/new/Pubs/Data/cwppra_compiled-legislation.pdf.
- Congalton RG. 2001. Accuracy assessment and validation of remotely sensed and other spatial information. International Journal of Wildland Fire 10: 321–328. [Google Scholar]
- Connor WH, Doyle TW, Krauss KW. 2007. Ecology of tidal freshwater forested wetlands of the southeastern United States. Dordrecht: Springer. [Google Scholar]
- Couvillion BR, Barras JA, Steyer GD, et al. 2011. Land area change in coastal Louisiana from 1932 to 2010. U.S. Geological Survey Scientific Investigations Map 3164, scale 1:265,000. [Google Scholar]
- Couvillion BR, Fischer MR, Beck HJ, Sleavin WJ. 2016. Spatial configuration trends in coastal Louisiana from 1985 to 2010. Wetlands 36: 347–359. [Google Scholar]
- DeLaune RD, Nyman JA, Patrick WH Jr. 1994. Peat collapse, ponding and wetland loss in a rapidly submerging coastal marsh. Journal of Coastal Research 10: 1021–1030. [Google Scholar]
- Duberstein JA, Conner WH. 2009. Use of hummocks and hollows by trees in tidal freshwater wetlands along the Savannah River. Forest Ecology and Management 258: 1613–1618. [Google Scholar]
- Enwright NM, Jones WR, Garber AL, Keller MJ. 2014. Analysis of the impact of spatial resolution on land/water classifications using high-resolution aerial imagery. International Journal of Remote Sensing 35: 5280–5288. [Google Scholar]
- Esslinger CG, Wilson BC. 2001. North American waterfowl management plan, Gulf Coast joint venture: Chenier Plain initiative. Albuquerque, NM: North American Waterfowl Management Plan. [Google Scholar]
- Fagherazzi S, Carniello L, D’Alpaos L, Defina A. 2006. Critical bifurcation of shallow microtidal landforms in tidal flats and salt marshes. Proceedings of the National Academy of Sciences, USA 103: 8337–8341. [DOI] [PMC free article] [PubMed] [Google Scholar]
- Fagherazzi S, Kirwan ML, Mudd SM, et al. 2012. Numerical models of salt marsh evolution: Ecological, geomorphic, and climatic factors. Reviews of Geophusics 50: RG1002. doi: 10.1029/2011RG000359. [DOI] [Google Scholar]
- Feher LC, Osland MJ, Griffith KT, et al. 2017. Linear and nonlinear effects of temperature and precipitation on ecosystem properties in tidal saline wetlands. Ecosphere 8: e01956. [Google Scholar]
- Folke C, Carpenter S, Walker B, et al. 2004. Regime shifts, resilience, and biodiversity in ecosystem management. Annual Review of Ecology, Evolution, and Systematics 35: 557–581. [Google Scholar]
- Folse TM, Sharp LA, West JL, et al. 2014. A standard operating procedures manual for the Coast-Wide Reference Monitoring System-Wetlands: methods for site establishment, data collection, and quality assurance/quality control. Baton Rouge, LA: The Louisiana Coastal Protection and Restoration Authority, Office of Coastal Protection and Restoration. [Google Scholar]
- Frazier AE, Wang L. 2013. Modeling landscape structure response across a gradient of land cover intensity. Landscape Ecology 28: 233–246. [Google Scholar]
- Gabler CA, Osland M, Grace JB, et al. 2017. Macroclimatic change expected to transform coastal wetland ecosystems this century. Nature Climate Change 7: 142–147. [Google Scholar]
- Ganju NK, Defne Z, Kirwan ML, Fagherazzi S, D’Alpaos A, Carniello L. 2017. Spatially integrative metrics reveal hidden vulnerability of microtidal salt marshes. Nature Communications 8: 14156. [DOI] [PMC free article] [PubMed] [Google Scholar]
- Gao Y, Abdel-Salam M, Chen K, Wojciechowski A. 2005. Point real-time kinematic positioning. In: Sansò F, eds. A window on the future of geodesy. Berlin, Heidelberg: Springer, 77–82. [Google Scholar]
- Hufkens K, Ceulemans R, Scheunders P. 2008. Estimating the ecotone width in patchy ecotones using a sigmoid wave approach. Ecological Informatics 3:97–104. [Google Scholar]
- Jankowski KL, Tӧrnqvist TE, Fernandes AM. 2017. Vulnerability of Louisiana’s coastal wetlands to present-day rates of relative sea-level rise. Nature Communications 8: 14792. [DOI] [PMC free article] [PubMed] [Google Scholar]
- Jiang J, Gao D, DeAngelis DL. 2012. Towards a theory of ecotone resilience: coastal vegetation on a salinity gradient. Theoretical Population Biology 82:29–37. [DOI] [PubMed] [Google Scholar]
- Jones WR, Hartley SB, Stagg CL, Osland MJ. 2018. Land-water classification for selected sites in McFaddin NWR and J.D. Murphree WMA: U.S. Geological Survey data release, doi: 10.5066/F7736Q51. [DOI] [Google Scholar]
- Kirwan ML, Megonigal JP. 2013. Tidal wetland stability in the face of human impacts and sea-level rise. Nature 504: 53–60. [DOI] [PubMed] [Google Scholar]
- Kirwan ML, Murray AB. 2007. A coupled geomorphic and ecological model of tidal marsh evolution. Proceedings of the National Academy of Sciences, USA 104: 6118–6122. [DOI] [PMC free article] [PubMed] [Google Scholar]
- Kirwan ML, Guntenspergen GR, D’Alpaos A, Morris JT, Mudd SM, Temmerman S. 2010. Limits on the adaptability of coastal marshes to rising sea level. Geophysical Research Letters 37: L23401. [Google Scholar]
- Kupfer JA. 2011. Theory in landscape ecology and its relevance to biogeography. In: Millington A, Blumler M, Schickhoff U eds. The SAGE handbook of biogeography. London: SAGE, 57–74. [Google Scholar]
- Kupfer JA. 2012. Landscape ecology and biogeography: rethinking landscape metrics in a post-FRAGSTATS landscape. Progress in Physical Geography 36:400–420. [Google Scholar]
- Marani M, D’Alpaos A, Lanzoni S, Carniello L, Rinaldo A. 2007. Biologically-controlled multiple equilibria of tidal landforms and the fate of the Venice lagoon. Geophysical Research Letters 34: L11402. [Google Scholar]
- Marani M, D’Alpaos A, Lanzoni S, Carniello L, Rinaldo A. 2010. The importance of being coupled: stable states and catastropic shifts in tidal biomorphodynamics. Geophysical Research Letters 115: F04004. [Google Scholar]
- Mariotti G, Fagherazzi S. 2010. A numerical model for the coupled long-term evolution of salt marshes and tidal flats. Geophysical Research Letters 115: F01004. [Google Scholar]
- McGarigal K. 2002. Landscape pattern metrics. In: El-Shaarawi AH, Piegorsch WW, eds. Encyclopedia of environmetrics. Wiley: Chichester, 1135–1142. [Google Scholar]
- Mendelssohn IA, Morris JT. 2002. Eco-physiological controls on the productivity of Spartina alterniflora Loisel. In: Weinstein MP, Kreeger DA, eds. Concepts and controversies in tidal marsh ecology. Dordrecht: Kluwer, 59–80. [Google Scholar]
- Mendelssohn IA, McKee KL, Patrick WH. 1981. Oxygen deficiency in Spartina alterniflora roots: metabolic adaptation to anoxia. Science 214: 439–441. [DOI] [PubMed] [Google Scholar]
- Moon JA, Haukos DA, Conway WC. 2015. Mottled duck (Anas fulvigula) movements in the Texas Chenier Plain Region. Journal of the Southeastern Association of Fish and Wildlife Agencies 2: 255–261. [Google Scholar]
- Morris JT, Sundareshwar PV, Nietch CT, Kjerfve B, Cahoon DR. 2002. Responses of coastal wetlands to rising sea level. Ecology 83: 2869–2877. [Google Scholar]
- National Oceanic and Atmospheric Administration 2010. Office for Coastal Management. Coastal Change Analysis Program (C-CAP) Regional Land Cover. Charleston, SC: Accessed at www.coast.noaa.gov/ccapftp. [Google Scholar]
- Nyman JA, DeLaune RD, Roberts HH, Patrick WH Jr. 1993. Relationship between vegetation and soil formation in a rapidly submerging coastal marsh. Marine Ecology Progress Series 96: 269–279. [Google Scholar]
- O’Neill RV, Hunsaker CT, Jones KB, et al. 1997. Monitoring environmental quality at the landscape scale. Bioscience 47:513–519. [Google Scholar]
- Osland MJ, Enwright N, Stagg CL. 2014. Freshwater availability and coastal wetland foundation species: ecological transitions along a rainfall gradient. Ecology 95: 2789–2802. [Google Scholar]
- Penland S, Ramsey KE. 1990. Relative sea-level rise in Louisiana and the Gulf of Mexico: 1908–1988. Journal of Coastal Research 6: 323–342. [Google Scholar]
- Pennings SC, Grant MB, Bertness MD. 2005. Plant zonation in low-latitude salt marshes: disentangling the roles of flooding, salinity and competition. Journal of Ecology 93: 159–167. [Google Scholar]
- R Core Team 2018. R: A language and environment for statistical computing. Vienna, Austria: R Foundation for Statistical Computing; https://www.R-project.org/. [Google Scholar]
- RESTORE Act. 2012. Resources and Ecosystems Sustainability, Tourist Opportunities, and Revived Economies of the Gulf Coast States Act of 2012 https://www.treasury.gov/services/restore-act/Documents/Final-Restore-Act.pdf.
- Rozema J, Scholten MCT, Blaauw PA, Diggelen J. 1988. Distribution limits and physiological tolerances with particular reference to the salt marsh environment. In: Davy AJ, Hutchings MJ, Watkinson AR, eds. Plant population ecology. Oxford: Blackwell Scientific, 137–164. [Google Scholar]
- SAS Institute Inc 2011. Base SAS® 9.3 Procedures Guide. Cary, NC: SAS Institute Inc. [Google Scholar]
- Scheffer M, Carpenter S, Foley JA, Folke C, Walker B. 2001. Catastrophic shifts in ecosystems. Nature 413: 591–596. [DOI] [PubMed] [Google Scholar]
- Schepers L, Kirwan M, Guntenspergen G, Temmerman S. 2017. Spatio‐temporal development of vegetation die‐off in a submerging coastal marsh. Limnology and Oceanography 62: 137–150. [Google Scholar]
- Schoolmaster DR, Stagg CL, Sharp LA, et al. 2018. Vegetation cover, tidal amplitude and land area predict ahort-term marsh vulnerability in coastal Louisiana. Ecosystems 21: 1335–1347. [Google Scholar]
- Stagg CL, Mendelssohn IA. 2011. Controls on resilience and stability in a sediment-subsidized salt marsh. Ecological Applications 21: 1731–1744. [DOI] [PubMed] [Google Scholar]
- Stagg CL, Schoolmaster DR Jr, Piazza SC, et al. 2017. A landscape-scale assessment of above- and belowground primary production in coastal wetlands: implications for climate change-induced community shifts. Estuaries and Coasts 40: 856–879. [Google Scholar]
- Stagg CL, Osland MJ, Moon J, et al. 2019. Local and landscape-scale data describing patterns of coastal wetland loss in the Texas Chenier Plain, U.S.A. 2017–2018: U.S. Geological Survey data release, doi: 10.5066/P9SXJX2T. [DOI]
- Stribling JM, Glahn OA, Chen XM, Cornwell JC. 2006. Microtopographic variability in plant distribution and biogeochemistry in a brackish-marsh system. Marine Ecology Progress Series 320: 121–129. [Google Scholar]
- Suir GM, Evers DE, Steyer GD, Sasser CE. 2013. Development of a reproducible method for determining quantity of water and its configuration in the marsh landscape. Journal of Coastal Research 63: 110–117. [Google Scholar]
- Sweet WV, Kopp RE, Weaver CP, et al. 2017. Global and regional sea level rise scenarios for the United States. NOAA Technical Report NOS CO-OPS 083. Silver Spring, MD: NOAA. [Google Scholar]
- Turner RE. 2004. Coastal wetland subsidence arising from local hydrologic manipulations. Estuaries 27: 265–272. [Google Scholar]
- Turner RE, Rao YS. 1990. Relationships between wetland fragmentation and recent hydrologic changes in a Deltaic Coast. Estuaries 13: 272–281. [Google Scholar]
- Wang C, Temmerman S. 2013. Does biogeomorphic feedback lead to abrupt shifts between alternative landscape states? An empirical study on intertidal flats and marshes: shifts between intertidal flat and marsh. Journal of Geophysical Research (Earth Surface) 118: 229–240. [Google Scholar]
- White WA, Tremblay TA. 1995. Submergence of wetlands as a result of human induced subsidence and faulting along the upper Texas Gulf Coast. Journal of Coastal Research 11: 788–807. [Google Scholar]
- Wilson BC. 2007. North American waterfowl management plan, Gulf Coast joint venture: Mottled Duck Conservation Plan. Albuquerque, NM: North American Waterfowl Management Plan. [Google Scholar]
- Windham L. 1999. Microscale spatial distribution of Phragmites australis (common reed) invasion into Spartina patens (salt hay)-dominated communities in brackish tidal marsh. Biological Invasions 1: 137–148. [Google Scholar]
- Windham L, Lathrop RG. 1999. Effects of Phragmites australis (common reed) invasion on aboveground biomass and soil properties in brackish tidal marsh of the Mullica river, New Jersey. Estuaries 22: 927–935. [Google Scholar]
- Wu J. 2004. Effects of changing scale on landscape pattern analysis: scaling relations. Landscape Ecology 19: 125–138. [Google Scholar]
Associated Data
This section collects any data citations, data availability statements, or supplementary materials included in this article.


