

Cities recapitulate a universal pathway into innovative economies.
Abstract
Is there a universal economic pathway individual cities recapitulate over and over? This evolutionary structure—if any—would inform a reference model for fairer assessment, better maintenance, and improved forecasting of urban development. Using employment data including more than 100 million U.S. workers in all industries between 1998 and 2013, we empirically show that individual cities indeed recapitulate a common pathway where a transition to innovative economies is observed at the population of 1.2 million. This critical population is analytically derived by expressing the urban industrial structure as a function of scaling relations such that cities are divided into two economic categories: small city economies with sublinear industries and large city economies with superlinear industries. Last, we define a recapitulation score as an agreement between the longitudinal and the cross-sectional scaling exponents and find that nontradeable industries tend to adhere to the universal pathway more than the tradeable.
INTRODUCTION
Home to more than half of humanity, cities have pushed the boundaries of human productivity, innovation, and success as economic, social, and cultural hubs in an era of rapid urbanization (1, 2). The future development of cities may depend on identifying and maintaining the pathways of urban evolution. To this end, many features of human behavior and society have been modeled by frameworks of universality (3–5), which suggests that cities may too follow universal trends regardless of regional and historical differences. Identifying these universal trends in urban economic growth may prepare policy makers for the economic and industrial needs of their growing cities.
The development of individual cities has long been considered as idiosyncratic and specialized according to their historical and geographical constraints (6–13); however, recent studies reveal several regular patterns associating urban characteristics with population size (1, 14–21). In particular, many different quantities Y change with city population N according to Y(N) ≈ Y0Nβ (14, 17, 21, 22), suggesting that population size can indicate a substantial number of urban properties under a universal mechanism applied to all cities (14) although precise estimates of β can be difficult (23, 24). This scaling pattern also describes economic properties and further characterizes individual industries by their labor types. For example, cognitive labor–based industries scale superlinearly with population size (β > 1), while manual labor–based industries instead exhibit sublinear scaling (β < 1) (21, 25). These population dependencies may undergird many aspects of the urban economic structure—small cities heavily rely on manual labor while large cities on cognitive labor (21, 26–29).
While the cross-sectional scaling relation describes urban economic features as a function of population size (1), it remains to be seen how useful it is when it comes to a city’s longitudinal evolution (30–32). To test this, we measure to what extent individual cities recapitulate the pathway universally prescribed by the scaling law. Inspired by biological ontogenetic growth and recapitulation, we call this property “urban recapitulation” (33). Using employment data for U.S. cities from 1998 to 2013, we show empirically how the industrial character of cities changes with urban size and industries’ scaling exponent β.
We demonstrate that the longitudinal change of urban economies indeed follows a universal process governed by changes in population size. By examining the revealed comparative advantage for individual industries given each city, our analysis reveals a transition point from a manual labor economy to a cognitive-based innovative economy at around a population of 1.2 million in the United States. We provide a recapitulation score to measure the deviation of a city’s economy from the cross-sectional scaling by which the universal pathway is revealed.
RESULTS
Explaining innovative economies of large cities
We compare industrial employment and population changes in 350 U.S. cities according to the industries that characterize each city between 1998 and 2013. We measure the importance of industry i to city c according to its revealed comparative advantage (RCA) (34–37) (i.e., location quotient) given by where Yci denotes the employment of i in c. Normalizing employment statistics in this way controls for ubiquitous industries and, thereby, highlights the industries that distinguish urban economies from each other. In particular, an industry is called characteristic if rcaci > 1 (34, 35).
Figure 1A shows characteristic industries in cities of different sizes. Consistent with existing studies (21, 26, 27, 38), small cities are characterized by manual industries such as agriculture and mining, while large cities are characterized by cognitive industries, such as management and professional services. The urban scaling model across cities of population size Nc accurately describes employment for most industries (i.e., R2 > 0.65), showing superlinear scaling (i.e., βi > 1) for cognitive industries and sublinear scaling (i.e., βi < 1) for manual labor industries (see Table 1 and the Supplementary Materials). Small cities tend to be characterized by sublinearly scaled industries, while large cities are characterized by superlinearly scaled industries (see histograms in Fig. 1, A and B). We observe a strong correlation between the average scaling exponent of characteristic industries and urban size (Pearson correlation ρ = 0.59).
Fig. 1. City size determines characteristic economic structure.
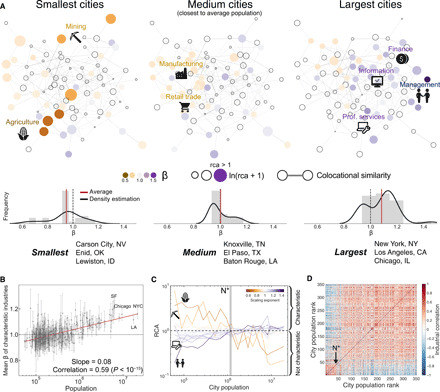
(A) The characteristic industries of the three smallest, medium, and largest cities in the industry space (see Materials and Methods). Each industry (node) is sized by its comparative advantages and colored by the cross-sectional scaling exponent (β). Every value is averaged over the 16-year time span reflected in our dataset. Empty nodes are noncharacteristic industries. Two industries are connected when they are likely to exist in the same city (ψ > 0.15). The histogram shows the frequency of scaling exponents of characteristic industries in each industry space. (B) The average scaling exponent of characteristic industries in each U.S. city (y axis) compared to population (x axis). (C) We compare the importance of industries (y axis) with different scaling exponents (color) across cities of different sizes (x axis). A vertical section denotes the economic profile of a city of that population. We observe a critical population (N* ≈ 1.2 million) that divides small city economies from innovative large city economies. (D) After ordering U.S. cities in decreasing size (x and y axes), we measure the pairwise Pearson correlation of economic profiles Ic of cities averaged for the entire time span. As in (C), N* corresponds to a critical population size that separates cities based on economic profile.
Table 1. Urban recapitulation is common across industries.
List of recapitulation scores Si, cross-sectional scaling exponents βi, scaled growth coefficients , and nationwide trends of industry sectors in the order of Si. The cross-sectional scaling exponent is averaged over the 16-year time span. The scaled growth coefficient and the nationwide trend are measured for the difference between 1998 and 2013 according to Eq. 2. The recapitulation score captures how much the scaled growth is associated with the cross-sectional scaling according to Eq. 3.
| Industry | Si | βi | ||
| Educational services | 0.90 | 1.21 | 1.09 | 0.18 |
| Retail trade | 0.86 | 0.96 | 0.82 | −0.12 |
| Construction | 0.82 | 1.05 | 0.86 | −0.28 |
| Utilities | 0.79 | 0.99 | 1.20 | −0.30 |
| Wholesale trade | 0.78 | 1.12 | 0.88 | −0.18 |
| Real estate and rental and leasing |
0.76 | 1.12 | 0.85 | −0.09 |
| Other services (except public administration) |
0.74 | 1.02 | 0.76 | −0.15 |
| Arts, entertainment, and recreation |
0.71 | 1.09 | 0.77 | 0.06 |
| Management of companies and enterprises |
0.71 | 1.46 | 1.03 | 0.02 |
| Accommodation and food services |
0.69 | 1.00 | 0.69 | 0.10 |
| Health care and social assistance |
0.69 | 0.96 | 0.66 | 0.15 |
| Manufacturing | 0.66 | 0.94 | 0.62 | −0.47 |
| Transportation and warehousing |
0.65 | 1.11 | 0.72 | 0.14 |
| Professional, scientific, and technical services |
0.64 | 1.22 | 0.78 | 0.07 |
| Information | 0.58 | 1.16 | 0.67 | −0.23 |
| Finance and insurance | 0.50 | 1.17 | 0.59 | −0.07 |
| Administrative and support and waste management and remediation services |
0.37 | 1.17 | 0.44 | −0.06 |
| Agriculture, forestry, fishing, and hunting |
0.28 | 0.65 | 1.13 | −0.31 |
| Mining, quarrying, and oil and gas extraction |
0.06 | 0.78 | 1.51 | −0.30 |
Why should this empirical relationship exist? We explore this question with an analytical model. The importance of an industry in a city rcaci can be expressed as a function of the city’s population using the industry’s scaling exponent βi. Assuming urban population is distributed according to P(N) ∝ N−2 following Zipf’s law (39) (see the Supplementary Materials for further justification), we have
| (1) |
where Nmax and Nmin are the sizes of the largest and smallest cities, respectively (see the Supplementary Materials for a complete derivation). Following this model, the rcaci of a given industry increases monotonically with population for superlinear industries and decreases for sublinear industries, consistent with the observations in Fig. 1A.
This analysis highlights a transition point that separates urban economies into small city manual labor economies and large city cognitive labor economies. Solving for fixed points in Eq. 1 reveals a saddle point at β* = 1 and N* ≈ 1.2 million, which is around the population of Louisville, KY, the 43rd largest city (see the Supplementary Materials). Empirical observations support this analytical result; Fig. 1C demonstrates an inversion of characteristic industries around N* = 1.2 million by their scaling exponents. Furthermore, the pairwise correlation of economic profiles in Fig. 1D confirms this division into two city clusters at around the 50th largest city (see Materials and Methods for the correlation). Cities below this critical population have “small city” economies represented by manual labor industries with sublinear scaling, while cities above the critical size have “large city” economies represented by cognitive labor industries with superlinear scaling.
Universal pathway recapitulated by individual industries
Thus far, we have observed cross-sectional evidence relating population size and the economic structure of cities, but does this trend also describe the economic evolution of cities over time? In particular, do longitudinal changes in population relate to longitudinal changes in industrial composition governed by industries’ scaling exponents? If so, then the combined cross-sectional and temporal observations would be evidence for a universal pathway recapitulated by urban economies as cities grow.
We illustrate the trajectory of employment versus on population for individual cities to describe their longitudinal dynamics over a 16-year time span. On aggregate, we find strong evidence to suggest that changes in city size are more influential on employment by industry than national labor trends (see table S3), but there is some variation by industry. For some industries, such as education (Fig. 2A), cities are likely to move along the universal pathway given by the scaling relation, whereas other industries, such as manufacturing (Fig. 2B), drift upward or downward with a strong nationwide trend [e.g., expansion of health care (40, 41); the Supplementary Materials contain a full set of industries].
Fig. 2. Cities recapitulate the industrial employment of larger cities.
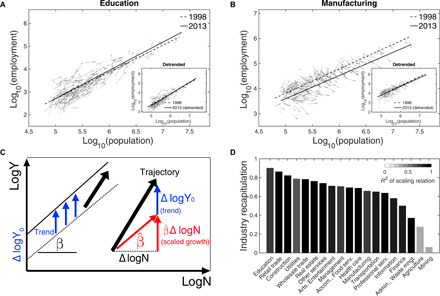
(A) The trajectory of each city’s Educational Services employment and population size. The scaling relations are denoted by the lines for 1998 (dashed) and 2013 (solid). Arrows depict the change in population and industry size of each city from 1998 to 2013. The detrended trajectory of each city is depicted in the inset. We decompose the nationwide trend and subtract it from the employment growth of each city. (B) Similar to (A), the trajectory of each city by employment in manufacturing. (C) Decomposition of a city’s trajectory. A city’s trajectory (black arrow) can be decomposed into scaled growth (red arrow) and nationwide trend (blue arrow). (D) The recapitulation score for each industry in the 2-digit North American Industry Classification System (NAICS) classification. For industries that are well described by urban scaling (i.e., R2 > 0.65), the average industrial recapitulation score of 0.70 is reasonably high.
We first separate scaled growth effects in cities from nationwide trends to properly estimate longitudinal scaling effects. From the scaling equation , changes of industry i employment in city c are decomposed into two parts
| (2) |
where Δlog Yci is the total longitudinal change in employment and βiΔlog Nc is the change associated with changes in population size (namely, scaled growth) between the starting year, 1998, and the ending year, 2013, of our dataset. The regression on the observations Δlog Yci and Δlog Nc measures the empirical scaled growth coefficient and the nationwide trend (see the schematic in Fig. 2C). This scaled growth coefficient denotes the longitudinal scaling effect on the employment change with respect to the population change.
Detrending the nationwide effect reveals universal dynamics of cities along a common pathway, namely, urban recapitulation (see the insets in Fig. 2, A and B). The trajectories of individual cities converge to the common pathway, analogous to other industries with smaller nationwide trends (e.g., education). This convergence shows that longitudinal changes in industrial employment strongly depend on changes in population following the urban scaling relationship between employment and population at a given moment. Urban scaling provides a reference framework for estimating the upcoming urban economic change when population change is expected.
We provide a recapitulation score that quantitatively measures how accurately a cross-sectional scaling exponent estimates scaled growth as following
| (3) |
where is the scaled growth coefficient, and βi is the cross-sectional scaling exponent. If population changes are perfectly related to employment changes, then we expect the scaled growth coefficient to be equal to the scaling exponent with Si = 1. On the other hand, a recapitulation score equal to zero suggests that population change does not affect employment. Across industries, recapitulation scores tend to be high with an average recapitulation score of , which suggests that urban recapitulation is common across different U.S. industries. Furthermore, this observation provides a sufficient condition for a constant deviation of scaling relations at different moments (1).
Why do we observe strong recapitulation in certain industries? Traded industries do not necessarily rely on local production and consumption as they sell products in external markets. As a result, its population dependency is weakened and so is its recapitulation score. We observe strong recapitulation in the industries that we locally consume, such as education, retail trade, construction, and utilities, while weak in the tradeable industries, such as agriculture, mining, administrative services, and finance. Therefore, our analysis provides a reliable reference for economic growth based on industry’s tradeability. This finding also explains why studies on industrial clusters and the product space do not focus on the population dependency (34, 42).
Urban recapitulation to innovative economies
In general, how strongly do individual cities adhere to urban recapitulation? We investigate through the aggregated employment by industry in a group of cities of similar size. A group recapitulation score averaged over all industries measures how strongly the economies of a city group recapitulate a universal pathway. We first divide cities into 20 equal-sized groups (i.e., 17 and 18 cities in each group) according to the rank of population size and calculate the ratio of industry i’s employment change to population change averaged for cities in group g. We use to denote a group scaled growth coefficient by industry. Similar to the recapitulation score in Eq. 3, the score comparing and βi measures the degree of recapitulation in each industry, thus the score averaged over all industries measures the overall recapitulation of city group g. We use Sg to denote a city group’s recapitulation score (see Materials and Methods for mathematical details). Similar to before, Sg = 1 when industries of city group g perfectly recapitulate the trends predicted by cross-sectional urban scaling and becomes zero when population change does not affect their employment changes.
High recapitulation scores for city groups validate urban recapitulation in U.S. cities. Figure 3A demonstrates that strong recapitulation occurs over all city groups as . Most city groups exhibit a high strength of recapitulation, except for a few groups of very small cities. The consistency with the average of industry recapitulation score shows that urban recapitulation is robust for industries and cities. Therefore, as recapitulation is observed in each industry, entire urban economies recapitulate the universal pathway described by scaling relations.
Fig. 3. Urban recapitulation is common across city sizes and leads small cities to follow the economic path of larger cities.
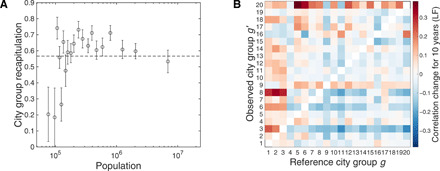
(A) The recapitulation score for each city group using industries with strong scaling relationships. Cities are binned into 20 equal-sized groups according to population size. A longitudinal scaling effect explains about 60% of employment growth in most cities except for a few very small cities. The dashed line denotes the average recapitulation score over all groups. (B) The lead-follow matrix demonstrates increases (red) or decreases (blue) in industrial similarity between cities ranked and grouped by size (i.e., group 1 denotes the largest cities and group 20 denotes the smallest cities). Each cell represents the similarity change over 10 years of an observed city group (y axis) with respect to a reference group (x axis). The positive upper triangle means that smaller cities in the future become more similar to larger cities at the present.
Last, we demonstrate the structural transition of urban economies through the longitudinal change of economic profiles. We first obtain a group economic profile (i.e., RCA values) averaged over cities divided into 20 groups according to their populations. Then, the longitudinal change of correlation of group economic profiles captures the change of industrial similarity between two city groups. For example, if the smallest cities exhibited increasing correlation in the period between 1998 and 2008 with the largest cities fixed in 1998, then the industries of the smallest cities became more similar to the past industries of the largest cities within 10 years. We measure these pairwise similarity changes between city groups and represent them as a lead-follow matrix (see Materials and Methods for the mathematical details).
The lead-follow matrix provides evidence of the universal changes led by large cities and followed by small cities (see Fig. 3B) as would be expected with urban recapitulation. The positive similarity change in the upper triangle shows that small cities become more similar to the past of the larger cities by 2.95% over a 10-year period. On the other hand, the negative similarity change in the lower triangle shows that large cities become increasingly dissimilar to the smaller cities by 4.0% over 10 years. This observation illustrates an overall pattern that large cities lead the economic developmental pathway and small cities follow it. Thus, both small cities and large cities evolve into innovative economies according to the overall increase of populations in the 16-year time span. From the evidences of the group recapitulation score and the lead-follow matrix, we conclude that cities recapitulate a universal pathway paved by scaling relations. Along with the structural difference by population size, an urban economy is expected to become more innovative, creative, and economically desirable as it grows along the universal pathway.
DISCUSSION
Urban recapitulation helps to explain the economic change of individual cities following a universal pathway governed by scaling relations. Analytical and empirical analyses of the scaling properties lead to a systematic division of small city economies from innovative large city economies at a critical population of 1.2 million. Our recapitulation framework reveals that longitudinal population changes scale employment changes in most industries with a high accuracy (about 70%). As a result, urban economies as a whole evolve into innovative economies through a universal developmental pathway led by large cities and followed by small cities. Overall, urban scaling underpins the structure and the pathway of urban economies, and the population size helps to determine the state of a city.
Our framework is inspired by the recapitulation theory in biology (33) much the same as urban scaling theory (14) is motivated from the allometric scaling in biology (43). However, there is an important conceptual difference between them. In biological recapitulation, similar species recapitulate a shared evolutionary pathway from their ancestors in phylogeny as they grow in their life cycles. On the other hand, cities rarely die nor give a birth. Therefore, it is difficult to define urban phylogeny, not to mention ancestors, and thus we use the term “recapitulation” in a loose definition, in a rather colloquial way: Each city seems to recapitulate evolutionary footprints of the largest city which is prescribed by the scaling relations.
A limitation of our study is the coverage of our dataset which includes only a 16-year-long time window and economies in the United States. Fortunately, this time window includes major economic changes such as the growth of the internet and the digital economy in the 2000s and the Great Recession in 2008 and the recovery (see the Supplementary Materials for the trend of employment). Therefore, the observed urban recapitulation is not constrained to a stationary economic condition. Further studies in different regions other than the United States are needed to hold the universal pathway.
Our findings on the recapitulation and the industrial transition give some political insights on urban economies. First, high-skilled workers can play an important role to maintain urban growth. Although our finding does not suggest any causal relation, it highlights transition to innovative industries with superlinearly increasing skilled workers, coinciding with the conventional wisdom on urban development by educated workers (13, 11). Second, growth of urban employment can be dominated by the industries whose products or services are locally consumed or sold in other cities or countries. As the different levels of recapitulation by industries denotes, governmental support policy on local businesses may not be effective if their products are easily replaceable by the products from other regions. Third, rapidly increasing high-tech industries could intensify the economic polarization between large cities and small cities. Most of innovative industries, e.g., management, professional services, finance, and information, are not very likely to recapitulate as their products or services are not localized. This trend, with the higher risk of automation in small cities (28) and migration of skilled workers to large cities (31), demands labor policies to prepare for the vulnerable employment in small cities.
MATERIALS AND METHODS
Data
This study uses employment data by North American Industry Classification System (NAICS) industry code and 350 U.S. metropolitan statistical areas, referred to as “city” throughout the manuscript, according to the U.S. Bureau of Labor Statistics. The sizes of industry set are 19, 86, 289, 642, and 978 according to the depth of classification denoted by 2 to 6 digits. We use 2-digit classification for analyses as default. Data include annual employment measurements for the years 1998 through 2013.
Economic profile and inter-industry relatedness
We characterize industry i as an array of RCA values of cities as Ii = (…, log (rcaci + 1), log (rcac′i + 1)…). Similarly, a city is characterized as a profile of industries according to Ic = (…, log (rcaci + 1), log (rcaci′ + 1), …). The inter-industry relatedness (34, 44–46) is defined by the Pearson correlation of two economic profiles Ii and Ij as
| (4) |
where ρ is the Pearson correlation function. It describes how two different industries are likely to exist in the same cities. We measure the relatedness for each year in our dataset and average them in time. Figure 1A shows links that satisfy ψ(i, j) > 0.15. The pairwise correlation of cities can also be measured from the Pearson correlation ρ(Ic, Ic′).
Recapitulation score of city groups
The recapitulation score of a city group is defined by generalizing the decomposition in Eq. 2 for individual cities. We bin cities into 20 equal-sized city groups (i.e., 17 and 18 cities in each group) according to their populations. We can determine the scaled growth of each city by subtracting industry i’s nationwide growth estimated in Eq. 2. Then, the group scaled growth coefficient is given as the average ratio of scaled growth (i.e., ) to the population change (i.e., Δlog Nc) for the cities in city group g as
| (5) |
where c ∈ g is the set of cities in city group g, and the groups are determined in the order of populations (see the Supplementary Materials for the detailed derivation). A city group recapitulation score is the similarity with the static scaling exponent βi according to
| (6) |
where i ∈ I is the set of all industries.
Lead-follow matrix
A lead-follow matrix measures the temporal change of industrial similarity between cities to identify the direction of evolution. As in “Recapitulation score of city groups” section, we bin cities into 20 equal-sized city groups according to their populations and, for each city group, we represent the economic profile Ig(t) of city group g at year t as the average RCA values of each city in group according to
| (7) |
where I denotes the set of 2-digit NAICS industry codes. Then, the Pearson correlation ϕgg′(t, τ) of Ig(t) and Ig′(t + τ) shows how the economic profiles of city groups g and g′ relate over different time periods t and t + τ. A lead-follow score LFgg′ aggregates these industrial changes over each starting year in our dataset, according to
| (8) |
where T is the length of aggregation period in years which we set as 10 years as default. This score denotes the average similarity change between reference group g and observed group g′, and a lead-follow matrix for the scores of all pairs summarizes the overall trend (see the Supplementary Materials for other time periods).
Supplementary Material
Acknowledgments
We thank R. Hausmann, F. Neffke, L. M. A. Bettencourt, and C. Hidalgo for useful comments. Funding: This work was supported by the Ministry of Education of the Republic of Korea and the National Research Foundation of Korea (NRF-2018S1A3A2075175). Author contributions: W.-S.J. and H.Y. designed the research; I.H. and H.Y. performed the research; I.H., M.R.F., and H.Y. analyzed data; and I.H., M.R.F., I.R., W.-S.J., and H.Y. wrote the paper. Competing interests: The authors declare that they have no competing interests. Data and materials availability: All data needed to evaluate the conclusions in the paper are present in the paper and/or the Supplementary Materials. Additional data related to this paper may be requested.
SUPPLEMENTARY MATERIALS
Supplementary material for this article is available at http://advances.sciencemag.org/cgi/content/full/6/34/eaba4934/DC1
REFERENCES AND NOTES
- 1.Bettencourt L. M. A., Lobo J., Strumsky D., West G. B., Urban scaling and its deviations: Revealing the structure of wealth, innovation and crime across cities. PLOS ONE 5, e13541 (2010). [DOI] [PMC free article] [PubMed] [Google Scholar]
- 2.E. Glaeser, Triumph of the City (Penguin Books, 2011). [Google Scholar]
- 3.Barabási A.-L., The origin of bursts and heavy tails in human dynamics. Nature 435, 207–211 (2005). [DOI] [PubMed] [Google Scholar]
- 4.Simini F., González M. C., Maritan A., Barabási A.-L., A universal model for mobility and migration patterns. Nature 484, 96–100 (2012). [DOI] [PubMed] [Google Scholar]
- 5.Barzel B., Barabási A.-L., Universality in network dynamics. Nat. Phys. 9, 673–681 (2013). [DOI] [PMC free article] [PubMed] [Google Scholar]
- 6.Duranton G., Puga D., Diversity and specialisation in cities: Why, where and when does it matter? Urban Stud. 37, 533–555 (2000). [Google Scholar]
- 7.Ellison G., Glaeser E. L., The geographic concentration of industry: Does natural advantage explain agglomeration? Am. Econ. Rev. 89, 311–316 (1999). [Google Scholar]
- 8.Delgado M., Porter M. E., Stern S., Clusters, convergence, and economic performance. Res. Policy 43, 1785–1799 (2014). [Google Scholar]
- 9.E. L. Glaeser, “Urban colossus: Why is New York America’s largest city?” (Technical Report, National Bureau of Economic Research, 2005).
- 10.Evans G., Creative cities, creative spaces and urban policy. Urban Stud. 46, 1003–1040 (2009). [Google Scholar]
- 11.M. Storper, T. Kemeny, N. Makarem, T. Osman, The Rise and Fall of Urban Economies: Lessons from San Francisco and Los Angeles (Stanford Univ. Press, 2015).
- 12.Martin R., Sunley P., Path dependence and regional economic evolution. J. Econ. Geogr. 6, 395–437 (2006). [Google Scholar]
- 13.Glaeser E. L., Reinventing Boston: 1630–2003. J. Econ. Geogr. 5, 119–153 (2005). [Google Scholar]
- 14.Bettencourt L. M. A., Lobo J., Helbing D., Kühnert C., West G. B., Growth, innovation, scaling, and the pace of life in cities. Proc. Natl. Acad. Sci. U.S.A. 104, 7301–7306 (2007). [DOI] [PMC free article] [PubMed] [Google Scholar]
- 15.Batty M., The size, scale, and shape of cities. Science 319, 769–771 (2008). [DOI] [PubMed] [Google Scholar]
- 16.M. Batty, The New Science of Cities (MIT Press, 2013). [Google Scholar]
- 17.Gomez-Lievano A., Patterson-Lomba O., Hausmann R., Explaining the prevalence, scaling and variance of urban phenomena. Nat. Hum. Behav. 1, 0012 (2017). [Google Scholar]
- 18.Fujita M., Krugman P., Mori T., On the evolution of hierarchical urban systems. Eur. Econ. Rev. 43, 209–251 (1999). [Google Scholar]
- 19.Mori T., Nishikimi K., Smith T. E., The number-average size rule: A new empirical relationship between industrial location and city size. J. Reg. Sci. 48, 165–211 (2008). [Google Scholar]
- 20.Bettencourt L. M. A., The origins of scaling in cities. Science 340, 1438–1441 (2013). [DOI] [PubMed] [Google Scholar]
- 21.Youn H., Bettencourt L. M. A., Lobo J., Strumsky D., Samaniego H., West G. B., Scaling and universality in urban economic diversification. J. R. Soc.Interface 13, 20150937 (2016). [DOI] [PMC free article] [PubMed] [Google Scholar]
- 22.Bettencourt L. M. A., Lobo J., Urban scaling in Europe. J. R. Soc. Interface 13, 20160005 (2016). [DOI] [PMC free article] [PubMed] [Google Scholar]
- 23.Arcaute E., Hatna E., Ferguson P., Youn H., Johansson A., Batty M., Constructing cities, deconstructing scaling laws. J. R. Soc. Interface 12, 20140745 (2015). [DOI] [PMC free article] [PubMed] [Google Scholar]
- 24.Leitão J. C., Miotto J. M., Gerlach M., Altmann E. G., Is this scaling nonlinear? R. Soc. Open Sci. 3, 150649 (2016). [DOI] [PMC free article] [PubMed] [Google Scholar]
- 25.Pumain D., Paulus F., Vacchiani-Marcuzzo C., Lobo J., An evolutionary theory for interpreting urban scaling laws. Cybergeo 2006, 1–20 (2006). [Google Scholar]
- 26.R. Florida, The Rise of the Creative Class (Basic books New York, 2004). [Google Scholar]
- 27.G. Michaels, F. Rauch, S. J. Redding, “Task specialization in us cities from 1880–2000” (Technical Report, National Bureau of Economic Research, 2013).
- 28.Frank M. R., Sun L., Cebrian M., Youn H., Rahwan I., Small cities face greater impact from automation. J. R. Soc. Interface 15, 20170946 (2018). [DOI] [PMC free article] [PubMed] [Google Scholar]
- 29.Balland P.-A., Jara-Figueroa C., Petralia S. G., Steijn M. P. A., Rigby D. L., Hidalgo C. A., Complex economic activities concentrate in large cities. Nat. Hum. Behav. 4, 248–254 (2020). [DOI] [PubMed] [Google Scholar]
- 30.Depersin J., Barthelemy M., From global scaling to the dynamics of individual cities. Proc. Natl. Acad. Sci. U.S.A. 115, 2317–2322 (2018). [DOI] [PMC free article] [PubMed] [Google Scholar]
- 31.Keuschnigg M., Scaling trajectories of cities. Proc. Natl. Acad. Sci. U.S.A. 116, 13759–13761 (2019). [DOI] [PMC free article] [PubMed] [Google Scholar]
- 32.Bettencourt L. M. A., Yang V. C., Lobo J., Kempes C. P., Rybski D., Hamilton M. J., The interpretation of urban scaling analysis in time. J. R. Soc. Interface 17, 20190846 (2020). [DOI] [PMC free article] [PubMed] [Google Scholar]
- 33.P. R. Ehrlich, R. W. Holm, The Process of Evolution (McGraw-Hill, 1963). [Google Scholar]
- 34.Hidalgo C. A., Klinger B., Barabási A.-L., Hausmann R., The product space conditions the development of nations. Science 317, 482–487 (2007). [DOI] [PubMed] [Google Scholar]
- 35.Balassa B., Trade liberalisation and “revealed” comparative advantage. Manchester Sch. 33, 99–123 (1965). [Google Scholar]
- 36.Glaeser E. L., Kallal H. D., Scheinkman J. A., Shleifer A., Growth in cities. J. Political Econ. 100, 1126–1152 (1992). [Google Scholar]
- 37.Markusen A., Schrock G., The distinctive city: Divergent patterns in growth, hierarchy and specialisation. Urban Stud. 43, 1301–1323 (2006). [Google Scholar]
- 38.Henderson J. V., Efficiency of resource usage and city size. J. Urban Econ. 19, 47–70 (1986). [Google Scholar]
- 39.Rosen K. T., Resnick M., The size distribution of cities: An examination of the pareto law and primacy. J. Urban Econ. 8, 165–186 (1980). [Google Scholar]
- 40.Bureau of Labor Statistics, Healthcare Occupations, www.bls.gov/ooh/healthcare/home.htm [accessed 15 March 2019].
- 41.Pierce J. R., Schott P. K., The surprisingly swift decline of us manufacturing employment. Am. Econ. Rev. 106, 1632–1662 (2016). [Google Scholar]
- 42.Porter M., The economic performance of regions. Reg. Stud. 37, 549–578 (2003). [Google Scholar]
- 43.West G. B., Brown J. H., Enquist B. J., A general model for the origin of allometric scaling laws in biology. Science 276, 122–126 (1997). [DOI] [PubMed] [Google Scholar]
- 44.Neffke F., Henning M. S., Revealed relatedness: Mapping industry space. Pap. Evol. Econ. Geogr. 8, 19 (2008). [Google Scholar]
- 45.Muneepeerakul R., Lobo J., Shutters S. T., Goméz-Liévano A., Qubbaj M. R., Urban economies and occupation space: Can they get “there” from “here”? PLOS ONE 8, e73676 (2013). [DOI] [PMC free article] [PubMed] [Google Scholar]
- 46.Shutters S. T., Muneepeerakul R., Lobo J., Constrained pathways to a creative urban economy. Urban Stud. 53, 3439–3454 (2016). [Google Scholar]
Associated Data
This section collects any data citations, data availability statements, or supplementary materials included in this article.
Supplementary Materials
Supplementary material for this article is available at http://advances.sciencemag.org/cgi/content/full/6/34/eaba4934/DC1