

Abstract
Robust CD8+ T cell memory is essential for long-term protective immunity, but is often compromised in cancer where T cell exhaustion leads to loss of memory precursors. Immunotherapy via checkpoint blockade may not effectively reverse this defect, potentially underlying disease relapse. Here we report that mice with a CD8+ T cell-restricted neuropilin-1 (NRP1) deletion exhibited substantially enhanced protection from tumor re-challenge and sensitivity to anti-PD1 immunotherapy, despite unchanged primary tumor growth. Mechanistically, NRP1 cell-intrinsically limited the self-renewal of the CD44+PD1+TCF1+TIM3– progenitor exhausted T cells (pTEX), which was associated with their reduced ability to induce c-Jun/AP-1 expression upon T cell receptor (TCR) re-stimulation, a mechanism that may contribute to terminal T cell exhaustion at the cost of memory differentiation in wildtype tumor-bearing hosts. These data suggest that blockade of NRP1, a unique “immune memory checkpoint”, may promote the development of long-lived tumor-specific TMEM that are essential for durable anti-tumor immunity.
Although immune checkpoint blockade (ICB; with anti-CTLA4, anti-PD1, anti-PD-L1) has revolutionized cancer therapy, only a small proportion (10–30%) of cancer patients exhibit a durable clinical response1,2. Consequently, there is intense interest in identifying mechanisms of pre-existing and acquired immune resistance as well as the development of new therapeutic approaches to prevent relapse. It is also imperative to understand the mechanisms underlying the lack of a durable response seen in patients post-ICB treatment, an issue which can be associated with impaired formation of a long-lived memory CD8+ T cell (TMEM) pool capable of conferring durable remission3,4. It has been postulated that the restrained and/or limited TMEM pool that occurs in tumor-bearing hosts is reminiscent of observations in chronic viral infection where severe T cell exhaustion manifests at the expense of memory differentiation5. As a consequence, memory precursors (MP) fail to accumulate and thus are unable to form an adequate TMEM repertoire. Exhausted T cells (TEX) represent an independent CD8+ T cell lineage with considerable stability that is distinct from CD8+ T effector (TEFF) or TMEM, and are marked by co-expression of multiple inhibitory receptors (IRs), such as PD1, CTLA4, LAG3, TIM3, TIGIT, and 2B4.6,7. PD1:PD-L1 immune checkpoint blockade is insufficient to reinvigorate TEX to become durable TMEM6, however, it is unclear what pathways would be necessary for restoration of robust and durable anti-tumor T cell memory.
Neuropilin-1 (NRP1), originally discovered as a neuronal and endothelial cell receptor required for normal embryonic development, axon guidance and vasculature formation8–10, is also expressed by several immune cell types where it participates in critical immune functions11. Notably, it has been identified as a marker for thymically-derived murine regulatory T cells (Treg cells)12 and is crucial for their suppression of anti-tumor immunity13,14. NRP1 is elevated in Treg cells from cancer patients and marks a highly suppressive Treg cell subset14–16, suggesting that NRP1 might be a therapeutic target for cancer immunotherapy. However, the functional role of NRP1 on other T cell subsets, in particular CD8+ T cells, remains poorly understood17–19.
In this study, we report that NRP1 is induced on tumor-infiltrating CD8+ T cells despite limited expression on naive CD8+ T cells. Although NRP1 expression is highly concordant with multiple IRs, its function is distinct in cell-intrinsically limiting memory CD8+ T cell differentiation without substantially modulating effector activity. Analysis of peripheral blood-derived CD8+ T cells from patients with head and neck squamous cell carcinoma (HNSCC) and advanced skin malignancies, showed that increased NRP1 expression, particularly within the effector memory CD8+ T cell compartment, was correlated with the reduced size of the memory CD8+ T cell pool, poor disease outcome and decreased responsiveness to ICB. Our study uncovers a previously unappreciated role for NRP1 in CD8+ T cells and suggests that it is primarily an immune checkpoint of T cell memory. Thus, targeting NRP1 may facilitate the restoration of durable anti-tumor immunity.
Results
NRP1 limits CD8+ T cell-mediated anti-tumor immunity to tumor re-challenge and anti-PD1 immunotherapy
NRP1 was robustly induced on CD8+ tumor-infiltrating lymphocytes (TILs) in the B16.F10 (B16) mouse melanoma model, although it is undetectable on naive CD8+ T cells and only expressed on a small fraction of effector or memory CD8+ T cell subsets from unchallenged mice (Fig.1a). This was observed primarily in the KLRG1–CD127– TEFF and the KLRG1loCD127hi memory precursor effector cells (MPECs) but remained low in the KLRG1hiCD127lo short-lived effector cells (SLECs) and barely detectable in central memory cells (TCM) (Fig. 1a and Extended Data Fig. 1a). The upregulation of NRP1 was also found in CD8+ TEFF subsets from mice infected with lymphocytic choriomeningitis virus (LCMV), in particular higher in the MPECs induced by Clone 13 infection (D30), a chronic infection model known to induce T cell exhaustion20, compared to those induced by Armstrong (D8), a model of acute infection (Extended Data Fig. 1b). Moreover, NRP1 was co-expressed with PD1 on CD8+ T cells both in unchallenged and tumor-bearing mice (Extended Data Fig. 1c), suggesting that NPR1 may act as an IR-like molecule in CD8+ T cells.
Figure 1: NRP1 limits CD8+ T cell-mediated anti-tumor immunity to tumor re-challenge and anti-PD1 immunotherapy.

a, Expression of NRP1 measured by flow cytometry in subsets of CD8αβ+ T cells isolated from the intestine of naive mice (n=7, upper); and B16.F10 (B16) tumors recovered on day 12 (D12) post inoculation (n=9, lower); Bar graphs tabulating the percentage of NRP1+ cells within the indicated CD8αβ+ T cell subpopulations. (TRM: tissue resident memory; TCM: central memory T cells; SLECs: short-lived effector cells; MPECs: memory precursor effector cells.)
b, (Upper) Barnes-Hut Stochastic Neighbor Embedding (bh-SNE) visualization of the expressions of indicated markers by B16 intratumoral CD8+ cells recovered from E8ICre (WT) mice, D18 post inoculation. (Bottom) Representative flow plots depicting co-expression of NRP1 with other inhibitory receptors (IRs) in the same sample shown in the bh-SNE plots.
c, SPICE (Simplified Presentation of Incredibly Complex Evaluations) plots illustrating the co-expression of NRP1 and IRs by B16 tumor-infiltrating CD8+ T cells on D9, D12 and D18 post inoculation.
d, Experimental scheme for induction of post-surgical tumor immunity with B16 tumors.
e, E8ICre and E8ICreNrp1L/L mice subjected to B16 tumor model were monitored for tumor growth at primary (1°) and re-challenge phase, respectively. (Left) Survival curve for the 1° B16 tumor growth; (Middle and Right) Kaplan-Meir curves for the percentage of tumor-free mice with the +30d (middle) and +60d (right) re-challenge scheme, respectively.
f, E8ICreErt2gfp (E8ICreErt2gfp) and E8ICreErt2gfpRosa26LSL.Ametrine.2A.Nrp1 (E8ICreErt2gfpRosa26LSL.Nrp1) mice were treated with Tamoxifen (1.5 mg) by intraperitoneal injection (i.p.) for 5 consecutive days prior to the B16 tumor model. (Left) Survival curve for the 1° B16 tumor growth; (Right) Kaplan-Meir curve for the percentage of tumor-free mice with the +30d re-challenge scheme.
g, Experimental scheme for anti-PD1 immunotherapy with MC38 tumor model.
h, i, Tumor growth curve (h) and survival curve (i) of MC38 tumor implanted in the E8ICreNrp1L/L (n=10) and E8ICre mice (n=8).
All data were pooled from 3 independent experiments, with n=5–17 mice per group (as specified in the legend for each panel). Error bars, mean± s.e.m; Statistical significance was determined by One-way ANOVA (a); Log-rank test (e, f and i) or two-way ANOVA (h) with correction for multiple comparisons (****p<0.0001 and other p values as indicated).
NRP1+CD8+ TILs exhibited higher expression of markers associated with T cell activation (CD44, CD69, CD25) and cell proliferation (BrdU) compared to NRP1– cells, but lower expression of CD62L, CD127 and KLRG1, markers associated with naive/memory or senescent T cell phenotypes (Extended Data Fig. 1d). NRP1 expression, as determined by high dimensional flow cytometry, consistently marked a subset of PD1hi, multi-IR+ CD8+ TILs, which was most prominent on D18 post-B16 inoculation, suggesting that NRP1 may primarily function on TEX cells (Fig. 1b, c).
To interrogate whether NRP1 specifically impacts CD8+ T cell function in anti-tumor immunity, we generated mice with (i) CD8+ T cell-restricted NRP1-deficiency (E8ICreNrp1L/L) (Extended Data Fig. 2a,b), and (ii) CD8+ T cell-restricted, temporally-controlled, constitutive NRP1 expression, (E8ICreErt2gfpRosa26LSL.Ametrine.2A.Nrp1; GFP marks CD8 expression, Ametrine marks Cre activity and Rosa26 driven-Nrp1 expression) (Extended Data Fig. 2c). Deletion of Nrp1 in CD8+ T cells did not significantly alter the composition of the immune infiltrate in primary (1°) B16.F10 (B16) tumors (Extended Data Fig. 3a–d), nor did it result in a significant difference in the growth of 1° B16 tumors (Fig. 1d and Extended Data Fig. 3e). Furthermore, whereas therapeutic vaccination of B16-Ova tumor bearing mice with attenuated Listeria monocytogenes expressing Ova peptide (LM-Ova) exhibited a substantive reduction in tumor growth, this was comparable in E8ICre and E8ICreNrp1L/L mice (Extended Data Fig. 3f). Collectively, these data suggest that NRP1 loss from CD8+ T cells has no effect on primary tumor growth and the effector T cell response to primary tumors following therapeutic vaccination.
In order to assess the effect of NRP1 on the recall response to a secondary tumor challenge, the primary tumor was resected at D12, mice left for 1 or 2 months, and then injected with B16 on the contralateral side (Fig. 1d). E8ICreNrp1L/L mice exhibited significantly enhanced protection against a secondary (2°) B16 challenge 30 or 60 days following 1° tumor resection, relative to E8ICre mice (Fig. 1e and Extended Data Fig. 3g). In contrast, 2° B16 tumor growth was slightly exacerbated in E8ICreErt2gfpRosa26LSL.Nrp1 mice in which NRP1 was constitutively expressed on CD8+ T cells following treatment with tamoxifen prior to 1° tumor challenge (Fig. 1f and Extended Data Fig. 3h). The E8ICreNrp1L/L mice also showed significantly improved sensitivity to anti-PD1 checkpoint blockade, when administered at a suboptimal dose (100 μg/mouse) in the 1° MC38 tumor model, resulting in 70% complete regression (CR) compared to 25% CR in the E8ICre control mice (Fig. 1g–i). Taken together, these data suggest that loss of NRP1 in CD8+ T cells substantively enhances immunity against secondary exposure to tumors, including relatively ‘cold’ tumors like B16, and improves sensitivity to anti-PD1 immunotherapy, albeit with little impact on the growth of untreated primary tumors.
NRP1 promotes terminal exhaustion in tumor-infiltrating CD8+ T cells
Tumor-primed T cell memory contributes critically to post-surgical tumor immunity21,22. We thus asked whether NRP1 acts as a CD8+ T cell-intrinsic modulator of this process. At the time of tumor resection (D12), although the number of intratumoral CD8+ TCM (CD44+iCD62L+) in the E8ICreNrp1L/L mice was not significantly altered compared with the E8ICre control mice, the number of intratumoral CD8+ TEFF (CD44+CD62L–) was significantly increased, resulting in a higher TEFF to TCM ratio (Fig. 2a,b). We further examined MPECs and SLECs, the bifurcation of which represents the first step of memory T cell commitment, but did not observe a significantly altered ratio between these two subsets, although both showed increased numbers in the E8ICreNrp1L/L mice (Fig. 2a,b). This was also the case when we examined tumor-specific CD8+ T cells that recognized the melanocyte differentiation antigen gp100 (H2-Db gp100+, designated as Db-gp100+ thereafter) (Extended Data Fig. 4a,b). Nevertheless, the frequency of Db-gp100+ CD8+ T cells, as well their TCM phenotype in the spleen of these mice was significantly increased on D12 (Extended Data Fig. 4c,d), consistent with their enhanced protection against tumor re-challenge (Extended Data Fig. 4e). Taken together, these data suggested that loss of NRP1 on CD8+ T cells promoted an intratumoral effector CD8+ T cell pool that was more capable of generating a peripheral memory T cell pool, without any alteration in proportional fate choice between MPECs and SLECs.
Figure 2: NRP1 promotes terminal exhaustion in tumor-infiltrating CD8+ T cells.

a, b, Numeration of CD8+ T cell subsets (TCM, TEFF, MPECs, SLECs) infiltrating B16-gp100 tumor on D12, from the E8ICre (n=7) or E8ICreNrp1L/L (n=10) mice. Data presented as absolute cell number per gram tumor mass. Data were pooled from 2 independent experiments with consistent observations.
c, (Left) Representative flow plots for the expression of IRs on CD8+ tumor-infiltrating lymphocytes (TILs) of 1° B16 tumors on D18. (Right) SPICE plots visualization for co-expression of multiple IRs.
d, Numeration of 5-IR-co-expressing cells (5-IR+) on D18 (n=8), depicted as the percentage within CD8+ TILs (left) and absolute number per gram tumor mass (right). Bar represented mean value.
e, Representative flow cytometry plot for the expressions of cleaved Caspase 3 (cCasp3), Bcl2, Ki67, and TCF1 on CD8+ TILs recovered from 1° B16 tumors on D18 post inoculation.
f, Bar graphs tabulating the mean percentage of cells of indicated phenotype within CD8+ TILs, i.e., total cCasp3+ (n=5), Bcl2hicCasp3– (n=6), Ki67+ (n=7) and TCF1+ (n=8) respectively, on D12 and D18 of 1° B16 tumors.
g, Representative flow cytometry plots depicting the subsets within the exhausted CD8+ T cell (TEX) pool of B16-gp100 tumors, harvested on D12 and D18, segregated by progenitor TEX (pTEX, CD44+PD1+TCF1+TIM3–) and terminally TEX (tTEX, CD44+PD1+TCF1+TIM3–). Bar graph tabulating the number (mean value) of pTEX and tTEX per gram tumor mass. n=8 for D12 and n=5 for D18, pooled from 2 independent experiments.
h, The same pTEX and tTEX analysis as in f, but within the CD8+ TILs specific for gp100-tetramer (Db-gp100+). Only samples with >50 intratumoral Db-gp100+ cells gated for flow cytometry analysis were included.
All symbols represented individual mouse; Error bars, mean± s.e.m; Statistical significance was determined by two-tailed unpaired Student’s t test (a, b and d) or two-way ANOVA (f-g) with correction for multiple comparisons; all p values were indicated.
Apart from generating long-lived memory T cells, MPECs are considered to be the same precursors that give rise to TEX following prolonged antigen stimulation, which commonly occurs in tumor-bearing or chronic virally-infected hosts5. The Nrp1–/– CD8+ TILs exhibited a slight increase in IR expression on D12 and an increased proportion of 5-IR expressing-cells compared to the Nrp1+/+CD8+ TILs (Extended Data Fig. 4f,g). In contrast, there was a significant reduction of IR expression and reduced proportion of 5-IR expressing-cells on D18 (Fig. 2c,d), when the majority of intratumoral CD8+ TILs were functional exhausted, evidenced by the substantially reduced frequency of polyfunctional cytokine-producing cells (Extended Data Fig. 4h,i). Although the Nrp1–/– CD8+ TILs did not show significantly improved poly-functionality on D18 (Extended Data Fig. 4h,i), they did exhibit alterations in certain TEX related-features, such as reduced cell turnover indicated by lower levels of Ki67 and cleaved Caspase 3 (Fig. 2e,f). Conversely, they showed increased expression of the survival factor Bcl2 and notably TCF1, the transcription factor associated with programming both memory precursor and progenitor TEX (pTEX)23,24. Moreover, TCF1 is also required for the maintenance of intratumoral pTEX pool by driving a transcriptional program that confers stem-like, self-renewal properties25. Indeed, while the number of terminally TEX (tTEX, CD44+PD1+TCF1–TIM3+) did not significantly differ between the two genotypes on D18, the number of pTEX (CD44+PD1+TCF1+TIM3–) was significantly increased in the E8ICreNrp1L/L mice (Fig. 2g). This was in particular evident for the tumor-antigen specific (Db-gp100+) CD8+ TEFF from the B16-g100 tumor-bearing E8ICreNrp1L/L mice, which contained a higher frequency and number of pTEX on D18 but also D12 (Fig. 2h). The early time point (D12) observation is interesting, as it coincided with the increased frequency of peripheral Db-gp100+CD8+ in the E8ICreNrp1L/L mice on D12 (Extended Data Fig. 4c). Altogether, our data suggested that loss of NRP1 in late-stage CD8+ effector T cells restricts terminal exhaustion by reducing cell turnover and importantly, imposing a stem-like self-renewing phenotype that may improve differentiation towards functional, long-lived memory cells.
NRP1 cell-intrinsically limits the in vivo persistence of tumor antigen-specific CD8+ T cells
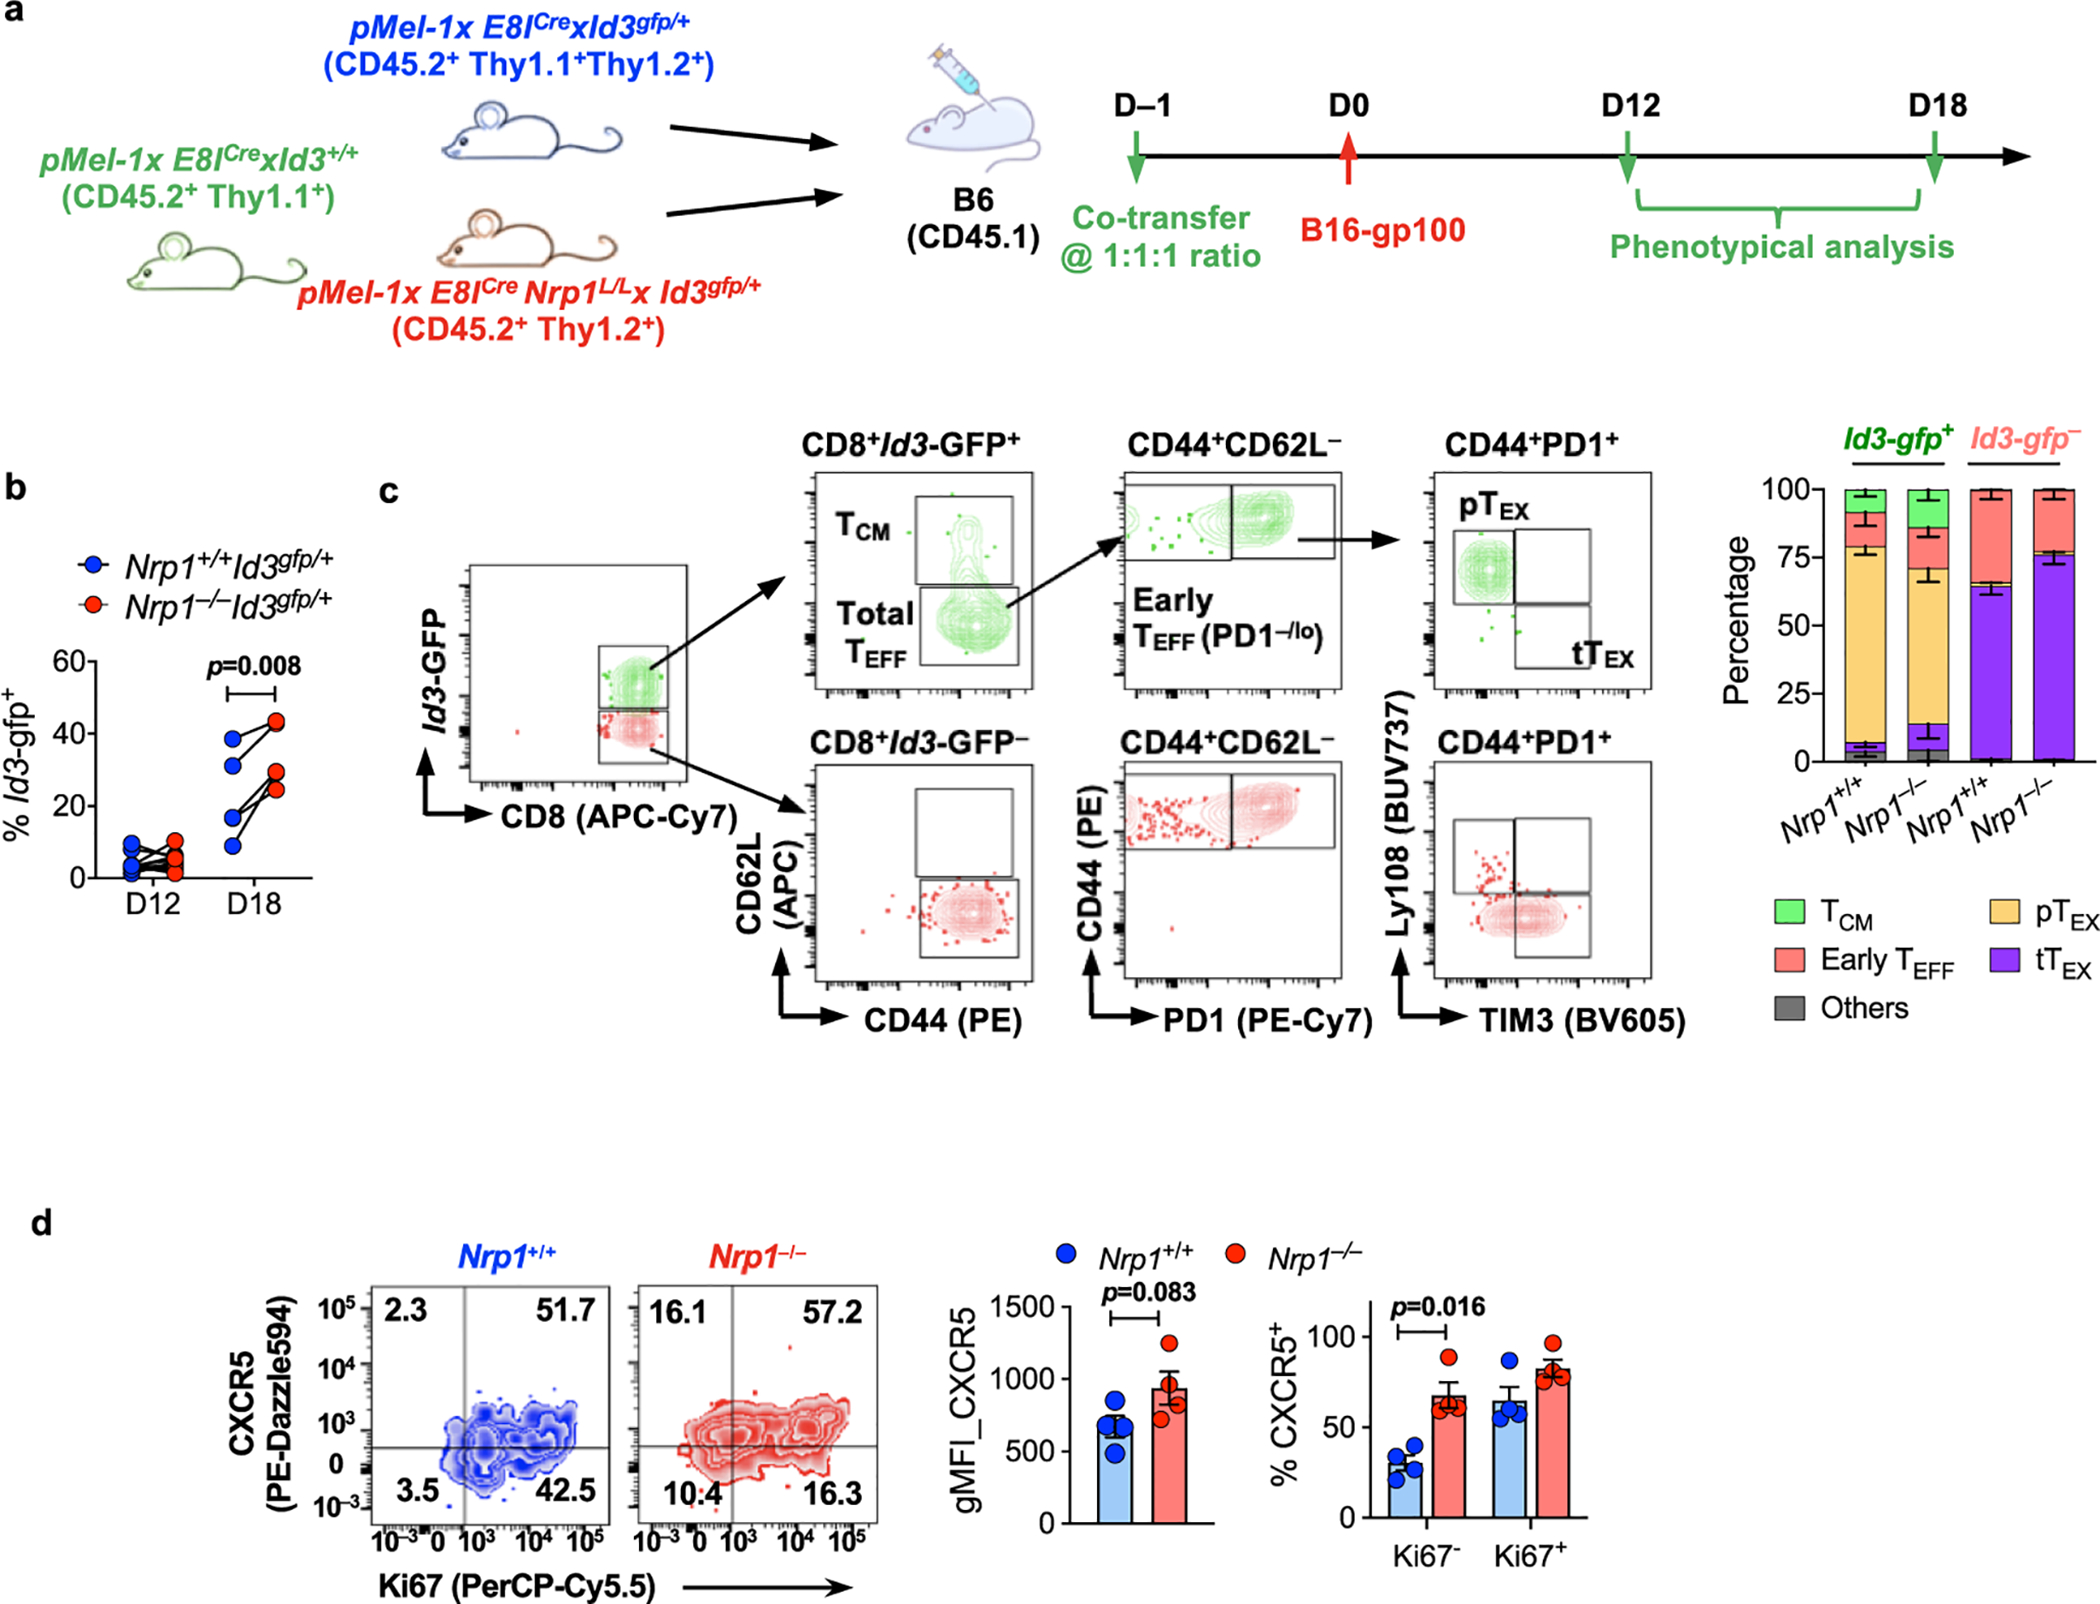
In order to accurately track CD8+ T cell differentiation, persistence and fate in vivo, as well as assess if NRP1 functions in a cell-intrinsic or cell-extrinsic manner, congenically-marked Nrp1–/– and Nrp1+/+ pMel transgenic CD8+ T cells that are specific for pre-melanosome protein gp10026 were mixed at a 1:1 ratio and co-transferred into CD45.1 C57BL6 recipients on D-1 (Fig. 3a and Extended Data Fig. 5a). On D0, mice were injected with B16-gp100 cells, tumor resected on D12, and mice re-challenged on D42 with B16-gp100 cells. While Nrp1–/– and Nrp1+/+ pMel-T cell numbers were comparable at early stages of both the 1° and 2° tumor, Nrp1–/– cells out-numbered their wildtype (WT) counterparts over time (Fig. 3b,c). The ratio between Nrp1–/– versus Nrp1+/+ donor pMel-T cells positively correlated with the tumor size, consistent with the notion from the polyclonal CD8+ T cell setting that loss of Nrp1 led to a survival advantage in CD8+ TEFF under prolonged antigen exposure (Extended Data Fig. 5b). As a result, Nrp1–/– pMel-T cell number was increased on D12 and exhibited delayed contraction compared with their WT counterparts (Extended Data Fig. 5c). Additionally, a ~2:1 ratio of Nrp1–/– to WT pMel-T cells was consistently observed in the peripheral lymphoid tissues, but not in the blood during the 1° tumor phase, which was maintained long-term (Fig. 3b,c and Extended Data Fig. 5d,e). These data suggest that NRP1 restrains in vivo persistence of tumor antigen-specific CD8+ T cells in a cell-intrinsic manner.
Figure 3: NRP1 cell-intrinsically limits the persistence of antigen-specific CD8+ T cells.

a, Experimental scheme for pMel-T cell co-transfer model.
b,c, Representative flow cytometry plots depicting the Nrp1+/+ and Nrp1–/– pMel-T cell donors detected in the B16-gp100 tumors (upper), and the matched non-draining lymph nodes (NdLN) (lower) during (b) primary phase (n=5 for D9 and D15, n=7 for D12 and D21) and (c) recall phase (n=7 for both time points). Bar graph on the side tabulating the mean percentage of cells of either genotype within the donor cell pool (CD45.2+). Replicates was derived from individual recipient, 3 independent time course experiments with consistent observations were pooled.
d, (Left) Representative flow cytometry plots showing the expression of TCF1 and TIM3 by intratumoral Nrp1+/+ or Nrp1–/– pMel-T donors (gated on CD44+PD1+), from B16-gp100 tumor harvested on D12. (Right) The percentage of pTEX and tTEX within the Nrp1+/+ or Nrp1–/– pMel-T donors were tabulated (n=8). Each pair of connected dots represented individual recipient; data were pooled from 2 independent experiments.
e, (Left) Gating scheme used to identify subsets enriched for MPECs or TCM within the CD44+ donor-derived pMel-T cells found in periphery between D12 and D42 of primary phase. (Right) Frequencies of Nrp1+/+ (n=5) or Nrp1–/– (n=5) -derived donor cells of the CD27+CD62L–(MPECs), or CD27+CD62L+(TCM) phenotype within CD45.2+ compartment over time, recovered from NdLN. Each replicate was derived from individual recipient, 3 independent time course experiments with consistent observations pooled.
f, (Left) Representative flow cytometry plots showing the expression of Bcl2 and IRF4 in the NRP1– and NRP1+ fraction of Nrp1+/+ pMel-T cells of MPECs phenotype, recovered from NdLN on D21 of primary phase. (Right) Ratio between the Bcl2hiIRF4lo and Bcl2loIRF4hi subset within the Nrp1+/+ or Nrp1–/– pMel-T cells (n=3, from individual recipient) recovered from NdLN of CD45.1 recipient, on D12 and D21 of primary phase. Bar represented mean value.
Error bars, mean± s.e.m; Statistical significance was determined by two-tailed paired Student’s t test (b, c, d and f) or two-way ANOVA (e) with correction for multiple comparisons. (****p<0.0001 and other p values as indicated)
Although NRP1 was highly induced on intratumoral pMel-TEFF, it was downregulated in early MPECs cells found in the periphery on D21 and undetectable in established TCM on D56 (Extended Data Fig. 5f), aligned with the observation from polyclonal CD8+ T cells that NRP1 is primarily expressed during the effector phase. Therefore, we hypothesized that the impact of NRP1 on TMEM fate may be selective for effector-to-memory (E→M) transition, rather than TMEM pool maintenance, which occurs later.
Consistent with our observations in E8ICreNrp1L/L mice, intratumoral Nrp1–/– pMel cells contained higher frequency of pTEX (CD44+PD1+TCF1+TIM3–) compared to their WT counterparts on D12, supporting the notion that intratumoral pTEX phenotype were better preserved in the absence of NRP1 (Fig. 3d). Furthermore, from D12 to D42, during which E→M transition occurs, the percentage of Nrp1–/– MPECs within the donor cell pool (CD45.2+) was preferentially sustained compared to Nrp1+/+ MPECs (Fig. 3e and Extended Data Fig. 5g). Consequently, this contributed to an increase in the Nrp1–/– TCM pool during this period, in contrast to a smaller, unchanged Nrp1+/+ TCM pool. Consistent with polyclonal CD8+ T cells, the NRP1+ fraction within the WT pMel donor-derived MPECs exhibited a higher percentage of Ki67+ cells compared to their NRP1– counterparts (Extended Data Fig. 5h). Additionally, this was associated with a Bcl2loIRF4hi short-lived effector phenotype, while the NRP1– counterparts had a predominantly Bcl2hiIRF4lo long-lived cell phenotype27. Furthermore, ablation of Nrp1 resulted in a higher ratio of Bcl2hi versus Bcl2lo cells within MPECs during E→M transition, particularly on D21 (Fig. 3f and Extended Data Fig. 5i). Taken together, NRP1 appears to limit proliferative quiescence in antigen-specific cells during the E→M transition, leading to reduced cell survival and inefficient commitment to a memory T cell fate.
To identify downstream target(s) of NRP1 in CD8+ T cells, we performed transcriptomic analysis using bulk-population RNA sequencing (bpRNAseq) of Nrp1+/+ and Nrp1–/– donor pMel-T cells recovered from B16-gp100 tumors (D12 and D21 post-transfer), along with draining (DLN) and non-draining lymph nodes (NdLN) (D12, D21, D35 and D63 post-transfer) (sampling scheme, Fig. 4a). Principal component analysis (PCA) of pooled datasets demonstrated that tumor-derived and peripherally-derived T cells segregated into two distinct clusters, in line with the effector-dominating and memory-dominating phenotype of cells present in these two locations (Fig. 4b). The peripherally-derived datasets further segregated into four clusters (C1~C4), primarily based on the stage of cell activation, with the C1 and C2 consisting of cells recovered from the primary phase (D12 and D21), C3 with cells from the late exhaustion/early memory phase (D35), and C4 with cells from recall/secondary memory phase (D63). Loss of NRP1 had a greater impact on the transcriptome of cells in the primary phase (C1 and C2) and recall/secondary memory phage (C4), which was driven by biosynthesis (C1), cell division (C2), and the effector T cell activity and T or B cell-interaction in the secondary effectors (C4), respectively (Supplementary Table 1). When comparing CD8+ T cell-specific gene signatures derived from LCMV infection models, the loss of NRP1 in the tumor-infiltrating effector cells resulted in a significant enrichment of gene signatures associated with a naive or quiescent phenotype, and reciprocally a reduction with exhaustion gene signatures, particularly at D21 (Fig. 4c,d). A similar pattern was observed in the corresponding peripherally-derived dataset (cluster C2), suggesting that enhanced quiescence retention during E→M transition might contribute to increased memory differentiation in Nrp1–/– CD8+ TEFF cells (Fig. 4e). Furthermore, effector-, exhaustion- and memory-associated gene signatures were enriched in Nrp1–/– pMel-T cells recovered on D63 (C4), indicative of enhanced recall activity and memory cell generation in the absence of NRP1 (Fig. 4f).
Figure 4: Impact of NRP1 on the transcriptome of antigen-specific CD8+ T cells in vivo.

Bulk population RNA sequencing (bpRNAseq) was performed on donor-derived Nrp1+/+ (CD45.2+Thy1.1+Thy1.2+) and Nrp1–/– (CD45.2+Thy1.2+) pMel-T cells, sorted on D12, D21, D35 of primary phase, as well as D21 post re-challenge (D63) from tumor (D12 and D21 only), DLN and NdLN, respectively. A total of 34 datasets were generated and grouped into 5 clusters (1 tumor-derived and 4 periphery-derived), by unbiased clustering (described in Methods) for subsequent analysis. Genotype comparison (Nrp1–/– vs. Nrp1+/+) was performed at pathway level using the gene set enrichment analysis (GSEA) within each cluster against the MSigDB C7.
a, Sampling scheme for Nrp1–/– and Nrp1+/+ pMel-T cells subjected to bpRNAseq.
b, (Left) tSNE Plots illustrating the segregation between tumor- and periphery-derived datasets; (Right) Sub-clusters within the periphery-derived datasets by principal component analysis (PCA). c-f Radar plots depicting the enrichment for CD8-associated phenotypes corresponding to the Nrp1–/– pMel-T cell in tumor-derived cluster (D12 and D21) and periphery-derived Cluster #2 and #4, by using the CD8-specific GSEA analysis (described in Methods);
g-i, The GSEA plots assessing the enrichment of (g) the gene signatures of “chronic TCF1–“ P14 cells (GSE83978), or that of TCF1+ P14 cells (GSE114631); (h) the targets of Id3 (GSE23568) between the peripherally-derived Nrp1–/– and Nrp1+/+ pMel-T cells; (i) the signature of CXCR5+CD8+ T cells (GSE76279) between the tumor-derived Nrp1–/– and Nrp1+/+ pMel-T cells.
Gene set enrichment analysis (GSEA) revealed that peripheral Nrp1+/+ pMel-T cells (mostly MPECs or TMEM) from D21 B16-gp100 tumor-bearing hosts exhibited substantive overlap with the gene expression profile of Tcf7-GFP– P14 cells (“chronic TCF1– cells”, GSE8397824 [NB: the gene Tcf7 encodes the protein TCF1]) from a LCMV C13 infected host (Fig. 4g), which were reportedly defective in long-term persistence following chronic infection compared to the “chronic TCF1+ cells”24. Conversely, the Nrp1–/– pMel-T cells possess a phenotype that resembles TCF1+ cells, evidenced by the association with a gene signature corresponding to Tcf7-GFP+ P14 cells from B16-gp33 tumor-bearing host (GSE11463125) (Fig. 4g). These peripheral Nrp1–/– pMel-T cells also exhibited significant enrichment for a subset of Id3-dependent genes, which were downregulated in Id3–/– pMel-T cells recovered from mice that were infected with vaccinia virus encoding the cognate antigen gp100 (gp100-VV) (GSE2356828) (Fig. 4h). Coincident with this finding, Id3 expression (measured by an Id3-gfp reporter29) was enhanced in intratumoral Nrp1–/– pMel-T cells compared with WT counterparts on D18 (Extended Data Fig. 6a,b). Within the intratumoral CD8+ T cells, Id3 expression primarily marks a subset of pTEX, rather than TCM, with TCF1 serving as the key lineage-defining transcription factor (Extended Data Fig. 6c). Moreover, this Id3-dependent gene set exhibited considerable overlap with the genes that are differentially modulated between chronic TCF1+ versus TCF1– cells in a subset of cell-cycle regulation genes (e.g. Ccnb2, Ccnb1, Nek2 and Prc1) (Supplementary Table 2). This observation not only supported an enhanced naive or quiescence trait in Nrp1–/– pMel-T cells, as determined by the previous global GSEA analysis, but also suggested that TCF1 controlled this transcription program, of which Id3 is known to be one of its key targets24,30–32, that may primarily account for the alterations observed in Nrp1–/– pMel-T cells.
In contrast, the intratumoral Nrp1–/– pMel-TEFF cells exhibited a significantly enriched signature comprised of genes upregulated in CXCR5+CD8+ T cells (GSE7627933) (Fig. 4i), a PD1-responsive subset with stem cell-like, self-renewal properties34. This was consistent with the role of TCF1 in programming CXCR5+CD8+ T cells during chronic LCMV infection34. This was also consistent with our observation that E8ICreNrp1L/L mice exhibited enhanced sensitivity to PD1 blockade-induced tumor regression and the enhanced pTEX phenotype in the Nrp1–/– TILs. The latter notion was particularly relevant considering that CXCR5 signature enrichment was more significant on D21 compared to D12 (Fig. 4i), which suggested that the upregulated CXCR5 signature was associated with a reduced exhaustion phenotype in the Nrp1–/– CD8+ TILs from late stage tumors. This was validated by increased CXCR5 protein expression on Nrp1–/– pMel-T cells recovered from D21 tumors, compared to their WT counterparts. This elevated CXCR5 expression was preferentially enriched in the Ki67– fraction, supporting the notion that a gain of “stemness” was associated with retention proliferative quiescence (Extended Data Fig. 6d). Taken together, our transcriptomic analysis strongly suggested that the absence of NRP1 drives a TCF1-dependent transcriptional program that promotes memory fate choice in MPECs under settings associated with prolonged antigen stimulation.
NRP1 inhibits c-Jun/AP-1 activation in chronically stimulated CD8+ T cells
To better determine the CD8+ T cell-intrinsic target that is directly modulated by NRP1, we sought to model chronic antigen stimulation in vitro. Naive Nrp1+/+ or Nrp1–/– CD8+ T cells activated with plate-bound anti-CD3 plus anti-CD28 for 48 hours were either rested in IL-2-containing medium (acute activation; 1°), or subjected to two- (2°) or three- rounds (3°) of re-stimulation by anti-CD3/anti-CD28-coated beads (chronic stimulation; Fig. 5a). The NRP1 ligand Semaphorin-4A is highly expressed on CD8+ T cells and thus available for NRP1 ligation in cis or trans in this assay system (Extended Data Fig. 7a)13,35. Compared to acute activation, repetitive stimulation was sufficient to drive some of the hallmarks of in vivo TEX, such as the co-expression of multiple IRs (e.g. PD1 and LAG3), and altered cytokine production (a switch from IFNγ+TNFα+ to partial IFNγ+GzmB+ producers), which were increased by the end of the 3° compared to 2° re-stimulation (Extended Data Fig. 7b,c). Surface expression of NRP1 was more robustly maintained in the chronically stimulated cells compared to the acutely activated cells, consistent with the notion that NRP1 expression requires continuous antigen stimulation, similar to many known IRs (Extended Data Fig. 7a).
Figure 5: NRP1 inhibits c-Jun/AP-1 activation in chronically stimulated CD8+ T cells.

a, Experimental scheme of in vitro chronic stimulation protocol.
b,c, (b) Representative flow cytometry plots showing the expression of TCF1, TIM3 and Ly108 in the in vitro chronically stimulated Nrp1+/+ or Nrp1–/– CD8+ T cells. (c) The percentage of TCF1+TIM3–, or Ly108+TIM3– within CD44+PD1+ gate, from Nrp1+/+ or Nrp1–/– CD8+ T cells cultured under the indicated conditions.
d, (Left) Representative flow plot depicting the gating strategy for measuring c-Jun expression. (Right) Representative histogram illustrating the expression of c-Jun by indicated subsets in the CD8+ T cells subjected to chronic stimulation.
e,f, Expression of c-Jun, quantified by genomic mean fluorescence intensity (gMFI) by flow cytometry, within the indicated subsets from (e) chronically stimulated Nrp1+/+ or Nrp1–/– CD8+ T cells (n=5 for each group), or (f) CD8+ TILs from B16-gp100 tumor implanted in the E8ICre (n=6) or E8ICreNrp1L/L (n=5) mice. Representative histograms for the genotype comparison within the indicated subsets were shown.
Error bars, mean± s.e.m; Data in a-e were aggregated from 5 independent in vitro stimulation assays and data in f were from 2 independent mice cohorts. Statistical significance was determined by two-tailed unpaired Student’s t test (c) or two-way ANOVA (e and f) with correction for multiple comparisons. All p values were indicated.
Although there was no significant difference in the overall multi-IR or cytokine expression between genotypes at any time point with chronically-stimulated cells, loss of Nrp1 resulted in an increase in the percentage TCF1+TIM3– pTEX-like cells, as well as an increase in the percentage of Ly108+TIM3– cells (Ly108, encoded by Slamf6, is considered a reliable surface marker for TCF1+ cells24). This was rapidly replaced by the TCF1–TIM3+ tTEX-like phenotype within Nrp1+/+ pMel-T cells (Fig. 5b,c). Retention of TCF1 and Ly108 expression in Nrp1–/– cells was more prominent under 2° than 3° re-stimulation, suggesting that NRP1 acts as one of the early regulators that promotes TCF1 loss in chronically activated CD8+ T cells.
It is known that signaling downstream of the T cell receptor (TCR) and co-stimulation is dampened in T cells subjected to prolonged antigen stimulation, resulting in an inadequate pairing between Nuclear factor of activated T-cells (NFAT) and the canonical AP-1 family transcription factor (c-Jun/c-Fos heterodimer), thereby driving a gene transcription program that promotes T cell dysfunction36,37. Thus, we next assessed NFAT1 nuclear translocation and induction of c-Jun, a key member of the AP-1 family, in response to TCR re-stimulation. NFAT1 translocated to the nucleus in ~20% of both Nrp1+/+ and Nrp1–/– pMel-T cells that were chronically-stimulated compared to 80% of naive CD8+ T cells (Supplementary Fig 7d,e). The transcriptional activation of c-Jun, an event that requires concerted signaling through the TCR in conjunction with co-stimulation38, was also reduced in the chronically-stimulated cells, the extent of which correlated with the progression from the Ly108+TIM3– to the Ly108–TIM3+ stage (Fig. 5d). Therefore, the three subsets of chronically stimulated cells, stratified by Ly108 (surface surrogate for TCF1 expression) and TIM3 expression, were not only phenotypically distinct but also associated with progressive signaling impairment. Interestingly, c-Jun activation was significantly increased in chronically-stimulated Nrp1–/– pMel-T cells, in particular for the Ly108+TIM3– and Ly108+TIM3+ cell subsets (Fig. 5e). These data suggested that NRP1 may directly modulate the pairing between NFAT and AP-1 by downmodulating c-Jun.
Prompted by this observation, we asked whether NRP1 also modulates c-Jun induction in tumor-infiltrating CD8+ T cells upon re-stimulation. Indeed, c-Jun activation in the CD8+CD44+PD1+ Nrp1+/+ TILs was only preserved in the Ly108+TIM3– subset, progressively declined as cells differentiate through the Ly108+TIM3+ and Ly108–TIM3+ subsets, whereas their peripheral CD8+CD44+PD1+ T cells counterparts (predominantly Ly108+TIM3–) uniformly upregulated c-Jun upon TCR re-stimulation (Extended Data Fig. 7f). This suggested that decreased c-Jun activation also correlated with the progression towards exhaustion in vivo. In contrast, the Nrp1–/– CD8+CD44+PD1+ TILs showed improved c-Jun activation upon re-stimulation, in particular at the Ly108+TIM3+ and Ly108–TIM3+ stages (Fig. 5f). Taken together, these data suggest that NRP1 suppresses the activation of c-Jun, a mechanism known to counteract the T cell exhaustion transcriptional program39, thereby promoting progression to terminal exhaustion in chronically-stimulated CD8+ T cells.
Elevated NRP1+ TEM in cancer patients is associated with poor survival and decreased response to ICB therapy
Lastly, we interrogated the clinical relevance of NRP1 expression and its modulation of CD8+ memory T cell differentiation in cancer patients. We assessed a cohort of peripheral blood lymphocyte (PBL) samples from treatment-naive patients with HNSCC, consisting of 25 early stage disease (T1, T2 and/or N0) and 25 advanced disease cases (T3, T4 and/or N1, N2B, N2C) (Cohort A, Supplementary Table 3). Increased surface NRP1 expression was significantly associated with advanced disease, which was observed in both the CD8+ effector memory (TEM) and terminally differentiated effector (TEMRA) subsets (Fig. 6a–c). Consistent with the NRP1 expression pattern observed on the TILs from the B16 mouse model, NRP1 expression correlated with PD1 expression on CD8+ T cells in patients with HNSCC along with enhanced expression of other IRs, raising the possibility that this also correlated with exhaustion (Fig. 6d). NRP1 expression on CD8+ TEM, but not TEMRA, was enhanced in patients with advanced disease and correlated with disease recurrence and decreased overall survival (Fig. 6e, f), suggesting that the NRP1 expression on CD8+ TEM may be a predictor for poor prognosis. Importantly, NRP1 may also play a role in limiting the peripheral TMEM pool in the HNSCC patients, indicated by the inverse correlation between NRP1 expression and the size of the memory CD8+ T cell compartment in the periphery (Fig. 6g). Consistent with this notion, patients with advanced, progressive HNSCC and elevated NRP1 expression on their TEM cells exhibited an even greater reduction in peripheral TEM percentage within CD8+ T cells (Fig. 6h).
Figure 6: Elevated NRP1+ TEM in cancer patients is associated with poor survival and decreased response to ICB therapy.

a-h, CD8+ T cell subsets were analyzed on banked peripheral blood leukocytes (PBL) of healthy donors (n=10), and patients with advanced HNSCC (n=48; Cohort A, Supplementary Table 3).
a, Gating scheme of CD8 subsets (naive, TEM, TEMRA) in human peripheral blood (PB). (TEM: effector memory T cells; TEMRA: effector memory RA T cells)
b, Representative flow cytometry plots for surface NRP1 and PD1 expression on CD8+ TEM and TEMRA.
c, Bar graphs tabulating the percentage of surface NRP1+ cells within PBL-derived CD8+ TEM or TEMRA of healthy donors (n=10) and the HNSCC patients stratified by disease stage (early, n=23 vs. advanced, n=25). Bar represented mean value.
d, SPICE plots depicting co-expression of surface NRP1 with other IRs (PD1, LAG3, CD39 and TIGIT) by PBL CD8+ T cells from the advanced patient cohort.
e, Bar graphs tabulating the percentage of surface NRP1+ cells within PBL-derived CD8+ TEM or TEMRA, stratified by recurrence (stable disease vs. progressive disease). SD: stable disease (n=16); PD: progressive disease (n=9). Bar represented mean value.
f, Survival curve stratified by high or low (threshold indicated) surface NRP1 expression (by percentage of NRP1+ cells) on CD8 TEM and TEMRA, respectively.
g, Correlation between percentage of TEM within CD8+ T cells and their surface NRP1 expression across all the HNSCC patients (n=48).
h, The percentage of TEM within CD8+ T cells in subgroups of advanced patients stratified by disease recurrence (SD, n=16; PD, n=9).
i-m, PBL were isolated from patients with advanced skin cancers both before (pre) or after (post) the start of ICB therapies (n=40; Cohort B, Supplementary Table 4). Patients were stratified by responsiveness to treatment (responder (RESP) vs. progressor (PROG)).
i, Surface NRP1 expression on CD8+ TEM (left) and percentage of TEM within PBL CD8+ T cells (right).
j, Correlation between percentage of TEM in CD8+ T cells and TEM-NRP1 expression, both from post-ICB measures, stratified by response.
k, l, Within CD8+ TEMRA subset, (k) the percentage of cells expressing NRP1 (left) and TCF1(right); and (l) the correlation between post-ICB TCF1 vs. surface NRP1 expression, stratified by response;
Error bars, mean± s.e.m; Statistical significance was determined by one-way ANOVA (c), two-tailed unpaired Student’s t test (e, h), Wilcoxon test for (i, k), and the log-rank test (f); Pearson correlation analysis for (g, j, l). Coefficient r was calculated, and t-test was performed to assess linear association (All p values were indicated).
The impact of CD8+ T cell expression of NRP1 on cancer patient response to ICB immunotherapy was interrogated in a second cohort (Cohort B, Supplementary Table 4) of 40 patients with advanced skin cancers who received single agent anti-PD1 or combinatorial ICB therapies ([i] anti-PD1 alone; [ii] anti-PD1+anti-CTLA4; [iii] anti-PD1+anti-LAG3). PBL taken before and after 12-weeks of therapy was collected from 20 ICB responders and 20 ICB progressors, stratified based on RECIST 1.1 criteria. The significant increase in surface NRP1 expression on CD8+ TEM post-ICB therapy was only observed in patients with tumors that progressed, although their baseline NRP1 expression before treatment was comparable (Fig. 6i). By contrast, the TEM pool was significantly reduced in the ICB progressors post-treatment (Fig. 6i), which inversely correlated with their surface NRP1 expression (Fig. 6j), suggesting the inability to maintain a sizable TEM pool may be associated with an unfavorable response to ICB therapy. While these observations aligned with the synergy observed between NRP1 deficiency and anti-PD1 treatment in mouse models (Fig. 1g–i), they further suggested that high NRP1 expression by TEM may contribute to acquired resistance to ICB immunotherapy. Of note, a reduction in TCF1 expression by CD8+ TEMRA was also significantly associated with ICB therapy resistance (Fig. 6k), in line with recent reports suggesting that intratumoral TCF1+CD8+ T cells are preferentially targeted for reinvigoration and correlate with better survival40. In addition, a trend towards an inverse correlation between expression of TCF1 and NRP1 by CD8 TEMRA was found in the tumor progressors, which was consistent with the notion that NRP1 promotes terminal exhaustion by negatively modulating TCF1 (Fig. 6l). Taken together, these data suggest that NRP1 was highly expressed on the human TEX in patients with cancer and negatively associated with the size of the memory T cell pool, disease prognosis and responsiveness to ICB therapy.
Discussion
In summary, our findings highlight NRP1 as a previously uncharacterized immune checkpoint that impacts the development and function of intratumoral CD8+ T cells in a cell-intrinsic manner and selectively impacts the generation of memory precursors during an anti-tumor immune response. This may distinguish NRP1 from other IRs, such as PD1, CTLA4 and LAG3, that primarily impact effector T cell development and function. Although loss of NRP1 did not enhance the anti-tumor response to a primary tumor, it had a substantive impact on the development of T cell memory to subsequent tumor challenge. Nevertheless, CD8+ T cell-restricted NRP1 deletion in combination with ICB therapy did result in enhanced tumor clearance suggesting that targeting NRP1 may serve to enhance priming of the anti-tumor immune response in conjunction with ICB.
Mechanistically, NRP1 may impact memory T cell development in three ways. First, NRP1 expression correlates with Bcl2 loss, leading to substantive restraint on the frequency of anti-tumor CD8+ T cells over time, suggesting that NRP1 contributes to antigen-dependent maintenance of CD8+ T cell exhaustion and impaired memory differentiation41. Second, the absence of NRP1 sustains a TCF1+ pTEX subset that originates from phenotypically-defined MPECs (CD127hiKLRG1lo) but are transcriptionally and epigenetically distinct from conventional memory precursors42. While intratumoral TCF1+ pTEX exhibit enhanced in vivo persistence, it is unclear whether they are capable of converting to bona fide memory T cells in vivo. Our data support this notion as E8ICreNrp1L/L mice exhibit enhanced protection from secondary tumor challenge, which was associated with an enlarged peripheral TCM cell pool following primary tumor resection on D12. Future lineage-tracing or in situ labeling approaches specifically targeting pTEX would help to definitively address this model. Finally, the increased proliferation observed in the presence of NRP1 may serve as a mechanism to compensate for exhaustion-driven CD8+ T cell dysfunction but at the expense of memory differentiation, which requires proliferative quiescence (slower turnover) while gaining stem-cell like properties (self-renewal and multipotency)43,44. Given the heterogeneity observed within TEX, NRP1 may identify a TEX subset that exhibits inflexibility in terms of potential for memory differentiation and reinvigoration following ICB. The apparent impact of NRP1 on CD8+ T cells in patients with advanced cancer patients is consistent with our mouse models of cancer wherein increased NRP1 expression correlated with a reduced TEM pool and decreased patient survival. Our findings identify NRP1 as a novel immune checkpoint that impacts the development of T cell memory to tumor antigens, suggesting that combinatorial blockade of PD1 and NRP1 may lead to more durable, systemic anti-tumor immunity and long-term remission in cancer patients.
METHODS
Cell Lines and Reagents
The B16.F10 melanoma cells (referred to as B16) were obtained from M.J. Turk (Dartmouth College, New Hampshire), the B16-gp100 cells from A.L. Rakhmilevich (University of Wisconsin, Madison, Wisconsin) and the B16-OVA cells from Greg Delgoffe (University of Pittsburgh). The MC38 colon adenocarcinoma cells were obtained from J.P. Allison (M.D. Anderson Cancer Center, Texas). Tumor cell lines were cultured in RPMI1640 (for B16, B16-gp100 and B16-OVA) or Dulbecco’s modified Eagle’s medium (DMEM, for MC38) supplemented with 10% FBS, 100 units/ml penicillin, 100 μg/ml streptomycin, 2 mM glutamine, 1 mM pyruvate, 5 mM HEPES, 100 μM non-essential amino acids and 2-ME). The B16-gp100 and B16-OVA cells were cultured in the presence of 0.8mg/ml geneticin (ThermoFisher Scientific). All cell lines and assay cultures were maintained at 37°C and 5% CO2.
Human patients and specimen processing
Patients were seen in the Department of Otolaryngology at University of Pittsburgh Medical Center (UPMC) (Cohort A), and the Department of Oncology at the Sidney Kimmel Comprehensive Cancer Center (SKCCC) and Bloomberg-Kimmel Institute for Cancer Immunotherapy at Johns Hopkins University School of Medicine (Cohort B). Cohort A consisted of a cohort of banked PBL samples from HNSCC patients with both early stage (n=23) and advanced (n=25) disease for correlation with disease progression and survival. Cohort B from SKCCC consisted of banked PBL samples thawed from patients with advanced skin cancers that were ICB therapy responders (CR or PR) (n=20), or progressors (PD) (n=20).
Patients diagnosed with head and neck squamous cell carcinoma (HNSCC) electing to undergo treatment were offered the option to participate in the University of Pittsburgh Cancer Institute (UPCI) protocol for research. Patients signed an informed consent that was approved by the Institutional Review Board (IRB) of the University of Pittsburgh.
Blood samples were obtained from patients at time of surgery or at time of clinic visit. Whole blood was centrifuged, and serum/plasm was immediately aliquoted in 5×1 ml amount into sterile cryovials. Peripheral blood mononuclear cells (PBMCs) are then separated via Ficoll Paque Plus (GE Healthcare). Viable PBMCs were frozen in FBS with 10% DMSO and stored in liquid nitrogen. Once patient sample cohort identified, cells were thawed and stained with designated antibodies followed by flow cytometric analysis.
Mice
The E8ICre mice were obtained from I. Taniuchi (Rikagaku Kenkyūsho, Japan). The Nrp1L/L mice were obtained from D. Cheresh (UC San Diego). The Id3-GFP reporter mice (Id3tm2.1Cmu, MGI: 5305600) were obtained from L. D’Cruz (University of Pittsburgh). pMel-1 mice (B6.Cg-Thy1a/Cy Tg(TcraTcrb)8Rest/J, stock No: 005023) and CD45.1 mice (B6.SJL-Ptprca Pepcb/BoyJ, stock No: 002014) were purchased from the Jackson Laboratory and bred in house. The E8ICreErt2GFP and Rosa26LSL.mAetrine.2A.Nrp1 mice were generated in house. To generate E8IiCreERT2.GFP transgenic mice, the plasmid used to generate the E8ICre.GFP mouse (kindly provided by I. Taniuchi)45 was altered by removing the Cre and inserting iCreERT2. To generate the Rosa26LSL.mAetrine.2A.Nrp1 mice, the Rosa26.LSL.mAmet−2A-Nrp1 targeting construct was made using Rosa26 plasmids, pROSA26-PA (Addgene #21271) and pBigT (Addgene #21270)46, and mAmetrine-2A-Neuropilin1 inserted in the ATG start codon within the Rosa26 locus downstream of the lox-stop-lox cassette. The linearized targeting construct was electroporated into JM8A3.N1 embryonic stem cells and neomycin resistant clones were screened by Southern blot analysis using EcoRV and MscI digestions for the 5’ and 3’ ends, respectively. Clones that were correctly targeted and greater than 85% normal diploid by karyotype analysis were injected into C57BL/6J blastocysts. Chimeric mice were mated to C57BL/6J mice and transmission of the targeted allele verified by PCR.
To generate E8IiCreERT2.GFP transgenic mice, the plasmid used to generate the E8ICre.GFP mouse (kindly provided by I. Taniuchi)45 was altered by removing the Cre and inserting iCreERT2. To generate the Rosa26LSL.mAetrine.2A.Nrp1 mice, the Rosa26.LSL.mAmet−2A-Nrp1 targeting construct was made using Rosa26 plasmids, pROSA26-PA (Addgene #21271) and pBigT (Addgene #21270)46, and mAmetrine-2A-Neuropilin1 inserted in the ATG start codon within the Rosa26 locus downstream of the lox-stop-lox cassette. The linearized targeting construct was electroporated into JM8A3.N1 embryonic stem cells and neomycin resistant clones were screened by Southern blot analysis using EcoRV and MscI digestions for the 5’ and 3’ ends, respectively. Clones that were correctly targeted and greater than 85% normal diploid by karyotype analysis were injected into C57BL/6J blastocysts. Chimeric mice were mated to C57BL/6J mice and transmission of the targeted allele verified by PCR.
All animal experiments were performed in the American Association for the Accreditation of Laboratory Animal Care-accredited, specific-pathogen-free facilities (temperatures of 65–75°F (~18–23°C) with 40–60% humidity, 12-hour light/12-hour dark cycle) in Division of Laboratory Animal Resources, University of Pittsburgh School of Medicine (UPSOM). Female and male mice of all the strains mentioned were used, at 4–8 weeks of age. Animal protocols were approved by the Institutional Animal Care and Use Committees of University of Pittsburgh.
In vivo mouse tumor models
The E8iCre, Nrp1L/LE8iCre, E8ICreErt2GFP and E8ICreErt2GFPRosa26LSL.mAetrine.2A.Nrp1 mice were inoculated with B16 cells (1.25×10⁵, intradermally) or MC38 cells (5.0×10⁵, subcutaneously). Tumors were measured every 3 days with a digital caliper in two dimensions (width and length) and presented as tumor volume (mm3; defined as the w2 × l/2). Anti-mouse PD1 (Clone 29F.1A12) was injected (i.p.) on day 6, 9 and 12 at 100 μg/mouse. For attenuated Listeria monocytogenes (LM) infection, ActA-deficient LM was grown in tryptic soy broth (Sigma-Aldrich) supplemented with 50 μg/ml streptomycin (Sigma-Aldrich) at 37°C until OD600 = 0.1 (108 CFU/ml). 107 CFUs in 200 μl PBS were transferred intravenously into mice.
Surgical tumor excision and challenge
Surgical excision of primary tumors was performed as previously described47. Briefly, intradermal primary tumors (implanted in the right flank) were excised on day 12 post inoculation, at size of approximately 7~10 mm diameter. Mice were anesthetized with isoflurane and tumors were removed with a 2-mm perimeter of healthy skin. Incisions were closed with steel wound clips, and mice were given carprofen containing MediGel® (ClearH2O) 24 hours prior- and post-surgery for pain management. Mice with recurrent primary tumor after surgery (<5%) were removed from study. For tumor challenge, 1.25×10⁵ B16 or B16-gp100 cells were inoculated in the left flank on day 30 or day 60 post tumor resection.
pMel-T cell adoptive transfer
Bulk CD8+ T cells were purified from naive pMel-1xE8ICreThy1.1+Thy1.2+ and pMel-1xE8ICreNrp1L/LThy1.2+ mice by negative selection. Briefly, single cells suspensions from pooled spleen and lymph nodes were incubated with a cocktail containing biotinylated antibodies against CD4 (GK1.5), CD25 (PC61), CD49b (DX5), γδT (GL3), B220 (RA3–6B2), Gr1(RB6–8C5), CD19 (6D5), CD11b (M1/70), CD11c (N418), Ter119 (TER-119), IAb (KH74), CD16/32 (93), and CD105 (MJ7/18). Non-CD8 cells were removed by mixing the labeled cell suspension with the streptavidin-coated magnetic beads (Pierece) at 4°C for 20 min, followed by separation in a magnetic field. The unbound CD8+ pMel-T cells (of purify >90%) were washed in sterile Phosphate-buffered saline (PBS, 1x), with purity determined on a flow cytometer. The Nrp1+/+ and Nrp1–/– pMel-T cells were mixed at 1:1 ratio (post purity correction, 4×10⁵ in total) and injected (i.v.) into the CD45.1 recipient, followed by B16-gp100 tumor inoculation (1.25×10⁵, i.d.) within 18~24 hours post transfer.
LCMV Infection
Mice were infected with 2×10⁵ PFU of LCMV Armstrong (i.p.) or 4×10⁶ PFU of Clone 13 (i.v.) at 8 weeks of age. Lymph nodes and spleens were taken at day 8 p.i. for Armstrong, and at day 30 p.i. for Clone 13 and processed for flow cytometry.
Flow cytometry and image flow cytometry
Single-cell suspensions were prepared from mouse spleens or tumors as previously described. Briefly, tumor-infiltrating leukocytes (TILs) were isolated by digesting B16 or MC38 tumors with Collagenase IV (1mg/ml) at 37°C for 30 minutes. After red blood cell lysis, live/dead cell discrimination was performed using Live/Dead Fixable Aqua Dead Cell Stain Kit (Life Technologies). Fc block was performed by staining with anti-CD16/32 to avoid non-specific binding. Surface staining was performed at 4°C for 30 minutes in FACS staining buffer (1x PBS/5% FBS/ 0.5% sodium azide) containing designated antibody cocktails. For transcription factor (Ki67, TCF1) and intracellular proteins (Bcl2, cleaved Caspase 3) staining, cells were fixed and permeabilized using with Foxp3 Transcription Factor Buffer Set (Cat. 00–5523, Life Technologies), following the manufacturer’s instructions. To detect the cytokine-producing cells, cells were stimulated with PMA (100 ng/ml) and Ionomycin (500 ng/ml) for 5 hours in the presence of Monensin (Cat. 00-4505-51, Life Technologies) prior to cell surface staining, followed by standard intracellular staining procedure as above. All flow cytometry data were acquired on a BD LSR Fortessa analyzer (BD Biosciences) and analyzed by FlowJo software (Ver 10.5.3, Treestar, Inc.). For NFAT1 imaging cytometry, cells were fixed with 1.5% PFA for 10 min at room temperature and permeabilized in FACS staining buffer containing 0.1% Triton X-100. Cells were then stained in staining buffer with anti-NFAT1 (NFAT1 (D43B1) XP®, rabbit mAb #5861, Cell Signaling Technology) for 45 minutes, washed and followed by staining with an Alexa Fluor 647-conjugated anti-rabbit secondary antibody (Goat anti-Rabbit IgG (H+L) secondary Ab, Alexa Fluor Plus 647, ThermoFisher Scientific) for 30 minutes, and nuclei were stained with DAPI. Data were collected on an Amnis ImageStream × Mark II Imaging Flow Cytometer and analyzed with IDEAS software (EMD Millipore).
BrdU (5-Bromo-2’-deoxy-Uridine) incorporation
To evaluate cell proliferation in vivo, mice implanted with B16.F10 tumors were injected with 2 mg BrdU 12 hours prior to analysis. Tumors and lymph nodes were harvested, processed to yield single-cell suspension. Cells were stained with surface markers and Ki67 as described above, and then fixed and permeabilized with Cytofix/Cytoperm (BD Biosciences) and permeabilization buffer, respectively. After DNase I treatment at 37 °C for 45 minutes, cells were stained with APC anti-BrdU for 45 minutes before analyzing on a flow cytometer.
Tamoxifen treatment
Tamoxifen working solution (10 mg/ml) was prepared by dissolving the tamoxifen in the 5% ethanol-sunflower seed oil (v/v) by shaking overnight at 37°C and stored at −20 °C, light protected. Mice were given 1.5 mg Tamoxifen solution (approximately 75 mg/kg body weight) by intraperitoneal injection daily for 5 consecutive days, prior to tumor implantation.
Bulk population RNA sequencing
Bulk population RNA sequencing on adoptively transferred pMel-T cells was performed following a protocol developed in lab based on the Smart-Seq2 technology48. Briefly, Nrp1+/+ (CD45.2+Thy1.1+Thy1.2+) or Nrp1–/– (CD45.2+Thy1.2+) pMel-T cells were recovered from tumor, as well as the matched draining and non-draining lymph nodes of the CD45.1 recipient at the designated day(s) post B16-gp100 tumor challenge. Five hundred cells from either genotype were double-sorted (purity> 99.5%) directly to individual well of a 96-well plate containing 2 μl lysis buffer (0.2% Triton X-100 with RNase inhibitor at 2 U/μl). The plate was spun down at 2000g for 2 minutes and immediately proceeded with reverse transcription (RT). A mixture (2 μl) of RT primers and dNTP (1 mM) was added to each well followed by incubation at 70 °C for 3 minutes. Denatured templates and RT primers were quickly spun down and added with 6 μl RT master mix containing MgCl2 (9mM), first-strand buffer (5x), Superscript II reverse transcriptase (10 U/μl), DTT (5 mM), Betaine (1M), RNase inhibitors (1 U/μl) and TSO (template switch oligo) (1 μM) followed by the RT reaction on a PCR cycler (42 °C for 90 min, 10 cycles of 50°C/42°C and 70°C for 15 min, hold at 4°C). An addition of 15 cycle cDNA amplification was performed following cDNA synthesis by the KAPA Hot Start II High-Fidelity DNA Polymerase. The amplified cDNA was purified using Ampure XP beads (@ 0.6:1 bead to cDNA ratio) and eluted with 17.5 μl elution buffer. cDNA size (peak at 1.5~2kb) was verified with TapeStation5000 and quantified by the Qbit.
Sequencing libraries were prepared from 1ng cDNA using the Nextera XT DNA Library Prep kit (Illumina FC-131–1096), following the manufacture’s instruction. cDNA Libraries were quantified by the KAPA library quantification kit (KAPA KK4854) and size (peak at ~ 400bp) verified on TapeStation1000. Ten diluted libraries (2nM) were pooled and sequenced with the NextSeq 500/550 High Output v2 kit using 75bp single read.
In vitro T cell culture
Bulk CD8+ T cells were purified by negative selection from spleen and lymph nodes of naive mice (purity above 95%). They were initially plated at 1×10⁶/well in a 24-well plate, in the presence of plated-coated anti-CD3 (1 μg/ml) and anti-CD28 (2 μg/ml) and cultured in RPMI1640 medium supplemented with hIL2 (25U/ml) and 10% heat-inactivated FBS. For the “chronical stimulation” scheme, cells were washed off the original plate 48 hours after the first activation, counted and re-plated at 1×10⁵/well in U-bottom 96-well plate, with 200 ul fresh RPMI containing latex bead-coated anti-CD3 (3 μg/ml) and anti-CD28 (5 μg/ml), at 1:2.5 cell to beads ratio. This was followed by a second, third round stimulations every 2 days with fresh batches of CD3/CD28 beads. In each stimulation step, cells in each well were split in half by moving to a new well, with the amount of beads used and the number of viable cells activated being kept proportionally equal. As a control group, cells subjected to initial 48-hour activation but without re-stimulation were rested in IL-2 containing medium for the same duration before analysis.
Transcriptomic (RNA sequencing) analysis
RNA sequencing reads were aligned to GRCm38/mm10 build of Mus musculus genome using STAR-2.5.2a. The Unique mapped reads were normalized using PORT (https://github.com/itmat/normalization/wiki) and counts were converted to log2 counts per million, quantile normalized and precision weighted with the ‘voom’ function of the limma package49,50. A linear model was fitted to each gene, and empirical Bayes moderated t-statistics were used to assess differences in expression51. Heatmaps were created using R (3.5.1) package pheatmap_1.0.12 and plots for PCA were created using ggplot 2_3.1.0. P values from Bayes moderated t tests were adjusted to control the global false discovery rate (FDR). Genes were called differentially expressed if they achieved an FDR of 0.05 or less.
Gene Ontology (GO) analysis and Gene Set Tests
Cluster-specific, significantly enriched biological processes (GO terms) were analyzed with QIAGEN’s Ingenuity Pathway Analysis (IPA, QIAGEN Redwood City, www.qiagen.com/ingenuity). Gene set enrichment analysis (GSEA)52,53 was performed against MSigDB (v5.1) C7 database from which ID3 ko signature (GSE23568) was identified as one of the enriched signatures.
Gene signatures were generated for CXCR5 Pos (GSE76279) by identifying differentially expressed genes between CXCR5 positive versus CXCR5 negative groups from published dataset33. For CD8-specific gene signature comparison, GSEA were run against collected datasets corresponding to traits of naive, effector, memory and exhaustion, as previously describe in the LCMV infection model54. The Normalized enrichment scores from GSEA for the LCMV genes signatures were plotted as a radar plot using R (3.5.1) package fmsb_0.6.3.
Statistical analysis
Statistics were performed using Graphpad v8.0.2. The Mantel-Cox log-rank test was used for comparisons in survival/tumor incidence analysis shown Fig. 1e,f,i; Fig. 6f and Extended Data Fig. 4e. Two-way ANOVA was used for comparing tumor growth curves, as in Fig. 1h, Extended Data Fig. 3e–h, 4e, and time course data as in Fig. 2f–h; Fig. 3e; Fig. 5e–f; Extended Data Fig. 5g. One-way ANOVA was used for the comparison among multiple (>2) groups, as in Fig. 1a; two-tailed unparied Student’s t test was used for comparison between two groups (genotypes, patient subgroups, or treatment), as in Fig. 2a, b, d; Fig. 5c, Fig. 6e,f; Extended Data Fig. 1b, 3d, 4a–d, g,i; whereas paired Student’s t test was specifically used for comparing two genotypes under the co-adoptive transfer setting, such as in Fig.3b–d, f; Extended Data Fig. 5d,e; 6b,d. Wilcoxon test was used for Fig. 6i,k.
Reporting Summary.
Further information on research design is available in the Life Sciences Reporting Summary linked to this article.
Extended Data
Extended Data Fig. 1. Characterization of NRP1 expression on CD8+ T cells in vivo.

a, Gating strategy and phenotyping markers used for the identification of CD8+ cell subsets under conditions of homeostatic (naive mice), or sites of immunological challenge (LCMV infection or B16 tumor). b, Expression of NRP1 measured by flow cytometry in subsets of CD8ab+ T cells from spleens of mice infected by acute LCMV (Armstrong, D8 p.i, n=7) or chronic LCMV (Clone 13, D30 p.i., n=7). Bar graph tabulating the mean percentage of NRP1+ cells of indicated subsets and symbols represented individual mouse, 2 independent cohorts pooled. Error bars, mean±s.e.m; two-tailed unpaired Student’s t test. c, Representative flow cytometry plots depicting the co-expression of NRP1 and PD1 within naive (spleen-derived) and TEFF CD8+ cells (spleen or intratumoral) from unchallenged or B16-tumor bearing mice. d, Histograms depicting the correlation of NRP1 expressed by intratumoral CD8+ T cells with known markers of activation (CD44, CD69, CD25), cell proliferation (BrdU), naive/memory (CD62L, CD127) and senescence (KLRG1) phenotypes.
Extended Data Fig. 2. Genetic models for the “loss- or gain-of function” manipulations of Nrp1 transcription restrictively in CD8+ T cells.

a, b “Loss-of-function” model: Validation for the CD8-restricted Nrp1 deletion in the E8ICreNrp1L/L mice. (a) Representative histograms for NRP1 staining on CD4+ (green) and CD8+ (blue) tumor-infiltrating lymphocytes (TILs) of B16 tumors (D12). (b), Surface NRP1 expression on major immune cell populations derived from naive spleen (upper) or 1° B16 TILs (lower, D15 post implantation) of E8ICre or E8ICreNrp1L/L mice (n=5 for each group). Loss of NRP1 protein restrictively by CD8+ cells in the E8ICreNrp1L/L mice was highlighted; c, “Gain-of-function” model: (Upper) Schematic structure of the Rosa26LSL.mAmet.2A.Nrp1 targeting construct. (Lower) Tamoxifen-induced, CD8-specific (marked by GFP reporter) “constitutive” NPR1 expression (surface NRP1 staining) driven by Rosa26 promoter (marked by Ametrine reporter), in CD8+ T cells from peripheral blood (PB) of naïve mice or 1° B16 TILs. Gated on CD8+GFP+ cells.
Extended Data Fig. 3. CD8-expressing NRP1 is dispensable for controlling the growth of primary tumors.

a-e, B16 tumors implanted in the E8ICre or E8ICreNrp1L/L mice were harvested on D15, and the composition of major immune cell populations were analyzed by flow cytometry. (a) bh-SNE depiction of intratumoral CD45+ cells (80,233 in total, pooled from E8ICre and E8ICreNrp1L/L mice), projected by cell source. (b) Phenograph depiction of intratumoral CD45+ cells as in (a), and different cell lineages (colored) were identified by the expression of lineage-specific markers. (c) Percentage of major immune cell populations (indicated) within CD45+ TILs. (d) Numeration of CD45+ cells, presented by counts per gram tumor mass; Error bars, mean±s.e.m; Symbol represented individual mouse (n=5 for each genotype). (e-h) Growth curves for (e) 1° B16 tumor; (f) B16-OVA tumor (Vaccination with attenuated Listeria monocytogenes expressing Ova peptide (LM-Ova) was given on Day 4) (g) 2° B16 tumor in the E8ICre and E8ICreNrp1L/L mice, challenged on Day 30 (left) or 60 (right); (h) 1° and 2° B16 tumors (+30d re-challenge) implanted in the E8ICreErt2gfpRosa26LSL.Nrp1 and E8ICreErt2gfp mice. Data were representative of 2 independent experiments (e, f); or pooled from 4 independent experiments (g, h). Error bars, mean±s.e.m; Statistical significance was determined by two-tailed unpaired Student’s t test (d) or two-way ANOVA with correction for multiple comparisons (e-h).
Extended Data Fig. 4. NRP1 modulates the memory differentiation of tumor-primed effector CD8+ T cells but not effector polyfunctionality.

a-d, CD8+ T cells from primary B16-gp100 tumors and matched spleens were analyzed on D12 (n=8 per genotype). (a) Numeration of total Db-gp100+ cells, as well as their subsets (TCM, TEFF, MPECs, SLECs) within intratumoral CD8+ T cells; (b) Ratio between intratumoral Db-gp100+CD8+ MPECs and SLECs; (c-d) Representative flow cytometry plots (c, left) and quantification for the frequencies of Db-gp100+ CD8+ T cells (c, right) and (d) Db-gp100+ TCM in CD8+ T cells from spleen; e, The incidence (left) and growth (right) of 2° B16-gp100 tumor (+30d rechallenge). f, Representative flow plots for the expression of IRs on CD8+ TILs of 1° B16 tumors on D12 (left) and SPICE plots (right) visualization for co-expression of multiple IRs. g, Numeration of 5-IR-co-expressing cells (5-IR+) on D12 (n=5), by frequency within CD8+ TILs (left) and absolute number per gram tumor mass (right). Data were representative from 2 independent cohorts. h-i Expression of cytokines (IFN-γ against GzmB, TNF-α and IL2, respectively) by the CD8+ TILs on D18 of 1° tumor. SPICE plots visualization for the multi-cytokine producing cells. i, Percentage of single, dual, or multi-cytokine producing cells within the CD8+ TILs as shown in h, n=6 per genotype. Error bars, mean±s.e.m; Statistical significance was determined by two-tailed unpaired Student’s t test (a-d, g,i) or log-rank test (e, left) or two-way ANOVA with correction for multiple comparisons (e, right).
Extended Data Fig. 5. NRP1 cell-intrinsically limits the in vivo persistence of antigen-specific CD8+ T cells.

a, The level of Db-gp100+ transgenic TCR, activation status (CD44 vs. CD62L); and the ratio within donor pool (CD45.2+, recovered from spleen) of Nrp1–/– and Nrp1+/+ pMel-T cells 12 hour after adoptive transfer, prior to B16-gp100 tumor inoculation (D0). b, Correlation between ratio of intratumoral Nrp1–/– vs. Nrp1+/+ donor pMel-T cells with tumor volume (mm3). c, Kinetics of tumor density (counts/mm3 tumor size) of intratumoral Nrp1–/– and Nrp1+/+ pMel-T cells during 1° B16-gp100 growth. (n=5 for each time point) d, e Frequencies of Nrp1–/– and Nrp1+/+ pMel-T cells within the CD45.2+ donor pool in spleen and peripheral blood (PB) during (d) primary phase and (e) recall phase at the indicated time points (n=5 for each time point). f, Representative flow cytometry plots for NRP1 expression on pMel-T cells of naïve, effector, MPECs, and TCM phenotypes, respectively. g, Frequencies of Nrp1+/+ or Nrp1–/– donor-derived cells of CD27+CD62L– (MPECs enriched) or CD27+CD62L+ (TCM) phenotype within CD45.2+ compartment over time, recovered from draining lymph nodes (DLN) and spleen from D12 to D42, n=5 for each time point. h-i, Representative flow cytometry plots depicting the expression of Bcl2 against Ki67 with NRP1+ vs. NRP1– fractions (f) or Bcl2 vs. IRF4 in Nrp1+/+ or Nrp1–/– pMel-T cells (g) recovered from NdLN, on D12 and D21 post 1° B16-gp100 inoculation. Data in c, d, e and g were pooled from 2 independent time course cohorts. Error bars, mean±s.e.m; Statistical significance was determined by two-tailed paired Student’s t test (d, e) or two-way ANOVA (g), ****p<0.0001.
Extended Data Fig. 6. Loss of NRP1 upregulated Id3 and CXCR5 expression on pTEX infiltrating primary B16-gp100 tumors.
The E8ICreNrp1L/L and E8ICre strains on pMel-1 background were further crossed with an Id3-GFP reporter mouse strain, resulting in one mutant allele carrying the modified Id3 locus with insertion of sequence encoding GFP into the ATG initiation codon (Id3gfp/+). a. Scheme for pMel-T cell adoptive transfer. Briefly, congenically-mismatched bulk CD8+ T cells were purified from the following 3 groups of naïve mice (pMel-1xE8ICrexId3+/+(CD45.2+Thy1.1+), pMel-1xE8ICrexId3gfp/+ (CD45.2+Thy1.1+Thy1.2+) and pMel-1xE8ICreNrp1L/LxId3gfp/+ (CD45.2+Thy1.2+)), co-transferred at 1:1:1 ratio into CD45.1 recipients, followed by B16-gp100 tumor implantation one day later. Tumor-infiltrating CD8+ T cells were analyzed on D12 or D18 post tumor inoculation. b, Frequency of Id3-GFP+ within Nrp1+/+Id3gfp/+ and Nrp1–/–Id3gfp/+ donor cells; c, Representative flow cytometry plots (left) depicting the phenotype of intratumoral Id3-GFP+ vs. Id3-GFP– cells. Bar plot (right) tabulating the composition of Id3-GFP+ and Id3-GFP– fractions, from Nrp1+/+ or Nrp1–/–-derived donors, respectively (n=6 per group). d, Expression of CXCR5 and Ki67 on B16-gp100 tumor-infiltrating pMel-T cells, recovered on D21 post implantation. Cells shown in the representative plot were gated on Nrp1+/+ and Nrp1–/– donors by the congenic markers. Bar graphs tabulating the genomic mean fluorescence intensity (gMFI) and the percentage of CXCR5+ cells within Ki67+ and Ki67– fraction within each genotype. Data were pooled from 2 independent experiments, with 9 recipient mice per experiment in a-c, 4 replicates per group in d. Error bars, mean±s.e.m; Statistical significance was determined by two-tailed paired Student’s t test (b, d).
Extended Data Fig. 7. Phenotypical analysis of in vitro chronically stimulated CD8+ T cells.

a-c, Representative flow cytometry plot depicting the expression of (a) NRP1 and Semaphorin-4a (Sema4a), (b) IRs (PD1 and LAG3) and (c) cytokines (IFNγ, Granzyme B and TNFα) on Nrp1+/+ or Nrp1–/– CD8+ cells subjected to chronic antigen stimulation in vitro (scheme described in Fig. 5a); d-e, Visualization of nuclear trans-localization of NFAT1 by image flow cytometry in (d) naive CD8+ T cells or (e) in vitro chronically stimulated (2° re-stim) Nrp1+/+ or Nrp1–/– CD8+ cells, in response to PMA plus Ionomycin (P+I) stimulation; The representative images of co-staining between NFAT1 and nuclear probe (DAPI) in individual cells and the histogram depiction of the localization similarity score between NFAT1 and DAPI were shown. f, (Left) Representative flow plot depicting the gating strategy for measuring c-Jun activation within CD44+PD1+ CD8+ cells from B16-gp100 tumors or matched spleens; (Right) Representative histogram illustrating the expression of c-Jun by indicated cell subsets.
Supplementary Material
ACKNOWLEDGEMENTS
We wish to thank all the current and former members in the Vignali Lab (Vignali-lab.com; @Vignali_Lab) for all their constructive comments and advice during this project. The authors also wish to thank K. Adams, D. Pardoll, M. Schollenberger and S. Topalian for assistance in procuring patient biospecimens at Johns Hopkins, L. D’Cruz (Univeristy of Pittsburgh) for providing the Id3-GFP reporter mouse strain and helpful discussion, H. Shen, D. Falkner and A. McIntyre from the Immunology Flow Core for cell sorting, C. Schmidt, E. Brunazzi, and the staff of the Division of Laboratory Animals for genotyping and animal husbandry, S. Canna for the LCMV C13 strain (University of Pittsburgh), A. Lund (New York University) for the attenuated LM-Ova, W. Horne, J. Kolls and University of Pittsburgh HSCRF Genomics Research Core for assistance with sequencing. This work was supported by the National Institutes of Health (R01 CA203689 and P01 AI108545 to D.A.A.V., AI105343, AI117950, AI082630, AI112521, AI115712, AI108545, CA210944 to E.J.W, T32 CA082084 and F32 CA247004-01 to A.M.G), NCI Comprehensive Cancer Center Support CORE grant (P30 CA047904 to R.L.F. and D.A.A.V.,P30 CA097190 to R.L.F, P30 CA006973 to E.J.L), and the Stand Up 2 Cancer (SU2C) research grant to E.J.W. E.J.W. is supported by the Parker Institute for Cancer Immunotherapy which supports the cancer immunology program at UPenn. E.J.L is supported by the Bloomberg~Kimmel Institute for Cancer Immunotherapy, the Barney Family Foundation, Movingfor Melanoma of Delaware, The Laverna Hahn Charitable Trust. This project benefitted from a SPECIAL ORDER BD LSR FORTESSA™ (funded by NIH S10 OD011925-01) and an IMAGESTREAMx MARK II (funded by NIH 1S10 OD019942-01) used in the UPSOM Unified Flow Core. This project also used the Hillman Cancer Center Immunologic Monitoring and Cellular Products Laboratory that is supported in part by award P30 CA047904.
Footnotes
Competing interests
D.A.A.V declares competing financial interests and has submitted patents covering Nrp1 that are licensed or pending and is entitled to a share in net income generated from licensing of these patent rights for commercial development. D.A.A.V consults for and/or is on the scientific advisory board Tizona, Werewolf, F-Star, Astellas/Potenza, BMS, Oncorus, Innovent Bio, Kronos Bio, G1 Therapeutics. Grants: BMS, Astellas/Potenza, Tizona, TTMS; Patents licensed and Royalties: Astellas/Potenza, Tizona, BMS; Stock: TTMS, Tizona, Potenza, Oncorus, Werewolf. R.L.F consults for and/or is on the scientific advisory board for Aduro Biotech, Inc, Astra-Zeneca/MedImmune, Bristol-Myers Squibb, EMD Serono, GlaxoSmithKline, Iovance Biotherapeutics, Inc, MacroGenics, Inc., Merck, Nanobiotix, Numab Therapeutics AG, Oncorus, Inc., Ono Pharmaceutical Co. Ltd, PPD (Benitec, Immunicum), Regeneron Pharmaceuticals, Inc., TTMS and Torque Therapeutics Inc. R.L.F receives research funding from Astra-Zeneca/MedImmune, Bristol-Myers Squibb, Tesaro and TTMS. Stock: TTMS. E.J.W. has consulting agreements with and/or is on the scientific advisory board for Merck, Roche, Pieris, Elstar, and Surface Oncology. E.J.W. is a founder of Surface Oncology and Arsenal Biosciences. E.J.W. has a patent licensing agreement on the PD-1 pathway with Roche/Genentech. E.J.L consults for Array BioPharma, Bristol-Myers Squibb, EMD Serono, MacroGenics, Novartis, Merck, Regeneron and Sanofi Genzyme. E.J.L receives research funding from Bristol-Myers Squibb, Merck and Regeneron.
Data availability
Bulk RNAseq datasets of Nrp1+/+ and Nrp1–/– pMel-T cells have been deposited in the National Center for Biotechnology Information Gene Expression Omnibus (GEO) and are accessible through the GEO Series accession code GSE151494.
Code availability
Computational and mathematical codes used in the RNAseq data analyses have been described in the article. Additional information is available from corresponding author on reasonable and appropriate request.
REFERENCES
- 1.Topalian SL et al. Safety, activity, and immune correlates of anti-PD-1 antibody in cancer. N Engl J Med 366, 2443–2454 (2012). [DOI] [PMC free article] [PubMed] [Google Scholar]
- 2.Khalil DN, Smith EL, Brentjens RJ & Wolchok JD The future of cancer treatment: immunomodulation, CARs and combination immunotherapy. Nat Rev Clin Oncol 13, 273–290 (2016). [DOI] [PMC free article] [PubMed] [Google Scholar]
- 3.Reading JL et al. The function and dysfunction of memory CD8(+) T cells in tumor immunity. Immunol Rev 283, 194–212 (2018). [DOI] [PubMed] [Google Scholar]
- 4.Fares CM, Van Allen EM, Drake CG, Allison JP & Hu-Lieskovan S Mechanisms of Resistance to Immune Checkpoint Blockade: Why Does Checkpoint Inhibitor Immunotherapy Not Work for All Patients? Am Soc Clin Oncol Educ Book 39, 147–164 (2019). [DOI] [PubMed] [Google Scholar]
- 5.Wherry EJ & Kurachi M Molecular and cellular insights into T cell exhaustion. Nat Rev Immunol 15, 486–499 (2015). [DOI] [PMC free article] [PubMed] [Google Scholar]
- 6.Pauken KE et al. Epigenetic stability of exhausted T cells limits durability of reinvigoration by PD-1 blockade. Science 354, 1160–1165 (2016). [DOI] [PMC free article] [PubMed] [Google Scholar]
- 7.Sen DR et al. The epigenetic landscape of T cell exhaustion. Science 354, 1165–1169 (2016). [DOI] [PMC free article] [PubMed] [Google Scholar]
- 8.Kawasaki T et al. A requirement for neuropilin-1 in embryonic vessel formation. Development 126, 4895–4902 (1999). [DOI] [PubMed] [Google Scholar]
- 9.Kitsukawa T et al. Neuropilin-semaphorin III/D-mediated chemorepulsive signals play a crucial role in peripheral nerve projection in mice. Neuron 19, 995–1005 (1997). [DOI] [PubMed] [Google Scholar]
- 10.Gu C et al. Neuropilin-1 conveys semaphorin and VEGF signaling during neural and cardiovascular development. Dev Cell 5, 45–57 (2003). [DOI] [PMC free article] [PubMed] [Google Scholar]
- 11.Roy S et al. Multifaceted Role of Neuropilins in the Immune System: Potential Targets for Immunotherapy. Front Immunol 8, 1228 (2017). [DOI] [PMC free article] [PubMed] [Google Scholar]
- 12.Bruder D et al. Neuropilin-1: a surface marker of regulatory T cells. Eur J Immunol 34, 623–630 (2004). [DOI] [PubMed] [Google Scholar]
- 13.Delgoffe GM et al. Stability and function of regulatory T cells is maintained by a neuropilin-1-semaphorin-4a axis. Nature 501, 252–256 (2013). [DOI] [PMC free article] [PubMed] [Google Scholar]
- 14.Overacre-Delgoffe AE et al. Interferon-gamma Drives Treg Fragility to Promote Anti-tumor Immunity. Cell 169, 1130–1141 e1111 (2017). [DOI] [PMC free article] [PubMed] [Google Scholar]
- 15.Battaglia A et al. Metastatic tumour cells favour the generation of a tolerogenic milieu in tumour draining lymph node in patients with early cervical cancer. Cancer Immunol Immunother 58, 1363–1373 (2009). [DOI] [PMC free article] [PubMed] [Google Scholar]
- 16.Battaglia A et al. Neuropilin-1 expression identifies a subset of regulatory T cells in human lymph nodes that is modulated by preoperative chemoradiation therapy in cervical cancer. Immunology 123, 129–138 (2008). [DOI] [PMC free article] [PubMed] [Google Scholar]
- 17.Jackson SR, Berrien-Elliott M, Yuan J, Hsueh EC & Teague RM Neuropilin-1 expression is induced on tolerant self-reactive CD8+ T cells but is dispensable for the tolerant phenotype. PLoS One 9, e110707 (2014). [DOI] [PMC free article] [PubMed] [Google Scholar]
- 18.Fleissner D, Hansen W, Geffers R, Buer J & Westendorf AM Local induction of immunosuppressive CD8+ T cells in the gut-associated lymphoid tissues. PLoS One 5, e15373 (2010). [DOI] [PMC free article] [PubMed] [Google Scholar]
- 19.Leclerc M et al. Regulation of antitumour CD8 T-cell immunity and checkpoint blockade immunotherapy by Neuropilin-1. Nat Commun 10, 3345 (2019). [DOI] [PMC free article] [PubMed] [Google Scholar]
- 20.Kalia V, Sarkar S & Ahmed R CD8 T-cell memory differentiation during acute and chronic viral infections. Adv Exp Med Biol 684, 79–95 (2010). [DOI] [PubMed] [Google Scholar]
- 21.Bursuker I & North RJ Immunological consequences of tumor excision: from active immunity to immunological memory. Int J Cancer 37, 275–281 (1986). [DOI] [PubMed] [Google Scholar]
- 22.Zhang P, Cote AL, de Vries VC, Usherwood EJ & Turk MJ Induction of postsurgical tumor immunity and T-cell memory by a poorly immunogenic tumor. Cancer Res 67, 6468–6476 (2007). [DOI] [PMC free article] [PubMed] [Google Scholar]
- 23.Wu T et al. The TCF1-Bcl6 axis counteracts type I interferon to repress exhaustion and maintain T cell stemness. Sci Immunol 1 (2016). [DOI] [PMC free article] [PubMed] [Google Scholar]
- 24.Utzschneider DT et al. T Cell Factor 1-Expressing Memory-like CD8(+) T Cells Sustain the Immune Response to Chronic Viral Infections. Immunity 45, 415–427 (2016). [DOI] [PubMed] [Google Scholar]
- 25.Siddiqui I et al. Intratumoral Tcf1(+)PD-1(+)CD8(+) T Cells with Stem-like Properties Promote Tumor Control in Response to Vaccination and Checkpoint Blockade Immunotherapy. Immunity 50, 195–211 e110 (2019). [DOI] [PubMed] [Google Scholar]
- 26.Overwijk WW et al. Tumor regression and autoimmunity after reversal of a functionally tolerant state of self-reactive CD8+ T cells. J Exp Med 198, 569–580 (2003). [DOI] [PMC free article] [PubMed] [Google Scholar]
- 27.Man K et al. Transcription Factor IRF4 Promotes CD8(+) T Cell Exhaustion and Limits the Development of Memory-like T Cells during Chronic Infection. Immunity 47, 1129–1141 e1125 (2017). [DOI] [PubMed] [Google Scholar]
- 28.Ji Y et al. Repression of the DNA-binding inhibitor Id3 by Blimp-1 limits the formation of memory CD8+ T cells. Nat Immunol 12, 1230–1237 (2011). [DOI] [PMC free article] [PubMed] [Google Scholar]
- 29.Yang CY et al. The transcriptional regulators Id2 and Id3 control the formation of distinct memory CD8+ T cell subsets. Nat Immunol 12, 1221–1229 (2011). [DOI] [PMC free article] [PubMed] [Google Scholar]
- 30.Wang Y et al. The Transcription Factor TCF1 Preserves the Effector Function of Exhausted CD8 T Cells During Chronic Viral Infection. Front Immunol 10, 169 (2019). [DOI] [PMC free article] [PubMed] [Google Scholar]
- 31.Jadhav RR et al. Epigenetic signature of PD-1+ TCF1+ CD8 T cells that act as resource cells during chronic viral infection and respond to PD-1 blockade. Proc Natl Acad Sci U S A 116, 14113–14118 (2019). [DOI] [PMC free article] [PubMed] [Google Scholar]
- 32.Gullicksrud JA et al. Differential Requirements for Tcf1 Long Isoforms in CD8(+) and CD4(+) T Cell Responses to Acute Viral Infection. J Immunol 199, 911–919 (2017). [DOI] [PMC free article] [PubMed] [Google Scholar]
- 33.Leong YA et al. CXCR5(+) follicular cytotoxic T cells control viral infection in B cell follicles. Nat Immunol 17, 1187–1196 (2016). [DOI] [PubMed] [Google Scholar]
- 34.Im SJ et al. Defining CD8+ T cells that provide the proliferative burst after PD-1 therapy. Nature 537, 417–421 (2016). [DOI] [PMC free article] [PubMed] [Google Scholar]
- 35.Ito D et al. mTOR Complex Signaling through the SEMA4A-Plexin B2 Axis Is Required for Optimal Activation and Differentiation of CD8+ T Cells. J Immunol 195, 934–943 (2015). [DOI] [PMC free article] [PubMed] [Google Scholar]
- 36.Singh NJ Self-reactivity as the necessary cost of maintaining a diverse memory T-cell repertoire. Pathog Dis 74 (2016). [DOI] [PMC free article] [PubMed] [Google Scholar]
- 37.Martinez GJ et al. The transcription factor NFAT promotes exhaustion of activated CD8(+) T cells. Immunity 42, 265–278 (2015). [DOI] [PMC free article] [PubMed] [Google Scholar]
- 38.Su B et al. JNK is involved in signal integration during costimulation of T lymphocytes. Cell 77, 727–736 (1994). [DOI] [PubMed] [Google Scholar]
- 39.Lynn RC et al. c-Jun overexpression in CAR T cells induces exhaustion resistance. Nature 576, 293–300 (2019). [DOI] [PMC free article] [PubMed] [Google Scholar]
- 40.Jansen CS et al. An intra-tumoral niche maintains and differentiates stem-like CD8 T cells. Nature 576, 465–470 (2019). [DOI] [PMC free article] [PubMed] [Google Scholar]
- 41.Wherry EJ, Barber DL, Kaech SM, Blattman JN & Ahmed R Antigen-independent memory CD8 T cells do not develop during chronic viral infection. Proc Natl Acad Sci U S A 101, 16004–16009 (2004). [DOI] [PMC free article] [PubMed] [Google Scholar]
- 42.Miller BC et al. Subsets of exhausted CD8(+) T cells differentially mediate tumor control and respond to checkpoint blockade. Nat Immunol 20, 326–336 (2019). [DOI] [PMC free article] [PubMed] [Google Scholar]
- 43.Kaech SM, Hemby S, Kersh E & Ahmed R Molecular and functional profiling of memory CD8 T cell differentiation. Cell 111, 837–851 (2002). [DOI] [PubMed] [Google Scholar]
- 44.Kaech SM & Ahmed R Memory CD8+ T cell differentiation: initial antigen encounter triggers a developmental program in naive cells. Nat Immunol 2, 415–422 (2001). [DOI] [PMC free article] [PubMed] [Google Scholar]
- 45.Maekawa Y et al. Notch2 integrates signaling by the transcription factors RBP-J and CREB1 to promote T cell cytotoxicity. Nat Immunol 9, 1140–1147 (2008). [DOI] [PubMed] [Google Scholar]
- 46.Srinivas S et al. Cre reporter strains produced by targeted insertion of EYFP and ECFP into the ROSA26 locus. BMC Dev Biol 1, 4 (2001). [DOI] [PMC free article] [PubMed] [Google Scholar]
- 47.Byrne KT et al. Autoimmune melanocyte destruction is required for robust CD8+ memory T cell responses to mouse melanoma. J Clin Invest 121, 1797–1809 (2011). [DOI] [PMC free article] [PubMed] [Google Scholar]
- 48.Picelli S et al. Smart-seq2 for sensitive full-length transcriptome profiling in single cells. Nat Methods 10, 1096–1098 (2013). [DOI] [PubMed] [Google Scholar]
- 49.Law CW, Chen Y, Shi W & Smyth GK voom: Precision weights unlock linear model analysis tools for RNA-seq read counts. Genome Biol 15, R29 (2014). [DOI] [PMC free article] [PubMed] [Google Scholar]
- 50.Ritchie ME et al. limma powers differential expression analyses for RNA-sequencing and microarray studies. Nucleic Acids Res 43, e47 (2015). [DOI] [PMC free article] [PubMed] [Google Scholar]
- 51.Smyth GK Linear models and empirical bayes methods for assessing differential expression in microarray experiments. Stat Appl Genet Mol Biol 3, Article3 (2004). [DOI] [PubMed] [Google Scholar]
- 52.Subramanian A et al. Gene set enrichment analysis: a knowledge-based approach for interpreting genome-wide expression profiles. Proc Natl Acad Sci U S A 102, 15545–15550 (2005). [DOI] [PMC free article] [PubMed] [Google Scholar]
- 53.Mootha VK et al. PGC-1alpha-responsive genes involved in oxidative phosphorylation are coordinately downregulated in human diabetes. Nat Genet 34, 267–273 (2003). [DOI] [PubMed] [Google Scholar]
- 54.Doering TA et al. Network analysis reveals centrally connected genes and pathways involved in CD8+ T cell exhaustion versus memory. Immunity 37, 1130–1144 (2012). [DOI] [PMC free article] [PubMed] [Google Scholar]
Associated Data
This section collects any data citations, data availability statements, or supplementary materials included in this article.