Abstract
Background:
Local computed tomography (CT) reconstruction is achievable with portal images acquired during volumetric-modulated arc therapy (VMAT) delivery and was named as VMAT-CT. However, the application of VMAT-CT is limited because it has limited field of view and no density information. In addition, the new generation of multi-leaf collimator with faster speed and various collimator angles used in patients’ plans could cause more artifacts in VMAT-CT. The goal of this study was to extend VMAT-CT concept, generate complete three-dimensional (3D) CT images, calculate new 3D dose, track and adapt VMAT plan based on updated images and dose.
Materials and methods:
VMAT-CT and planning CT of phantoms were fused by rigid or deformable registration to create VMAT-CT+ images. Trackings based on planning CT, VMAT-CT+, and cone beam CT (CBCT) were compared. When prescription dose was not met for planning target volume (PTV), re-planning was demonstrated on an in-house deformable phantom. Possible uncertainties were also evaluated.
Results:
Tracking based on VMAT-CT+ was accurate and superior to those based on planning CT and CBCT since VMAT-CT+ can detect changes after phantom setup. PTV in the deformable phantom lost coverage after deformations but went up and met the prescription goal after re-planning. The impact of uncertainties on dose was minimal.
Conclusion:
3D tracking and adaptation of VMAT based on VMAT-CT are feasible. Our study has the potential to increase the confidence of beam delivery, catch and remedy errors during VMAT.
Keywords: Volumetric modulated arc therapy, computed tomography, tracking, adaptive radiotherapy, three-dimensional
Volumetric modulated arc therapy (VMAT) is an advanced technique that can deliver highly conformal radiation dose and reduce overall treatment time. However, due to high degree of complexity and dose gradients, the requirement of delivery accuracy has increased for VMAT. Pre-treatment quality assurance (QA) and image guidance can detect certain errors [1–4], but they are not sufficient to detect intra-fractional movement of the patient, change of patient’s anatomy or the errors during VMAT, and image guidance can induce extra imaging dose to the patient [4]. A few methods have been used to supplement QA and image guidance, including in vivo dosimetry [5] and machine log file monitoring [6,7], but they also have limitations: conventional in vivo dosimetry is intrusive, time consuming and generally only provides point dose information; electronic portal imaging device (EPID) based in vivo dosimetry relies on back-projection dose reconstruction method which ignores the intra-fractional patient movement [8]; machine log file monitoring is also based on the assumption that patient does not move during the treatment [6,7].
Reconstruction of VMAT-CT was initially proposed by Poludniowski et al. in 2010 [9]. It provides real-time patient information and would not increase imaging dose since the images come directly from treatment beams, but it has multiple shortcomings like limited field of view (FOV), low image quality, and no accurate density information. The 2010 study [9] was based on Elekta MLCi2 multi-leaf collimators (MLC) which move relatively slower than the new Elekta Agility MLCs used in most current clinics. The faster MLC movement will further blur portal images and cause artifacts in VMAT-CT. In addition, 180° collimator angle was used in their study [9], while any other angle could be used in patients’ plans and cause artifacts in VMAT-CT. Because of these disadvantages, VMAT-CT is not a well-established research area and there were very few follow-up studies [10]. To our best knowledge, none of the clinics in the US is performing it as a routine practice.
The goal of this study was to evaluate the feasibility of tracking three-dimensional (3D) VMAT treatment and dose considering intra-fractional movement using phantoms, and adapting VMAT plan based on updated images and dose. This goal will be approached by combining VMAT-CT concept with improved image reconstruction methods and patient-specific prior information. Trackings based on VMAT-CT, planning CT and CBCT were compared. Criteria for VMAT-CT reconstruction and possible uncertainties associated with VMAT-CT were also evaluated.
Methods and materials
Phantoms, treatment planning, and data collection
A Rando phantom was used for head and neck VMAT plan, and an Atom phantom was used for other sites including abdomen and prostate. The reason we did not include breast sites is because the beams were too big for the EPID panel. An in-house deformable lung phantom was created for this study as shown in Supplemental Fig. 1: a sponge inside a latex enclosure represented lungs, a small balloon filled with gel represented the deformable tumor, and the rest of the phantom was filled with rice powder to represent tissue. The deformable tumor was tied with strings on both sides: one side of it was fixed and the other side could be pulled to deform the tumor.
The VMAT plans were created in Pinnacle v9.10 treatment planning system (TPS) (Philips Medical Systems, Fitchburg, WI, USA), and were delivered using Elekta Versa linac (Elekta Oncology Systems, Crawley, UK) operating at 6 MV. Clinical head and neck, abdomen, and prostate VMAT plans were delivered to the Rando or Atom phantom with 600 MU/min dose rate, and a customized stereotactic body radiotherapy (SBRT) plan was delivered to the deformable lung phantom with 600 MU/min dose rate. The prescription does was 40 Gy in 15 fractions, 48.6 Gy in 27 fractions, 78 Gy in 39 fractions, 50 Gy in 5 fractions for the head, abdomen, prostate and lung plans, respectively. EPID images were acquired with iView in movie mode and the frame averaging was set to be 1 to ensure maximum image counts. Timestamp associated with EPID images were also acquired within iView system. Meanwhile, gantry angles, monitor units (MU) delivered, jaw position, and MLC positions were recorded through Mobius log software (Mobius Medical Systems, Houston, TX). MLC shapes derived from linac log were matched with projection images to get the time difference between EPID images and linac log. Gantry angle stored in the linac log was then assigned to each projection image according to the time difference.
VMAT-CT reconstruction
Masking function and local tomography filter were adopted according to Poludniowski et al. [9]. Compared to the old MLCi2 head, EPID images obtained on Agility head with the same sampling rate were blurrier due to the faster MLC movement. Using MATLAB function imerode, an erosion with a disk of a radius around 25 pixels was performed on both EPID image and masking function to remove the blurriness, creating lower and upper bounds in each row along m-direction.
Various collimator angles in clinical plans, i.e. the collimator angle in the plan we delivered could be 45°, 135°, 315°, and 330°, complicate the image extrapolation process: MLC leaves will move in a slanted direction in the X-Y plane and may split the beam aperture into more than one connected region in the horizontal direction (u-direction) on EPID images (Fig. 1), reduce useful information in each region and cause streaking artifacts in VMAT-CT. Here we introduce a 3D image rotation after VMAT-CT back-projection at each gantry angle to preserve most of the information on EPID and then sum all angles’ contribution as the final reconstruction:
| (1) |
where O represents the object, β is the gantry angle, m and n are rotated coordinates (Fig. 1), TR is the rotation matrix which is the combination of the rotation around y-axis for -θ (θ is the collimator angle), and the rotation around z-axis for –β and can be expressed as:
| (2) |
The other parameters were defined in 2010 study [9]: Mβ is the masking function which is a measurement of how many rays pass through each calculated voxel, is the extrapolated EPID image for the k-th projection, eR is the local tomography filter, Θ is the Heaviside step function which eliminates reconstruction points that have too little data available.
Fig. 1.
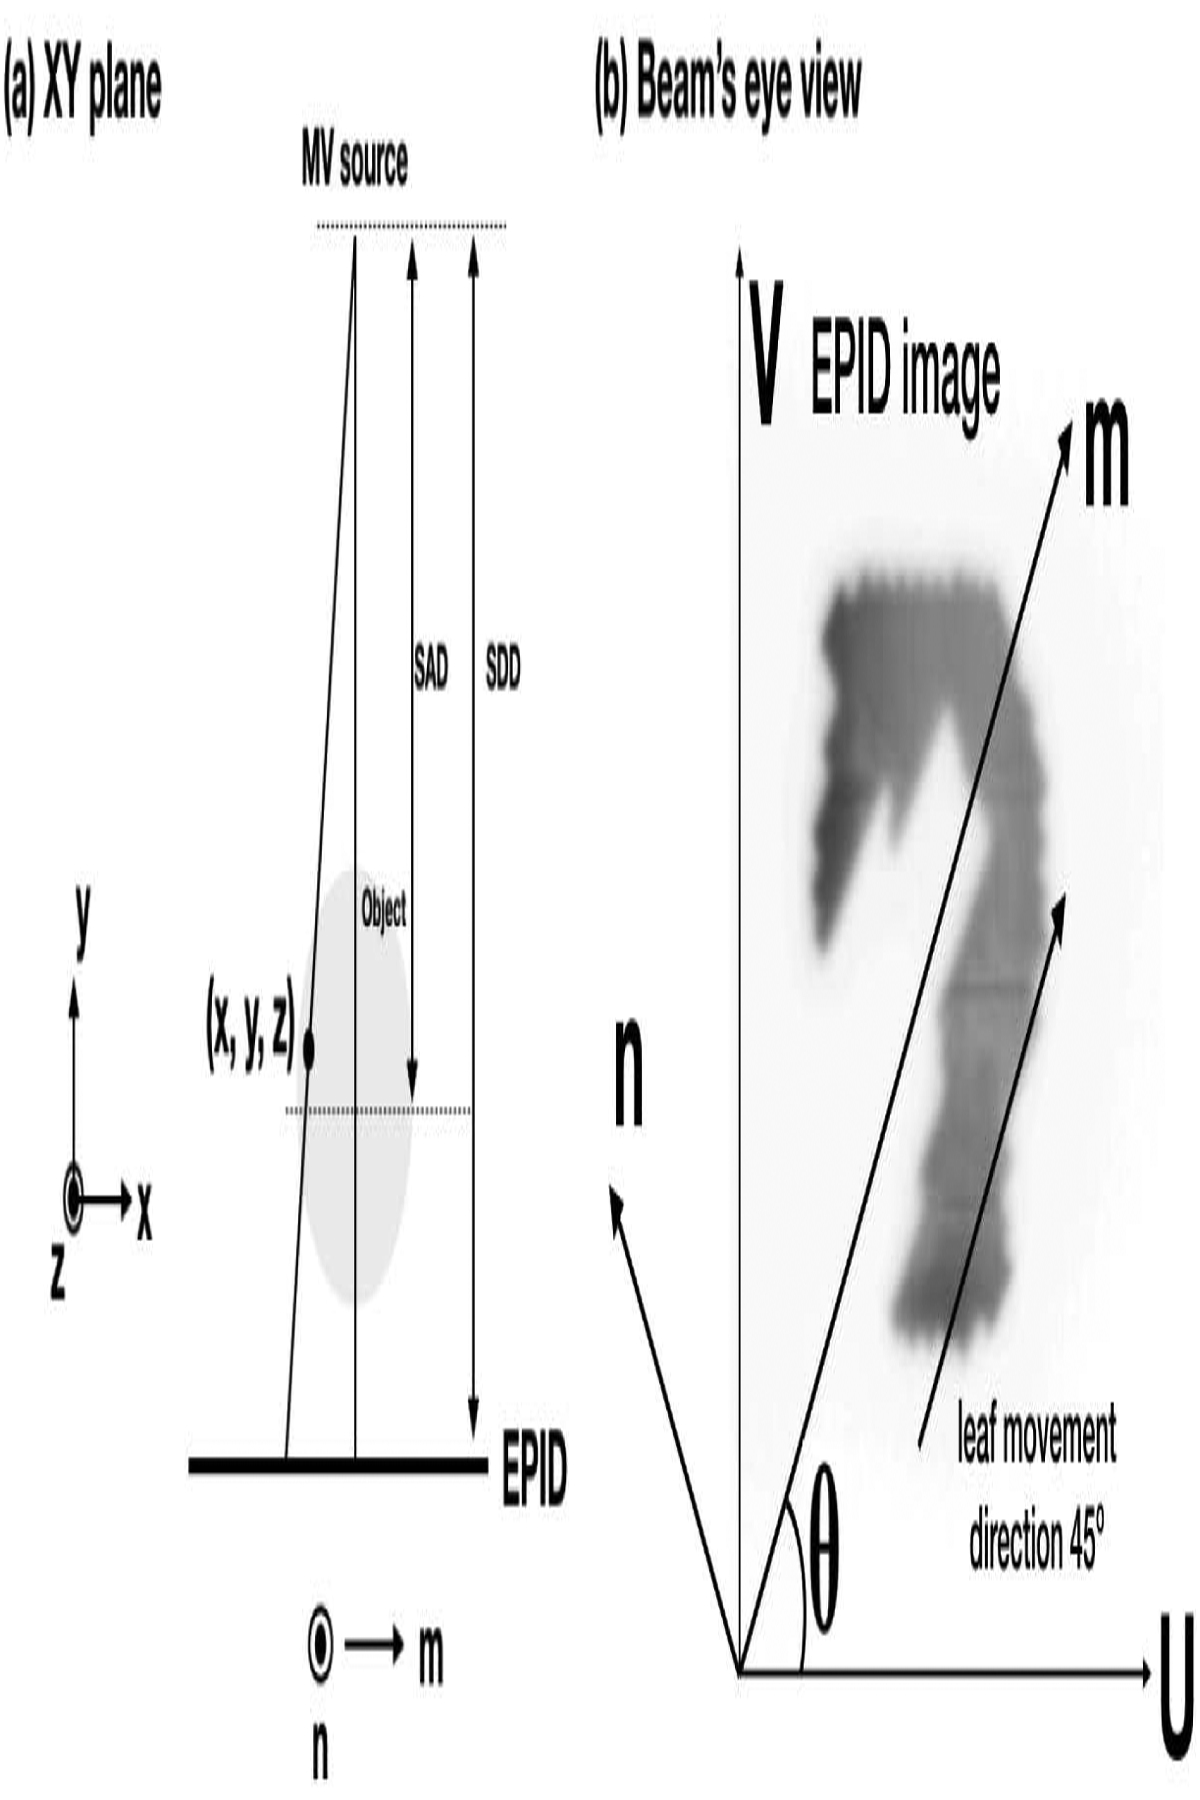
Geometry of VMAT-CT reconstruction. (u, v) is the generic EPID image coordinate and is aligned with the panel’s edge, while (m, n) is chosen so that m is parallel to MLC leaf movement direction. (a) The X-Y plane when gantry angle is 0°, notice z and n are parallel. (b) A typical beam’s eye view. (m, n) is rotated θ degree relative to (u, v) counter clockwise when the collimator angle is θ.
Because VMAT-CT does not contain the entire patient anatomy and has no quantitative density information, image registration between VMAT-CT and planning CT was performed. For the rigid phantoms, rigid registrations were performed in MATLAB (MathWorks Inc., Natick, MA) to detect any possible shift or rotation, and planning CT was cropped to a similar region as VMAT-CT for better registration result. During image registration, the planning CT was moving while VMAT-CT was fixed, and the registered set was interpolated to match planning CT’s resolution. The original un-cropped planning CT was applied with the same registration matrix to create a so-called “VMAT-CT+” image set. For the deformable phantom, deformable registration workflow in MIM (MIM Software Inc., Cleveland, OH) was used. A rigid alignment between the VMAT-CT and the whole planning CT was performed prior to deformable registration and this rigid registration matrix was applied to the whole planning CT. A local deformation was then performed and local deformable matrix was applied to the local planning target volume (PTV) area on the planning CT (without changing the other parts of planning CT) to generate VMAT-CT+.
Tracking and adaptive radiotherapy (ART) based on VMAT-CT
We incorporate real-time machine delivery information into dose calculations instead of relying on original treatment plans in TPS. For a full VMAT arc, there are usually around 89 control points in TPS, while there are usually over 250 timestamps recorded in linac log, which can be considered as over 250 new control points. These new control points recorded by linac log can be written into the beam delivery file where Pinnacle stores beam information to replace the old control points. The dose calculation was then performed using the new beam delivery file and the new VMAT-CT+ image set. Supplemental Fig. 2 shows the workflow of 3D dose reconstruction.
For the rigid phantoms, a shift of 1 cm in X-direction was purposely applied after initial setup to mimic a potential shift of a patient and to test if VMAT-CT can detect the expected shift. Dose calculated on VMAT-CT+ was compared to the original planning dose to find the difference, and 3D gamma [11] was calculated with an acceptance criteria of 3% and 3mm. For these phantoms, since the organs in phantoms were different in shape and density from the real patients, we only tested the accuracy of VMAT-CT reconstruction and the effect of intrafractional shift on dose rather than evaluating the original planning goal like PTV coverage and dose to organs at risk (OARs).
For the deformable lung phantom, we created a customized SBRT plan based on the phantom geometry and optimization goals used for SBRT lung plans in TPS, and made sure the plan was clinically realistic. After CT scan, the phantom was moved to linac couch and deformed by pulling the string attached to the tumor and remained in the deformed state. CBCT was acquired right before plan delivery and was used as the ground truth (CBCTground) since the phantom could not move on its own and there should not be any geometry difference between VMAT-CT and CBCTground. The reason we did not scan the phantom again with CT after deformation was to eliminate any possible geometry change in the process of moving the phantom from linac couch to CT scanner. We tracked the geometry change using VMAT-CT+ and calculated the dose PTV received. If the original PTV prescription goal was not met, ART would be performed on VMAT-CT+ image and the VMAT plan would be reoptimized in TPS to meet the prescription dose goal for PTV. To strengthen the study and to better inform on the performance of VMAT-CT as a 3D tracking and adaption tool, we repeated the process four times by deforming the phantom to different shapes and creating ART plan for each case.
We also compared treatment tracking based on VMAT-CT+ with those based on CBCT because CBCT was used in most ART studies [12]. CBCT was taken with Elekta XVI prior to beam delivery for phantom setup with a resolution of 1 mm × 1 mm ×1 mm. For the rigid phantoms, we took CBCT before we shifted the phantoms. For the deformable phantom, the planning CT captured the original phantom geometry (deform 0), then we deformed the phantom (deform 1) to mimic a possible deformation of a patient and took CBCT. After that, we changed the deformation of the phantom again (deform 2) to mimic further deformation after CBCT, took CBCTground, and then delivered the beam. Therefore, VMAT-CT or CBCTground captured different images (deform 2) than CBCT (deform 1) since the phantom geometry changed. CBCT images were exported to Mosaiq and further exported into multiple DICOM files. For the rigid phantoms, planning CT was rigidly registered to CBCT in MATLAB and the registered image set has the same resolution as planning CT. For the deformable phantom, planning CT was deformably registered to CBCT in MIM. Similar to VMAT-CT+ images, registered CBCT/planning CT DICOM files and the new beam delivery file incorporating all control points recorded by linac log were imported into Pinnacle and dose calculations were performed.
Uncertainty analysis
The main uncertainties that may affect the final dose in our study were from rigid or deformable registration.
To evaluate the uncertainties from rigid registrations, a shift of 1 cm was applied to the Rando and Atom phantom in X, Y, and Z directions separately. The differences of the transformation matrix for aligning VMAT-CT and planning CT compared to the 1-cm shift would be the uncertainties. This process was repeated multiple times (different plans) and a mean uncertainty was obtained. The impact of uncertainty from rigid registration on dose was tested by shifting the planning CT the mean uncertainty in each direction separately in a copy of the original plan in TPS and calculating dose difference and 3D gamma compared with planned dose.
To evaluate the uncertainties from deformable registrations, we used the in-house deformable phantom and Supplemental Fig. 3 shows the workflow. As explained previously, CBCTground was used as the golden standard after deformation. Gross tumor volume (GTV) on planning CT was contoured by setting a HU threshold and PTV was expanded from GTV by 5 mm. After deformably registering the moving image (planning CT) with the reference image (VMAT-CT or CBCTground), PTV contour on planning CT was transferred to VMAT-CT+ and CBCTground, and comparison of PTV contour in VMAT-CT to that in CBCTground can be done by measuring the same contour-based parameters: Hausdorff distance (HD), mean distance to agreement (MDA), dice similarity coefficient (DSC), and Jaccard coefficient [13,14]. This process was repeated multiple times (different deformations) and a mean uncertainty was obtained. The impact of uncertainty from deformable registration on dose was tested by expanding or shrinking the PTV isotropically by the average HD in a copy of the original plan in TPS and calculating dose difference and 3D gamma compared with planned dose.
Result
Fig.2 shows planning CT and reconstructed VMAT-CT images for the Atom phantom using a prostate plan, and one can appreciate the significantly improved image quality after considering blurry areas and collimator rotation.
Fig. 2.
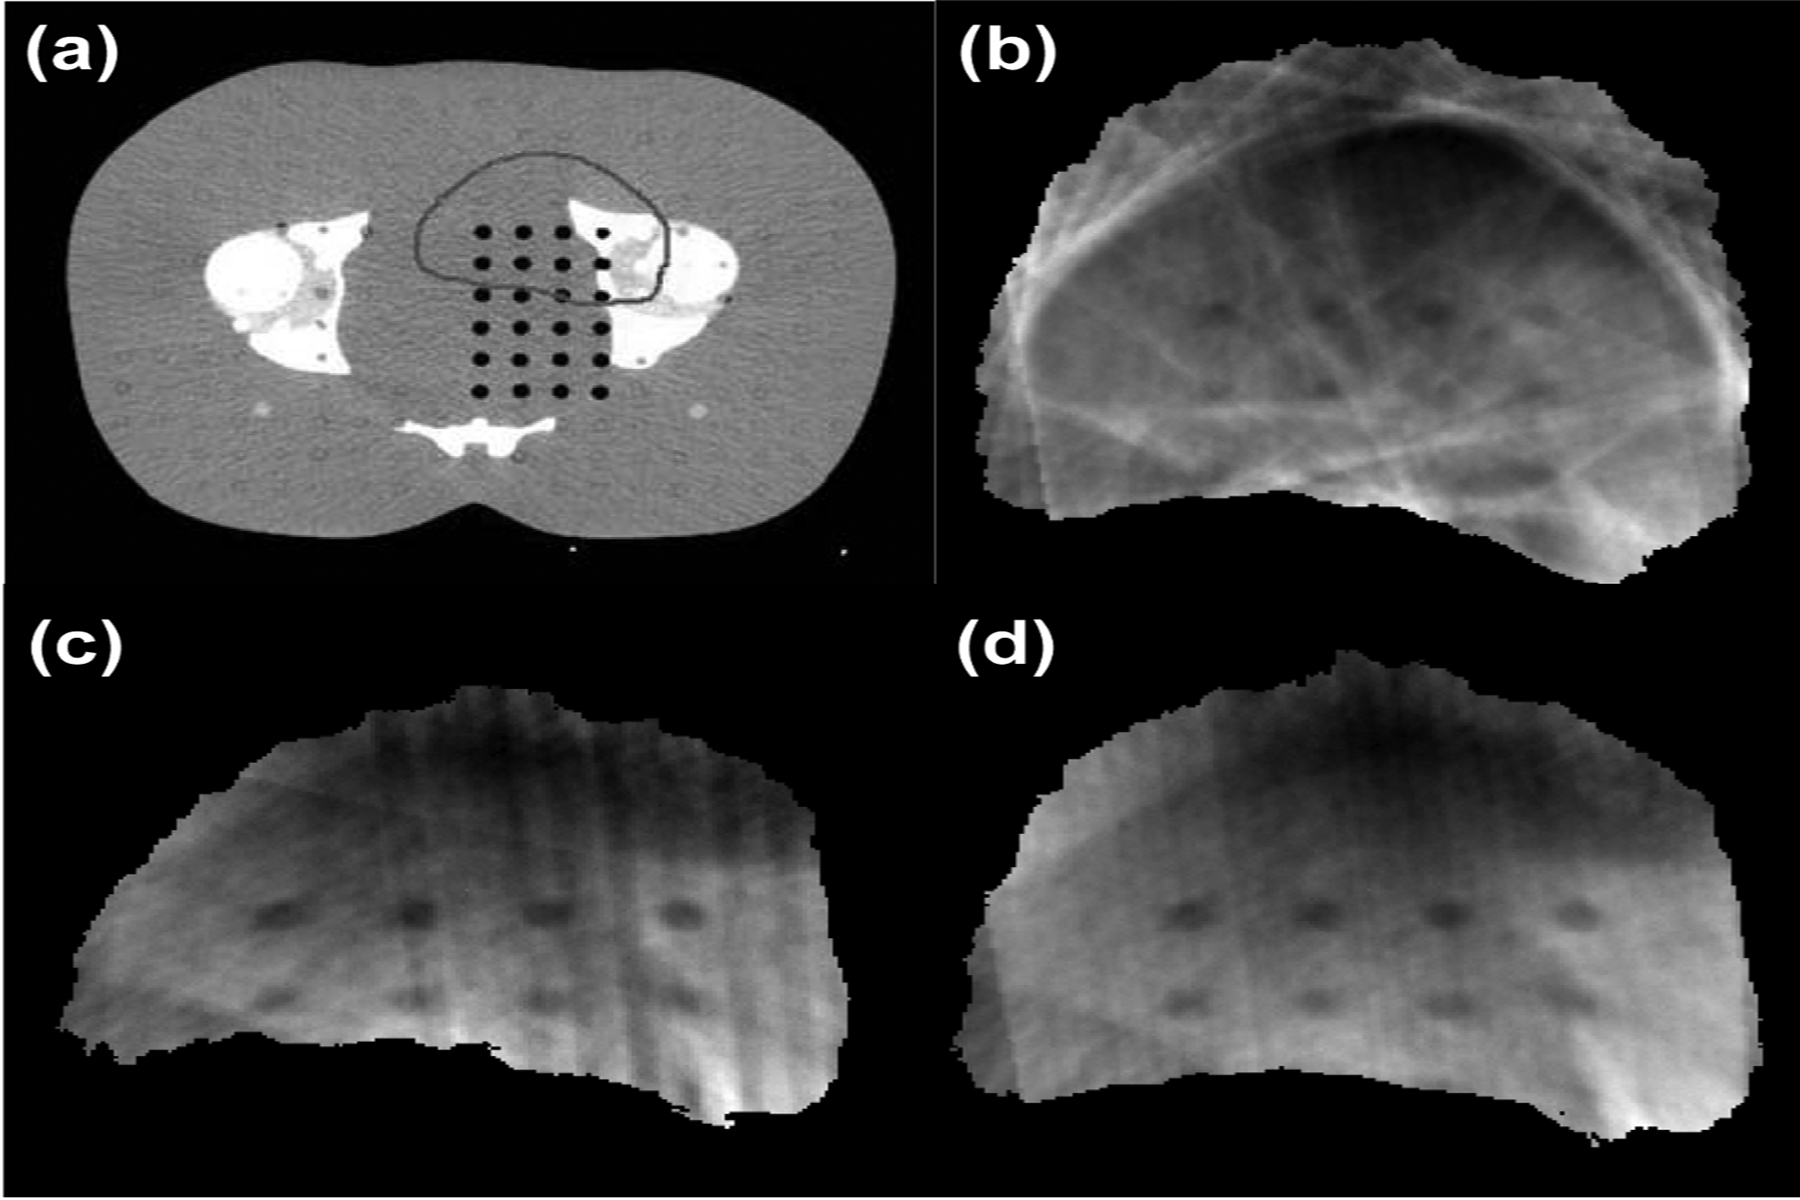
(a) Planning CT of an Atom phantom along with PTV contour, and reconstructed VMAT-CT (b) based on raw data, (c) after deblurring, (d) after collimator rotation and deblurring.
Fig.3 shows typical planning CT, VMAT-CT (in a different scale) and VMAT-CT+ images. All VMAT-CT are local to the PTV region and VMAT-CT+ images show the entire FOV. The colors in VMAT-CT+ images in fig. 3 are visualization aids and are not used in other figures.
Fig. 3.
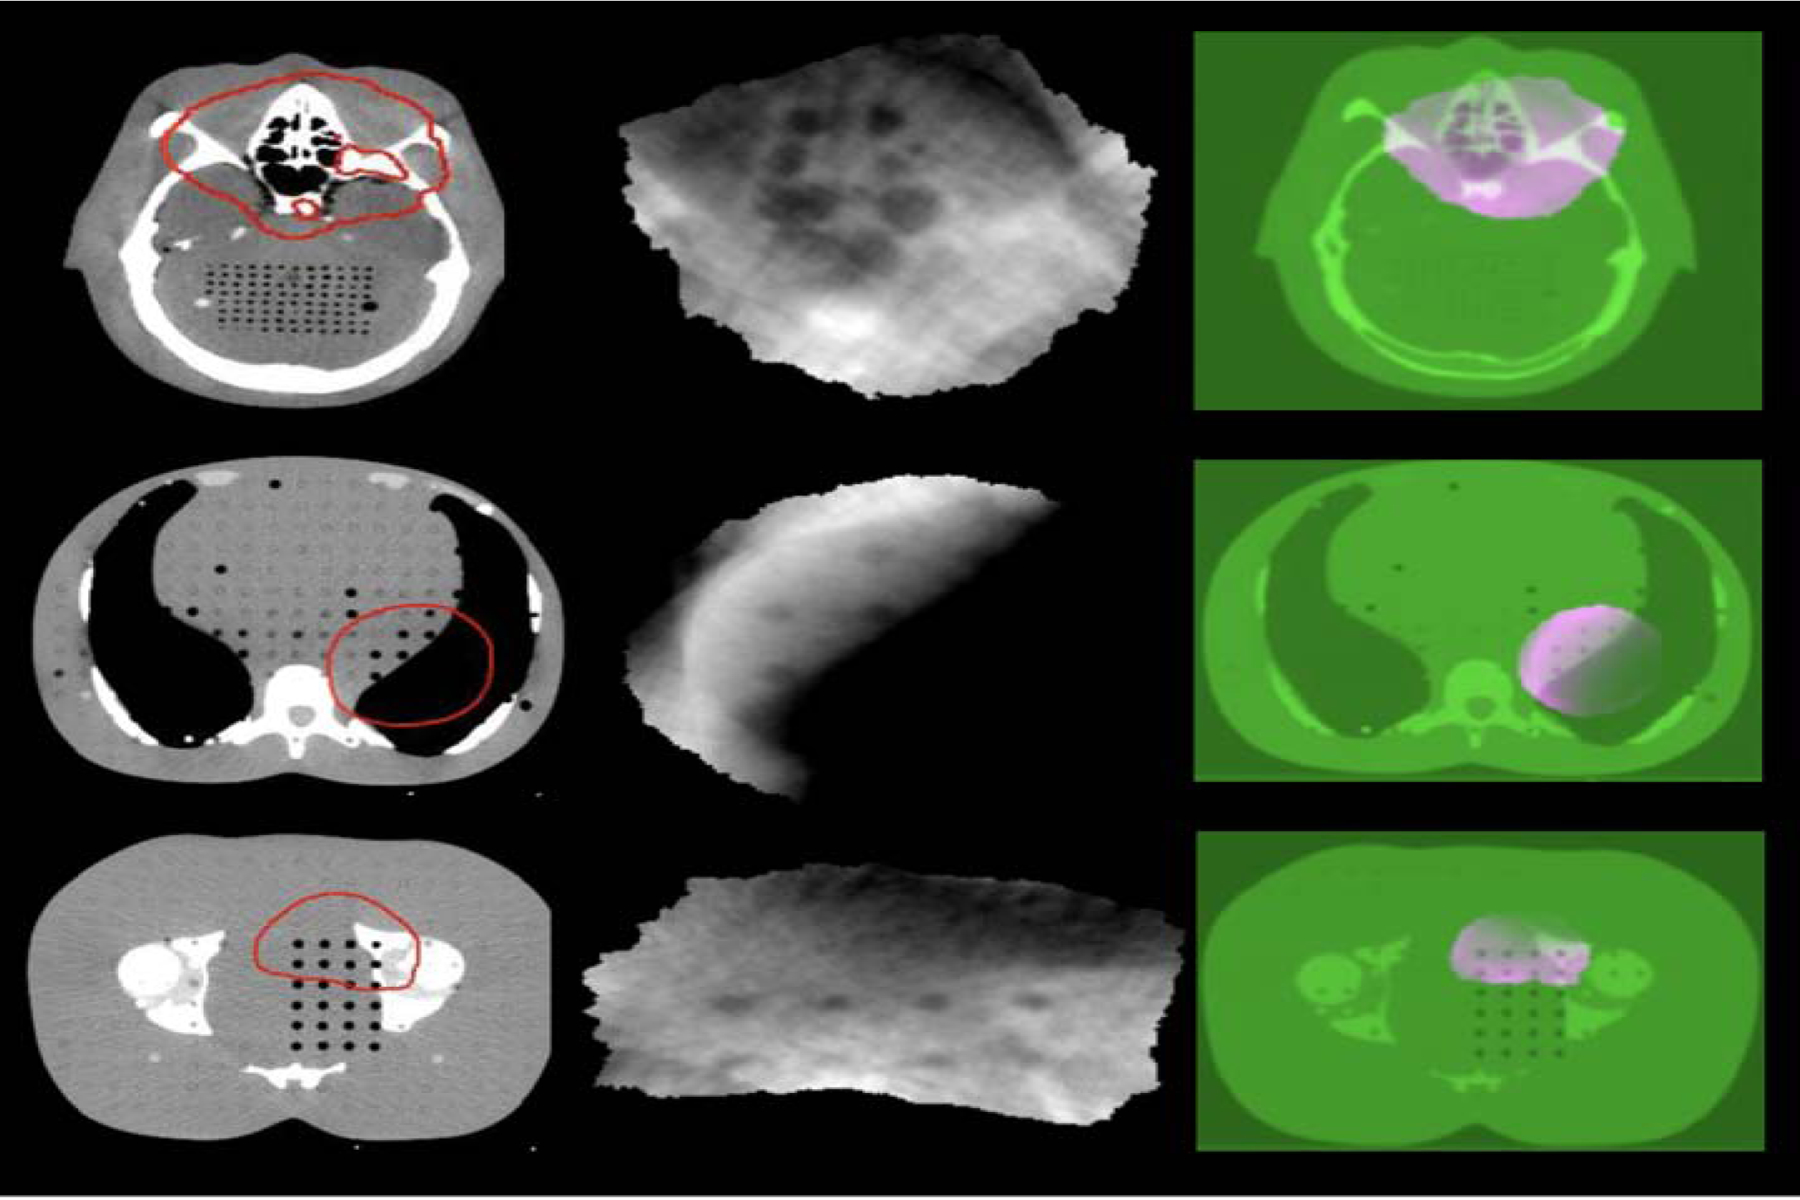
Axial view of planning CT images overlaid by the red prescription isodose lines (first column), reconstructed VMAT-CT images (second column), and VMAT-CT+ image sets containing registered VMAT-CT (pink) and planning CT (green) (third column) for a head plan (top row), an abdomen plan (middle row), and a prostate plan (bottom row).
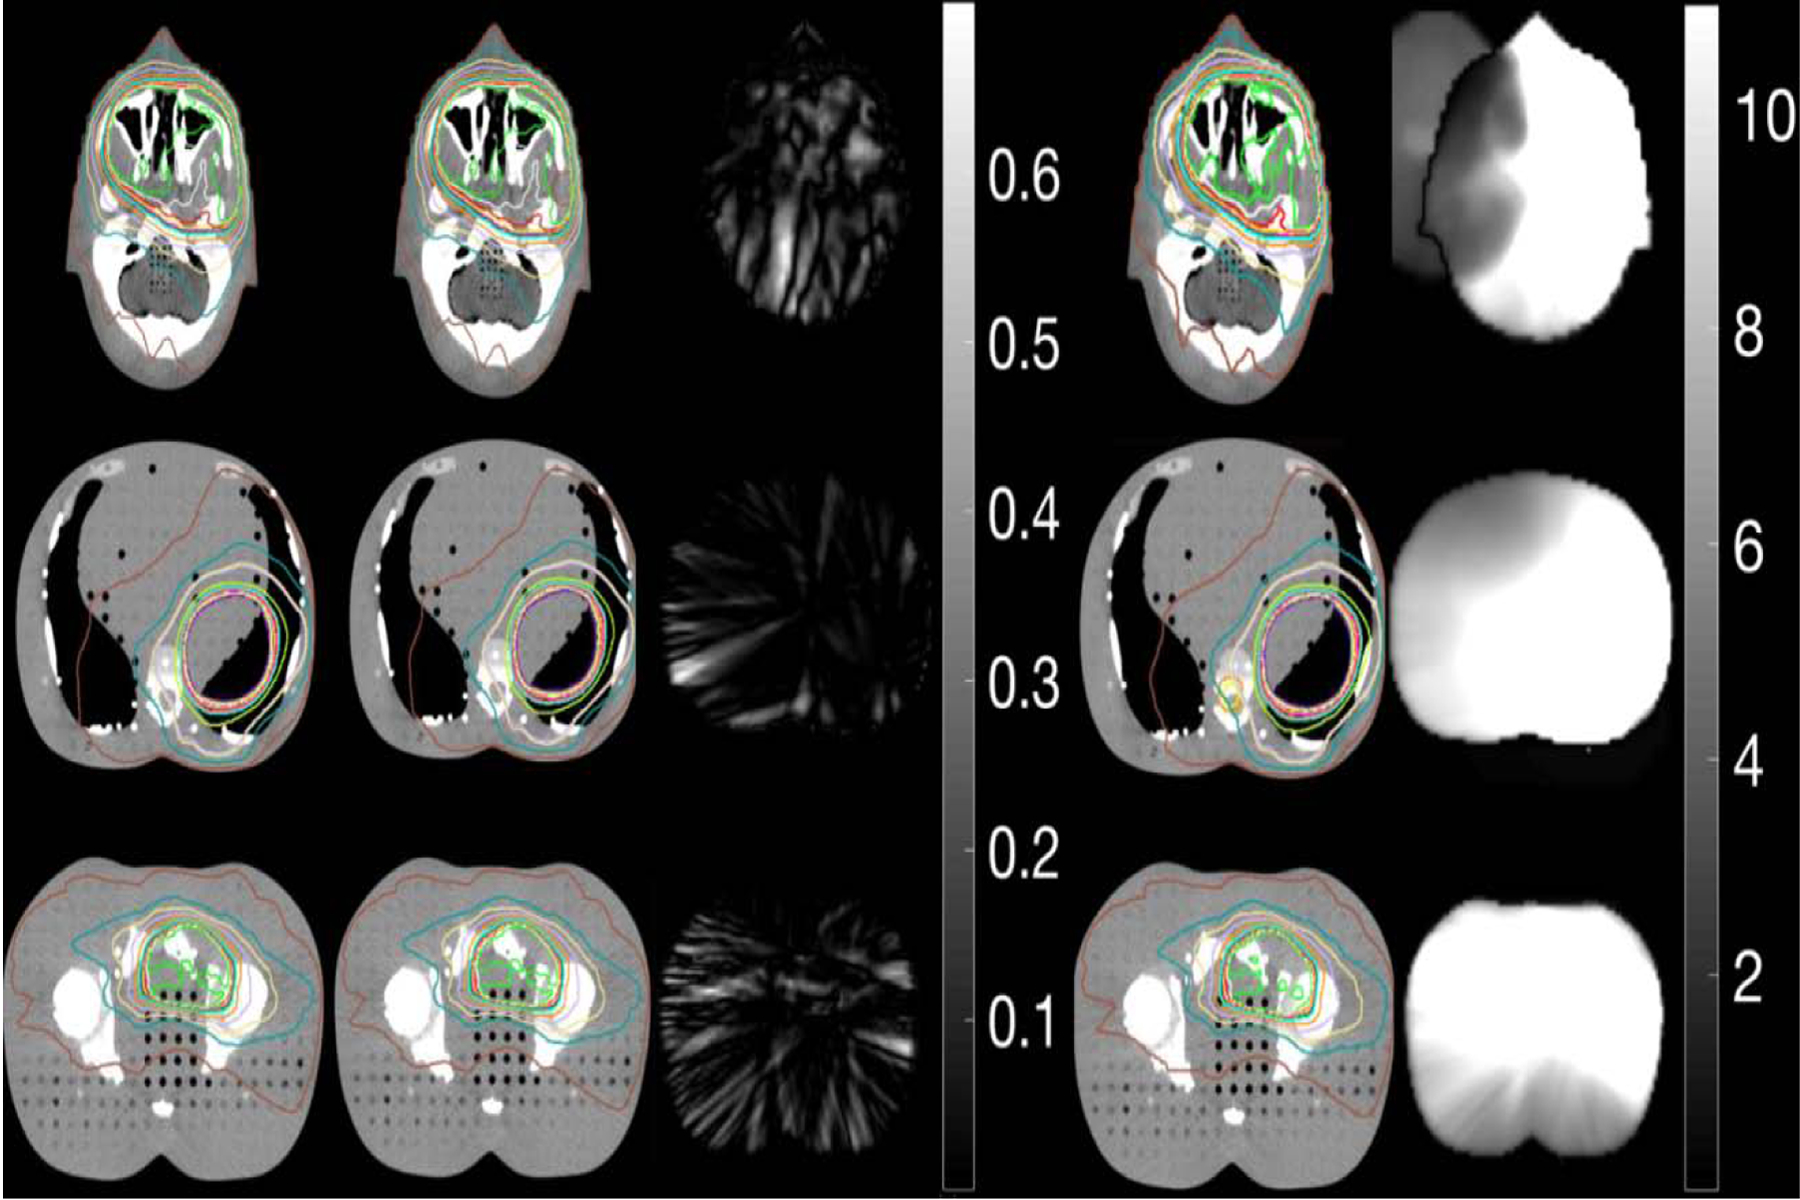
Fig. 4 shows planned dose calculated on shifted (1 cm) original planning CT (first column), delivered dose calculated on VMAT-CT+ (second column) and on CBCT (fourth column) for the Rando phantom. 3D Gamma plots (passing rate 100% for all plans) of comparison between VMAT-CT+-based dose and planned dose (third column) shows VMAT-CT+ can track the 1-cm shift that we intentionally applied and can be used to calculate the true dose delivered to the phantom. CBCT cannot track any change after initial setup so dose calculated on CBCT does not represent the true delivered dose. The 3D Gamma passing rate for the comparison between CBCT-based dose and planned dose is 38.83%, 48.23% and 69.97% for brain, abdomen and prostate plans respectively (fifth column). Notice here the 3D gamma plot shows a lot of voxels reaching 10, which is the upper limit set by the searching radius from the evaluated voxel.
Fig. 4.
- We extended the VMAT-CT concept, enlarged the field of view by registering VMAT-CT with planning CT and created VMAT-CT+, evaluated location and dose tracking and adapted plan based on VMAT-CT+ when the prescription dose goal was not met. The impact of possible uncertainties on dose was minimal.
- VMAT-CT was reconstructed under more stringent conditions, dose was calculated with in-treatment geometry, and adaptative therapy was carried out when prescription dose was not met. Our VMAT-CT reconstruction is based on the latest linac MLC and real clinical plans, which means our method has a broader application.
- Tracking based on VMAT-CT was accurate and superior to those based on planning CT and CBCT since VMAT-CT can detect changes after phantom setup.
- We incorporated real-time machine delivery information into dose calculations instead of relying on treatment plans, which can detect possible beam delivery error during VMAT.
We created different deformations and ART plans for the deformable phantom. Fig. 5 shows the result of deformation and dose calculations based on one plan, and Supplemental Fig. 4 shows the other plans. VMAT-CT can track the phantom deformation correctly compared with ground truth (Gamma passing rate 100%), while pre-treatment CBCT cannot. Fig. 5(b) shows the dose volume histogram (DVH) for the original plan, plans after deformation and re-planning. The PTV had 95% coverage of the prescription dose in the original plan, dropped to 92% after phantom deformation (the prescription dose line did not cover superior part of PTV completely) but went up to 95% after re-planning. Interestingly, the lung dose went down significantly after ART due to the larger distance between tumor and lung after deformation. We had similar findings for other plans as shown in Supplemental Fig. 4.
Fig. 5.
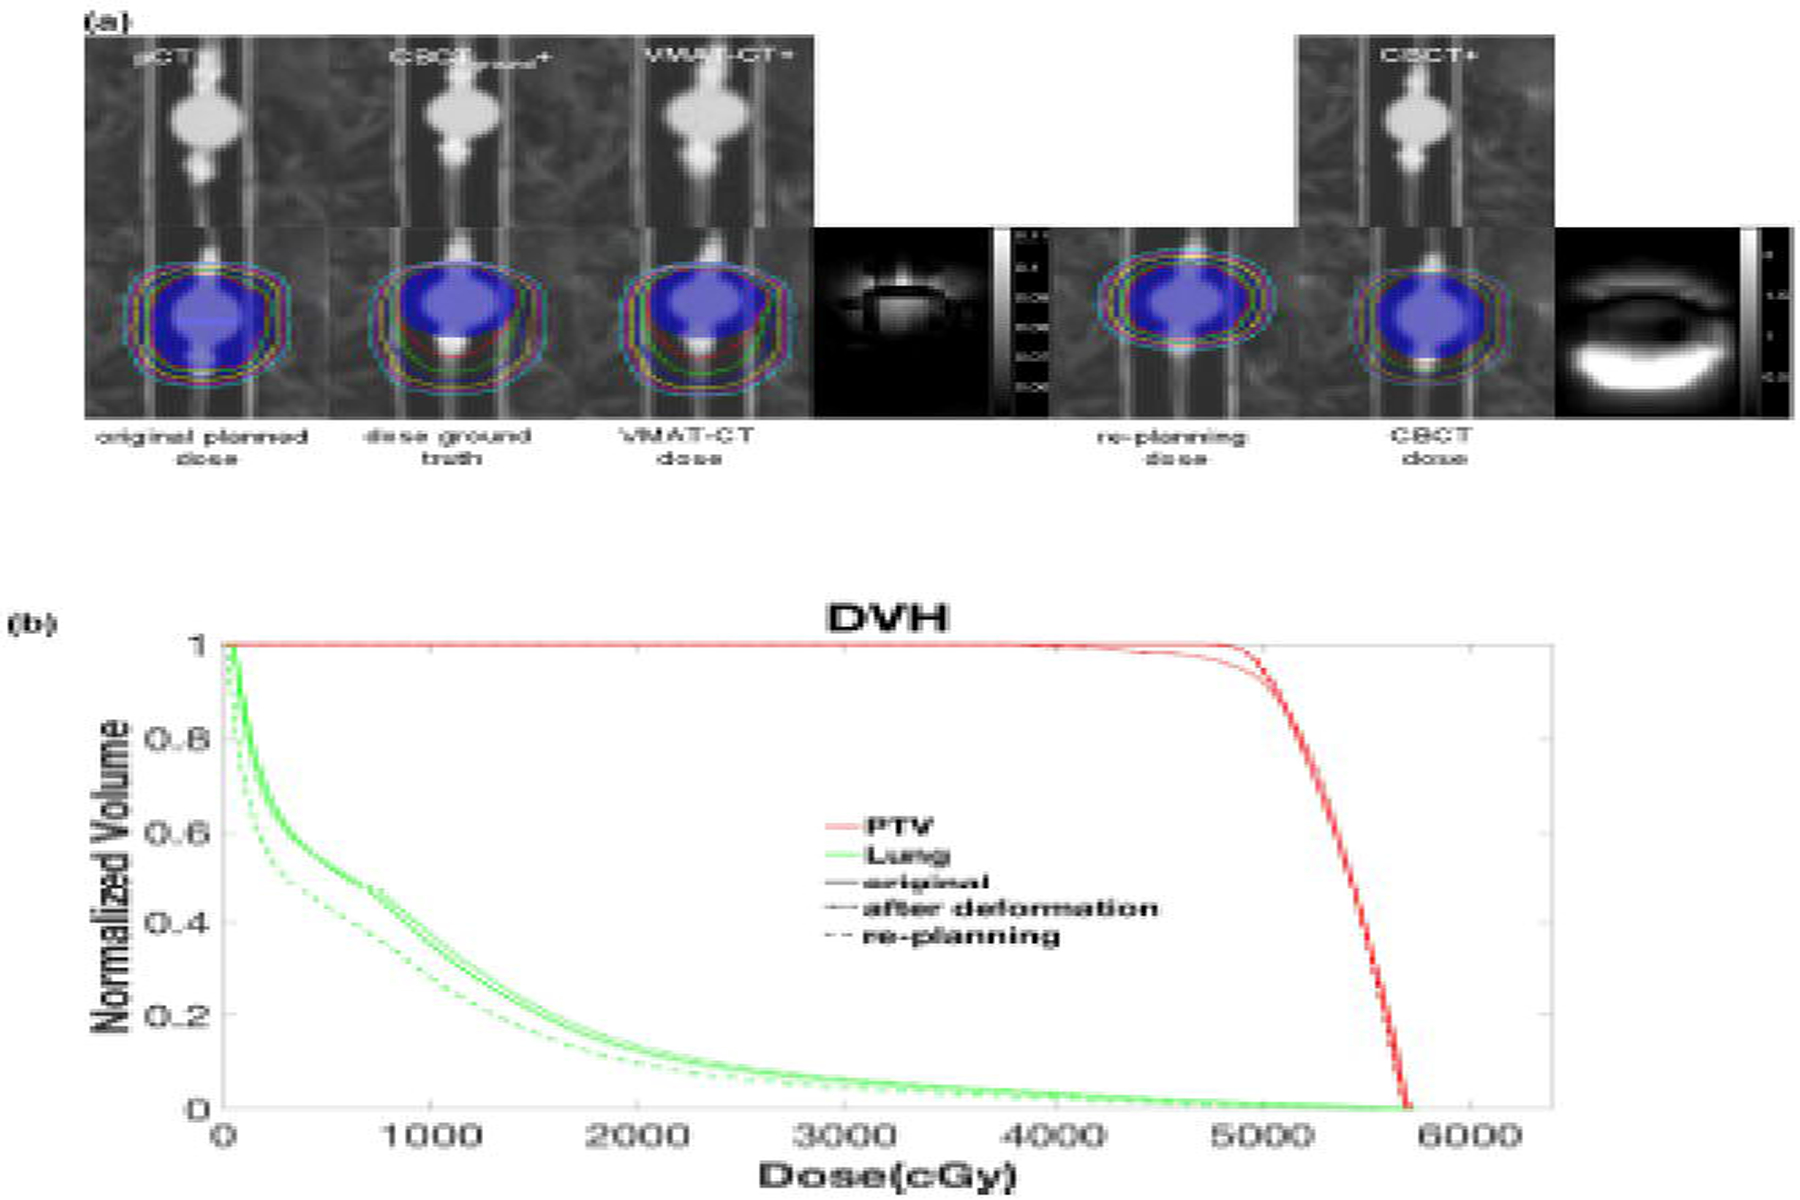
(a) (Top row) comparison of original planning CT (pCT), CBCTground+ (pCT registered to CBCTground), VMAT-CT+, CBCT+ (pCT registered to pre-treatment CBCT); (bottom row) dose distributions in original plan, dose after deformation based on CBCTground+, dose after deformation based on VMAT-CT+, 3D Gamma plot of comparison between VMAT-CT dose and dose ground truth, re-optimized dose based on VMAT-CT+, dose based on pre-treatment CBCT+, and 3D Gamma plot of comparison between CBCT dose and dose ground truth. The blue shaded area is the original and deformed PTV contour. Note the two Gamma plots have different scales. (b) DVH of original plan, after deformation plan and re-planning plan.”
Supplemental Table 1 shows the rigid registration uncertainties when planning CT is registered to VMAT-CT. Supplemental Table 2 shows the deformable registration uncertainties for the deformable phantom. Using a head plan, the largest potential point dose uncertainty from rigid registration by shifting the planning CT the mean uncertainty in each direction is 0, 0.49 and 2.49 Gy for x, y and z-direction respectively. The 3D gamma passing rate after shifting the planning CT the mean uncertainty in each direction is always 100%. For the deformable registration, the expansion of the mean HD reduces the mean PTV dose by 1.39 Gy while the shrinkage increases the mean PTV by 0.82Gy. The 3D gamma passing rate after expansion or shrinkage is 99.97% and 100% respectively.
Discussion
We extended the VMAT-CT concept, enlarged the FOV by registering VMAT-CT with planning CT and created VMAT-CT+, evaluated location and dose tracking based on VMAT-CT+, and adapted plan based on VMAT-CT+ when the prescription dose goal was not met. Possible uncertainties were also evaluated.
Our study has multiple strengths. First, our VMAT-CT reconstruction is based on the latest linac MLC and real clinical plans. Poludniowski et al. [9] and Kida et al. [10] were able to reconstruct 3D or 4D local VMAT-CT images. However, their reconstructions were based on plans with slower MLC from the previous generation of linac head, or with MLC movement constraint to ensure target was always exposed during treatment. With Elekta Versa agility head, fewer EPID images can be collected from each VMAT plan and EPID images can have very blurry edges because MLCs are thinner and move faster. A lot of the clinical VMAT plans will have heavily truncated beam aperture causing streaking artifacts in VMAT-CT reconstruction. We eroded the edges of these EPID images to remove the blurry area and improved VMAT-CT quality. Second, the collimator angle in our plans is not 0° or 180°, which means the rotation matrix we introduced can apply to real clinical plans and our method has a broader application. For an EPID image in which the beam aperture is disconnected in the horizontal direction due to collimator angle, rotation guarantees all information in the disconnected region projects back therefore preserves the most information, while the traditional methods may lose information, e.g. interpolate between the two regions or simply cut off one section of the disconnected region and only keep the other section. Third, we incorporated real-time machine delivery information into dose calculations. The control points in the recorded machine log is always different from the control points in TPS because the control points are 4 degree apart in TPS but are recorded with an average of 0.2 s apart in the machine log, therefore it is important to consider the possible error during treatment delivery since linac is delivering the beam the way recorded in the machine log instead of the way in TPS to meet the machine hardware limits like MLC speed, gantry rotation speed, etc. The machine delivery log records the machine parameters every 0~0.6 s with an average of 0.2 s, and it tracks the machine performance very closely and provides information for delivery validation.
Compared with previous tracking based on pre-treatment CBCT, tracking based on VMAT-CT+ shows superior results since VMAT-CT+ can detect phantom/patient geometry change during beam delivery, although the geometry change for real patients after setup may not be as large as 1 cm if the treatment site is not susceptible to movement. In many clinics, CBCT is performed after SBRT to help determine the patient’s final anatomy and position and estimate delivered dose [15–18]. However, post-treatment CBCT will introduce excessive dose, and is only a snapshot of the patient after treatment. If a patient’s final anatomy or position was not the same as the initial status, both post-treatment CBCT and VMAT-CT could detect the change, but post-treatment CBCT would not be able to show how exactly the patient moved or deformed during the treatment, while VMAT-CT could give an average result of the movement. Depending on how blurry the VMAT-CT was, one can tell if there was one or multiple sudden moves or continuous movement and deformation. If the patient moved or deformed but his final status happened to be the same as the initial one, post-treatment CBCT would not be able to detect the move while VMAT-CT could.
Notice the way we evaluated the impact of uncertainty from rigid or deformable registration on dose. These dose uncertainties may not apply to other geometry or plan since it is specific to a given phantom or plan, and we presented them to show typically what the potential dose uncertainty could be.
One limitation of this study is image quality. One possible improvement could be the sampling rate of acquisition of EPID images. The sampling rate in this study, which is the sampling rate of Elekta Versa, was 4 frames per second. Considering MLCs in the new model of linac head are moving faster, the projection images will be less blurry and more high-quality images can be collected with faster sampling rate and therefore reconstruction image quality can be improved. In the future, iterative reconstruction methods can also be explored to compensate for less information provided the same machine parameters. In this study, we only considered 3D VMAT patients who most likely will accidentally shift or rotate their bodies during treatment, or have stepwise deformations, e.g. variation of lung anatomy in breath-hold patients. In a subsequent 4D VMAT-CT study, we do consider continuous and periodic movements and deformations in lung cases, which is a totally different scenario than the current study.
In conclusion, VMAT-CT was reconstructed under more stringent conditions, dose was calculated with in-treatment geometry, and ART was carried out when prescription dose was not met. Overall VMAT-CT can be a very promising tool for patient positioning, tumor targeting, normal tissue sparing and treatment QA without introducing any extra dose.
Supplementary Material
Acknowledgement
This work was partially supported by National Institutes of Health (grant no. K22CA204464).
Footnotes
Publisher's Disclaimer: This is a PDF file of an unedited manuscript that has been accepted for publication. As a service to our customers we are providing this early version of the manuscript. The manuscript will undergo copyediting, typesetting, and review of the resulting proof before it is published in its final form. Please note that during the production process errors may be discovered which could affect the content, and all legal disclaimers that apply to the journal pertain.
Declaration of Competing Interest
None.
References
- [1].Liang B, Liu B, Zhou F, Yin FF and Wu Q. Comparisons of volumetric modulated arc therapy (VMAT) quality assurance (QA) systems: sensitivity analysis to machine errors. Radiat Oncol 2016;11:146. [DOI] [PMC free article] [PubMed] [Google Scholar]
- [2].Ling CC, Zhang P, Archambault Y, Bocanek J, Tang G and Losasso T. Commissioning and quality assurance of RapidArc radiotherapy delivery system. Int J Radiat Oncol Biol Phys 2008;72:575–581. [DOI] [PubMed] [Google Scholar]
- [3].Verellen D, De Ridder M, Linthout N, Tournel K, Soete G and Storme G. Innovations in image-guided radiotherapy. Nat Rev Cancer 2007;7:949–960. [DOI] [PubMed] [Google Scholar]
- [4].Murphy MJ, Balter J, Balter S, et al. The management of imaging dose during image-guided radiotherapy: report of the AAPM Task Group 75. Med Phys 2007;34:4041–4063. [DOI] [PubMed] [Google Scholar]
- [5].Mijnheer B, Beddar S, Izewska J and Reft C. In vivo dosimetry in external beam radiotherapy. Med Phys 2013;40:070903. [DOI] [PubMed] [Google Scholar]
- [6].Tyagi N, Yang K, Gersten D and Yan D. A real time dose monitoring and dose reconstruction tool for patient specific VMAT QA and delivery. Med Phys 2012;39:7194–7204. [DOI] [PubMed] [Google Scholar]
- [7].Defoor DL, Vazquez-Quino LA, Mavroidis P, Papanikolaou N and Stathakis S. Anatomy-based, patient-specific VMAT QA using EPID or MLC log files. J Appl Clin Med Phys 2015;16:5283. [DOI] [PMC free article] [PubMed] [Google Scholar]
- [8].Mans A, Remeijer P, Olaciregui-Ruiz I, et al. 3D Dosimetric verification of volumetric-modulated arc therapy by portal dosimetry. Radiother Oncol 2010;94:181–187. [DOI] [PubMed] [Google Scholar]
- [9].Poludniowski G, Thomas MD, Evans PM and Webb S. CT reconstruction from portal images acquired during volumetric-modulated arc therapy. Phys Med Biol 2010;55:5635–5651. [DOI] [PubMed] [Google Scholar]
- [10].Kida S, Saotome N, Masutani Y, et al. 4D-CBCT reconstruction using MV portal imaging during volumetric modulated arc therapy. Radiother Oncol 2011;100:380–385. [DOI] [PubMed] [Google Scholar]
- [11].Wendling M, Zijp LJ, McDermott LN, et al. A fast algorithm for gamma evaluation in 3D. Med Phys 2007;34:1647–1654. [DOI] [PubMed] [Google Scholar]
- [12].Li XA. Adaptive Radiation Therapy. Boca Raton, FL: CRC Press, 2011. [Google Scholar]
- [13].Brock KK, Mutic S, McNutt TR, Li H and Kessler ML. Use of image registration and fusion algorithms and techniques in radiotherapy: Report of the AAPM Radiation Therapy Committee Task Group No. 132. Med Phys 2017;44:e43–e76. [DOI] [PubMed] [Google Scholar]
- [14].Woerner AJ, Choi M, Harkenrider MM, Roeske JC and Surucu M. Evaluation of Deformable Image Registration-Based Contour Propagation From Planning CT to Cone-Beam CT. Technol Cancer Res Treat 2017:1533034617697242. [DOI] [PMC free article] [PubMed] [Google Scholar]
- [15].Yin FF, Wang Z, Yoo S, et al. Integration of cone-beam CT in stereotactic body radiation therapy. Technol Cancer Res Treat 2008;7:133–139. [DOI] [PubMed] [Google Scholar]
- [16].Purdie TG, Bissonnette JP, Franks K, et al. Cone-beam computed tomography for on-line image guidance of lung stereotactic radiotherapy: localization, verification, and intrafraction tumor position. Int J Radiat Oncol Biol Phys 2007;68:243–252. [DOI] [PubMed] [Google Scholar]
- [17].Lambrecht M, Melidis C, Sonke JJ, et al. Lungtech, a phase II EORTC trial of SBRT for centrally located lung tumours - a clinical physics perspective. Radiat Oncol 2016;11:7. [DOI] [PMC free article] [PubMed] [Google Scholar]
- [18].Sonke JJ, Rossi M, Wolthaus J, van Herk M, Damen E and Belderbos J. Frameless stereotactic body radiotherapy for lung cancer using four-dimensional cone beam CT guidance. Int J Radiat Oncol Biol Phys 2009;74:567–574. [DOI] [PubMed] [Google Scholar]
Associated Data
This section collects any data citations, data availability statements, or supplementary materials included in this article.


