Abstract
Activity-based protein profiling (ABPP) has been used extensively to discover and optimize selective inhibitors of enzymes. Here, we show that ABPP can also be implemented to identify the converse – small-molecule enzyme activators. Using a kinetically controlled, fluorescence polarization-ABPP assay, we identify compounds that stimulate the activity of LYPLAL1 – a poorly characterized serine hydrolase with complex genetic links to human metabolic traits. We apply ABPP-guided medicinal chemistry to advance a lead into a selective LYPLAL1 activator suitable for use in vivo. Structural simulations coupled to mutational, biochemical, and biophysical analyses indicate that this compound increases LYPLAL1’s catalytic activity likely by enhancing the efficiency of the catalytic triad charge-relay system. Treatment with this LYPLAL1 activator confers beneficial effects in a mouse model of diet-induced obesity. These findings reveal a new mode of pharmacological regulation for this large enzyme family and suggest that ABPP may aid discovery of activators for additional enzyme classes.
Serine hydrolases constitute one of the largest and most diverse enzyme class in mammals, where they perform crucial roles in many biological processes1,2. In spite of their central role in physiology, nearly half of the ~240 human serine hydrolases remain unannotated, with no described function or identified substrates, and lacking chemical tools to aid their characterization. In cases where deep knowledge has been gained on serine hydrolase function, this information has not only advanced our fundamental understanding, but also led to new therapies to treat disease. For instance, inhibitors of dipeptidylpeptidase 4 (DPP4) are used in the treatment of type 2 diabetes3, and pancreatic lipase (PNLIP) inhibitors are approved to treat obesity4.
Activity-based protein profiling is a chemoproteomic strategy that utilizes small-molecule probes to readout the functional state of enzymes directly in native systems. ABPP takes advantage of the common mechanistic features of large enzyme families to design small-molecule probes that covalently bind their active sites5–8. Activity-based probes contain a reactive group that interacts with the active sites of enzymes and a reporter tag (fluorophore, biotin) for detection, enrichment, and identification of probe-labeled enzymes9–12. Because these probes label active enzymes, but not their inactive forms, ABPP has been effectively applied to profile enzyme activities across cell types and tissues, and to detect differences between normal and diseased states13,14. ABPP has also been configured to operate in a competitive mode to screen for enzyme inhibitors15,16. Competitive ABPP enables the development of enzyme inhibitors for uncharacterized enzymes that lack known substrates without the need for recombinant expression or purification. Further, because compounds can be tested in native proteomes against many enzymes in parallel, selective agents can be readily distinguished from non-specific compounds. Competitive ABPP has also been adapted for high-throughput screening in assays that monitor enzyme-probe interactions by fluorescence polarization17. Since the introduction of competitive ABPP for inhibitor discovery, a multitude of selective agents have been developed to aid functional characterization of serine hydrolases, catalyzing a transformation in our understanding of this family18.
In spite of these advances, the role and substrates of many important serine hydrolases remain to be uncovered. A vexing example is the enzyme Lysophospholipase-like 1 (LYPLAL1). Multiple genome-wide association studies (GWAS) have linked DNA variants near this locus with human metabolic traits, including adiposity, fat distribution, waste-to-hip ratio, Type 2 diabetes, fasting insulin, adiponectin levels, plasma triglycerides, HDL cholesterol levels, and nonalcoholic fatty liver disease (NAFLD)19–31. Unfortunately, as is often the case in GWAS studies, all variants fall outside the LYPLAL1 coding region and thus do not inform if the risk alleles are linked to gain or loss of enzyme activity. Genetic knockdown and overexpression studies in mouse adipocytes have shown that alterations in LYPLAL1 activity do not directly impact adipocyte differentiation or lipid accumulation in this cell type32. An initial analysis of global LYPLAL1 null mice failed to detect a metabolic phenotype, even when mutants were challenged with a high-fat diet33. A more recent study reported a sex-specific increase in body fat in LYPLAL1 null females fed a high-fat diet, suggesting that LYPLAL1 activity may protect against diet-induced obesity34. Consistent with this finding, treatment with a potent and selective LYPLAL1 inhibitor developed using ABPP-directed optimization, was shown to increase glucose production in human, mouse, and rat primary hepatocytes, a property that if observed in vivo would exacerbate metabolic deterioration35. This observation suggests that LYPLAL1 inhibition likely would be detrimental rather than beneficial for the treatment of metabolic conditions such as diabetes and NAFLD. It also hints that increased expression or, more attractively, pharmacological stimulation of LYPLAL1 activity may favorably impact glucose production and ameliorate metabolic dysfunction. To date, competitive ABPP has been used exclusively to identify enzyme inhibitors, but we reasoned that its versatility may also enable the identification of small-molecule enzyme activators and set out to test this potential with LYPLAL1.
Here, we harnessed competitive ABPP to identify and develop small-molecule activators of LYPLAL1. We demonstrate that these compounds act by directly increasing the catalytic efficiency of LYPLAL1. We further show that treatment of obese-insulin resistant mice with a LYPLAL1 activator enhanced glucose tolerance and increased insulin sensitivity, ameliorating key features of metabolic syndrome. Our findings reveal a new mode of small-molecule modulation for serine hydrolases, suggest that pharmacological activation of LYPLAL1 may be of benefit in obesity-diabetes, and, more generally, indicate that ABPP may be useful to identify activators for members of other medically-important enzyme families.
Results
ABPP-enabled isolation of a selective LYPLAL1 activator
We developed a kinetically controlled ABPP-based fluorescence polarization assay (Fluopol-ABPP17) amenable to high-throughput screening to identify bidirectional modulators (i.e. activators or inhibitors) of LYPLAL1 activity. In this assay, reaction of a rhodamine-tagged fluorophosphonate (FP) probe with LYPLAL1 results in a time-dependent increase in fluorescence polarization signal that reflects enzyme activity as measured by covalent binding of the FP probe to the catalytic serine in LYPLAL1 (Extended Data Fig. 1a). FP probes show broad reactivity with serine hydrolases, labeling >80% of the predicted mouse metabolic serine hydrolases18. Fluopol-ABPP screens have previously yielded first-in-class inhibitors for numerous serine hydrolases36. A screen of the Maybridge Hitfinder Collection (16,000 molecules) using purified mLYPLAL1 yielded multiple compounds that decreased fluorescence polarization and are likely LYPLAL1 inhibitors (Extended Data Fig. 1b; Online Methods; Supplementary Table 1). Interestingly, we noted that many other compounds increased the fluorescence polarization signal, suggesting that they could be acting as gain-of-function ligands or activators. Intrigued by this finding, we selected a set of these compounds, together with some putative inhibitors, for gel-based ABPP analysis. These studies showed that several compounds increased the intensity of the ABPP signal for LYPLAL1, confirming their ability to enhance reaction of FP-rhodamine with the enzyme’s active site (Extended Data Fig. 2). We prioritized one of these putative LYPLAL1 activators for more extensive characterization.
This compound is represented as structure 1 in the screening library (Maybridge HTS10720; Fig. 1a) and is also commercially available (e.g., Ambinter, Amb2745087; Aurora, K13.701.587). We confirmed that the compounds supplied by Maybridge, Ambinter, and Aurora as structure 1 are identical spectroscopically and chromatographically. Our own synthesis of this putative structure from 2 by sulfonylation of 3 with dihydrobenzofuran-5-sulfonyl chloride produced the identical material (Fig. 1a). However, as we prepared analogues of this compound, their spectroscopic properties led us to question the structural assignment of 1. Lack of an acidic sulfonamide NH proton in the 1H NMR spectrum and the observation of a single broad singlet that integrated for two hydrogens (-NH2 vs. two distinguishable -NH) suggested a structural misassignment for 1. A single crystal X-ray structure determined with synthetic material early in our studies revealed that it possesses the isomeric structure 4, the result of sulfonylation on the N1 ring nitrogen of the 1,2,4-triazole rather than the exocyclic C5 amino group (Fig. 1b). This finding was confirmed with single crystal X-ray structure determinations of four additional compounds prepared in our series (see Supplementary Note), establishing the generality of the N1 versus exocyclic C5 amine sulfonylation and excluding sulfonylation at N2 or N4. There are many related compounds in commercial screening collections that are likely similarly misidentified, including not only the sulfonylation products of 3 and its congeners, but also their acylation products.
Figure 1. Structure of a small-molecule activator of LYPLAL1.
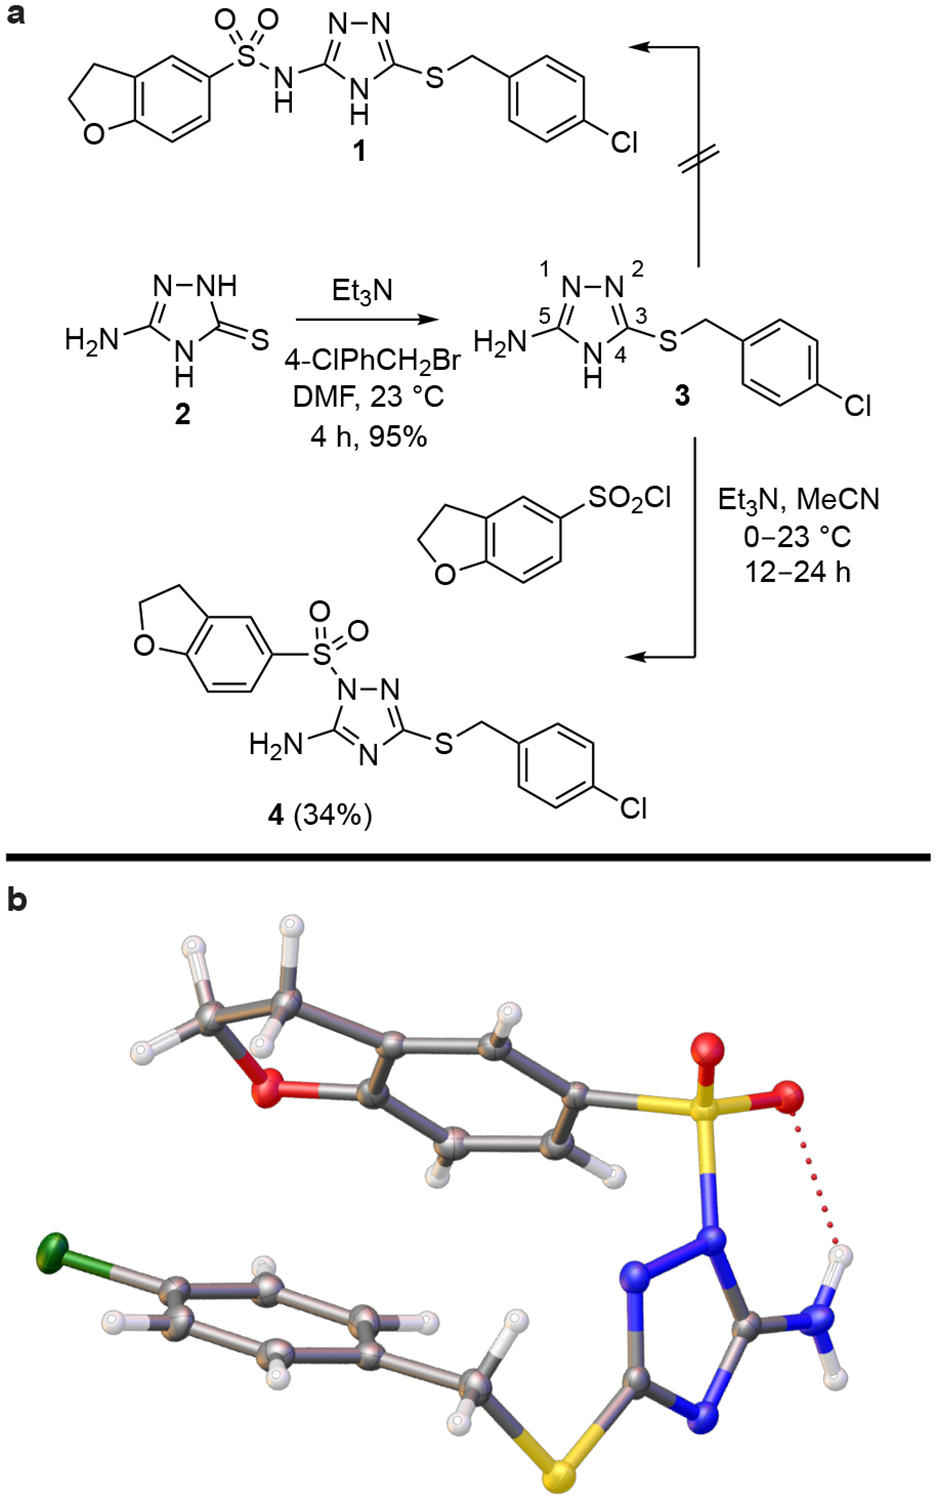
(a) Synthesis of 4 (or PAL-4). This compound is misidentified as structure 1 in commercial screening libraries. (b) Correct structure of 4 established by X-ray analysis.
When analyzed by gel-based ABPP, 4 (which we have named PAL-4 for Pharmacological Activator of LYPLAL1–4) produced a concentration-dependent ~2.5 and 2.3-fold enhancement in FP-rhodamine labeling of purified mLYPLAL1 and hLYPLAL1, with EC50 values of 0.39 μM and 0.49 μM, respectively (Fig. 2a–c). Because this increase in activity is observed in an assay that employs only the pure enzyme at a fixed concentration, it suggests direct binding of 4 is responsible for the enhancement of LYPLAL1 activity. This assay also rules out the possibility that 4 exerts its effects by increasing LYPLAL1 expression or by binding to an inhibitory protein to release the active enzyme. Gel filtration studies indicated that, in contrast to many existing covalent serine hydrolase inhibitors, 4 acts in a reversible manner (Fig. 2d). To verify that the enhanced FP-reactivity promoted by 4 translated into increased LYPLAL1 catalytic activity, we tested the effect of 4 on LYPLAL1 turnover of the synthetic substrate 4-nitrophenyl acetate (PNPA)37. Incubation of purified human or mouse LYPLAL1 with 4 increased PNPA hydrolysis by 1.6–1.8-fold (Fig. 2e). Next, to assess the extent to which 4 would be active in the complex proteome of cells, where competitive binding to other proteins might adversely impact enzyme binding and activation, we evaluated the activity and selectivity of 4 in native biological systems using mass spectrometry (MS)-based ABPP methods. Treatment of HepG2 cell lysates with 4 (10 μM) for 1 h prior to incubation with an FP-alkyne probe and MS-based proteomic analysis revealed a selective increase in LYPLAL1 activity, while the other 49 serine hydrolases quantified in these experiments were unaffected, including the enzyme most closely related to LYPLAL1 (LYPLA1 also known as APT1; Fig. 2f). Together, these findings indicate that 4 is a potent, selective, reversible activator of LYPLAL1.
Figure 2. Characterization of a small-molecule activator of LYPLAL1.
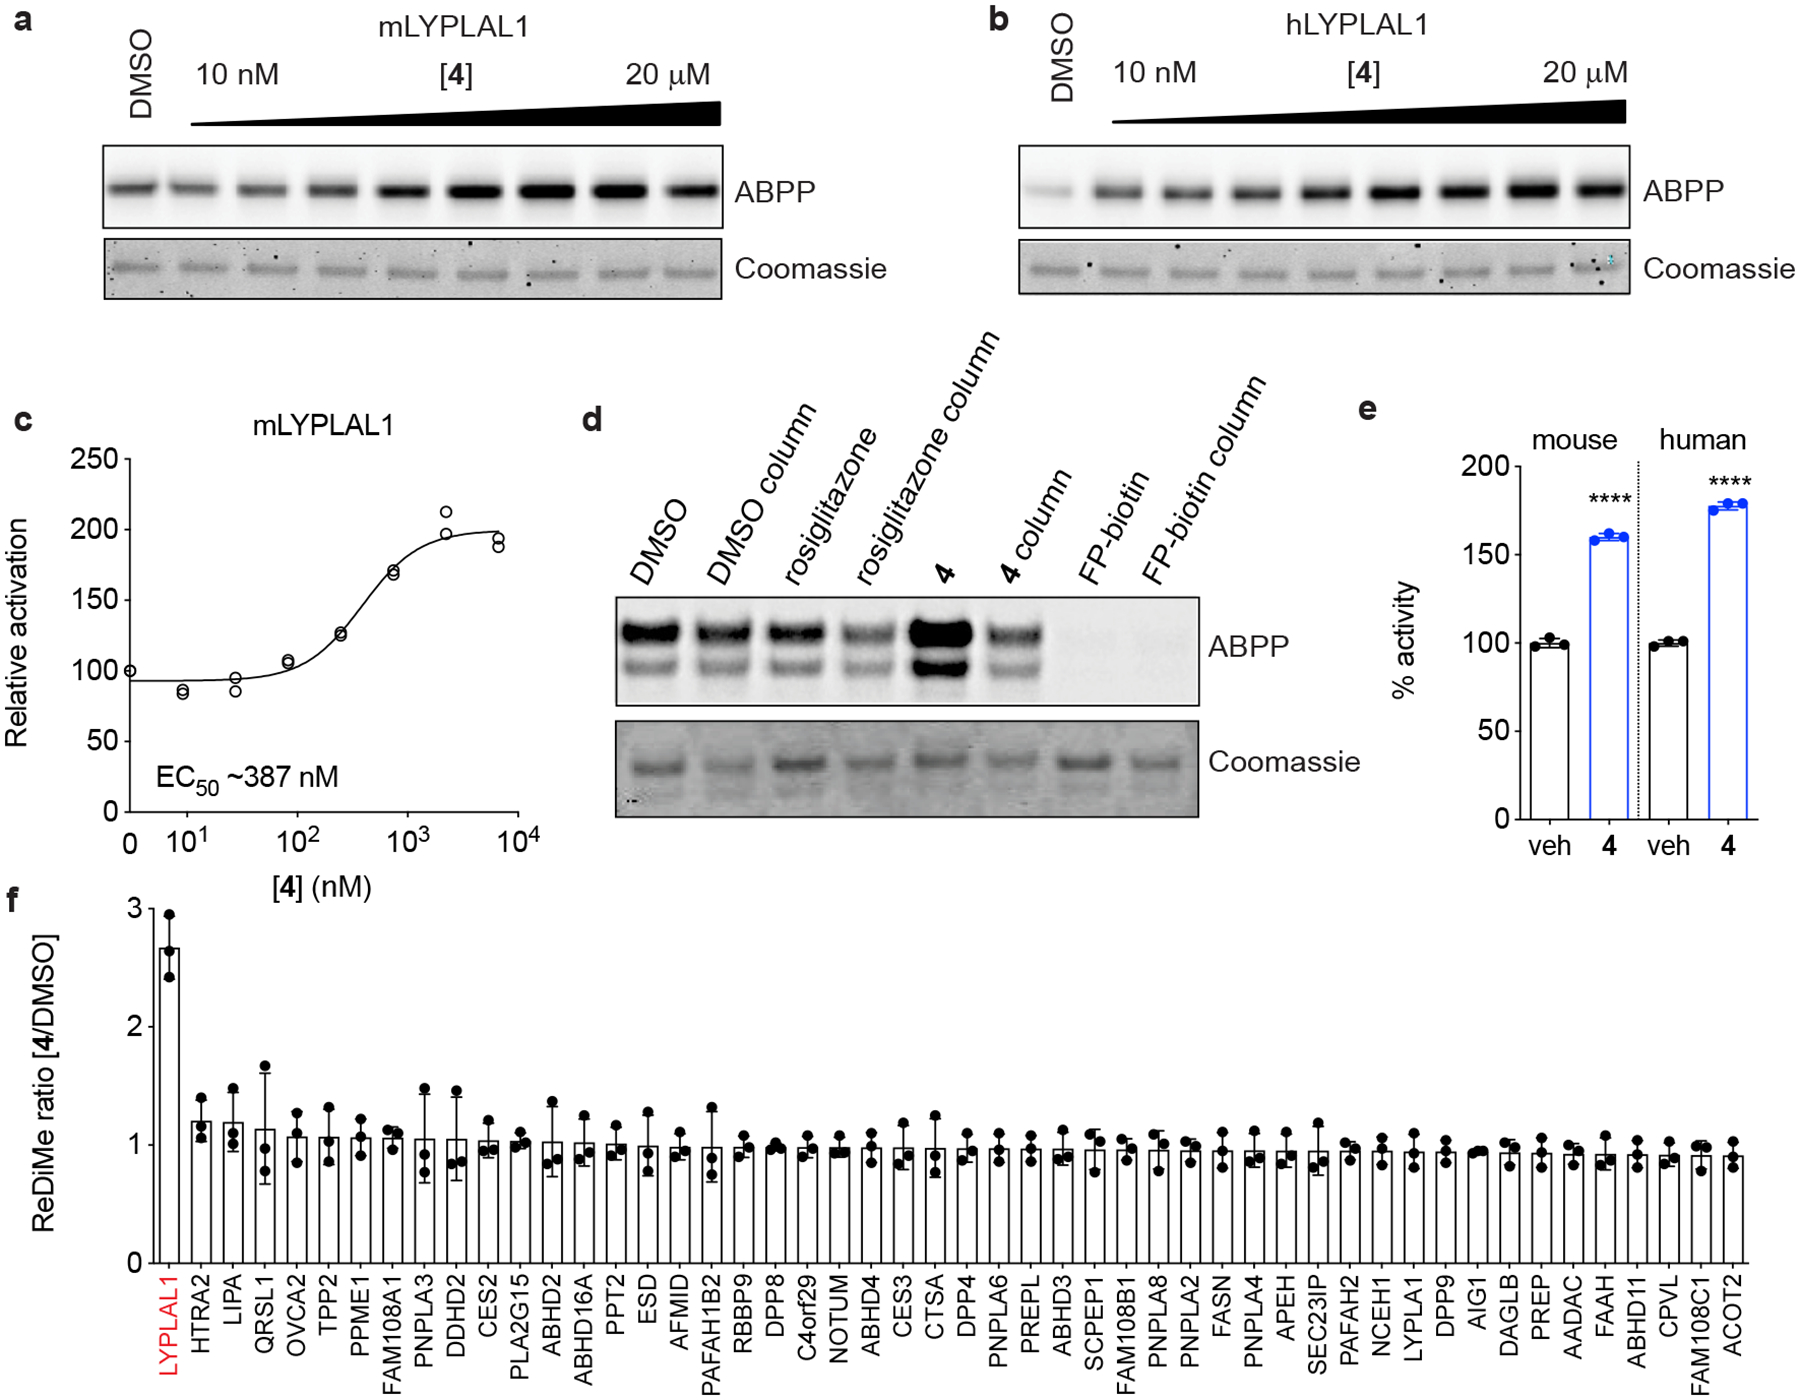
Purified (a) mouse or (b) human LYPLAL1 protein was incubated with increasing concentrations of 4 prior to labeling with FP-rhodamine and gel-based ABPP analysis. (c) Quantification of a dose response of 4 on mLYPLAL1 (n=2). (d) mLYPLAL1 was incubated with DMSO, 10 μM 4, 10 μM rosiglitazone (negative control) or 10 μM FP-biotin (covalent inhibitor). Reactions were split, and half the volume passed through a gel filtration column prior to labeling with FP-rhodamine and gel-based ABPP analysis. Loss of increased FP-rhodamine labeling in the gel filtration sample shows that 4 is a reversible activator. (e) Compound 4 (10 μM) increases the ability of mouse and human LYPLAL1 to hydrolyze the synthetic substrate PNPA (4-nitrophenyl acetate) (n=3; ****p<0.0001 two-tailed t-test). (f) Compound 4 selectively activates endogenous LYPLAL1. Total proteomes from HepG2 cells were treated with 10 μM 4 for 1 h and then labeled with FP-alkyne for 20 min prior to attachment of an azide-biotin tag and ABPP-MudPIT analysis (n=3). Error bars represent mean ± s.d. Representative results from two (d-f) or three (a-c) independent experiments; similar results were obtained in all experiments. In c, e, and f, n represents independent samples. Uncropped gels/blots for a, b, and d are shown in Supplementary Fig. 6.
ABPP-directed lead exploration
To our knowledge, identification of 4 represents the first report of enzyme activation by a small molecule detected using ABPP. Further, 4 may constitute the first example of small-molecule-induced enhancement of enzymatic activity for a serine hydrolase, a large and medically relevant enzyme family. To probe the basis of this atypical mode of regulation for serine hydrolases, we set out to define the structural features of 4 responsible for LYPLAL1 activation. We performed an initial structure-activity relationship (SAR) study of nearly 90 analogues of 4 to explore and improve on this activity, testing compounds with purified mLYPLAL1, often with additional evaluation against purified hLYPLAL1 (Supplementary Information). To date, no significant differences in compound-induced activity between mLYPLAL1 and hLYPLAL1 have been observed. Compounds were prepared by approaches identical to that detailed for 4 in Fig. 1a and involved sulfonylation or acylation of 3 or related 5-amino-1,2,4-triazoles as the last step (Supplementary Note). The C3 4-chlorobenzylthio group proved key to the activity of the compounds. Replacement of the sulfur atom (S) in the linker to the 4-chlorobenzyl group with a nitrogen (NH), a methylene (CH2), NHCH2, or CH2CH2 yielded compounds that were much less active or inactive (Supplementary Fig. 1). Removal of the 4-chloro substituent of 4 led to a substantial (>10–40 fold) reduction in potency and its replacement with even conservative alternative substituents also reduced this activity (potency: Cl > Br > I > Me > NO2 > H; Supplementary Fig. 2). Clear from the full series examined was that: (1) the sulfur atom in the linker was required, (2) the phenyl group was similarly required for activity, (3) not all closely related thiobenzyl substituents conveyed activity (Supplementary Fig. 3), and (4) the 4-chloro substituent on the benzyl group substantially enhanced potency and was the most effective substituent examined. In contrast, the N1 sulfonamide proved to be a group that could be modified, preserving or improving the potency (EC50) and efficacy (fold increase relative to vehicle) of compounds (Fig. 3). Although a simple methylsulfonamide was inactive, larger aliphatic and a cyclohexyl sulfonamide were active with the latter nearly matching the activity of 4 (Supplementary Fig. 4). Similarly, phenylsulfonamide 5 nearly matched the potency and efficacy of 4 (Fig. 3). A range of substituted phenylsufonamides displayed good activity that was widely tolerant of the nature (electron-withdrawing or electron-donating), size, polarity, and position of the added substituent (Supplementary Fig. 4). Typically, substituents at the meta position were better tolerated and often led to greater increases in activity (e.g., 7 vs. 6). Many such compounds, including 7-10, exhibited improved potencies (EC50 = 0.19, 0.16, 0.35 and 0.37 μM) and greater extent of activation (2.7, 3.1, 2.7 and 3.1-fold) relative to 4. Bicyclic aromatic sulfonamides, and mono and bicyclic heterocyclic sulfonamides were also generally, but not always, tolerated (Supplementary Fig. 4). The latter bicyclic heterocyclic series typically matched or exceeded the potency of 4 (Supplementary Fig. 4), with several compounds (11-14) markedly surpassing the potency of 4 (EC50 = 60–250 nM) and yielding a greater extent of LYPLAL1 activation (2.7–2.9 fold; Fig. 3). A series of N1 amides versus sulfonamides were also tested and all were found to be inactive (Supplementary Fig. 5 and Supplementary Table 2), indicating that the sulfonamide moiety plays an integral role in modulation of enzyme activation.
Figure 3. Summary of findings from Structure-Activity Study.
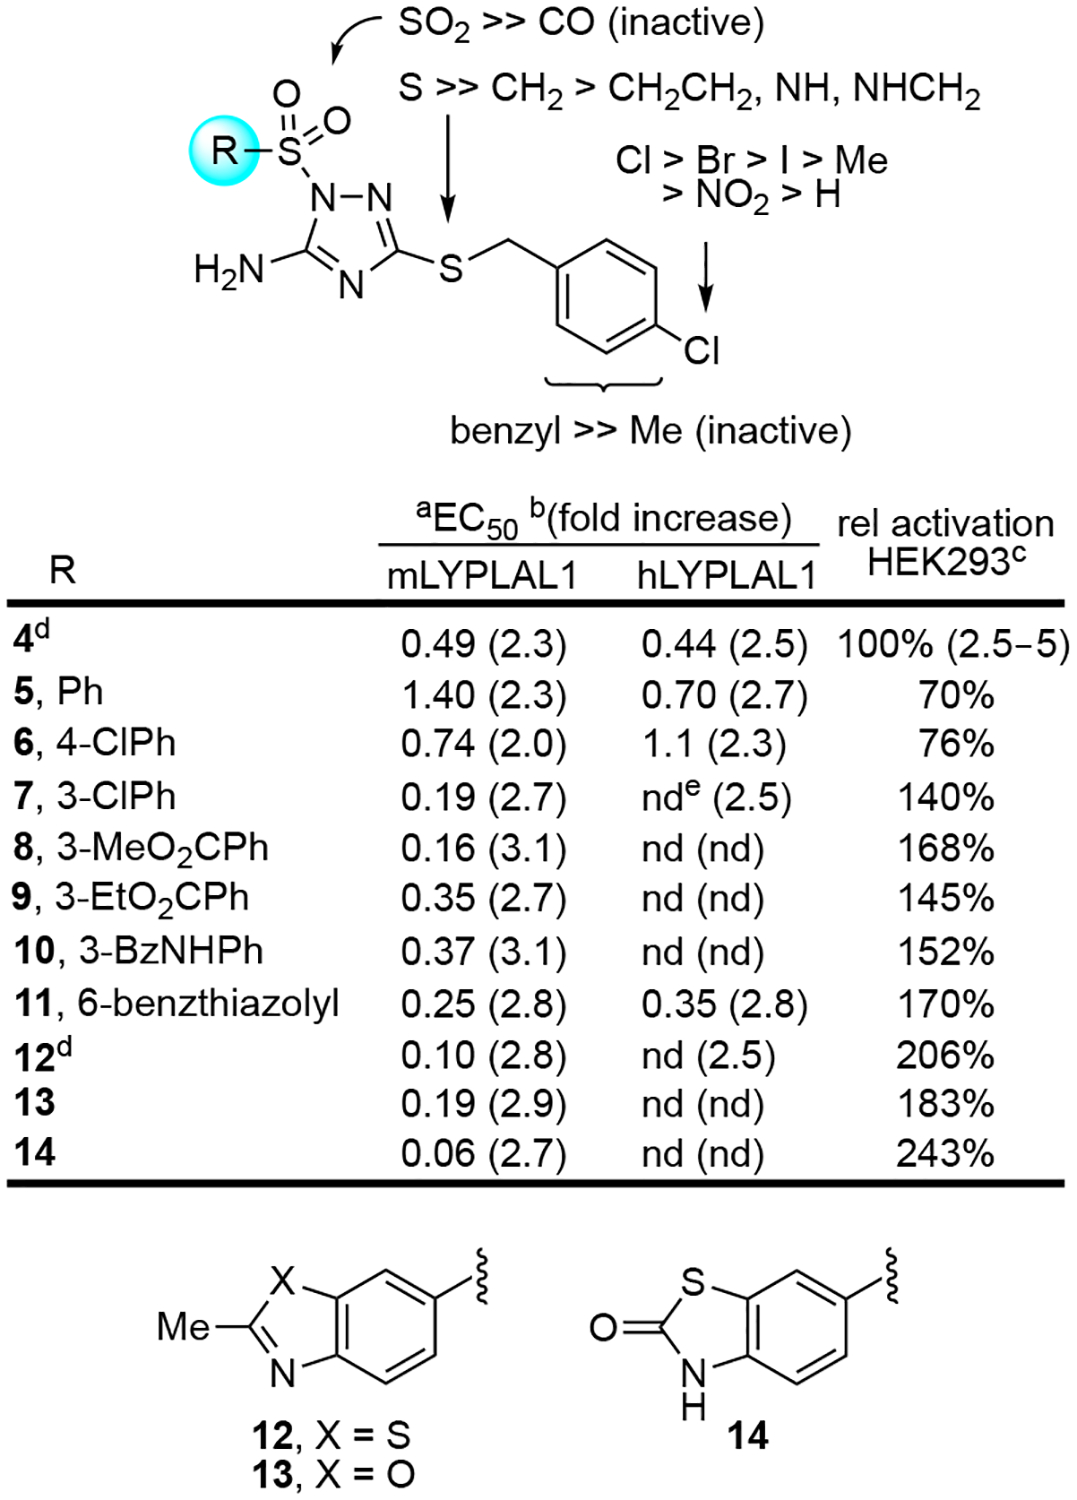
Overview of SAR and data on key compounds to emerge from the study of >70 analogues of 4 (see Supplementary Information). Compounds were evaluated in dose response mode against purified mouse and human LYPLAL1, and at 10 μM against mLYPLAL1 overexpressed in HEK293 cells. aEC50 (μM); bfold increase in FP-rhodamine labeling of LYPLAL1 assessed by gel-based ABPP; crelative activation of mLYPLAL1 overexpressed in HEK293 cells expressed as a percentage of the effect of 4; dstructure determined by X-ray; enot determined. ABPP data shown is representative of two or more independent experiments that yielded similar results.
We next examined 4 and selected analogues (Fig. 3) in an assay in which mLYPLAL1 was overexpressed in HEK293 cells and compound-mediated activation of the enzyme examined in proteome collected from transfected cells. This assay was conducted at a single concentration of compound (10 μM) under defined conditions where 4 was found to display substantial activity, generating a prominent increase (typically 3 to 5-fold) in FP-rhodamine labeling of the gel band corresponding to mLYPLAL1 (Fig. 4a). Interestingly, all compounds, including 4, were found to enhance LYPLAL1 activity more effectively in the complex proteome than when tested with purified enzyme. The activity of compounds in this assay was normalized to the activity displayed by 4 (100%, 3 to 5-fold activation), with results in the HEK293 proteome following those observed with the purified enzyme. The more potent and efficacious analogues (7-14) exceeded the activity of 4 observed under these conditions and several additional analogues also further differentiated themselves from 4 (Fig. 3, 4a and Supplementary Fig. 4). Impressive improvements were observed with 8–11 and especially 12-14, which displayed substantially greater efficacy of mLYPLAL1 activation than 4 in the complex proteome (Fig. 3, 4a). To assess the extent to which these analogues of 4 retained proteome-wide selectivity, we profiled one of the more potent ones, 12 (which we have named PAL-12 for Pharmacological Activator of LYPLAL1–12), on HepG2 cell lysates prior to labeling with an FP-alkyne probe and MS-based proteomic analysis. 12 increased LYPLAL1 activity 4-fold without affecting the activity of 55 other serine hydrolases quantified in these experiments (Fig. 4b). Differential scanning fluorimetry thermal stability assays (nanoDSF) confirmed that, as expected, 12 interacts with purified LYPLAL1 with greater affinity than 4 (Fig. 4c). Interestingly, incubation of either 4 or 12 with recombinant mLYPLAL1 decreased the enzyme’s thermal stability, an effect that was not seen with 80, an inactive control (Fig. 4c and Extended Data Fig. 3).
Figure 4. Optimization of LYPLAL1 activators.
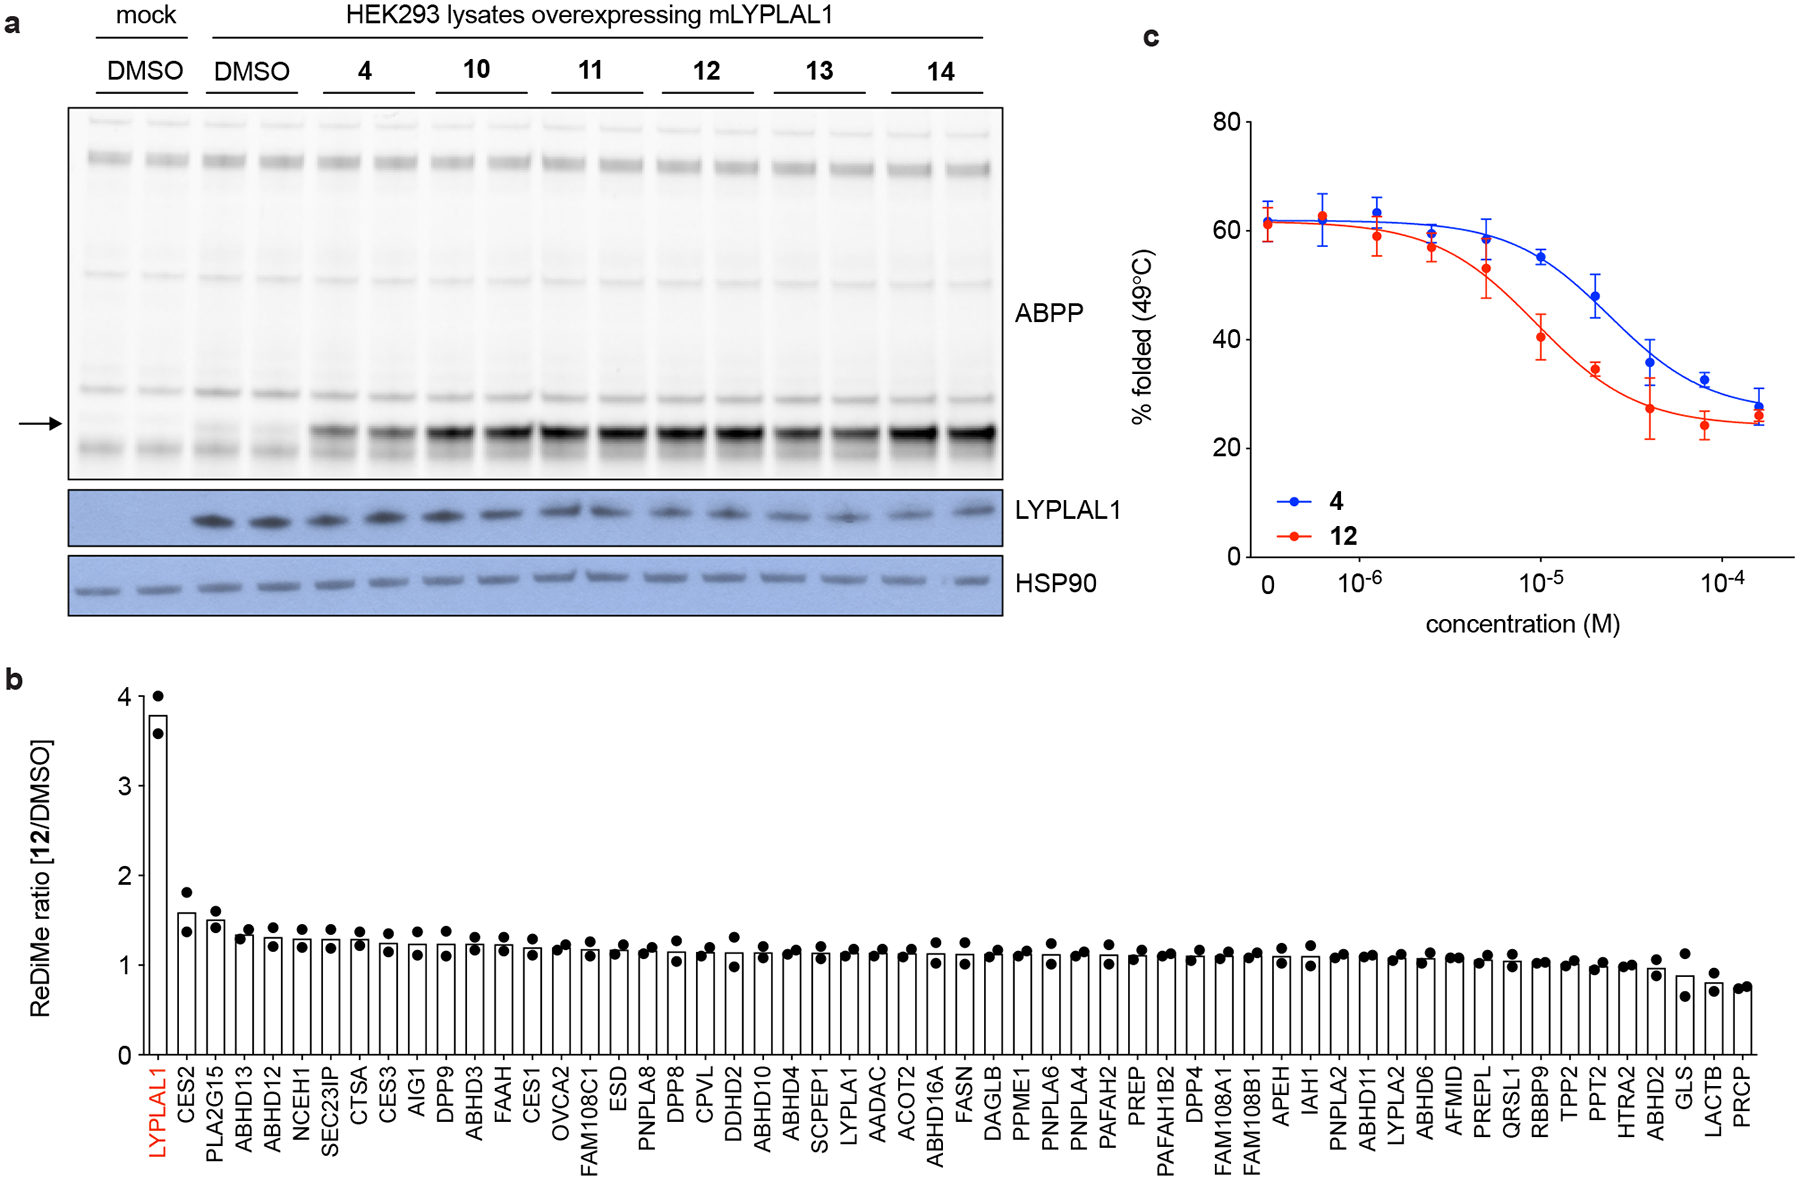
(a) Representative analogues of 4 that display greater potency and efficacy on LYPLAL1 overexpressed in HEK293 cells, as assessed by gel-based ABPP. Western blots of LYPLAL1 and HSP90 (loading control) are shown in the bottom panels. (b) Endogenous LYPLAL1 is selectively activated in total HepG2 proteomes treated with 10 μM 12 (or PAL-12) for 1 h and then labeled with FP-alkyne for 20 min prior to attachment of an azide-biotin tag and ABPP-MudPIT analysis (n=2, where n represents independent samples). (c) Thermal stability profiles of purified mLYPLAL1 (at 49°C) show that interaction with increasing concentrations of 4 and 12 increase the protein’s flexibility (n=3 per group, where n represents independent experiments). Error bars represent mean ± s.d. Representative results from two (b) or three (c) independent experiments; similar results were obtained in all experiments. Uncropped gels/blots for a are shown in Supplementary Fig. 6.
Mode of pharmacological activation of LYPLAL1
To investigate the molecular underpinnings of small molecule-induced LYPLAL1 activation, we performed kinetic assays using the synthetic substrate 4-methylumbelliferyl acetate (4-MUA). 12, and to a lesser extent 4, both increased the catalytic efficiency of purified mLYPLAL1, as reflected in compound-induced decreases in the Km value and increases in the Vmax value, for the enzyme (Fig. 5a; vehicle : Km = 2385.02, Vmax = 64.96; 4: Km = 878.69, Vmax = 84.50; 12: Km = 607.83, Vmax = 142.65). To probe the basis of this effect, we performed Molecular Dynamics (MD) simulations of wild type (WT) hLYPLAL1 (PDB 3U0V)37. Distance analysis uncovered three key residues within ~6 Å of the catalytic triad (formed by Ser124, Asp179, and His211) with the potential to coordinate proximal electrostatic interactions: Ser30, Arg80, and Ser148 (Fig. 5b). Because all three residues are located in solvent-exposed loops, we posited that binding of the small-molecule activators might induce conformational changes in these loops that could increase the enzyme’s catalytic efficiency by, for instance, improving substrate accessibility or stabilizing the catalytic triad. Mutation of Ser30 and Ser148 into alanine decreased LYPLAL1 activity and expression respectively, but the mutants retained the ability to respond to 12 (Fig. 5c). Notably, mutation of Arg80 located on the β5-α2 loop to either alanine or phenylalanine drastically increased the basal activity of LYPLAL1 (Fig. 5c), mimicking the effect of the small-molecule activators. In these mutants, the effect of 12 was largely abolished (Fig. 5c). Considering the importance of Asp179 in the charge-relay network for His211 activation, we examined Asp179-His211 distances in MD simulations of the Arg80 mutants and noted a more stable hydrogen interaction (≤ 3.2 Å) between Asp179 and His211, present 15% of the simulation time for R80A and R80F vs. 6% for WT (Fig. 5d, Extended Data Fig. 4a). These data suggest that activation of LYPLAL1, induced by either a small molecule or by mutagenesis, might be driven by stabilization of the Asp179-containing β8-α5 loop to enhance His211 activation in the enzymatic charge-relay system. In view of our experimental data, we hypothesized that LYPLAL1 activators could be binding to the β5-α2 region and thus affecting the proximity of the Arg80-containing loop to the enzyme’s active site. The structure of the highly homologous LYPLA1 (PDB 5SYM) shows inhibitor binding in this region38. However, co-solvent MD simulations of WT hLYPLAL1 using chlorobenzene fragments (an essential moiety common to the most effective activators) as probes identified several binding hotspots, but none located near the β5-α2 loop (Fig. 5b and Extended Data Fig. 4b). This data suggests that 12 and other activators may act as allosteric modulators of catalytic activity by altering the hydrogen bond network of the catalytic triad, mimicking the effect of Arg80 mutants. Further studies will be required to characterize the precise binding mode of the activators.
Figure 5. Key non-catalytic residues regulate LYPLAL1 activity and pharmacological activator efficacy.
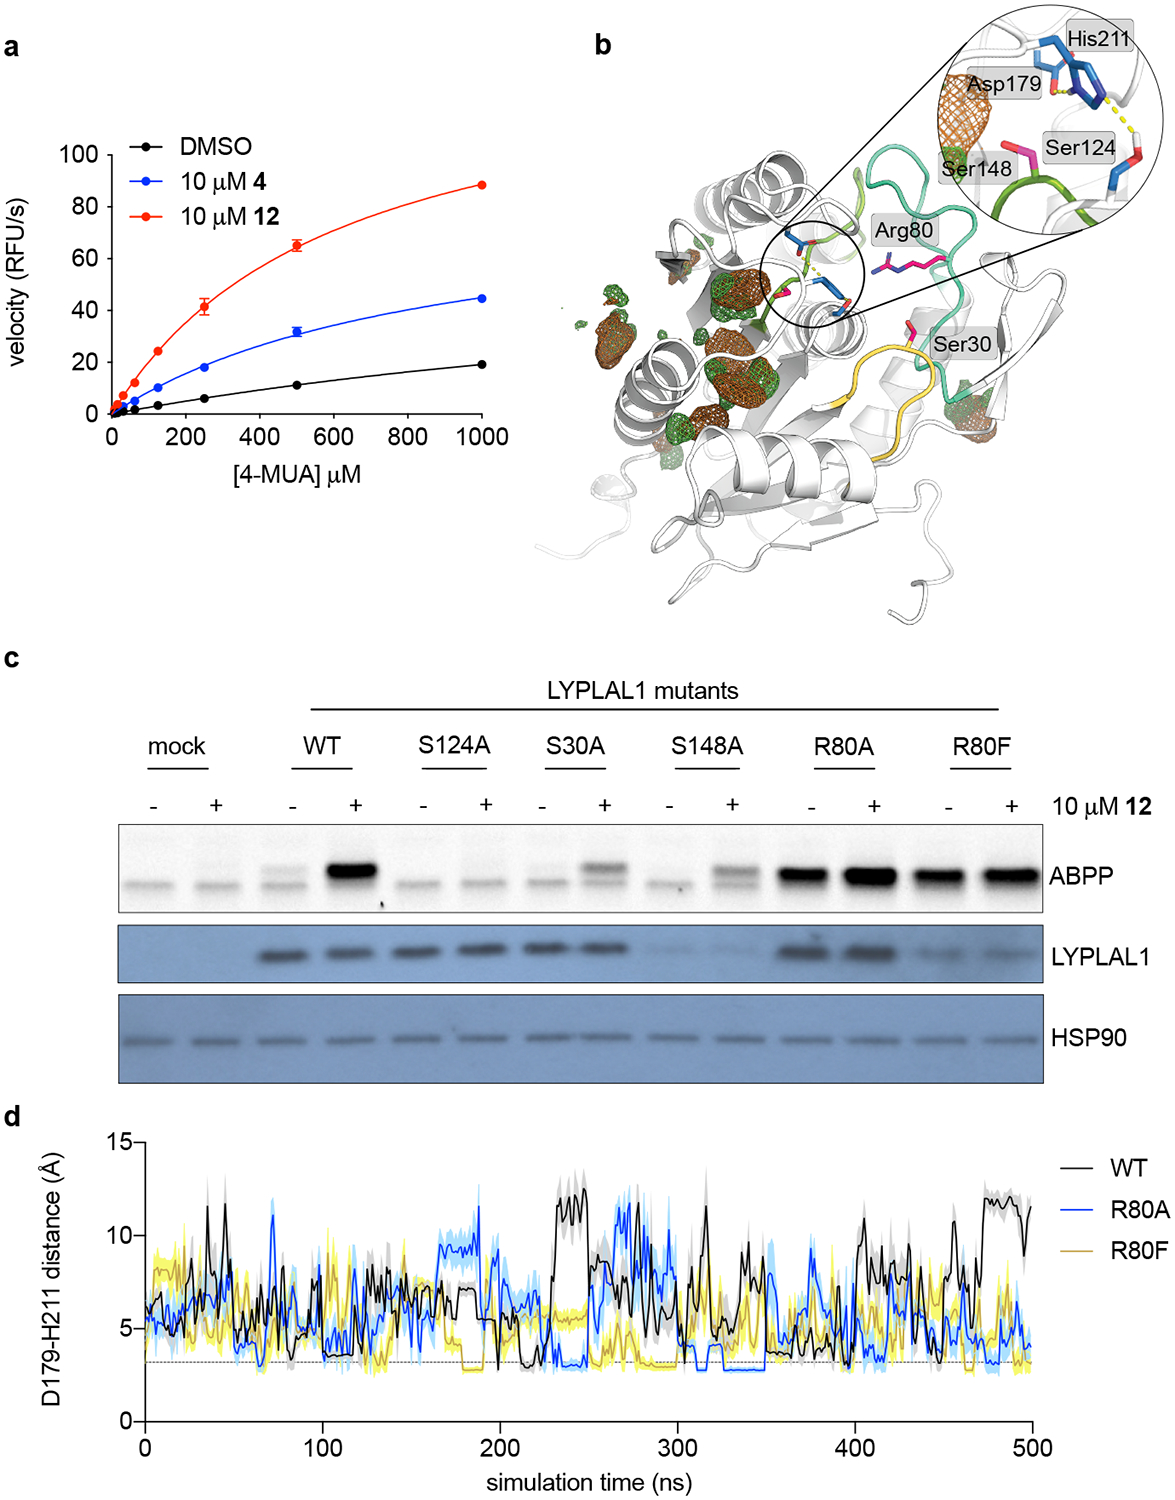
(a) Michaelis-Menten analysis of purified mLYPLAL1 (1 μM) and the synthetic substrate 4-methylumbelliferyl acetate (4-MUA) as shows that 4 and 12 improve catalytic efficiency (n=3 per group representing independent samples). Error bars represent mean ± s.d. (b) Model of LYPLAL1 (PDB 3U0V) highlighting three key residues (Ser30, Arg80 and Ser148 on loops colored yellow, turquoise, and light green) capable of electrostatically interacting with the catalytic triad (residues highlighted in blue). Hydrogen bond interactions within the catalytic triad are shown as yellow dotted lines. Chlorobenzene co-solvent occupancy maps (contoured at 20 σ) are color-coded to represent the different chemical features of the probe used: chlorine (green) and benzene (brown). (c) LYPLAL1 point mutants were expressed in HEK293 cells, proteomes harvested and incubated with vehicle or 12 prior to gel-based ABPP analysis. S124A replaces the catalytic serine and renders the enzyme inactive. Bottom panels show Western blots of LYPLAL1 and HSP90 (loading control). (d) Distance fluctuations between Asp179 and His211 of the catalytic triad during MD simulations of WT LYPLAL1 and Arg80 mutants. Line and shaded region represent mean and s.d. of the intervening data points per ns, respectively. Representative results from three (a, c) independent experiments; similar results were obtained in all experiments. Uncropped gels/blots for c are shown in Supplementary Fig. 6.
LYPLAL1 activation mitigates metabolic dysfunction
To determine the extent to which these small-molecule activators may be of utility to discern the function of LYPLAL1 in vivo, we examined the ability of 12 to increase LYPLAL1 activity in mice. C57BL/6 mice were dosed with 12 or C11, a potent covalent LYPLAL1 inhibitor35. Five minutes later, all mice were injected with a LYPLAL1-directed covalent alkyne probe35. Twenty minutes after the second injection, liver and kidney, tissues with high LYPLAL1 expression, were harvested, processed immediately for click chemistry to attach an azide-rhodamine tag, and analyzed by gel-based ABPP. Tissues of mice treated with 12 showed 1.8–2-fold greater LYPLAL1 activity relative to vehicle-treated ones, demonstrating that 12 engages its target in vivo (Fig. 6a). This observation prompted us to test the expectation that pharmacological activation of LYPLAL1 in the context of metabolic dysfunction might confer benefits. We treated insulin-resistant Diet-Induced Obese (DIO) mice with 12 and assessed glucose and insulin homeostasis. DIO mice treated with 12 showed decreased fasting plasma glucose (Fig. 6b), noticeably enhanced glucose tolerance, and increased insulin sensitivity (Fig. 6c). These effects were not accompanied by adverse outcomes, such as increased plasma levels of markers of liver damage (Fig. 6d). Chronic dosing with 12 did not alter weight, food intake, or LYPLAL1 protein levels in treated mice (Extended Data Fig. 5). To establish the extent to which these metabolic benefits were due to the ability of 12 to enhance LYPLAL1 activity, we dosed a separate cohort of DIO mice with either 12, the covalent inhibitor C11, or the combination. Dual dosing with 12 and C11 abrogated the positive effects of 12 on glucose homeostasis and insulin sensitivity, demonstrating that LYPLAL1 activity is required for the in vivo action of 12 (Fig. 6e). Consistent with these findings, acute treatment of primary mouse hepatocytes with 12 decreased glucose production and treatment with both 12 and C11 reversed this effect (Extended Data Fig. 6). Together, these findings indicate that pharmacological activation of LYPLAL1 may ameliorate features of obesity-diabetes.
Figure 6. LYPLAL1 activation imparts metabolic benefits in vivo.
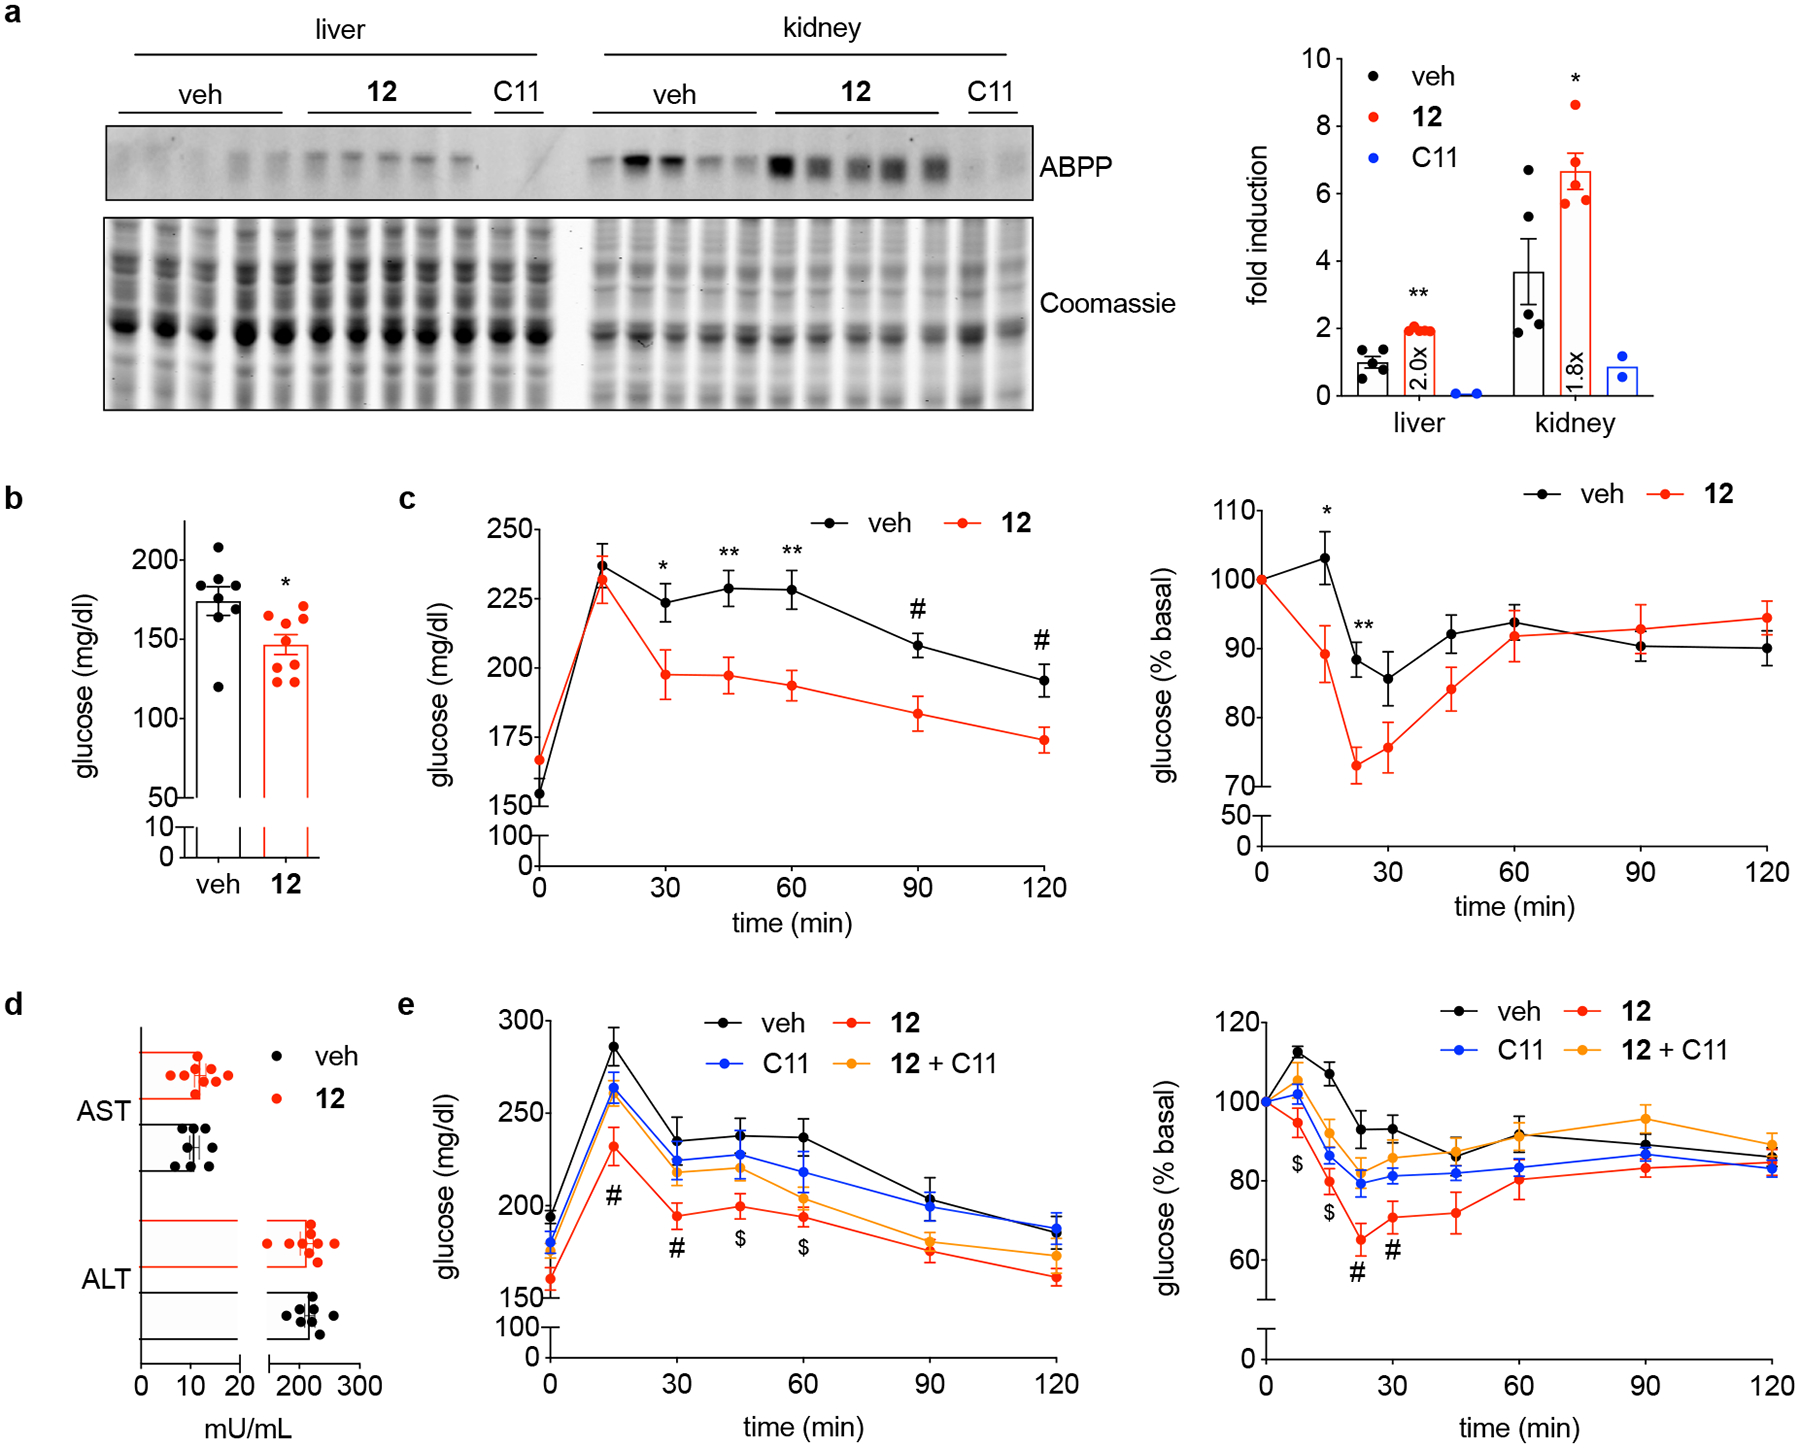
(a) 12 enhances LYPLAL1 activity in vivo. Mice were dosed with 12 or C11, a potent and selective LYPLAL1 inhibitor. Five minutes later, all mice were injected with a LYPLAL1-directed alkyne probe. Twenty minutes after the second injection, tissues were harvested, processed for click chemistry to attach an azide-rhodamine tag and analyzed by gel-based ABPP. Lanes represent individual mice. LYPLAL1 activity was quantified and expressed relative to the mean of activity in the liver of vehicle-treated mice (set to 1; n=5 for vehicle and compound 12, n=2 for C11). *p=0.02,**p=0.002 by two-tailed t-test. (b) Treatment with 12 corrects features of obesity-diabetes. DIO mice were dosed intraperitoneally with 12 (100 mg/kg every other day) and fasting glucose measured after 19 days. *p=0.02 by two-tailed t-test. (c) Glucose (left panel) and insulin (right panel) tolerance tests performed after 11 and 15 days of treatment, respectively, show 12 imparts metabolic benefits. For left panel: *p=0.04,**p<0.007 (0.006, 0.002) by two-way ANOVA with Bonferroni’s multiple comparisons test; #p<0.02 (0.007, 0.01) by two-tailed t-test. For right panel: *p=0.01,**p=0.004 by two-way ANOVA with Bonferroni’s multiple comparisons test. (d) ALT and AST plasma levels after 19 days of treatment. (e) Co-treatment of DIO mice with compound 12 and the LYPLAL1 inhibitor, C11 (5 mg/kg), reverses the beneficial effects of 12 on glucose tolerance (left panel, day 8 of treatment) and insulin sensitivity (right panel, day 12 of treatment). #p<0.041 by two-tailed t-test to all groups, $p<0.008 vs. vehicle by two-tailed t-test. Representative results from two (b-e) independent experiments; similar results were obtained in both experiments. Error bars represent (a-e) mean ± s.e.m.; (b-d) n=8 for vehicle- and n=9 for 12-treated mice, (e) n=7 for vehicle-, 12- and combination-treated mice, and n=8 for C11-treated mice where n represents individual mice. Uncropped gels/blots for a are shown in Supplementary Fig. 6.
Discussion
In this study, we have harnessed competitive ABPP to identify and optimize small-molecule activators of LYPLAL1 to aid characterization of this enzyme and clarify its link to metabolic traits. Pharmacologic activators have been reported for other enzyme classes, most notably the kinase family39. Within serine hydrolases, there are examples of enzymes that can be activated by protein-protein interactions. For instance, adipose triglyceride lipase (ATGL or PNPLA2) activity is regulated by interaction with CGI-58 (also known as ABHD5)40. Our work reveals that pharmacological activation of serine hydrolases is also possible, establishing a new mode of regulation for this enzyme class. We also show that competitive ABPP can provide the means to identify such activators for additional members of this physiologically important and therapeutically relevant large enzyme family. We note that, in principle, our strategy may be also applied to additional enzyme families for which suitable ABPP probes exist41.
Our study establishes the feasibility of applying ABPP to identify serine hydrolase activators in high-throughput screens, but we caution that, in our limited experience, the false discovery rate (FDR) for activators was greater than that for inhibitors. Only 5% of putative activators identified in the Fluopol-ABPP screen confirmed in gel-based ABPP assays, while 23% of inhibitors did. Given the large size of standard screening libraries, a high FDR is not a substantial limitation to discover other serine hydrolase activators, but it does highlight the need for orthogonal assays to validate bona fide activators. We used two different substrate assays in addition to gel-based ABPP to confirm enzyme activation, and a thermal stability assay to verify physical interaction. We also leveraged ABPP to assess compound selectivity in complex proteomes and target engagement in mouse tissues.
ABPP-guided medicinal chemistry allowed us to improve the properties of PAL-4, with several derivatives, such as PAL-12, displaying greater potency and efficacy of activation. Biophysical and enzyme kinetics assays indicate that our LYPLAL1 activators act by increasing the catalytic efficiency of the enzyme, though understanding their precise mode of action will require co-crystal X-ray structures. Solving these structures may be challenging, however, as nanoDSF data shows that PAL-4 and PAL-12 decrease the thermal stability of LYPLAL1, suggesting that this might be a general feature of LYPLAL1 activators. Nonetheless, using MD simulations and mutational analysis, we have uncovered several amino acids present in flexible loops near the catalytic triad that modulate LYPLAL1’s catalytic activity and the response to activators. Ser30 is important for compound-stimulated LYPLAL1 activity, for the response of mutant S30A to PAL-12 was considerably reduced. In contrast, replacing Arg80 with alanine or phenylalanine boosted LYPLAL1 basal activity so dramatically that PAL-12 had little additional effect. Co-solvent MD simulation studies with chlorobenzene fragments to determine potential sites of interaction revealed that predicted binding hotspots were distant from the loops that contain Ser30 and Arg80, raising the possibility of allosteric interactions that promote enzyme activation. Our results point to the central role of electrostatic contributions by key non-catalytic residues in driving small molecule- and mutation-induced LYPLAL1 activation.
We chose LYPLAL1 to pilot our ABPP-based strategy to discover serine hydrolase activators because of the strong links of this poorly characterized enzyme to human metabolic traits. Further, it had been reported that treatment of primary hepatocytes with a potent and selective LYPLAL1 inhibitor (C11) increased glucose production35, suggesting that blocking LYPLAL1 in vivo may negatively impact glucose homeostasis, and providing a rationale for the development of small-molecule activators. A more recent study42 in cultured human adipocytes with CRISPR-induced deletion of LYPLAL1 showed that insulin signaling and insulin-stimulated glucose uptake were both decreased in this cell type critical for systemic glucose homeostasis, bolstering the basis for development of LYPLAL1 activators that might have the opposite effect. Studies of mice with global deletion of LYPLAL1 have yielded mixed results, with one reporting a gender-specific difference in adiposity34, and another one finding no difference in metabolic parameters33. Here, we have shown that treatment of obese-insulin resistant DIO mice with PAL-12 improved multiple measures of glucose homeostasis, an effect that was abrogated when the mice were simultaneously dosed with a LYPLAL1 inhibitor. Because the biochemical function of LYPLAL1 is not known, the molecular basis of these benefits remains to be established. Moreover, because LYPLAL1 is expressed in multiple organs (e.g., liver, white and brown adipose depots, kidney), further studies will be required to discern the tissues that contribute to the metabolic improvements seen with pharmacological activation of LYPLAL1. Nonetheless, our observations suggest that LYPLAL1 activators may be useful in the treatment of metabolic disorders.
Our understanding of serine hydrolases has greatly expanded in the last two decades. These advances were driven to a large extent by the development of selective inhibitors for poorly characterized family members that, when used in combination with genetic tools, enabled identification of their physiologic substrates. Many of these inhibitors were developed using ABPP. Our study reveals that ABPP can also be used to find pharmacologic activators of serine hydrolase function. These chemical tools should aid functional annotation and pharmacological validation of serine hydrolases such as LYPLAL1, an important enzyme linked to human metabolic disorders but with no established biochemical role.
ONLINE METHODS
Synthesis of LYPLAL1 activators
Synthetic procedures are provided in Supplementary Note.
Recombinant protein expression and purification
Full-length mouse and human LYPLAL1 were cloned into pET28a and expressed as 6XHis-tagged proteins in BL21 (DE3) E. Coli. Cultures were grown in LB media supplemented with 50 μg1/mL kanamycin at 37°C to an OD600 of 0.6–0.8, induced with 0.1 mM/mL IPTG, and grown overnight at 25°C. Cells were pelleted, flash frozen, lysed by repeated sonication in column buffer (20 mM Tris-HCl pH 8.5, 150 mM NaCl, 8 mM imidazole, 5% glycerol), and the lysate centrifuged at 10,000 g for 1 hr at 4°C. The supernatant was slowly loaded onto a Talon metal affinity resin (Clontech) previously equilibrated with 10 volumes of column buffer. The loaded column was washed with 20 volumes of column buffer and the protein eluted using an imidazole gradient. Fractions were concentrated and LYPLAL1 purity verified by SDS-PAGE. Fractions containing pure LYPLAL1 were combined and dialyzed overnight at 4°C. Protein concentration was determined using the Bio-Rad DC Protein Assay kit.
High-throughput Fluopol-ABPP screen for LYPLAL1 modulators
Pure mLYPLAL1 protein (4 μM) in assay buffer (50 mM Tris-HCl, 150 mM NaCl, 0.01% Pluronic F-127, pH 7.5) was added to 384-well black assay plates and incubated with DMSO or compounds (10 μM) from the Maybridge HitFinder Collection (16,000 compounds) for 90 min at 37°C. Fluorophosphate biotin (FP-biotin, 10 μM) was used as a positive control for inhibition, while the PPARγ ligand rosiglitazone (10 μM) was used as an inactive control. Subsequently, a rhodamine-tagged fluorophosphonate probe (FP-rhodamine, 75 nM final concentration) was added to each well and plates were incubated a further 60 min at 37°C. Fluorescence polarization (mP) was read using an Envision instrument with excitation 535 nm and emission 595 nm filters. Percent activation was calculated relative to the performance of DMSO (100% activity) and FP-biotin (0% activity) wells present in each screening plate. Intra- and inter-plate coefficient of variance were 4.61 and 2.68%, respectively. The average signal-to-background ratio was 1.92. Additional details on the assay are provided in Supplementary Table 1. Hits were cross-referenced to other FluoPol-ABPP screens (e.g., PREPL, PME1) ran in-house to filter out non-specific hits, and colored compounds excluded from further analysis to avoid potential artifacts. Putative inhibitors and activators were validated in gel-based ABPP assays.
LYPLAL1 overexpression in mammalian cells
HEK293 cells (ATCC CRL-1573) were transiently transfected with expression plasmids for His-tagged mouse and human LYPLAL1 or empty vector (pCMV-SPORT6, to generate mock proteome). To prepare proteomes for ABPP, cells were washed with PBS 48 h after transfection, collected by scraping, and sonicated. Lysate protein concentration was determined using the Bio-Rad DC Protein Assay kit. Lysates were stored at −80°C.
Gel-based ABPP LYPLAL1 activation assays
For gel-based ABPP experiments with pure proteins, 50 nM mouse or human LYPLAL1 in assay buffer (50 mM Tris-HCl, 150 mM NaCl, 0.01% Pluronic F-127, pH 7.5; total reaction volume of 50 μl) was incubated with serial dilutions (1:3) of compounds for 60 min at 37°C. Next, a rhodamine-tagged fluorophosphonate (FP-rhodamine) probe was added to a final concentration of 200 nM. Reactions were incubated for a further 30 min and then quenched with 4X SDS-PAGE loading buffer, heated at 90°C for 10 min, separated by SDS-PAGE, and visualized in-gel using a flatbed fluorescence scanner (Hitachi). The level of LYPLAL1 activity was determined by measuring the integrated optical density of the bands. Activation (i.e. efficacy) was calculated relative to DMSO and EC50 curves fit using Prism (GraphPad). In gel-based ABPP experiments involving LYPLAL1 overexpressed in HEK293 cells, 50 μg of proteome (1 mg/ml stock) in assay buffer (50 mM Tris-HCl, 150 mM NaCl, 0.01% Pluronic F-127, pH 7.5) was incubated with compounds for 60 min at 37°C prior to addition of the FP-rhodamine probe (200 nM final), incubated a further 30 min at 37°C and processed as described above. In all cases, gels were stained with Denville Blue Protein Stain after fluorescence scanning to verify equivalent concentration of protein in all samples.
Reversibility studies
To assess the mode of action of 4, pure mLYPLAL1 (100 nM final concentration) was incubated for 90 min at 37°C with DMSO, 4 (10 μM), FP-biotin (10 μM) or rosiglitazone (10 μM, used here as an inactive control) in a 200 μL reaction volume in assay buffer (50 mM Tris-HCl, 150 mM NaCl, 0.01% Pluronic F-127, pH 7.5). Reactions were then split in half. To the first half, FP-rhodamine probe (1 μM final) was added and the reaction incubated for another 60 min at 37°C prior to quenching and processing as described above. The second half was passed over a Sephadex G-50 Quick Spin column (Roche), the protein eluted in assay buffer, and FP-rhodamine probe (1 μM final) added. The reaction was then incubated for 60 min at 37°C prior to quenching and processing for gel-based ABPP analysis. Gels were stained with Denville Blue Protein Stain after fluorescence scanning to verify equivalent concentration of protein in all samples.
PNPA substrate hydrolysis assay
A colorimetric assay measuring the release of yellow para-nitrophenol from para-nitrophenyl-acetate (PNPA) was performed. PNPA was freshly dissolved in methanol to obtain a 500 mM stock solution. A 5 mM diluted PNPA solution (1:100 in assay buffer, 50 mM Tris-HCl, 150 mM NaCl, 0.01% Pluronic F-127, pH 7.5) was prepared immediately prior to assay initiation. Pure mouse and human LYPLAL1 protein (687 nM final) were incubated with compounds (10 μM) for 15 min at room temperature in assay buffer. PNPA (500 μM final) was added and absorbance at 405 nm read 70 min later. No protein controls were included to correct for background PNPA hydrolysis.
Proteome selectivity studies
To assess selectivity of 4 and 12, HepG2 cells (ATCC HB-8065) grown in DMEM supplemented with 10% FBS were harvested in PBS and proteomes prepared by sonication. For proteomic analysis, 2 mg of HepG2 whole-cell proteome (2 mg/mL in DPBS) was incubated with DMSO or 10 μM 4 or 12 (1 h at 37°C), followed by 5 μM FP-alkyne (20 min at 37°C). To conjugate biotin to FP-alkyne-labeled serine hydrolases, a click reaction was performed. Briefly, biotin-PEG3-N3 (10 μL/reaction, 10 mM in DMSO), CuSO4 (20 μL/reaction, 50 mM in H2O), TBTA (60 μL/reaction, 1.7 mM in DMSO/t-BuOH (1:4, v/v) and tris(2-carboxyethyl)phosphine (TCEP) (20 μL/reaction, 50 mM in H2O, freshly prepared) were premixed. 110 μL of this click reagent mixture was immediately added to each sample (1 mL reaction volume). Samples were allowed to react for 1 h. After reaction, proteomes were denatured and precipitated using 4:1 MeOH/CHCl3 (v/v). Precipitated proteins were resuspended in 6M urea DPBS solution (500 μL) with 10 μL of 10% SDS. The proteins were reduced by adding 50 μL of a 1:1 mixture of TCEP (200 mM in DPBS) and K2CO3 (600 mM in DPBS) and incubating for 30 min at 37°C. The proteins were then alkylated by adding iodoacetamide (70 μL, 400 mM in DPBS) and incubating for 30 min at room temperature. 110 μL of 10% SDS and 5 mL of DPBS were added to each sample and incubated with streptoavidin beads for 1.5 h. After washing the beads, on-bead trypsin digestion was performed. Digested peptides were subjected to reductive dimethylation. Briefly, formaldehyde (light) or 13C-labeled deuterated formaldehyde (heavy) was added to the HepG2 proteomic samples (0.2%, w/v) followed by the addition of sodium cyanoborohydride (27 mM final concentration). After 1 h of incubation, the reaction was quenched by the addition of NH4OH (0.2% final concentration, v/v) and formic acid (8% final concentration, v/v). The light- and heavy-labeled samples were then combined and analyzed by LC/MS analysis.
NanoDSF
The effect of molecules on the thermal stability of LYPLAL1 was measured by differential scanning fluorimetry (DSF) using the Prometheus NT.48 instrument (NanoTemper Technologies). Purified mLYPLAL1 protein in PBS pH 7.4 ([mLYPLAL1]final = 2.3 μM) incubated with varying concentrations of test molecule (DMSO final concentration 2%) was loaded onto nanoDSF grade High Sensitivity capillaries. Thermal unfolding of the protein was analyzed in a thermal ramp from 20 to 95°C with a heating rate of 1°C/min. Kd values were estimated by isothermal analysis as described previously43.
4-methylumbelliferone acetate (4-MUA) kinetic assay
15 μl of recombinant mLYPLAL1 protein in buffer (50 mM Tris pH 7.4, 150 mM NaCl, 0.01% Pluronic F-127) was incubated with compounds for 30 min at 37°C. Subsequently, 60 μl of 4-MUA in the same buffer was added such that the final concentration of LYPLAL1 and compounds were 1 and 10 μM, respectively. Kinetic fluorometric measurements (ex. 355 nm, em. 460 nm) using the Spectramax Gemini EM were performed immediately after addition of 4-MUA, and initial rates of reaction calculated. The assay was performed with a concentration curve of 4-MUA to determine Km and Vmax.
Western blot analysis
Proteins separated by SDS-PAGE were transferred onto membranes using a Novex semi-dry apparatus (Life Technologies) and membranes blocked in 5% milk-TBST. Blots were incubated overnight at 4°C with primary antibodies (LYPLAL1 1:1000 dilution, Proteintech 16146-AP; HSP90 1:2000 dilution, Genetex GTX109753) diluted in 5% BSA-TBST. After washing and incubation with HRP-conjugated secondary antibodies, blots were treated with Pierce ECL substrate (Fisher Scientific) and developed.
Site-directed mutagenesis
The coding region of mLYPLAL1 without an epitope tag was inserted into the pLV vector by Gibson cloning. Point mutants were generated using the Q5 site-directed mutagenesis kit (New England Biolabs, NEB). Mutagenesis primers were designed using the NEBaseChanger software v1.2.9. All mutations were confirmed by DNA sequencing.
Structural modeling
Structure preparation.
The X-ray structure of human lysophospholipase-like 1 (hLYPLAL1) protein (PDB 3U0V) was used for MD simulations37. The protein structure was prepared using CHARMM-GUI44. Missing N- and C-terminal parts, from Met1 to Val8 and Glu231 to Lys237, were reconstructed using CHARMM-GUI to match the sequence used experimentally. Appropriate N- and C-terminal patches were applied using the standard CHARMM protocol (NTER and CTER, respectively). All histidine residues were protonated on the Nδ position (HSD), including His211 which is part of the catalytic triad. Finally, hydrogen atoms were added using the HBUILD protocol in CHARMM45. For mutants R80F and R80A, side chains were automatically rebuilt by CHARMM during the structure preparation phase, after manually changing their residue type and deleting parts of the sidechain.
Preparation of MD simulations.
The Molecular Dynamics (MD) simulations protocol starts by performing a quick Steepest Descent (SD) minimization of 700 steps to remove any steric clashes. Then the protein is placed in an orthorhombic box with edges of length 77.99, 78.276, and 78.188 Å, solvated with water molecules (TIP3P model), and Na+/Cl− ions added to match the concentration used in experiments (150 mM). Simulations were performed using NAMD 2.13 on GPU46 with the CHARMM36m forcefield47. A 12 Å cutoff was used for van der Waals and short-range electrostatics interactions; long-range electrostatic interactions were computed using the Particle Mesh Ewald summation method48 and a grid point density of 1 Å. The SHAKE algorithm49 was applied to all hydrogen-heavy atom bonds, and an integration time-step of 2 fs was used for all simulations. Prior to running MD simulations, water positions were optimized, and energies minimized with 1000 steps of Conjugate Gradient (CG), then gradually heated up to 600K over 46 ps, followed by 250 steps of CG, then heated again to 298.15 K over 50 ps. The system was then energy minimized with no restrains on the protein with 2000 steps of CG, gradually heated to 293.15 K over 30 ps, and followed by 50 ns of production run in NPT condition and maintained at 1 atm and 293.15 K (similar to the temperature of the experimental settings of 298.15 K), using the Langevin barostat and thermostat, respectively. Conformations were saved every 1000 steps (i.e. 2 ps) for further analysis. For WT hLYPLAL1 and mutants R80F and R80A, 10 independent simulations were produced, collecting 500 ns of cumulative production simulation time per system. Root Mean Square Deviation (RMSD) was used to measure the average displacement of backbone atoms in each frame relative to the reference frame (i.e. divergence from initial coordinates), providing a metric to assess the global stability of each complex. Root Mean Square Fluctuation (RMSF) was used to quantify the fluctuation of each backbone atom relative to their average position during the simulation, and to identify residues in local regions with high flexibility. RMSD and RMSF values were calculated using the Python package MDAnalysis50,51. RMSD data for MD simulations is provided in Extended Data Fig. 4.
Preparation of cosolvent MD simulations.
Cosolvent MD simulations using chlorobenzene as a probe followed the same general protocol as the conventional MD simulations described above. After solvation, an additional step was performed to add cosolvent probes, which were iteratively added to the system until the desired concentration was reached. Each probe was placed at least 5 Å away from the protein and from previously placed probes. Water molecules overlapping with the newly placed probe (i.e. at a distance <2 Å from any probe atom) were removed. Differing from the MD simulations protocol described above, Na+/Cl− ions were added only to neutralize the charge of the system. The concentration of the chlorobenzene probe was set to 1.5% v/v probe/water ratio to avoid aggregation due to its strong hydrophobic characteristics52. Parametrization of the chlorobenzene fragment was done using the ParamChem webserver53,54. No further refinement was performed since all the parameters were already present in the CGENFF forcefield55,56. A production run of 50 ns was performed in 10 independent replicates, collecting 500 ns of cumulative production simulation time.
Processing of cosolvent MD simulations.
10 independent replicates were combined and the locations of the probes from all replicates binned in a grid of 0.5 Å spacing using the Python packages MDAnalysis and Numpy50,51,57. To identify ligand binding hotpots, the resulting trajectory was processed using the method described by Ghanakota and Carlson for MixMD58. Briefly, the raw bin counts x in each of the grid points were converted to σ density values using the equation (x-μ)/σ, where μ and σ are the mean and the standard deviation of all binned grids, respectively. This allows to represent the location of the probes in the same way as electron density in X-ray crystallography. The various maps were contoured at 20 σ (i.e. where signal is 20 times greater than noise) to show only the major binding sites on the protein58.
In vivo target engagement studies
Male C57BL/6J mice were injected intraperitoneally (IP) with vehicle (10% DMSO, 63% saline, 27% Cremaphor EL:ethanol 2:1), 100 mg/kg 12, or 5 mg/kg C11, a potent and selective LYPLAL1 inhibitor35. 5 min later, all mice were injected IP with 5 mg/kg of C12, a LYPLAL1-directed alkyne ABPP probe35. Mice were sacrificed 20 min later, liver and kidney harvested, and tissue lysates instantly prepared and centrifuged to remove debris. Protein concentration of supernatants was quantified, and 2.5 mg/mL of each proteome processed immediately using standard click chemistry procedures to attach an azide-rhodamine tag. Azide-rhodamine labeled proteomes were separated by SDS-PAGE and visualized in-gel using a flatbed fluorescence scanner. LYPLAL1 activity was determined by measuring the integrated optical density of the bands. The effect of compounds was assessed relative to the mean of vehicle-treated tissues. Gels were processed for Western blot after fluorescence scanning to verify equivalent levels of LYPLAL1 protein across samples. C11 and C12 were provided by Pfizer.
Studies with DIO mice
Male C57BL/6N Diet-Induced obese (DIO) mice (Taconic) were purchased at 20 weeks of age and maintained on a 60% kcal high fat diet (Research Diets D12492) in ventilated rack systems and standard housing conditions (22 to 24°C; 06:00 lights on, 18:00 lights off). Mice were dosed intraperitoneally (IP) every 2 days with vehicle or 100 mg/kg 12 in a 1:3:6 (DMSO; 2:1 Cremophor EL:ethanol; saline) formulation. Body weights and food intake were measured weekly, and mice were fasted for 12 h (21:00 to 09:00) prior to blood collection. For glucose tolerance tests, mice were fasted for 12 h (21:00 to 09:00), and gavaged orally with 2 g/kg glucose in saline. For insulin tolerance tests, mice were fasted for 4 h (09:00 to 13:00) and injected IP with 0.3 U/kg insulin (Novolin). Plasma glucose was monitored using glucometers (Clarity Diagnostics). Plasma ALT and AST were measured using fluorimetric assays (AAT Bioquest). To evaluate dependence on LYPLAL1 of the benefits of 12 treatment, 20-week-old male DIO mice were treated as above with vehicle, 12, C11 (5 mg/kg), or the combination of 12 and C11. Glucose tolerance and insulin sensitivity tests were performed at day 8 and 12 of treatment, respectively. All animal experiments were approved by and conducted in accordance with the guidelines of The Scripps Research Institute IACUC.
Primary mouse hepatocyte gluconeogenesis assays
To isolate primary mouse hepatocytes, male C57BL/6J mice aged 8–12 weeks were anesthetized with isoflurane and the hepatic portal vein was catheterized and perfused (2.5 ml/min) with HBSS (Ca2+, Mg2+ free) containing 0.5 mM EGTA and 25 mM HEPES pH 7.4 (HBSS-EGTA) for 2 min. The perfusion buffer was switched to HBSS (Ca2+, Mg2+ free) containing 5 mM CaCl2, 25 mM HEPES pH 7.4 and collagenase type IV (Sigma-Aldrich), and the liver perfused for another 4 min to allow all HBSS-EGTA to flush from the lines, followed by an additional 5 min of collagenase digestion. The liver was then removed and gently sheared with scissors in HBSS-EGTA. The emulsion was passed through a 100 μm filter into a 50 ml Corning tube, and low glucose (5.6 mM) DMEM containing 10% FBS was added to bring the volume up to 30 ml. Cells were spun down at 500 rpm for 5 min, washed, and resuspended with low glucose DMEM with 10% FBS. Hepatocytes were plated at 0.5 million cells/ml in 12-well TPP plates (Sigma-Aldrich). Media was refreshed after 90 min and cells were incubated overnight prior to gluconeogenic assays. Briefly, plated hepatocytes were washed once with PBS and incubated for 16 h in serum-free DMEM (Sigma-Aldrich D5030) containing 2 mM glutamine, 44 mM NaHCO3, 5.6 mM glucose, and 1 mM sodium pyruvate. Next, cells were starved for 1 h in serum-free DMEM containing 2 mM glutamine and 44 mM NaHCO3 (gluconeogenesis media). Hepatocytes were then treated in gluconeogenesis media containing 20 mM lactate and 2 mM pyruvate with or without various combinations of glucagon, 12, and C11. Wells containing gluconeogenesis media without lactate and pyruvate were used for measurements of basal gluconeogenesis. After 6 h, media was collected, spun down at 1500 rpm for 3 min and the supernatant assayed for glucose release (Amplex Red Glucose Assay kit, Fisher Scientific). Results were normalized to total cellular protein content.
In vitro ADME assays
Hepatic microsomal stability:
Microsome stability was tested by incubating 1 μM test compound with 1 mg/mL hepatic microsomes in 100 mM potassium phosphate buffer, pH 7.4. The reaction was initiated by adding NADPH (1 mM final concentration). Aliquots were removed at 0, 5, 10, 20, 40, and 60 min and added to acetonitrile (5X v:v) to stop the reaction and precipitate proteins. NADPH dependence of the reaction was evaluated with minus NADPH samples. At the end of the assay, the samples were centrifuged through a Millipore Multiscreen Solvinter 0.45 micron low binding PTFE hydrophilic filter plate and analyzed by LC-MS/MS. Data was log transformed and represented as half-life and intrinsic clearance.
Kinetic solubility:
From a 10 mM DMSO stock. 2 μl compound was added to 198 μl pre-warmed pH 7.4 phosphate buffered saline in a 96-well plate. The plate was maintained at ambient temperature for 24 hr on an orbital shaker. Samples were centrifuged through a Millipore Multiscreen Solvinter 0.45 micron low binding PTFE hydrophilic filter plate and analyzed by LC-MS/MS or HPLC. Peak area was compared to standards of known concentration.
P450 inhibition.
P450 inhibition for four major human isoforms was evaluated in human hepatic microsomes by following the metabolism of specific marker substrates (CYP1A2, phenaceten demethylation to acetaminophen; CYP2C9, tolbutamide hydroxylation to hydroxytolbutamide; CYP2D6, bufuralol hydroxylation to 4’-hydroxybufuralol; and CYP3A4, midazolam hydroxylation to 1’-hydroxymidazolam) in the presence and absence of 10 μM compound. The concentration of each marker substrate was approximately its Km. Specific inhibitors for each isoform were included in each run to validate the system.
Plasma protein binding.
Plasma protein binding was determined using equilibrium dialysis. All samples were tested in triplicate using the RED Rapid Equilibrium Dialysis Device (Thermo Scientific). The initial drug concentration in the plasma chamber was 5 μM and phosphate buffered saline was added to the receiver chamber. The plate was covered and allowed to shake in a 37°C incubator for 6 hr. 25 μl was sampled from the plasma and PBS chambers which were then diluted with either blank PBS or plasma to achieve a 1:1 ratio of plasma:PBS for all samples. The concentration of drug in the plasma and PBS chambers were determined by LC-MS/MS. The fraction bound was calculated as ([plasma] – [PBS]) / [plasma]. cellular protein content.
Reporting summary
Further information on research design is available in the Nature Research Reporting Summary linked to this article.
Data Availability
All data generated or analyzed during this study are included in this article and its supplementary information files, or are available from the corresponding authors upon request. Structures of 4 (CCDC 1825320), 12 (CCDC 1825321), 34 (CCDC 1825319), 37 (CCDC 1825322), and 78 (CCDC 1825323) established by single crystal X-ray structure determinations and accompanying data have been deposited in the Cambridge Crystallographic Data Center (CCDC). Data and reagents requests should be addressed to Enrique Saez (esaez@scripps.edu) or Dale L. Boger (boger@scripps.edu).
Extended Data
Extended Data Fig. 1. Screen to identify modulators of LYPLAL1 activity.
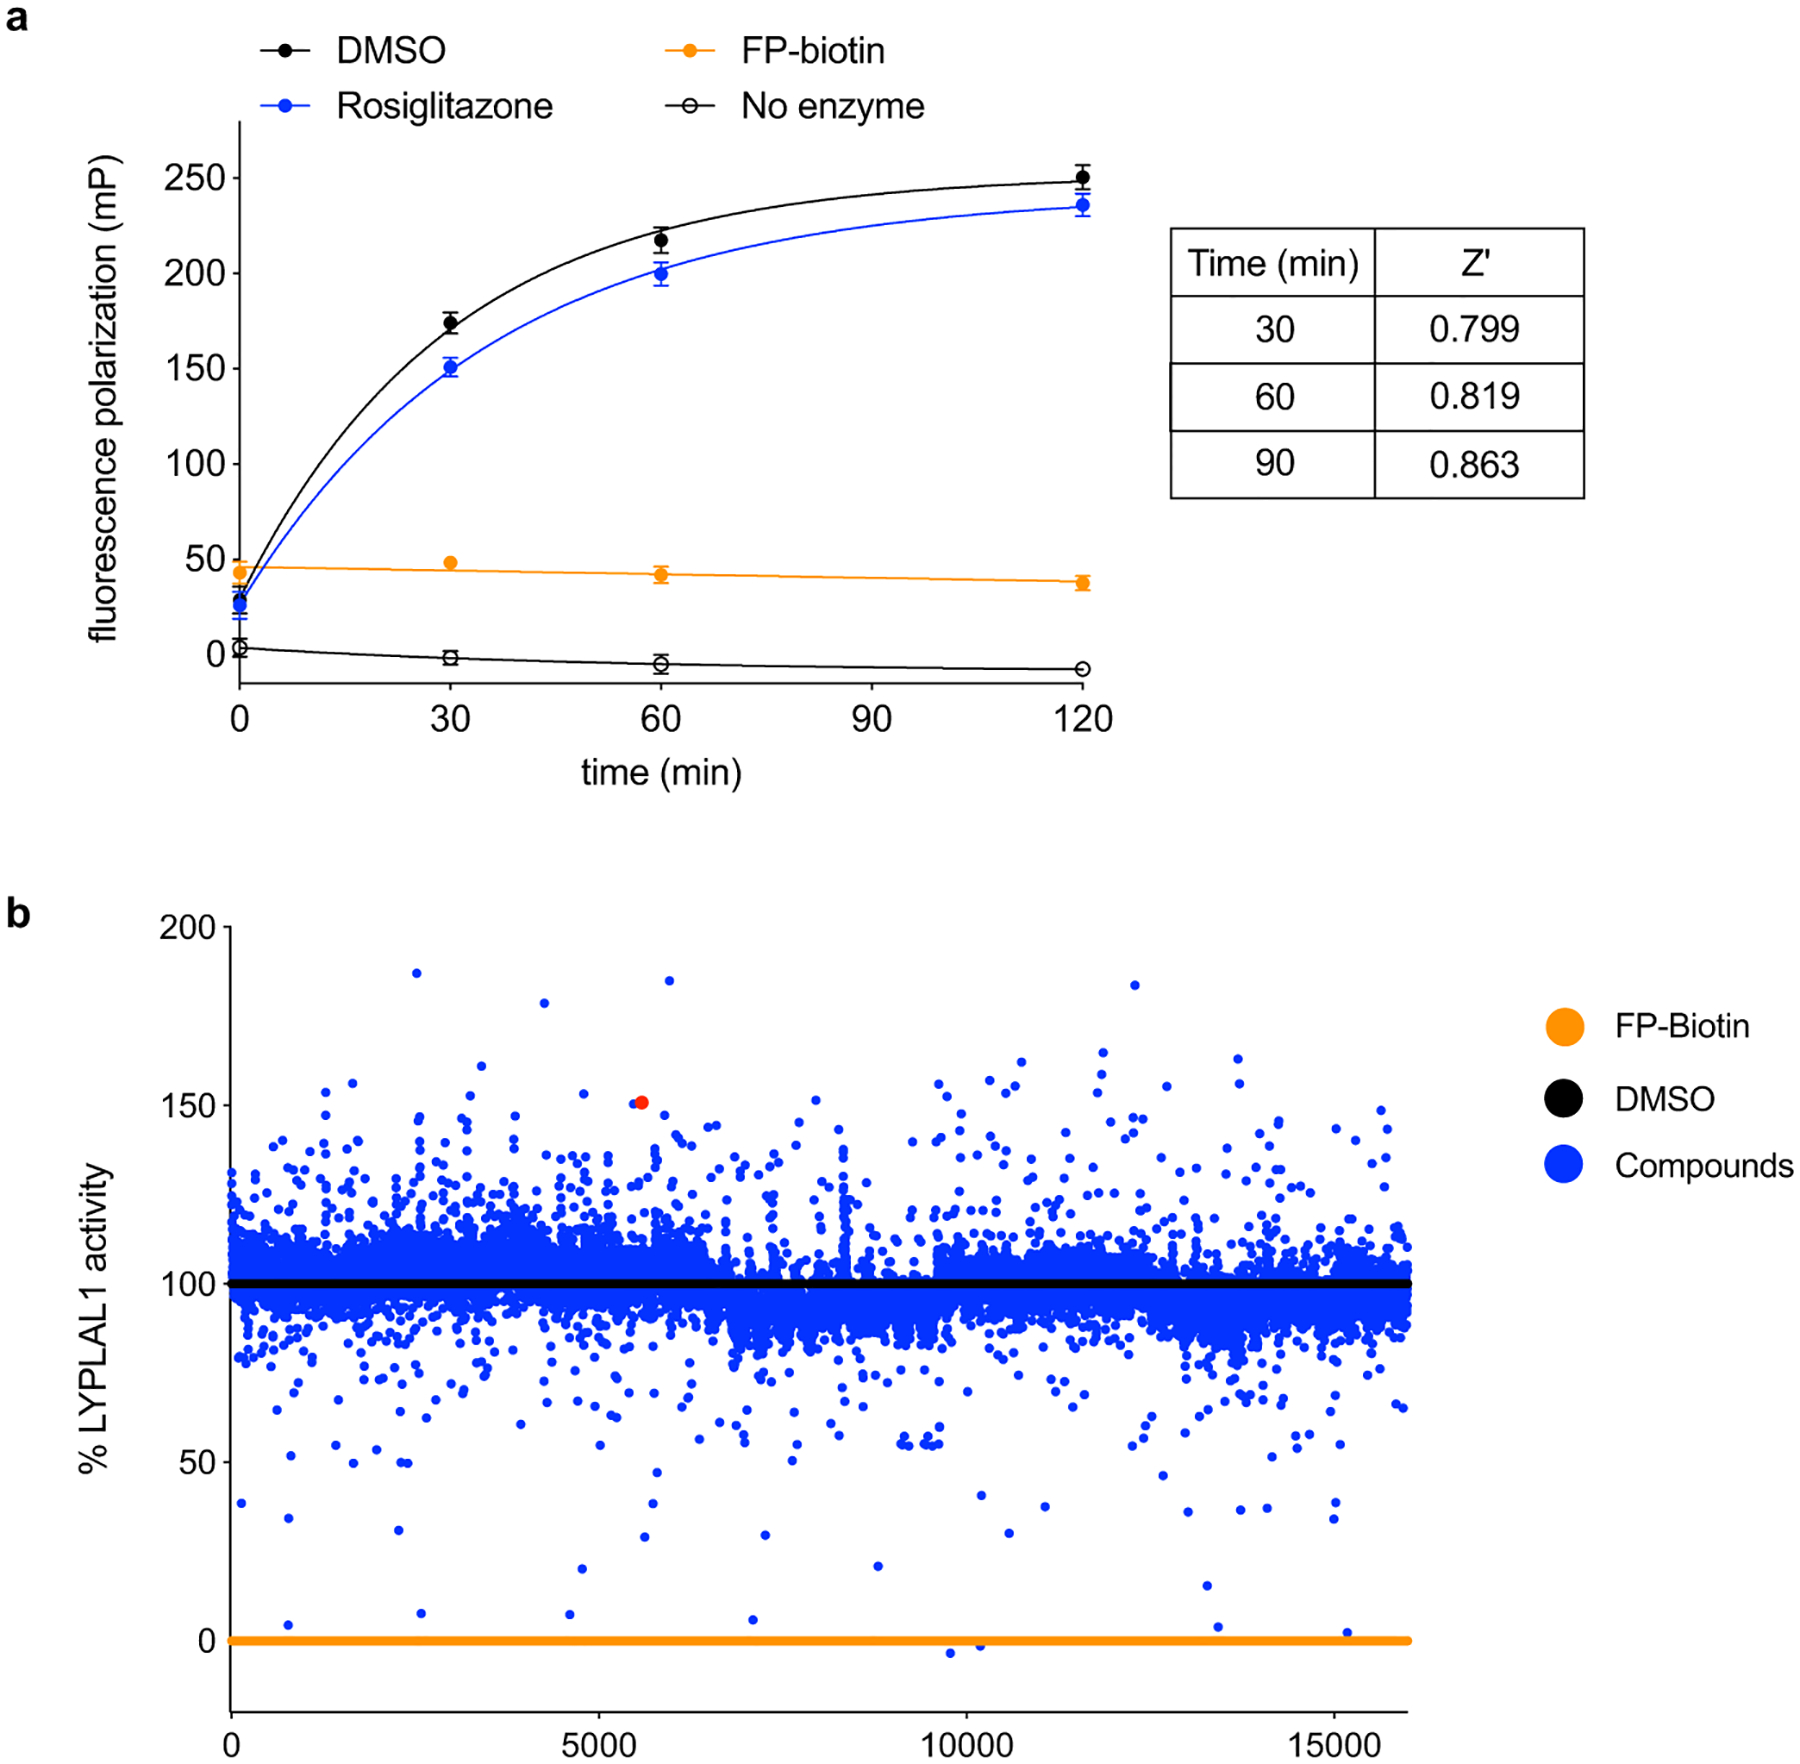
(a) ABPP-based fluorescence polarization assay (Fluopol-ABPP) amenable for high-throughput screening. Purified mLYPLAL1 is incubated with compounds prior to addition of the FP-rhodamine (FP-Rh) probe. FP-biotin probe (a non-fluorescent FP probe, 25 μM) serves as a control for inhibition, while the PPARγ ligand rosiglitazone (25 μM) is used as an inactive control. Data are shown as mean ± s.d., n=12, where n represents independent samples. (b) A 16,000-compound screen (single point, 10 μM) identified hits that reduced the fluorescence polarization signal of FP-rhodamine labeling of mLYPLAL1 (putative inhibitors) and some that increased it (potential activators). Percent mLYPLAL1 activity was calculated relative to DMSO (100% activity) and FP-biotin (0% activity) wells. 4 is shown as a red dot.
Extended Data Fig. 2. Validation of primary HTS hits.
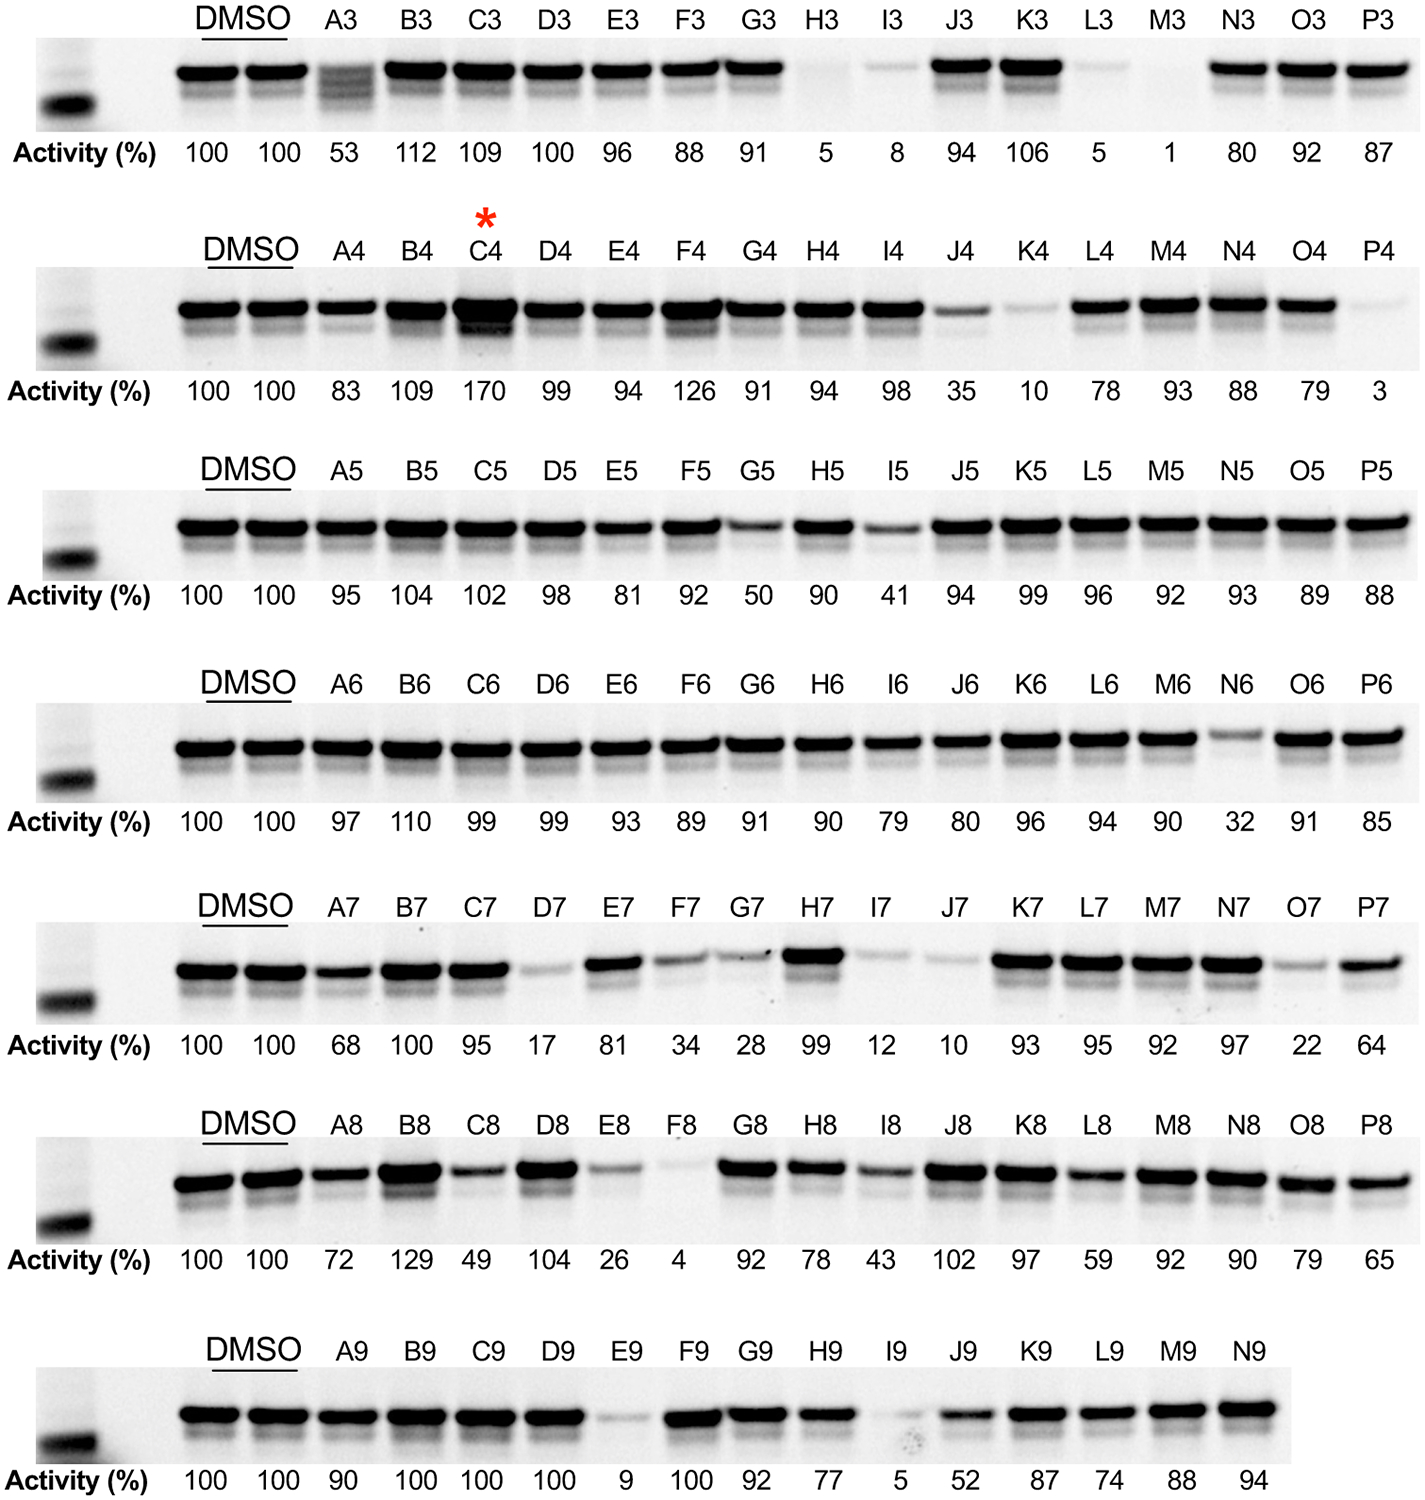
Candidate LYPLAL1 inhibitors and activators were analyzed by gel-based ABPP. Hit picks (10 μM) were incubated with 100 nM of purified mLYPLAL1 for 1.5 h at 37°C prior to the addition of FP-rhodamine probe (1 μM). After 1 h at 37°C, reactions were quenched, separated by SDS-PAGE and in-gel fluorescence scanned. LYPLAL1 activity was calculated relative to DMSO (100%). Designations above lanes correspond to compound location on the plate. Red asterisk denotes 4. Representative results from two independent experiments; similar results were obtained in both experiments. Uncropped gels are shown in Supplementary Fig. 6
Extended Data Fig. 3. Derivatized thermal melt curves for compound-treated mLYPLAL1.
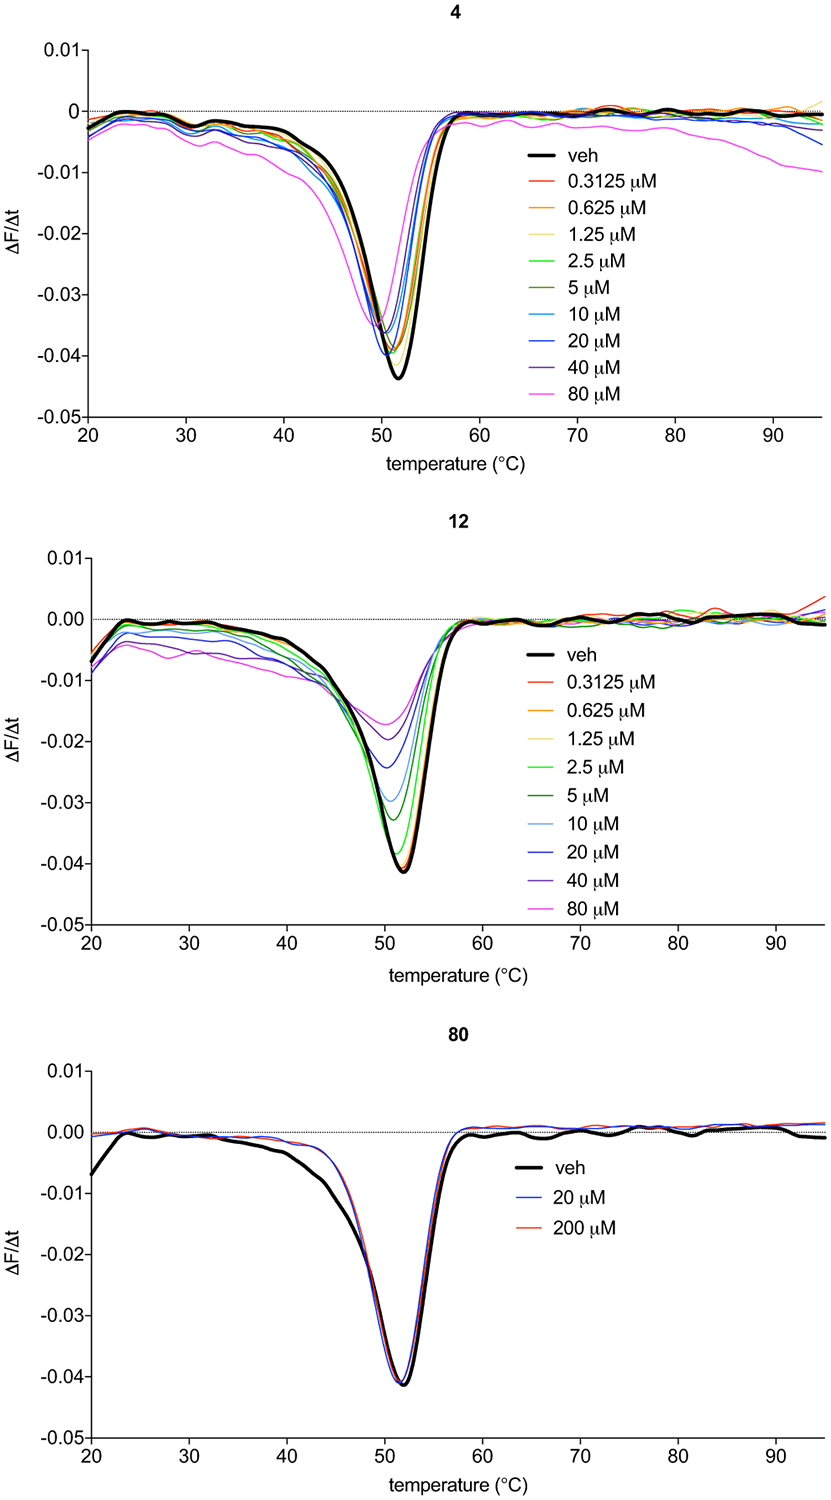
Temperature-dependent fluorescence shifts in purified mLYPLAL1 incubated with increasing concentrations of 4 and 12. Increased protein flexibility is noted upon compound interaction. In contrast, an inactive compound, 80, does not shift the derivatized thermal melt curve of mLYPLAL1. Representative results from three independent experiments; similar results were obtained in all experiments.
Extended Data Fig. 4. Evolution of the global Root Mean Square Deviation (RMSD) during Molecular Dynamics (MD) trajectories.
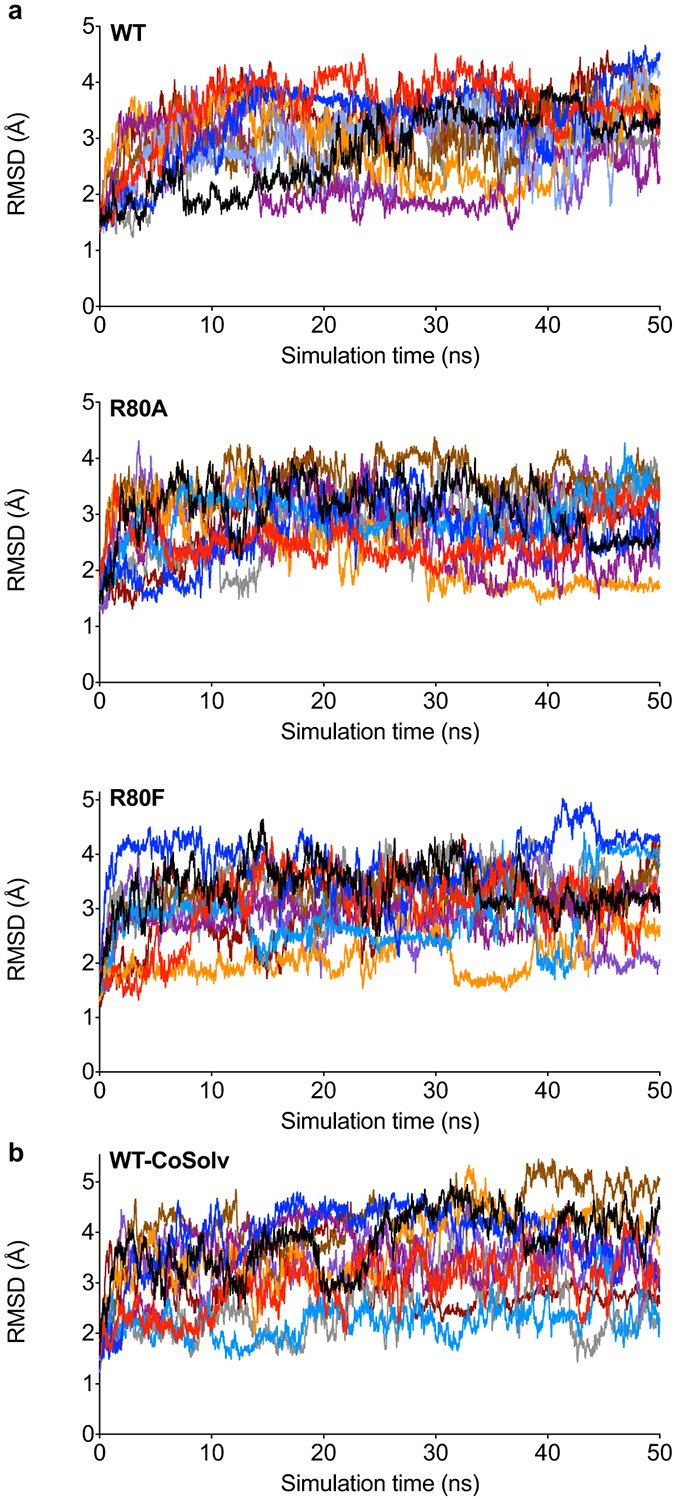
(a) WT hLYPLAL1 and R80 mutants, and (b) WT hLYPLAL1 with chlorobenzene as cosolvent. The RMSD was calculated considering only the backbone atoms and using the starting frames as the reference structures. Results from 10 independent simulations.
Extended Data Fig. 5. Effects of chronic treatment of DIO mice with a pharmacological LYPLAL1 activator.
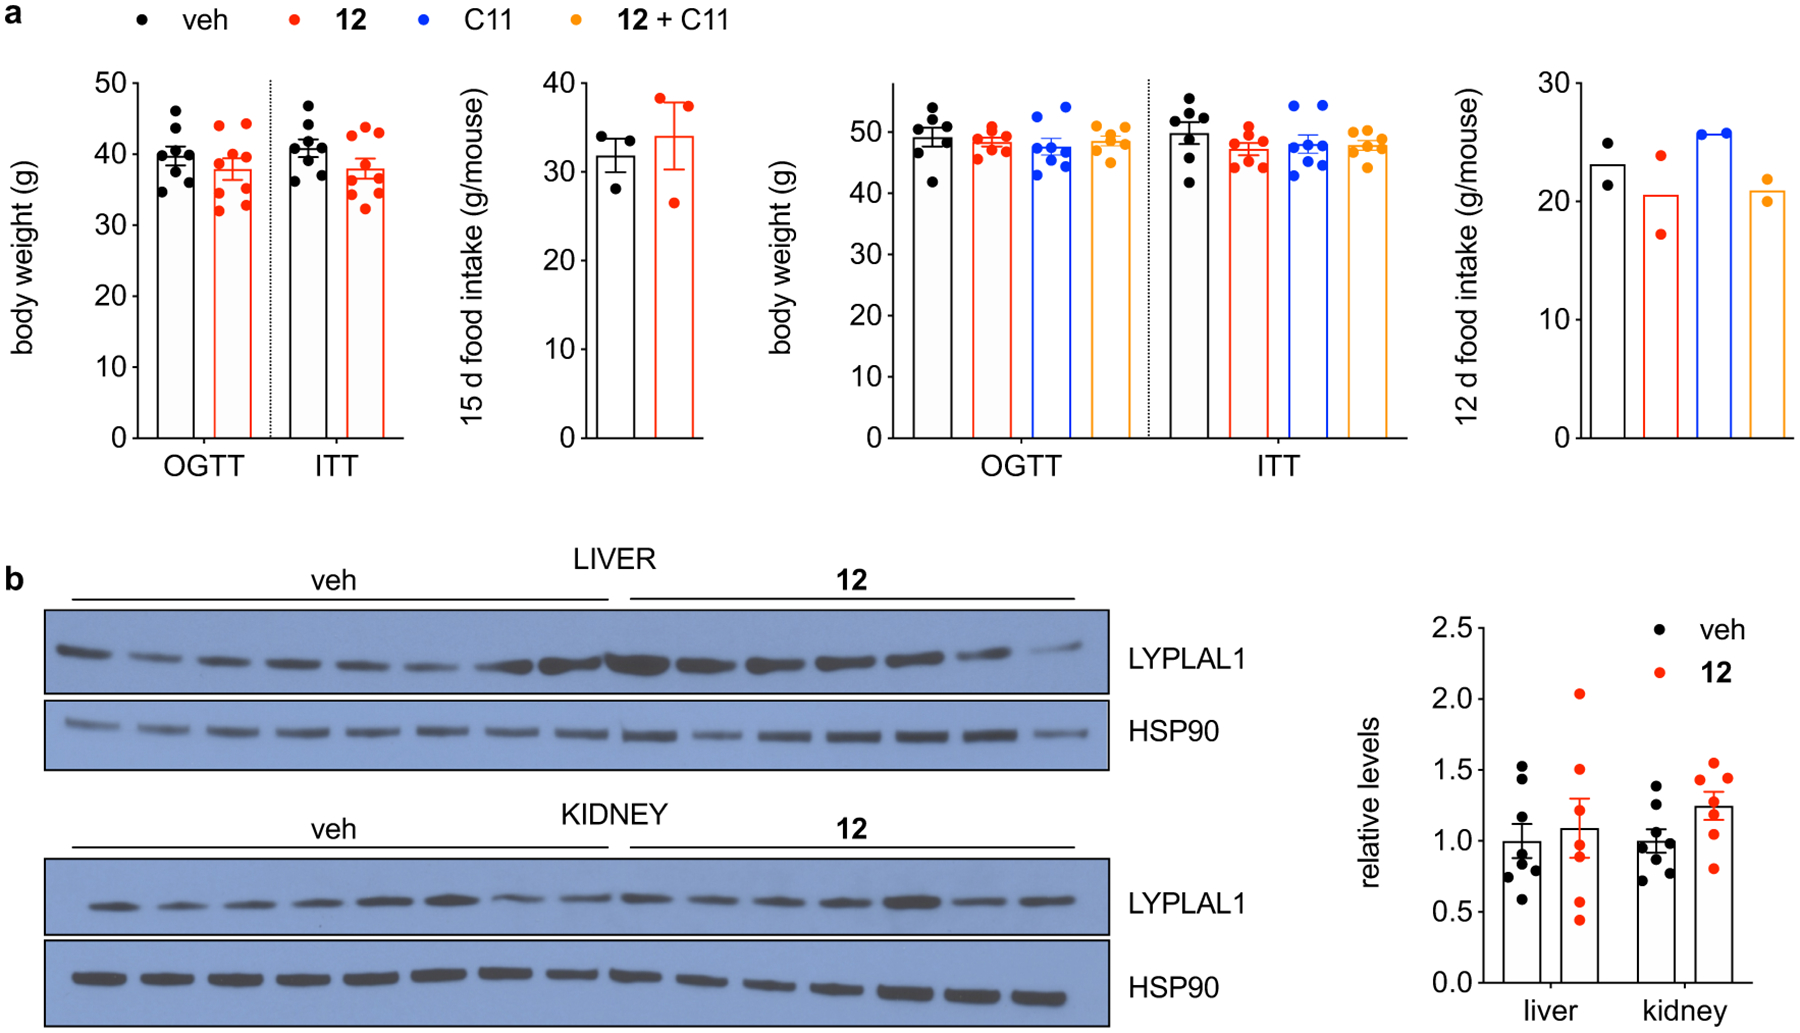
DIO mice were treated with 12 for 28 days. (a) Body weights (left panel: n=8 for veh, n=9 for 12; right panel: n=7 for veh, 12 and 12 + C11 groups, n=8 for C11) prior to OGTT (left panel: d 11, right panel: d 8) and ITT (left panel: d 15, right panel: d 12); cumulative food intake per mouse (left panel: n=3 cages for veh and 12, right panel: n=2 cages for all groups) of vehicle and compound-treated DIO mice. (b) Indicated tissues from DIO mice were analyzed by Western Blot. The intensity of the LYPLAL1 signal was normalized to that of HSP90, the loading control. Quantification is shown on the right; n=8 for veh and 7 for 12. n represents individual mice (body weights and Western blot) or cages (food intake). Error bars represent mean ± s.e.m. Representative results from two independent experiments; similar results were obtained in both experiments. Uncropped blots for b are shown in Supplementary Fig. 6
Extended Data Fig. 6. Glucose production in primary mouse hepatocytes treated with LYPLAL1 modulators.
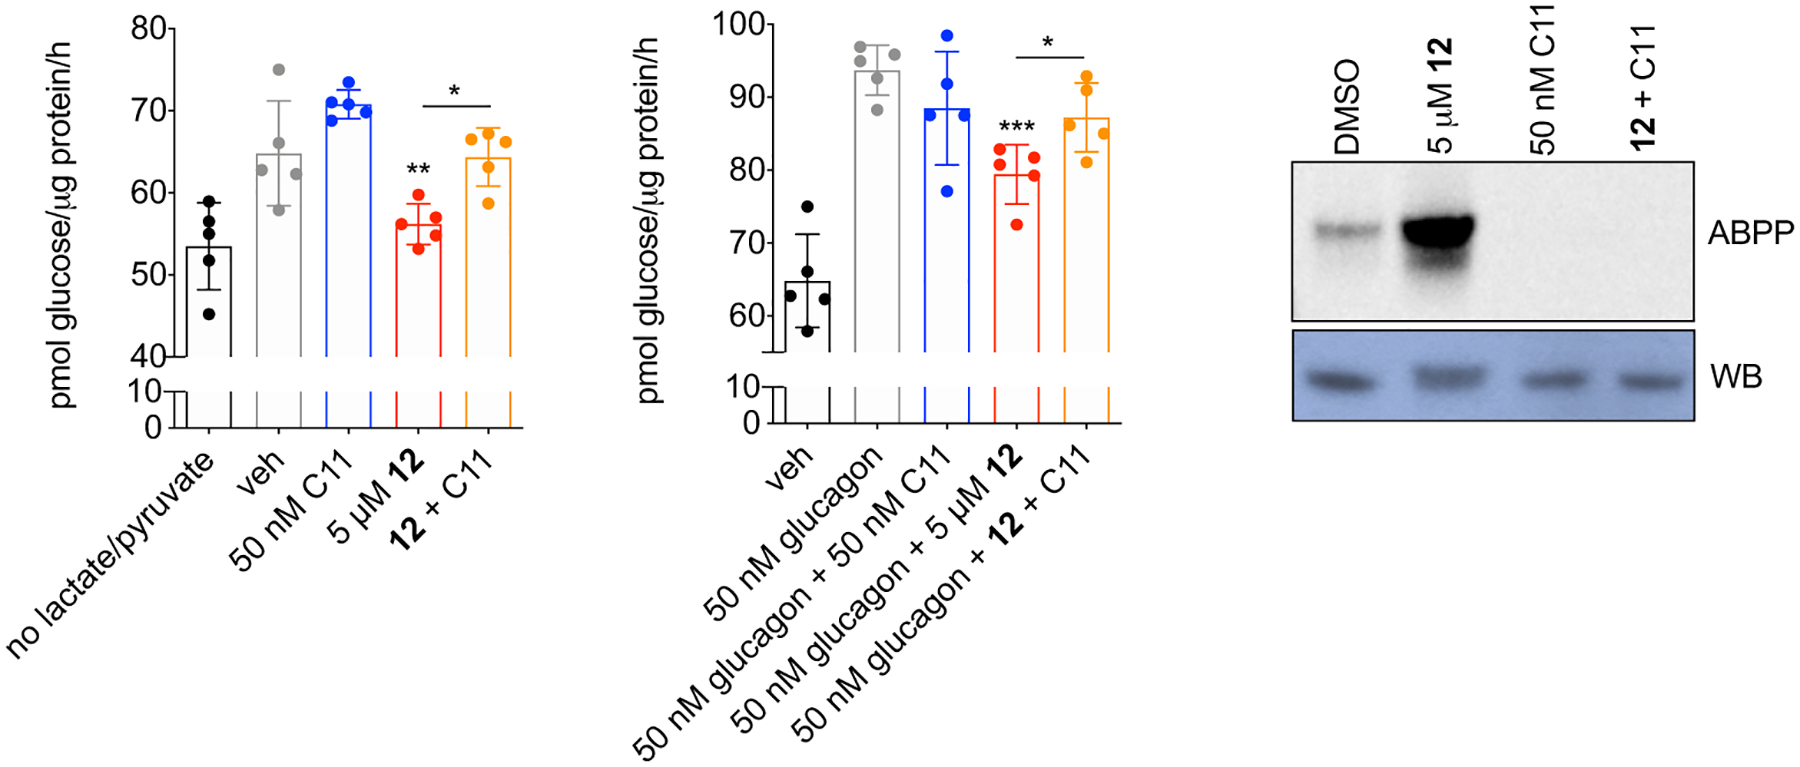
Basal (20 mM lactate/2 mM pyruvate) (left panel) and glucagon-stimulated (middle panel) glucose production was measured in primary mouse hepatocytes treated for 6 h with 12, C11, or both compounds in combination; results were normalized to protein content. Gel-based ABPP analysis of 50 nM purified mLYPLAL1 treated for 1 h with 12, C11, and the combination (right panel). Protein levels are shown in the bottom panel. Error bars represent mean ± s.d.; n=5 per group where n=biologically independent samples; *p=0.02, **p=0.003, ***p=0.0003 by two-tailed t-test. Representative results from two independent experiments; similar results were obtained in each experiment. Uncropped gels/blots are shown in Supplementary Fig. 6
Supplementary Material
Acknowledgements
We thank C. Moore and A. Rheingold of the Crystallography Facility at the University of California, San Diego for X-ray structure determinations of 4, 12, 34, 37 and 78, C. Vernochet, T.V. Magee, and C. Hong at Pfizer for compounds C11 and C12, and M. Petrassi at Calibr for discussions. This work was supported by NIH grants DA015648 (to DLB), DK099810 (to ES and BFC), and DK114785 (to ES and BFC). BPK was supported in part by fellowship 15POST25100007 from the American Heart Association.
Footnotes
Competing interests
The authors declare no competing financial interests.
References
- 1.Bachovchin DA & Cravatt BF The pharmacological landscape and therapeutic potential of serine hydrolases. Nat Rev Drug Discov 11, 52–68 (2012). [DOI] [PMC free article] [PubMed] [Google Scholar]
- 2.Long JZ & Cravatt BF The metabolic serine hydrolases and their functions in mammalian physiology and disease. Chem Rev 111, 6022–63 (2011). [DOI] [PMC free article] [PubMed] [Google Scholar]
- 3.Xu J et al. Discovery of potent, selective, and orally bioavailable pyridone-based dipeptidyl peptidase-4 inhibitors. Bioorg Med Chem Lett 16, 1346–9 (2006). [DOI] [PubMed] [Google Scholar]
- 4.Zhi J et al. Retrospective population-based analysis of the dose-response (fecal fat excretion) relationship of orlistat in normal and obese volunteers. Clin Pharmacol Ther 56, 82–5 (1994). [DOI] [PubMed] [Google Scholar]
- 5.Cravatt BF, Wright AT & Kozarich JW Activity-based protein profiling: from enzyme chemistry to proteomic chemistry. Annu Rev Biochem 77, 383–414 (2008). [DOI] [PubMed] [Google Scholar]
- 6.Sadaghiani AM, Verhelst SH & Bogyo M Tagging and detection strategies for activity-based proteomics. Curr Opin Chem Biol 11, 20–8 (2007). [DOI] [PubMed] [Google Scholar]
- 7.Heal WP, Dang TH & Tate EW Activity-based probes: discovering new biology and new drug targets. Chem Soc Rev 40, 246–57 (2011). [DOI] [PubMed] [Google Scholar]
- 8.Jessani N & Cravatt BF The development and application of methods for activity-based protein profiling. Curr Opin Chem Biol 8, 54–9 (2004). [DOI] [PubMed] [Google Scholar]
- 9.Jessani N, Liu Y, Humphrey M & Cravatt BF Enzyme activity profiles of the secreted and membrane proteome that depict cancer invasiveness. Proc. Natl. Acad. Sci. U.S.A 99, 10335–10340 (2002). [DOI] [PMC free article] [PubMed] [Google Scholar]
- 10.Jessani N et al. A streamlined platform for high-content functional proteomics of primary human specimens. Nat Methods 2, 691–7 (2005). [DOI] [PubMed] [Google Scholar]
- 11.Liu Y, Patricelli MP & Cravatt BF Activity-based protein profiling: the serine hydrolases. Proc Natl Acad Sci U S A 96, 14694–9 (1999). [DOI] [PMC free article] [PubMed] [Google Scholar]
- 12.Patricelli MP, Giang DK, Stamp LM & Burbaum JJ Direct visualization of serine hydrolase activities in complex proteomes using fluorescent active site-directed probes. Proteomics 1, 1067–71 (2001). [DOI] [PubMed] [Google Scholar]
- 13.Jessani N et al. Carcinoma and stromal enzyme activity profiles associated with breast tumor growth in vivo. Proc Natl Acad Sci U S A 101, 13756–61 (2004). [DOI] [PMC free article] [PubMed] [Google Scholar]
- 14.Dominguez E et al. Integrated phenotypic and activity-based profiling links Ces3 to obesity and diabetes. Nat Chem Biol 10, 113–21 (2014). [DOI] [PMC free article] [PubMed] [Google Scholar]
- 15.Li W, Blankman JL & Cravatt BF A functional proteomic strategy to discover inhibitors for uncharacterized hydrolases. J Am Chem Soc 129, 9594–5 (2007). [DOI] [PubMed] [Google Scholar]
- 16.Leung D, Hardouin C, Boger DL & Cravatt BF Discovering potent and selective reversible inhibitors of enzymes in complex proteomes. Nat Biotechnol 21, 687–91 (2003). [DOI] [PubMed] [Google Scholar]
- 17.Bachovchin DA, Brown SJ, Rosen H & Cravatt BF Identification of selective inhibitors of uncharacterized enzymes by high-throughput screening with fluorescent activity-based probes. Nat Biotechnol 27, 387–94 (2009). [DOI] [PMC free article] [PubMed] [Google Scholar]
- 18.Bachovchin DA et al. Superfamily-wide portrait of serine hydrolase inhibition achieved by library-versus-library screening. Proc Natl Acad Sci U S A 107, 20941–6 (2010). [DOI] [PMC free article] [PubMed] [Google Scholar]
- 19.Manning AK et al. A genome-wide approach accounting for body mass index identifies genetic variants influencing fasting glycemic traits and insulin resistance. Nat Genet 44, 659–69 (2012). [DOI] [PMC free article] [PubMed] [Google Scholar]
- 20.Scott RA et al. Large-scale association analyses identify new loci influencing glycemic traits and provide insight into the underlying biological pathways. Nat Genet 44, 991–1005 (2012). [DOI] [PMC free article] [PubMed] [Google Scholar]
- 21.Klarin D et al. Genetics of blood lipids among ~300,000 multi-ethnic participants of the Million Veteran Program. Nat Genet 50, 1514–1523 (2018). [DOI] [PMC free article] [PubMed] [Google Scholar]
- 22.Xue A et al. Genome-wide association analyses identify 143 risk variants and putative regulatory mechanisms for type 2 diabetes. Nat Commun 9, 2941 (2018). [DOI] [PMC free article] [PubMed] [Google Scholar]
- 23.Graff M et al. Genome-wide physical activity interactions in adiposity - A meta-analysis of 200,452 adults. PLoS Genet 13, e1006528 (2017). [DOI] [PMC free article] [PubMed] [Google Scholar]
- 24.Winkler TW et al. The Influence of Age and Sex on Genetic Associations with Adult Body Size and Shape: A Large-Scale Genome-Wide Interaction Study. PLoS Genet 11, e1005378 (2015). [DOI] [PMC free article] [PubMed] [Google Scholar]
- 25.Shungin D et al. New genetic loci link adipose and insulin biology to body fat distribution. Nature 518, 187–196 (2015). [DOI] [PMC free article] [PubMed] [Google Scholar]
- 26.Berndt SI et al. Genome-wide meta-analysis identifies 11 new loci for anthropometric traits and provides insights into genetic architecture. Nat Genet 45, 501–12 (2013). [DOI] [PMC free article] [PubMed] [Google Scholar]
- 27.Speliotes EK et al. Association analyses of 249,796 individuals reveal 18 new loci associated with body mass index. Nat Genet 42, 937–48 (2010). [DOI] [PMC free article] [PubMed] [Google Scholar]
- 28.Speliotes EK et al. Genome-wide association analysis identifies variants associated with nonalcoholic fatty liver disease that have distinct effects on metabolic traits. PLoS Genet 7, e1001324 (2011). [DOI] [PMC free article] [PubMed] [Google Scholar]
- 29.Lindgren CM et al. Genome-wide association scan meta-analysis identifies three Loci influencing adiposity and fat distribution. PLoS Genet 5, e1000508 (2009). [DOI] [PMC free article] [PubMed] [Google Scholar]
- 30.Dastani Z et al. Novel loci for adiponectin levels and their influence on type 2 diabetes and metabolic traits: a multi-ethnic meta-analysis of 45,891 individuals. PLoS Genet 8, e1002607 (2012). [DOI] [PMC free article] [PubMed] [Google Scholar]
- 31.Heid IM et al. Meta-analysis identifies 13 new loci associated with waist-hip ratio and reveals sexual dimorphism in the genetic basis of fat distribution. Nat Genet 42, 949–60 (2010). [DOI] [PMC free article] [PubMed] [Google Scholar]
- 32.Lei X, Callaway M, Zhou H, Yang Y & Chen W Obesity associated Lyplal1 gene is regulated in diet induced obesity but not required for adipocyte differentiation. Mol Cell Endocrinol 411, 207–13 (2015). [DOI] [PubMed] [Google Scholar]
- 33.Watson RA et al. Lyplal1 is dispensable for normal fat deposition in mice. Dis Model Mech 10, 1481–1488 (2017). [DOI] [PMC free article] [PubMed] [Google Scholar]
- 34.Norheim F et al. Gene-by-Sex Interactions in Mitochondrial Functions and Cardio-Metabolic Traits. Cell Metab 29, 932–949.e4 (2019). [DOI] [PMC free article] [PubMed] [Google Scholar]
- 35.Ahn K et al. Discovery of a Selective Covalent Inhibitor of Lysophospholipase-like 1 (LYPLAL1) as a Tool to Evaluate the Role of this Serine Hydrolase in Metabolism. ACS Chem Biol 11, 2529–40 (2016). [DOI] [PubMed] [Google Scholar]
- 36.Simon GM & Cravatt BF Activity-based proteomics of enzyme superfamilies: serine hydrolases as a case study. J Biol Chem 285, 11051–5 (2010). [DOI] [PMC free article] [PubMed] [Google Scholar]
- 37.Burger M et al. Crystal structure of the predicted phospholipase LYPLAL1 reveals unexpected functional plasticity despite close relationship to acyl protein thioesterases. J Lipid Res 53, 43–50 (2012). [DOI] [PMC free article] [PubMed] [Google Scholar]
- 38.Won SJ et al. Molecular Mechanism for Isoform-Selective Inhibition of Acyl Protein Thioesterases 1 and 2 (APT1 and APT2). ACS Chem Biol 11, 3374–3382 (2016). [DOI] [PMC free article] [PubMed] [Google Scholar]
- 39.Hameed A et al. Small molecules as activators in medicinal chemistry (2000–2016). Expert Opin Ther Pat 27, 1089–1110 (2017). [DOI] [PubMed] [Google Scholar]
- 40.Lass A et al. Adipose triglyceride lipase-mediated lipolysis of cellular fat stores is activated by CGI-58 and defective in Chanarin-Dorfman Syndrome. Cell Metab 3, 309–19 (2006). [DOI] [PubMed] [Google Scholar]
- 41.Yang P & Liu K Activity-based protein profiling: recent advances in probe development and applications. Chembiochem 16, 712–24 (2015). [DOI] [PubMed] [Google Scholar]
- 42.Chen Z et al. Functional Screening of Candidate Causal Genes for Insulin Resistance in Human Preadipocytes and Adipocytes. Circ Res 126, 330–346 (2020). [DOI] [PMC free article] [PubMed] [Google Scholar]
- 43.Bai N, Roder H, Dickson A & Karanicolas J Isothermal Analysis of ThermoFluor Data can readily provide Quantitative Binding Affinities. Sci Rep 9, 2650 (2019). [DOI] [PMC free article] [PubMed] [Google Scholar]
- 44.Jo S, Kim T, Iyer VG & Im W CHARMM‐GUI: a web‐based graphical user interface for CHARMM. Journal of computational chemistry 29, 1859–1865 (2008). [DOI] [PubMed] [Google Scholar]
- 45.Brooks BR et al. CHARMM: The biomolecular simulation program. Journal of computational chemistry 30, 1545–1614 (2009). [DOI] [PMC free article] [PubMed] [Google Scholar]
- 46.Phillips JC et al. Scalable molecular dynamics with NAMD. Journal of computational chemistry 26, 1781–1802 (2005). [DOI] [PMC free article] [PubMed] [Google Scholar]
- 47.Huang J et al. CHARMM36m: an improved force field for folded and intrinsically disordered proteins. Nature methods 14, 71–73 (2017). [DOI] [PMC free article] [PubMed] [Google Scholar]
- 48.Essmann U et al. A smooth particle mesh Ewald method. The Journal of Chemical Physics 103, 8577–8593 (1998). [Google Scholar]
- 49.Ryckaert J-P, Ciccotti G & Berendsen HJ Numerical integration of the cartesian equations of motion of a system with constraints: molecular dynamics of n-alkanes. Journal of computational physics 23, 327–341 (1977). [Google Scholar]
- 50.Gowers RJ et al. MDAnalysis: a Python package for the rapid analysis of molecular dynamics simulations. (Los Alamos National Lab.(LANL), Los Alamos, NM (United States), 2019). [Google Scholar]
- 51.Michaud-Agrawal N, Denning EJ, Woolf TB & Beckstein O MDAnalysis: a toolkit for the analysis of molecular dynamics simulations. Journal of computational chemistry 32, 2319–2327 (2011). [DOI] [PMC free article] [PubMed] [Google Scholar]
- 52.Tan YS, Spring DR, Abell C & Verma C The use of chlorobenzene as a probe molecule in molecular dynamics simulations. Journal of chemical information and modeling 54, 1821–1827 (2014). [DOI] [PubMed] [Google Scholar]
- 53.Vanommeslaeghe K & MacKerell AD Jr Automation of the CHARMM General Force Field (CGenFF) I: bond perception and atom typing. Journal of chemical information and modeling 52, 3144–3154 (2012). [DOI] [PMC free article] [PubMed] [Google Scholar]
- 54.Vanommeslaeghe K, Raman EP & MacKerell AD Jr Automation of the CHARMM General Force Field (CGenFF) II: assignment of bonded parameters and partial atomic charges. Journal of chemical information and modeling 52, 3155–3168 (2012). [DOI] [PMC free article] [PubMed] [Google Scholar]
- 55.Vanommeslaeghe K et al. CHARMM general force field: A force field for drug‐like molecules compatible with the CHARMM all‐atom additive biological force fields. Journal of computational chemistry 31, 671–690 (2010). [DOI] [PMC free article] [PubMed] [Google Scholar]
- 56.Yu W, He X, Vanommeslaeghe K & MacKerell AD Jr Extension of the CHARMM general force field to sulfonyl‐containing compounds and its utility in biomolecular simulations. Journal of computational chemistry 33, 2451–2468 (2012). [DOI] [PMC free article] [PubMed] [Google Scholar]
- 57.Walt S.v.d., Colbert SC & Varoquaux G The NumPy Array: A Structure for Efficient Numerical Computation. Computing in Science & Engineering 13, 22–30 (2011). [Google Scholar]
- 58.Ghanakota P & Carlson HA Moving beyond active-site detection: MixMD applied to allosteric systems. The journal of physical chemistry B 120, 8685–8695 (2016). [DOI] [PMC free article] [PubMed] [Google Scholar]
Associated Data
This section collects any data citations, data availability statements, or supplementary materials included in this article.
Supplementary Materials
Data Availability Statement
All data generated or analyzed during this study are included in this article and its supplementary information files, or are available from the corresponding authors upon request. Structures of 4 (CCDC 1825320), 12 (CCDC 1825321), 34 (CCDC 1825319), 37 (CCDC 1825322), and 78 (CCDC 1825323) established by single crystal X-ray structure determinations and accompanying data have been deposited in the Cambridge Crystallographic Data Center (CCDC). Data and reagents requests should be addressed to Enrique Saez (esaez@scripps.edu) or Dale L. Boger (boger@scripps.edu).


