

Abstract
Memory B cells (MBCs) are essential for long-lived humoral immunity. However, the transcription factors involved in MBC differentiation are poorly defined. Here, by single-cell RNA-seq analysis, we identified a population of germinal center (GC) B cells in the process of differentiating into MBCs. Using an inducible Crispr/Cas9 screening approach we identified the hematopoietically expressed homeobox gene Hhex as a transcription factor regulating MBC differentiation. The co-repressor Tle3 was also identified in the screen and was found to interact with Hhex to promote MBC development. Bcl-6 directly repressed Hhex in GC B cells. Reciprocally, Hhex-deficient MBCs exhibited derepressed Bcl6 and reduced expression of Bcl-6-repressed Bcl2. Overexpression of Bcl-2 was able to rescue MBC differentiation in Hhex-deficient cells. We also identified Ski as an Hhex-induced transcription factor involved in MBC differentiation. These findings establish an important role for Hhex-Tle3 in regulating the transcriptional circuitry governing MBC differentiation.
INTRODUCTION
Memory B cells (MBCs) are long-lived cells that mediate humoral immunity by undergoing rapid proliferation and differentiation into antibody-secreting cells following antigen reencounter. MBCs are superior to long-lived plasma cells in responding to variant strains of pathogens such as West Nile virus and influenza1,2. While MBCs can arise independently of the germinal center (GC), the GC is necessary for the affinity maturation of MBCs3. The isotype class-switched MBC response to T-dependent antigens is largely GC-derived4,5.
Understanding how GC B cells differentiate into MBCs is important for the development of therapeutics capable of modulating MBC development. Multiple models have been postulated to explain MBC development. The stochastic model suggests that MBCs are randomly selected from GC B cells and is supported by data from various genetic models showing that a decline in GC B cells often results in a proportional loss in MBCs6–8. The instructive model posits that MBC development is actively regulated by cell-extrinsic signals such as cytokines and cell-contact dependent signals. This model is supported by the finding that perturbations in the ability of B cells to receive T cell help through ablation of the ability to sense interleukin 21 (IL-21) or migrate to the dark zone (DZ) of the GC results in an accumulation of MBCs disproportionate to GC size 9–11. Additionally, follicular helper T (TFH) cell-derived IL-9 can promote MBC development in some settings12,13. MBCs tend to emerge from the GC prior to plasma cells and are predominantly derived from lower-affinity GC B cells that receive less T cell help14,15. Low T cell help is associated with elevated expression of Bach2, which is a transcription factor (TF) that predisposes GC B cells to develop into MBCs14. The majority of GC B cells express Bach2, indicating that other transcriptional regulators are necessary to guide MBC development 14.
We have previously characterized a population of GC B cells differentiating into MBCs following viral infection16. GC memory precursor (PreMem) B cells are transcriptionally and functionally distinct from GC cells and are localized near the GC border12,16. PreMem B cells are found in both mice and humans17. In this study we sought to identify transcriptional regulators of MBC development. Using a CRISPR/Cas9-based knockdown screen we found that ablation of the hematopoietically expressed homeobox protein Hhex or the corepressor Tle3 (transducin-like enhancer of split-3) resulted in impaired MBC differentiation. Hhex has been reported to interact with Tle118 and we find that Hhex directly interacts with Tle3 to promote MBC development. We determined that Hhex is necessary for the development of PreMem B cells and that Bcl-6 represses Hhex expression in GC B cells. Hhex-deficient MBCs have reduced expression of the Bcl-6 target gene Bcl2, and overexpression of Bcl-2 is sufficient to rescue MBC differentiation in Hhex-deficient cells. The Hhex-induced TF Ski also promoted MBC differentiation. Together our data indicates that Hhex cooperates with Tle3 to regulate the transcriptional circuitry governing GC B cell differentiation into MBCs.
RESULTS
Identification of PreMem B cells using single cell RNA sequencing
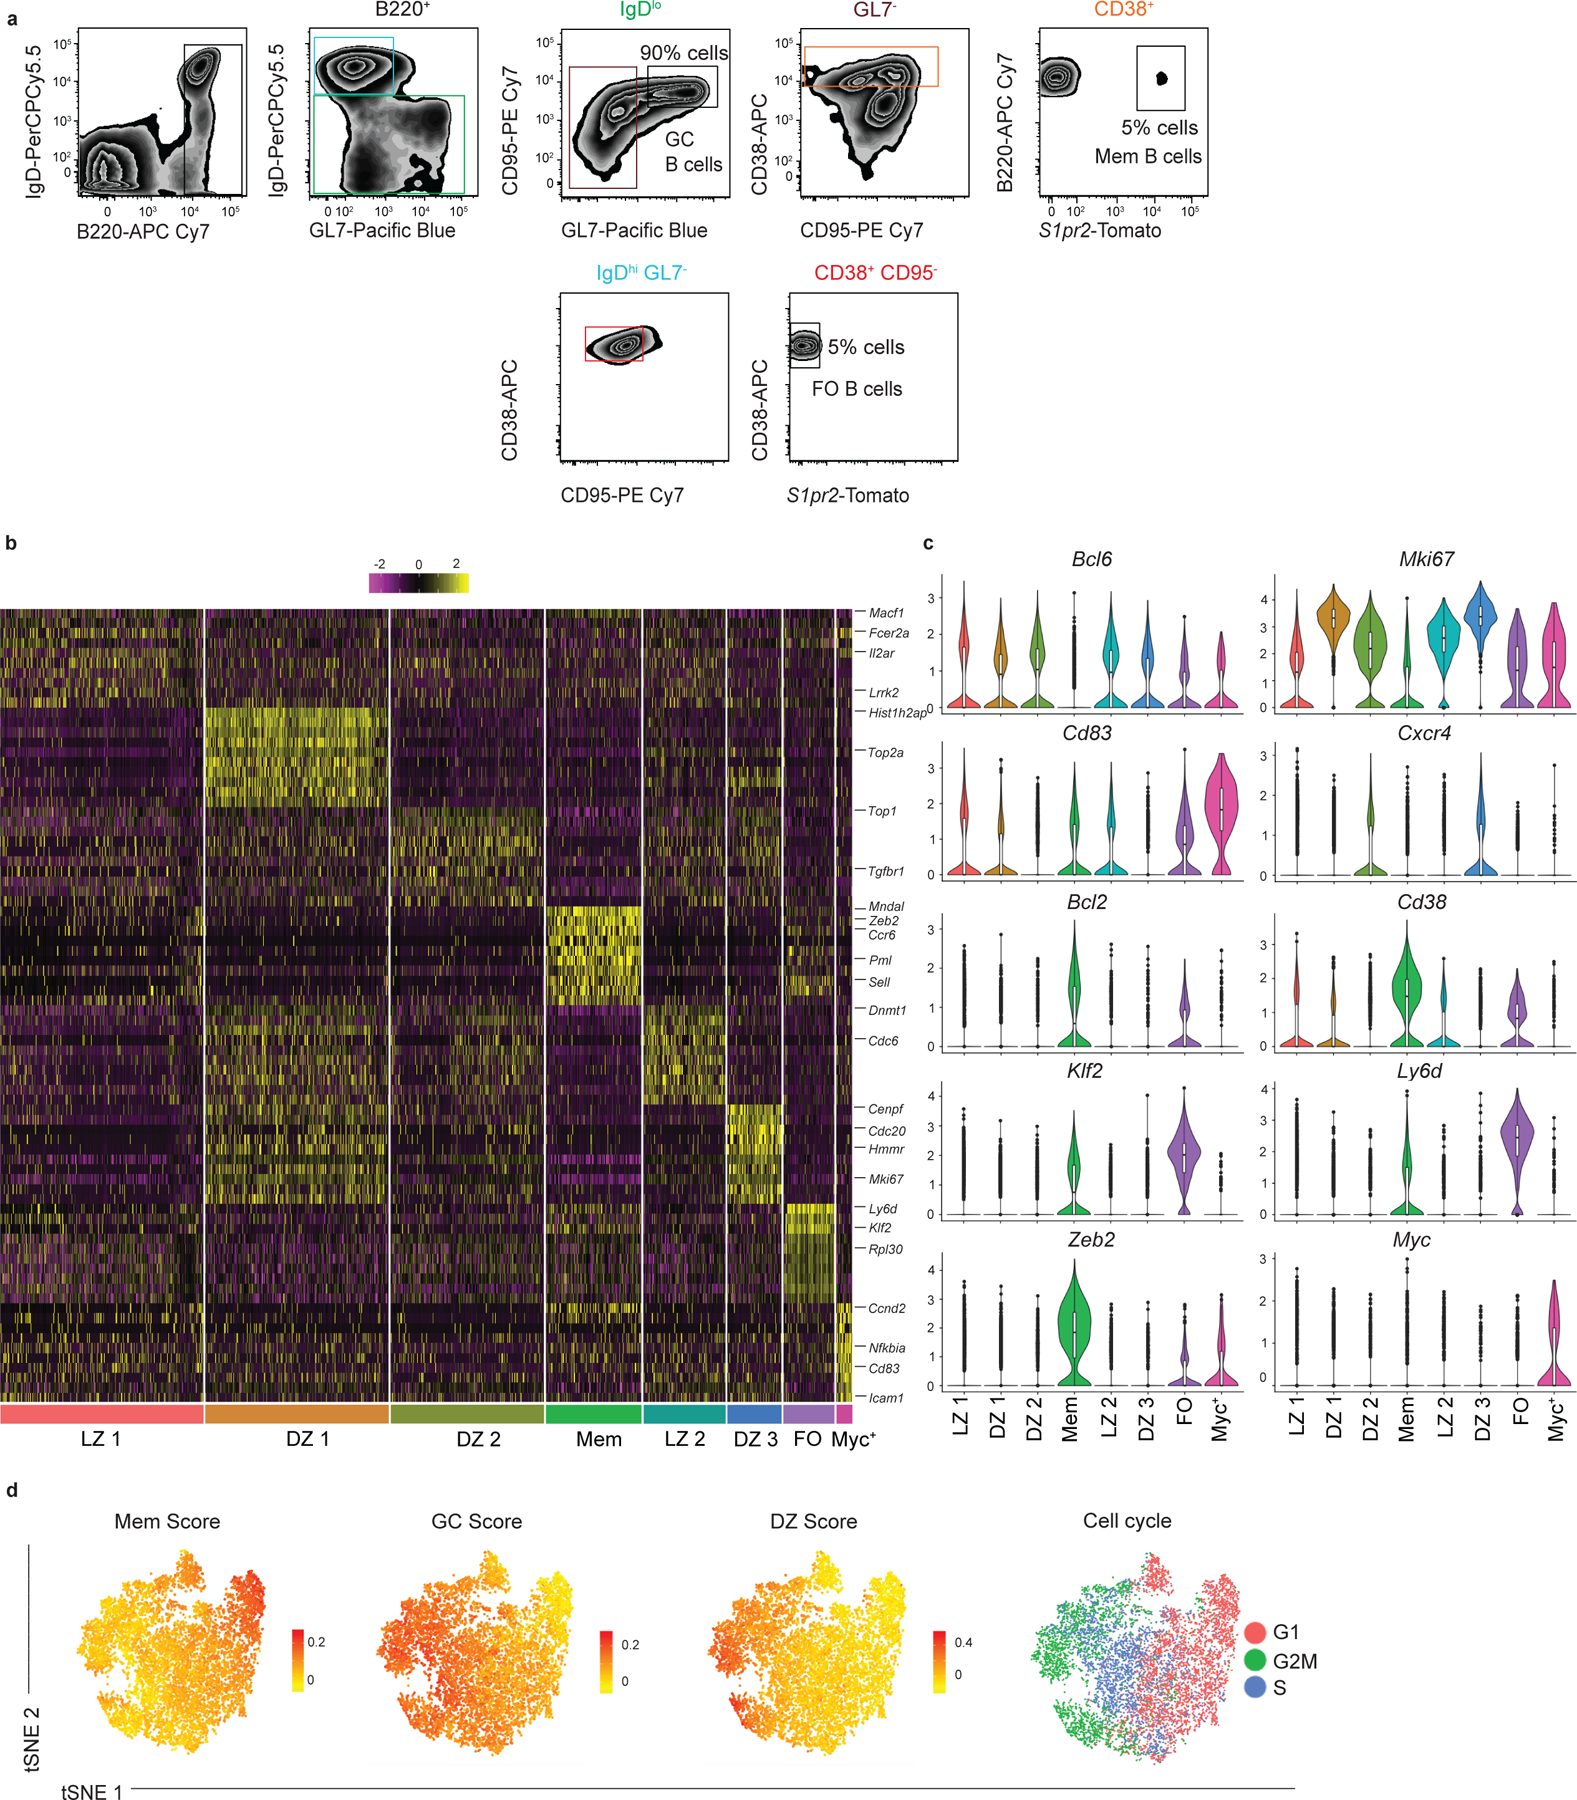
We performed droplet-based single-cell RNA sequencing (scRNA-seq) on sorted splenic B cells from S1pr2-ERT2-cre-TdTomato mice at day 11 post-acute lymphocytic choriomeningitis virus strain Armstrong (LCMV) infection. The sorted population consisted of a mixture of 90% GC B cells, 5% follicular (FO) B cells, and 5% GC-derived MBCs (gating shown in Extended Data Fig. 1a). Day 11 post infection (p.i.) corresponds to the peak of PreMem B cells following LCMV infection16. FO and MBCs were included to allow comparison of the gene expression profile of B cells in these different states. After quality control, we retained 11,238 cells with an average of 1,574 genes per cell; 98.9% of cells were retained for further analysis after removal of non-B cells.
Unsupervised clustering using Seurat19 revealed 8 clusters, as visualized using tSNE, with clusters ranging in size from 207 to 2,765 cells with 33–417 differentially expressed genes (DEGs) per cluster (Fig. 1a,b). The specific DEGs expressed by each cluster (Fig. 1c, Extended Data Fig. 1b,c) suggested assignment to specific cell states, namely FO, GC light zone (LZ), GC DZ and MBC, based on previously described gene expression profiles (Fig. 1a). Landmark genes used to identify clusters include Bcl6, Mki67, Cd83, Cxcr4, Bcl2, Cd38, Klf2, Ly6d, Zeb2, and Myc. Validation of assignment to specific cell states was performed by assigning cells with a score corresponding to their similarity with gene expression profiles distinguishing these states based on bulk RNA-seq analysis (Extended Data Fig. 1d)16,20. Cells were also assigned to a specific cell cycle stage based on their gene expression profile (Extended Data Fig. 1d). The identification of a Myc+ GC cluster is consistent with work identifying ~5% of GC B cells as expressing Myc 21. The significance of the subclustering of LZ and DZ states was not a focus of the current studies and merits future investigation.
Figure 1. Identification of eight B cell clusters following viral infection using scRNA-seq.

(a) Unsupervised clustering of n=11, 238 splenic B cells from S1pr2-ERT2-cre-TdTomato mice at day 11 post LCMV infection, visualized with tSNE. Each point is a single cell colored by cluster assessment. The analyzed B cells include 90% GC B cells (B220+IgDloGL7+CD95+), 5% FO B cells (B220+IgDhiGL7−CD95−CD38+), and 5% MBCs (B220+IgDloGL7−CD38+S1pr2-Tomato+) that were individually sorted from the same group of mice and then pooled. Cells were pooled from 4 mice. (b) Number of cells per cluster (left) and DEGs per cluster (right). (c) Gene expression distinguishing the eight clusters projected onto tSNE plots. Color scaled for each gene with log-normalized expression level noted. See also Figure S1.
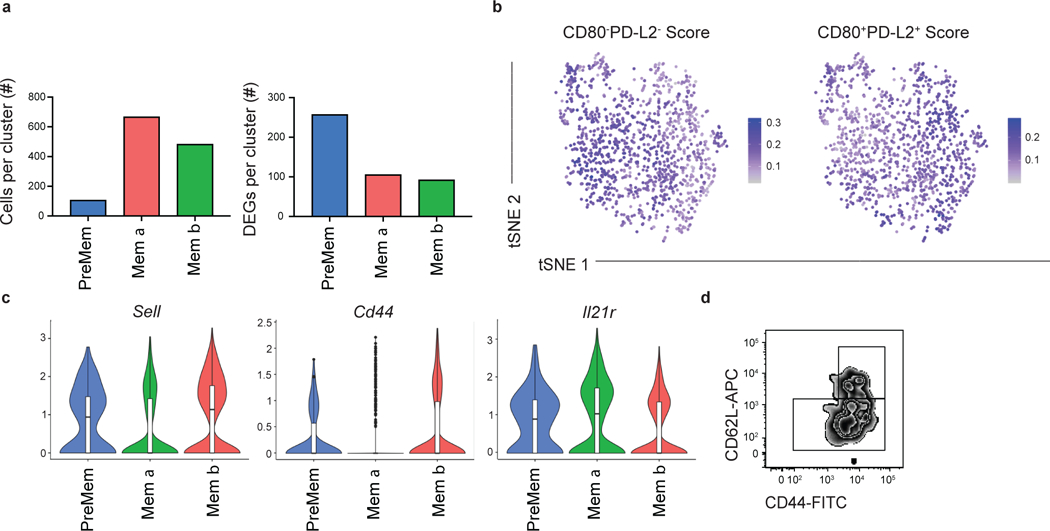
Among the identified clusters was a population of 1,255 cells that transcriptionally resembled MBCs, labeled as Mem (Fig. 1a). The Mem cluster is proximal to the LZ 1 cluster, consistent with the notion that MBCs largely differentiate from LZ GC B cells12,16,17. As PreMem B cells have a similar transcriptional profile to MBCs, we performed additional subclustering analysis of the Mem cluster in order to distinguish the PreMem B cell population 16. We found that the Mem cluster could be divided into 3 clusters, including a population of PreMem B cells and 2 populations of MBCs (termed Mem α and Mem β) (Fig. 2a). Cluster identity was determined based on similarity to gene expression profiles distinguishing MBCs, GC B cells, and PreMem B cells (Fig. 2b). The PreMem cluster consisted of 106 cells with 257 DEGs relative to other cells present in the Mem cluster (Extended Data Fig. 2a). PreMem B cells expressed genes associated with both the GC state (Mki67, Bcl6, Fas) and the MBC state (Cd38, Ccr6, Bcl2) supporting the notion that PreMem cells represent a transitional population (Fig. 2c,d). While both the Mem α and Mem β clusters expressed MBC-associated genes, Mem β cells displayed higher expression of many MBC-associated genes and had the lowest expression of Mki67 (Fig. 2d).
Figure 2. Identification of PreMem B cells using scRNA-seq.

(a) Subclustering analysis of the Mem cluster (n=1,255 cells) of splenic B cells at day 11 post LCMV infection visualized with tSNE. Each point is a single cell colored by cluster assessment. Cells were pooled from 4 mice. (b) Enrichment score for gene signatures distinguishing MBCs (left), GC B cells (middle), and PreMem B cells (right) projected onto tSNE plots. Color scaled for each gene with highest log-normalized expression level noted. (c) Heatmap of each cell’s (column) expression of the top ten DEGs per cluster (rows). Log-normalized expression scaled for each gene. Cluster name displayed below. (d) Violin plots of select gene expression in cells from PreMem (n=106 cells), Mem α (n=482 cells), and Mem β clusters (n=677 cells) with log-normalized expression value labeled. Violin plots are presented with floating boxes showing median (middle line) and quartiles (top and bottom). Minima and maxima are shown as the bottom and top of the violin plot. See also Figure S2.
To investigate the relationship between the Mem α and β clusters and previously identified MBC subsets, we assigned cells with a score corresponding to their similarity with gene expression profiles distinguishing CD80−PD-L2− and CD80+PD-L2+ MBCs22. While Cd80 and Cd273 (PD-L2) were not among the DEGs distinguishing the Mem clusters, we found that the Mem α cluster was enriched for genes associated with CD80−PD-L2− cells, while the Mem β cluster had a gene signature associated with CD80+PD-L2+ MBCs (Extended Data Fig. 2b). The Mem β cluster displayed elevated expression of several genes encoding cell surface proteins include Sell (encoding CD62L) and Cd44, while the Mem α cluster displayed elevated expression of Il21r (Extended Data Fig. 2c). Flow cytometric analysis of splenocytes at day 11 of the LCMV response confirmed that MBC subsets could be identified based on CD44 and CD62L expression (Extended Data Fig. 2d). Together, these data suggest that scRNA-seq can identify biologically relevant MBC subsets.
Screen of transcription factors expressed by PreMem B cells
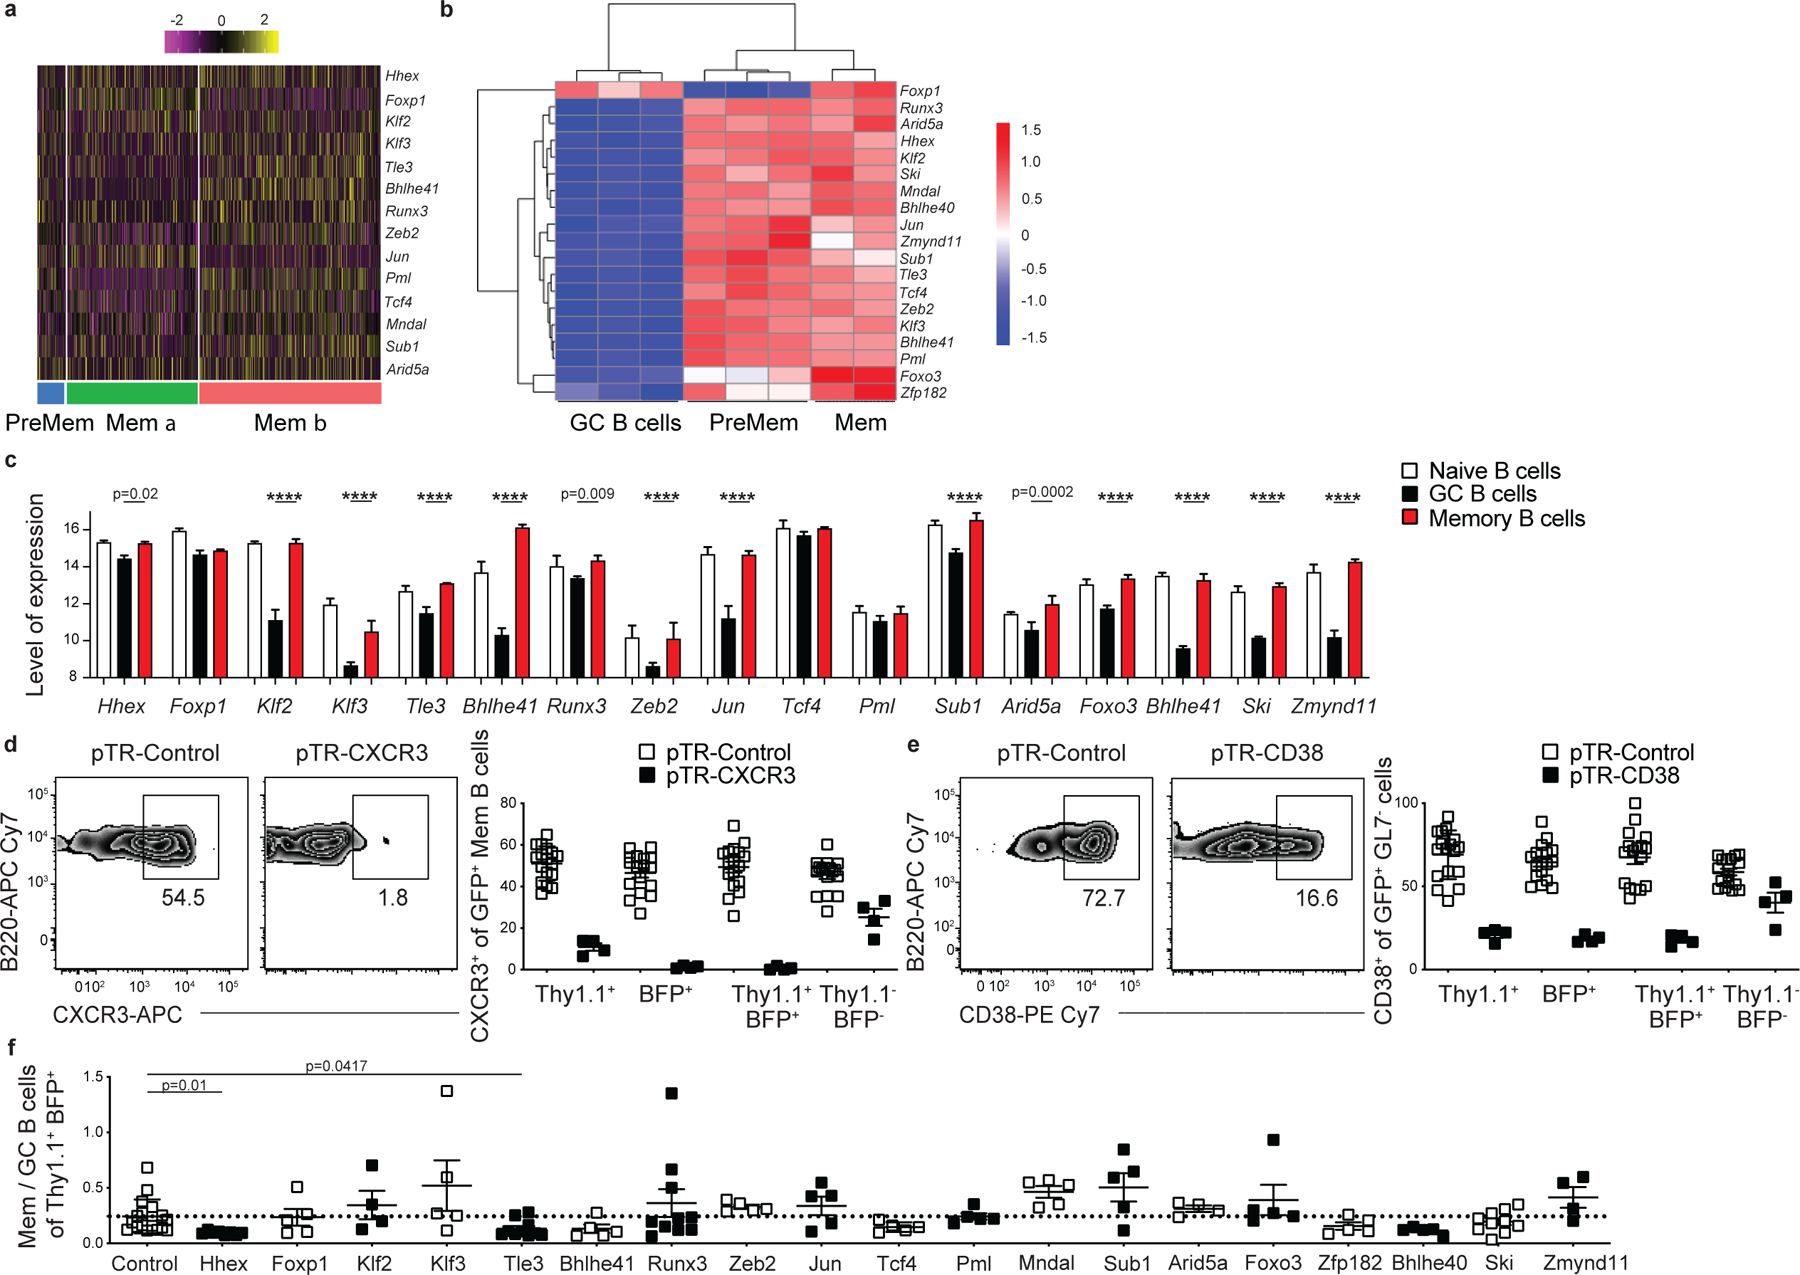
MBCs displayed elevated expression of a number of TFs relative to GC B cells (Fig. 3a). Importantly, many of these TFs are already expressed in PreMem B cells based on single-cell and bulk RNA-seq analysis (Extended Data Fig. 3a,b). Human MBCs also display elevated expression of the same TFs relative to GC B cells (Extended Data Fig. 3c)23. We sought to perform a screen of TFs regulating MBC development. As FO B cells often express TFs expressed by MBCs, we used a conditional Cas9 approach to specifically ablate TF expression in activated B cells. We intercrossed Rosa26-LSL-Cas9 and Cg1Cre mice to generate mice in which Cas9 activity is limited to cells expressing endogenous Ighg1, thereby strongly enriching for Cre activity among GC-derived cells24,25. Although the Cre is expressed from the Cg1 locus, it is active in mediating gene deletion in multiple Ig isotypes in vivo25. We were not able to use S1pr2-ERT2-Cre for these experiments because GC cells expressing Cas9 that were also exposed to tamoxifen underwent cell death, likely due to excess toxicity26.
Figure 3. In vivo conditional Cas9 screen of transcription factors expressed by PreMem B cells.

(a) Heatmap of each cell’s (column) expression of select TFs per cluster (rows). Log-normalized expression scaled for each gene. Cluster name displayed below. (b) Gating strategy for conditional Cas9 screen. Mice were sacrificed at day 30 post LCMV infection and splenic B cells were analyzed as shown. Gates are color coded and shown in series from left to right. Cas9-expression is driven by a Cg1Cre with Cas9-expressing cells marked as GFP+. (c) Representative FACS plots showing the percentage of sgRNA 1-Thy1.1+sgRNA 2-BFP+ GC and MBCs at day 30 post LCMV infection in mice containing cells transduced with sgRNAs targeting a control nonexpressed gene, Hhex, Tle3, or Runx3. Transduction efficiencies varied between constructs and sets of BM chimeras. Data are representative of 6 independent experiments with at least 3 mice per group. (d) Ratio of sgRNA 1-Thy1.1+ sgRNA 2-BFP+ MBCs (B220+IgDloGL7−CD38+GFP+) to sgRNA 1-Thy1.1+sgRNA 2-BFP+ GC B cells (B220+IgDloGL7+CD95+GFP+) for mice containing cells transduced with sgRNA targeting the listed genes. Data are pooled from 6 independent experiments with at least 3 mice per group. Statistical analyses were performed using the ordinary one-way ANOVA with two-sided Dunnett multiple comparison testing (****, p < 0.0001). Scatter plots indicate mean (middle line) with error bars indicating standard error mean. See also Figure S3.
Bone marrow from Rosa26-LSL-Cas9f/+ Cg1Cre/+ mice was transduced with two distinct single guide (sg) RNA-containing retroviral constructs per gene target (expressing either Thy1.1 or BFP as reporters) and then transferring to lethally irradiated recipient mice. Following reconstitution, mice were infected with LCMV and analyzed on day 30 p.i. The Cg1Cre drives expression of Cas9 with Cas9-expressing cells marked as GFP+ 24. The percentage of sgRNA 1-Thy1.1+ sgRNA 2-BFP+ cells among the Cre expressing GC and MBC population was then determined (Fig. 3b). The efficiency of this approach was tested using sgRNAs specific for Cd38 and Cxcr3 with it being found that there was 70–99% ablation of target protein expression on Cre-expressing B cells as quantified by flow cytometric analysis (Extended Data Fig. 3d,e). Individual guides were not validated so we cannot exclude the possibility of false negatives due to incomplete gene targeting. We screened 19 TFs expressed by MBCs and identified 3 TFs for which gene ablation led to a significant change in the fraction of MBCs relative to GC B cells compared to control sgRNA-transduced cells (Fig. 3c,d). Specifically, we found that ablation of Hhex or Tle3 led to impaired MBC development, while loss of Runx3 resulted in a slight increase in MBC development (Fig. 3c,d, Extended Data Fig. 3f). These data indicate sgRNA transduction of Rosa26-LSL-Cas9f/+ Cg1Cre/+ bone marrow is a powerful tool to study GC B cell differentiation in vivo.
Hhex and Tle3 promote memory B cell development
We next investigated whether retroviral overexpression of Hhex or Tle3 was sufficient to promote MBC development. Bone marrow was transduced with plasmids expressing these TFs and then transferred to lethally irradiated recipient mice. Following reconstitution, mice were infected with LCMV and analyzed on day 30 p.i. The percentage of transduced FO, GC, and MBCs was then determined. We found that overexpression of Hhex or Tle3 was sufficient to promote MBC development relative to the FO or GC B cells (Fig. 4a,b). Overexpression of Hhex or Tle3 also led to a decrease in the percentage of GC B cells relative to FO B cells (Fig. 4a,b). The increased fraction of Hhex-overexpressing MBCs relative to GC B cells was consistent between days 15–60 p.i. (Extended Data Fig. 4a). Hhex overexpression also promoted the development of nitrophenyl (NP+) MBCs following immunization with nitrophenyl–chicken γ-globulin (NP-CGG) in alum, indicating that Hhex can promote MBCs during both TH1-type and TH2-type immune responses (Extended Data Fig. 4b,c).
Figure 4. Overexpression of Hhex or Tle3 promotes memory B cell differentiation.

(a) Representative FACS plots of the percentage of transduced (Thy1.1+) cells among splenic FO (B220+IgDhiGL7−CD38+CD95−), GC (B220+IgDloGL7+CD95+), and MBCs (B220+IgDloGL7−CD38+CD95+CD73+) at day 30 post LCMV infection with empty vector, Hhex, or Tle3. Transduction efficiencies varied between constructs. The MSCV2.2 retroviral vector was used for all transductions. Data are representative of 7 independent experiments with at least 3 mice per group. (b) Ratio of transduced GC to FO B cells (left), MBCs to FO B cells (middle), and MBCs to GC B cells (right) in experiments of the type in a. Data are pooled from 7 independent experiments with at least 3 mice per group. Statistical analyses were performed using the ordinary one-way ANOVA with two-sided Dunnett multiple comparison testing (****, p < 0.0001). Scatter plots indicate mean (middle line) with error bars indicating standard error mean. (c) Representative FACS plots of the percentage of transduced (Thy1.1+) cells among splenic GC (B220+IgDloGL7+CD95+S1pr2-Tomato+), and MBCs (B220+IgDloGL7−CD38+S1pr2-Tomato+) at day 30 post LCMV infection of mice reconstituted with S1pr2-ERT2cre TdTomato bone marrow transduced with a control (EV) or Hhex expressing loxp-EGFP-loxp-MSCV-IRES-Thy1.1 vector. Mice were treated with tamoxifen at day 4 p.i. to induce Cre expression. Data are representative of 2 independent experiments with at least 5 mice per group. (d) Ratio of transduced MBCs to GC B cells in the experiment described in c. Data are representative of 2 independent experiments with at least 5 mice per group. Statistical analyses were performed using the unpaired two-tailed Student’s t-test. Scatter plots indicate mean (middle line) with error bars indicating standard error mean. See also Figure S4.
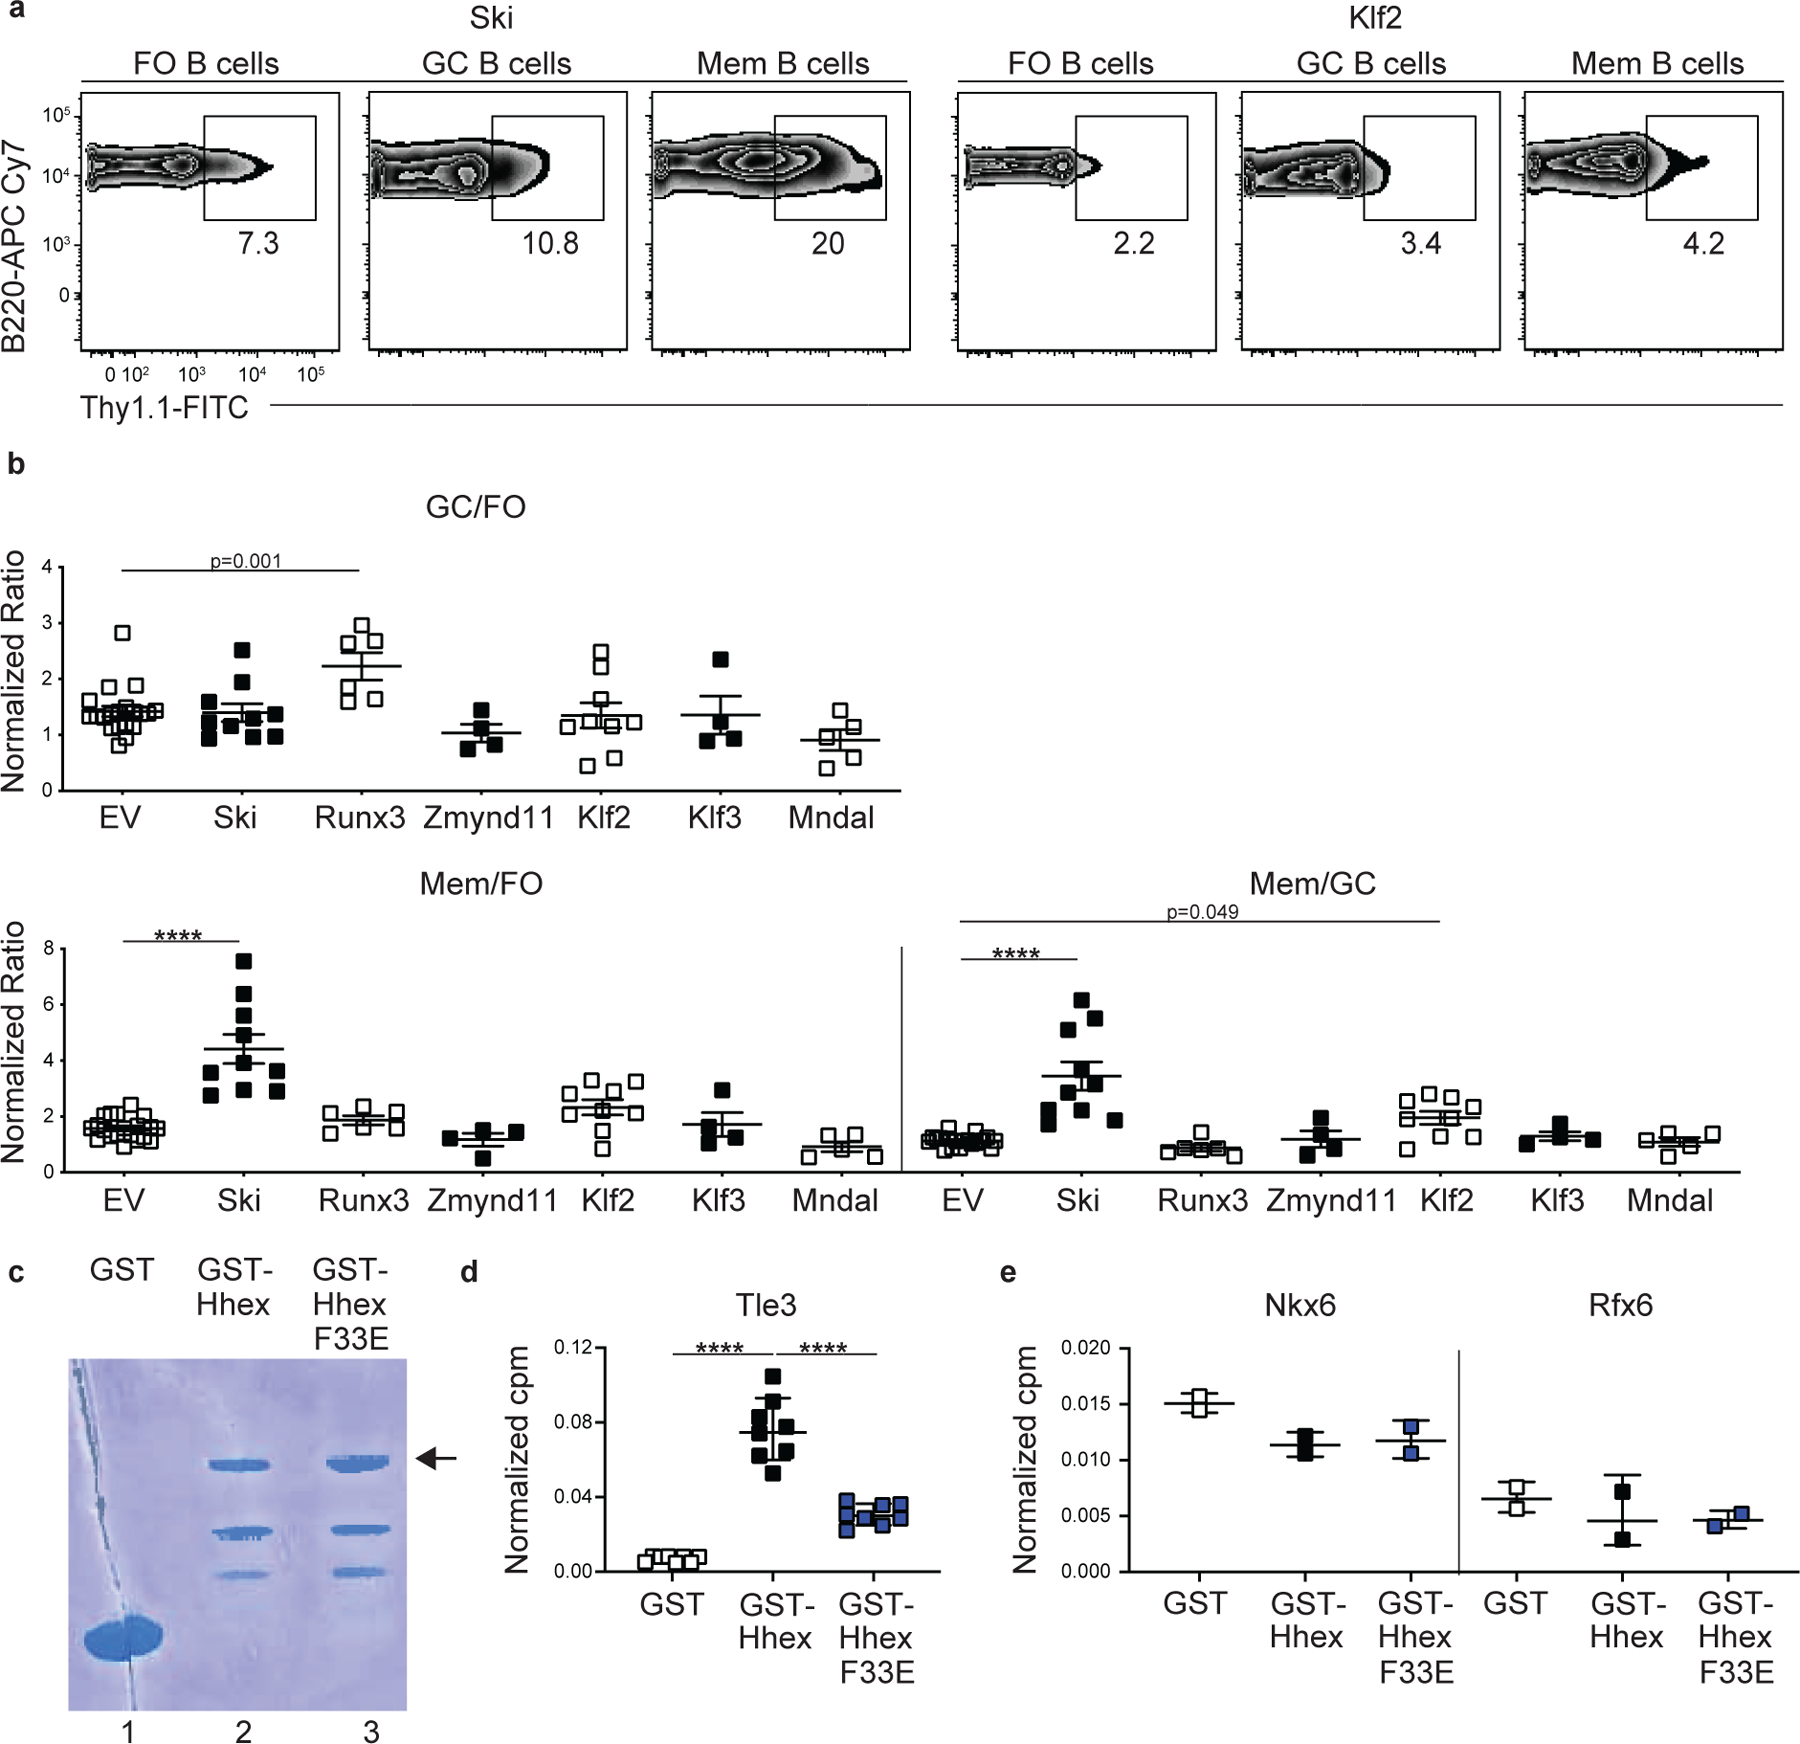
We tested several additional TFs using the retroviral overexpression approach and found that Mndal, Zmynd11, and Klf3 overexpression failed to significantly promote MBC development (Extended Data Fig. 5a,b). Interestingly, overexpression of Ski or Klf2 was sufficient to promote MBC development relative to GC B cells (Extended Data Fig. 5a,b). These findings may be in accord with the observation that retroviral overexpression of Ski and Klf2 imparts a competitive advantage to CD40-engaged B cells in vitro27.
To further explore the role of Hhex in MBCs we tested whether retroviral overexpression specifically in GC B cells was sufficient to promote MBC development. To perform this experiment, we generated a loxp-EGFP-STOP-loxp-MSCV-IRES-Thy1.1 vector in which Hhex was inserted downstream of the floxed EGFP-STOP element. Expression of Cre recombinase by cells transduced with this vector will lead to excision of the loxp-EGFP-STOP-loxp sequence and subsequent expression of the downstream gene. Bone marrow from S1pr2-ERT2-cre-TdTomato mice was transduced with an Hhex expressing loxp-EGFP-STOP-loxp-MSCV-IRES-Thy1.1 plasmid and transferred to lethally irradiated recipient mice14. S1pr2 is highly and specifically expressed in GC B cells so Cre expression among B cells in S1pr2-ERT2-cre-TdTomato mice is restricted to GC-derived cells28. Following reconstitution, mice were infected with LCMV, treated with tamoxifen beginning at day 4 to induce Cre expression in S1pr2 expressing cells, and analyzed on day 30 p.i. We found that Hhex overexpression promoted MBC development relative to empty vector (EV)-transduced cells (Fig. 4c,d). This indicates that Hhex can specifically function in GC B cells to promote their differentiation into MBCs.
Hhex promotes MBC development through direct binding to DNA
Hhex is a homeodomain TF that is important for the development of common lymphoid progenitor cells and which promotes stem cell self-renewal under conditions of hematopoietic stress29,30. Hhex consists of three functional domains capable of contributing to the regulation of gene expression (Fig. 5a)31. To determine which domains contribute to the promotion of MBC development, we generated retroviral constructs containing mutant forms of Hhex that either lack the ability to bind DNA (N188A) or the acidic C-terminal activation region (ΔCT), which is involved in transcriptional activation of Hhex-regulated genes32,33. We found that cells overexpressing the Hhex N188A mutant had reduced MBC development relative to EV-transduced FO or GC B cells (Fig. 5b,c). Cells overexpressing HhexΔCT had similar MBC development to EV-transduced cells, but did not display the enhanced MBC development evident in cells overexpressing full-length Hhex overexpression (Fig. 5b,c). These data indicate that the ability of Hhex to promote MBC development is dependent on both binding DNA via the homeodomain and on the C-terminal domain.
Figure 5. Hhex promotes memory B cell differentiation through binding to DNA and interaction with Tle3.

(a) Schematic representation of the domains found in Hhex. Location of Eh-1 motif (aa 31–41, TPFYIDDILGR) in N-terminus is indicated (black). (b) Representative FACS plots of the percentage of transduced cells among splenic FO (B220+IgDhiGL7−CD38+CD95−), GC (B220+IgDloGL7+CD95+), and MBCs (B220+IgDloGL7−CD38+CD95+CD73+) at day 30 post LCMV infection in empty vector, Hhex, Hhex N188A, and Hhex ΔCT-overexpressing bone marrow chimeras. Data are representative of 2 independent experiments with at least 4 mice per group. (c) Ratio of transduced GC to FO B cells (left), MBCs to FO B cells (middle), and MBCs to GC B cells (right). Data are representative of 2 independent experiments with at least 4 mice per group. Statistical analyses were performed using the ordinary one-way ANOVA with two-way Dunnett multiple comparison testing for comparisons of Hhex versus other groups (****, p < 0.0001). For comparison of EV versus N188A, the unpaired two-tailed Student’s t-test was used. Scatter plots indicate mean (middle line) with error bars indicating standard error mean. (d) Interaction of in vitro translated and transcribed Tle3-FLAG with glutathione beads coated with GST (lane 1), GST-Hhex (lane 2), or GST-Hhex F33E (lane 3) detected by FLAG Western blot. Lane 4 is a control showing 20% of Tle3 input. Tle3 is a 772aa protein with an MW of 83kDa. Data are representative of 2 independent experiments. (e) Representative FACS plots of the percentage of transduced cells among splenic FO, GC, and MBCs at day 30 post LCMV infection in Hhex F33E-overexpressing bone marrow chimeras. Data are representative of 2 independent experiments with at least 4 mice per group. (f) Ratio of transduced GC to FO B cells (left), MBCs to FO B cells (middle), and MBCs to GC B cells (right). Data are representative of 2 independent experiments with at least 4 mice per group. Scatter plots indicate mean (middle line) with error bars indicating standard error mean. See also Figure S5.
Hhex directly interacts with Tle3 to promote MBC development
Tle3 is a member of the Tle/Groucho family of co-repressors. These proteins do not have a DNA-binding domain but interact with multiple transcription factors through either of two conserved domains34. Hhex was found to interact with Tle1 via a conserved N-terminal Eh-1 motif with Tle118. This motif was originally identified in Drosophila homeodomain proteins Engrailed and Goosecoid, where it mediates their interaction with Groucho 35. Given that both Hhex and Tle3 promoted MBC development, we sought to determine whether Hhex interacted with Tle3. We generated gluthathione S-transferase (GST) fusion proteins expressing either the wild-type N-terminal domain of mouse Hhex or a version with a mutation in the Eh-1 motif (F33E) (Extended Data Fig. 5c) and used them in binding assays with in vitro translated C-terminal Flag-tagged Tle3. Tle3 was found to bind strongly to GST-Hhex but weakly, if at all, to GST-Hhex F33E or GST alone (Fig. 5d). Similar findings were made in pull-down assays with radiolabeled Tle3 (Extended Data Fig. 5d). Neither GST-Hhex or GST-Hhex F33E displayed binding to TFs not known to interact with Hhex (Extended Data Fig. 5e). To determine the in vivo relevance of the interaction between Hhex and Tle3, we generated a retroviral construct containing the mutant form of Hhex that has impaired binding to Tle3 (F33E). We found that cells overexpressing the Hhex F33E mutant did not display an enhancement in MBC development relative to EV-transduced cells following LCMV infection (Fig. 5e,f). These data indicate that Hhex and Tle3 cooperate to promote MBC development.
Inducible ablation of Hhex leads to reduced MBC development
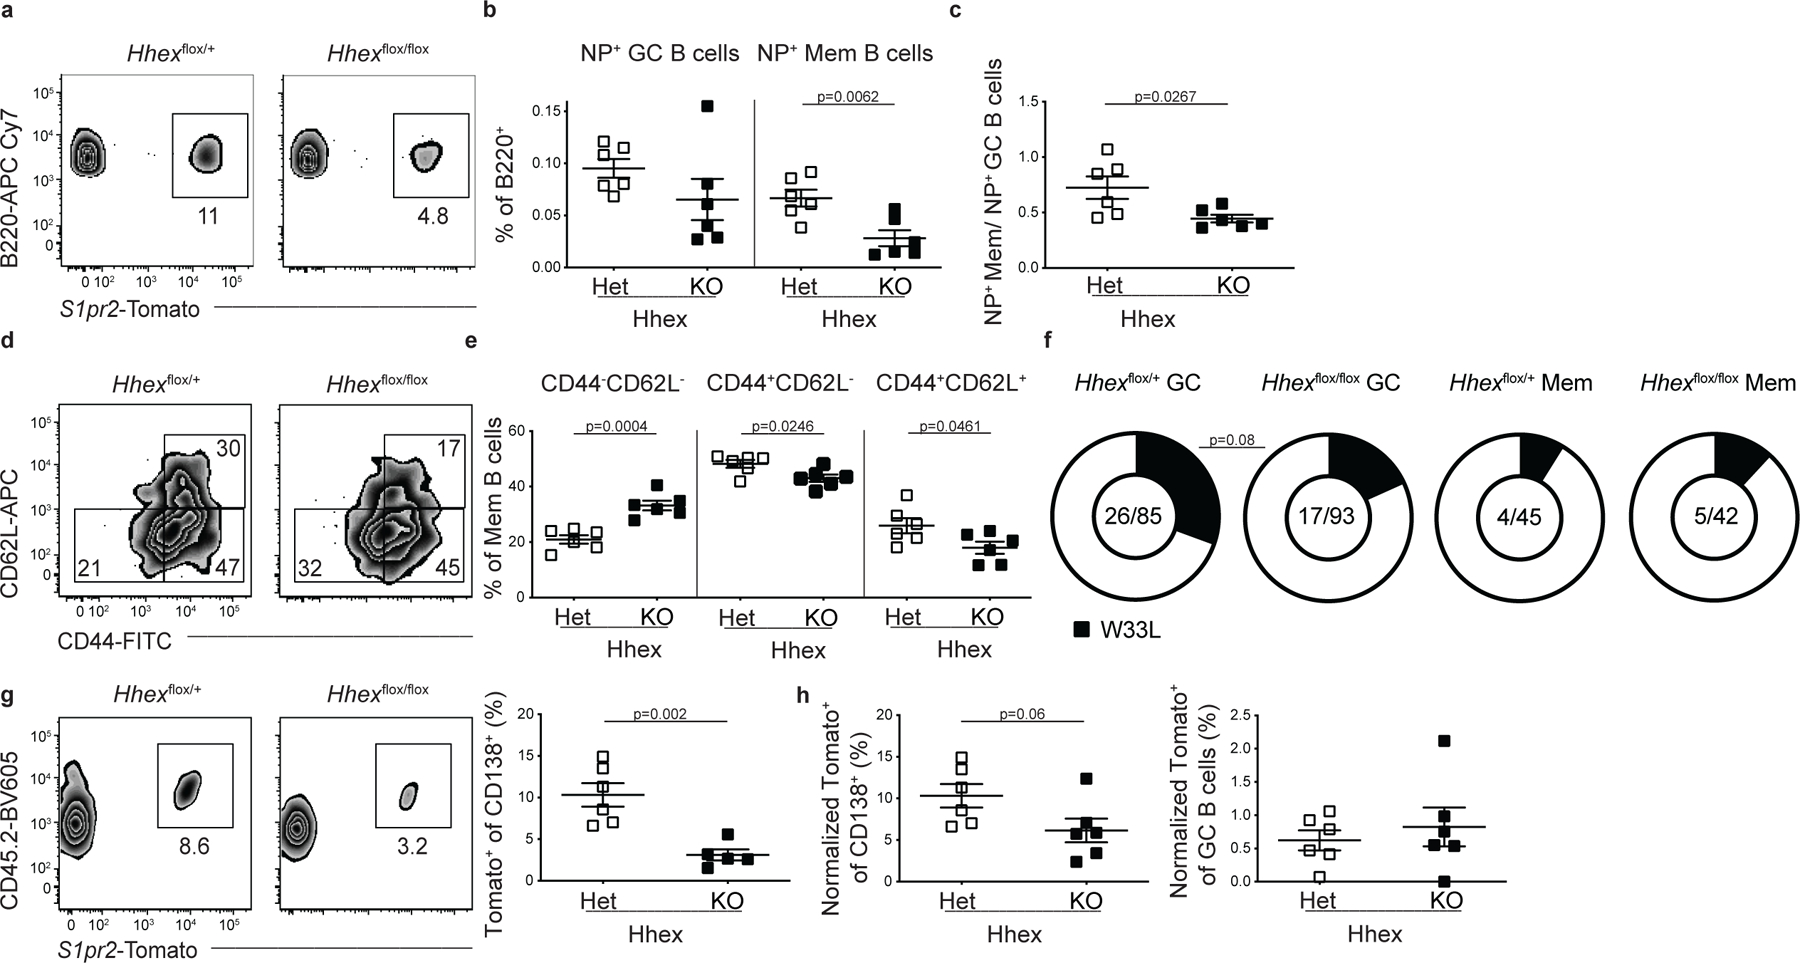
To further explore how Hhex ablation affects MBC development, we intercrossed Hhexf/f and S1pr2-ERT2-cre-TdTomato mice. We then infected Hhex+/+ (WT), Hhexf/+ (Het), or Hhexf/f (KO) S1pr2-ERT2creTdTomato mice with LCMV and treated with tamoxifen beginning at day 4 p.i (Fig. 6a). Mice were analyzed at day 30 p.i. and we found that cells lacking Hhex displayed a marked reduction in the percentage and number of MBCs (Fig. 6b–d). There was no difference in the number or percentage of GC B cells in Hhex-deficient mice (Fig. 6c–d). The relative reduction in the percentage of MBCs in Hhex-deficient mice was similar at days 15 and 45 post LCMV infection, with no difference in the percentage of GC B cells apparent at either time point (Fig. 6e). There was also no difference in the development of MBC subsets following LCMV infection, as identified using CD44 and CD62L (Fig. 6f). Loss of Hhex did not impair the development of GC-derived CD138+ plasma cells or LCMV-specific IgG antibodies (Fig. 6g,h). We also did not observe differences in the proportion of proliferating or apoptotic GC cells in Hhex-deficient mice, as indicated by the percentage of BrdU+ or Casp3+ GC B cells, respectively (Fig. 6i).
Figure 6. Ablation of Hhex in GC B cells impairs memory B cell differentiation.

(a) Experimental schematic. Hhex+/+ (WT), Hhexflox/+ (Het), and Hhexflox/flox (KO) S1pr2-ERT2cre TdTomato mice were infected with LCMV, treated with tamoxifen beginning at day 4, and then analyzed at day 30 p.i. (b) Representative FACS plots of the percentage of S1pr2-Tomato+ cells among splenic B220+IgDloGL7−CD38+ MBCs in the groups indicated in a. Data are representative of 4 independent experiments with at least 4 mice per group. (c, d) Number (c) or percentage (d) of GC B cells (B220+IgDloGL7+CD95+S1pr2-Tomato+) and MBCs (B220+IgDloGL7−CD38+S1pr2-Tomato+) in Hhex WT, Het, and KO mice at day 30 post LCMV infection. Data are representative of 4 independent experiments with at least 4 mice per group. Statistical analyses were performed using the ordinary one-way ANOVA with two-sided Dunnett multiple comparison testing (****, p < 0.0001). Scatter plots indicate mean (middle line) with error bars indicating standard error mean. (e) Percentage of B cells that are GC B cells (left) and MBCs (right) in Hhex Het and KO mice at days 15 and 45 post LCMV infection. Data are representative of 2 independent experiments with 4–6 mice per group. Statistical analyses were performed using the unpaired two-tailed Student’s t-test (****, p < 0.0001). Scatter plots indicate mean (middle line) with error bars indicating standard error mean. (f) Percentage of MBCs that were CD62L− (left) and CD44+CD62L+ (right) in Hhex Het and KO mice at day 30 post LCMV infection. Data are pooled from 2 independent experiments with at least 2 mice per group. Scatter plots indicate mean (middle line) with error bars indicating standard error mean. (g) Percentage of live splenic cells that are CD138+S1pr2-Tomato+ in Hhex WT, Het, and KO mice at day 30 post LCMV infection. Data are representative of 2 independent experiments with at least 4 mice per group. Scatter plots indicate mean (middle line) with error bars indicating standard error mean. (h) Quantification of anti-LCMV IgG in the serum of Hhex WT, Het, and KO mice at day 30 post LCMV infection. Data are representative of 2 independent experiments with at least 4 mice per group. Scatter plots indicate mean (middle line) with error bars indicating standard error mean. (i) Percentage of GC B cells that were BrdU+ (left) and Casp3+ (right) in Hhex Het and KO mice at day 30 post LCMV infection. Data are pooled from 2 independent experiments with 4 mice per group. Scatter plots indicate mean (middle line) with error bars indicating standard error mean. (j) Representative FACS plot (left) and percentage (right) of CD138+ cells that are CD45.2+S1pr2-Tomato+ at day 5 post challenge with LCMV. Equivalent numbers of splenic CD45.2+ T and B cells from Hhex Het and KO LCMV immune mice at day 30 p.i. were transferred to naïve CD45.1+ recipients one day prior to challenge. Data are representative of 2 independent experiments with 3 mice per group. Statistical analyses were performed using the unpaired two-tailed Student’s t-test. Scatter plots indicate mean (middle line) with error bars indicating standard error mean. (k) Percentage of CD138+ cells (left) and GC B cells (right) that were CD45.2+S1pr2-Tomato+ at day 5 post challenge with LCMV when normalized to the percentage of MBCs present in the transferred cells. Data are pooled from 2 independent experiments with 3 mice per group. Scatter plots indicate mean (middle line) with error bars indicating standard error mean. See also Figure S6.
A reduction in the magnitude of the NP-specific MBC response was also found following NP-CGG in alum immunization of Hhex KO S1pr2-ERT2-cre-TdTomato mice (Extended Data Fig. 6a–c). There was a decrease in the CD44+CD62L+ and CD44+CD62L− MBC populations in the absence of Hhex (Extended Data Fig. 6d, e). While GC-derived MBCs are largely CD44+ following LCMV infection, a significant population of CD44−CD62L− MBCs develop following NP-CGG in alum immunization and are increased in the absence of Hhex (Extended Data Fig. 6d,e). Alterations in MBC subset composition that develop following viral infection or protein immunization likely reflect differences in the magnitude of T cell help received by GC B cells 36. While Hhex-deficient MBCs displayed a similar degree of affinity maturation based on the frequency of high-affinity mutations in the canonical NP-responding gene VH186.2 at day 12, there was a slight decrease in high-affinity mutations in Hhex-deficient GC B cells (Extended Data Fig. 6f). This observation could perhaps correspond to a transient buildup of low-affinity GC B cells in the absence of Hhex, cells that would normally have developed into MBCs.
To examine the functionality of Hhex-deficient MBCs, we transferred an equal number of B cells from Hhex+/– and Hhex−/− LCMV-immune mice (day 30 p.i.) into congenically mismatched naive recipients and challenged the next day with LCMV. CD4+ T cells from LCMV immune mice were also transferred to recipients, since memory CD4+ T cells promote MBC recall 37. B cells transferred from Hhex−/− mice displayed an impaired ability to differentiate into CD138+ cells following viral challenge (Fig. 6j). The magnitude of impairment corresponded to the reduced frequency of MBCs in the Hhex-deficient cells, as there was no difference in the ability of transferred cells to differentiate into CD138+ cells or GC B cells when normalized to the starting percentage of MBCs (Fig. 6k). An analogous approach was used to assess MBC recall following NP-CGG in alum immunization, and the Hhex-deficient MBCs generated under this immunization condition displayed a trend towards reduced plasma cell development (Extended Data Fig. 6g, h). Together these data indicate that Hhex is necessary for the development of MBCs during both TH1-type and TH2-type immune responses, and it can regulate the ability of MBCs to respond upon antigen reencounter in some settings.
Bcl-6 represses expression of Hhex in GC B cells
We next examined how Hhex expression is regulated in GC B cells. Hhex was highly expressed in both FO and MBCs, but was downregulated in GC B cells. Bcl-6 is highly expressed in GC B cells and serves to maintain GC B cell identity through repression of target genes. Analysis of publicly available chromatin immunoprecipitation (ChIP) sequencing data of human GC B cells 38 revealed that Bcl-6 binds to the Hhex promoter (Fig. 7a). This binding occurs in complex with the corepressor BCOR, but not the corepressor SMRT (Fig. 7a). Retroviral overexpression of Bcl-6 was sufficient to repress Hhex expression in mouse B cells (Fig. 7b). Reciprocally, retroviral overexpression of Hhex led to a reduction in GC B cells. Together, these data indicate that Bcl-6 and Hhex function in opposition to regulate GC B cell differentiation, possibly through direct binding to common DNA elements.
Figure 7. Hhex promotes the development of PreMem B cells.

(a) Bcl6, Bcor, Smrt, and input ChIP tracks for Hhex from human GC B cells. H3K4me3 ChIP track from human B cells is shown to indicate promoter location. (b) Expression of Bcl6 and Hhex relative to Hprt in FO B cells overexpressing Bcl6. Data are pooled from 2 independent experiments with at least 2 mice per group. Statistical analyses were performed using the unpaired two-tailed Student’s t-test. Scatter plots indicate mean (middle line) with error bars indicating standard error mean. (c) Representative FACS plots (left) and percentage (right) of CD38+ cells among splenic GC B cells (B220+IgDloGL7+CD95+Eprhinb1+S1pr2-Tomato+) in Hhexflox/+ (Het) and Hhexflox/flox (KO) S1pr2-ERT2cre TdTomato mice at day 11 post LCMV infection. Data are representative of 3 independent experiments with at least 3 mice per group. Statistical analyses were performed using the unpaired two-tailed Student’s t-test. Scatter plots indicate mean (middle line) with error bars indicating standard error mean. (d) Percentage of B cells that are GC B cells (B220+IgDloGL7+CD95+S1pr2-Tomato+) (left) and MBCs (B220+IgDloGL7−CD38+S1pr2-Tomato+) (right) in Hhex Het and KO mice at day 11 post LCMV infection. Data are pooled from 3 independent experiments with at least 3 mice per group. Statistical analyses were performed using the unpaired two-tailed Student’s t-test. Scatter plots indicate mean (middle line) with error bars indicating standard error mean. (e) Ratio of MBCs to GC B cells in Hhex Het and KO mice at day 11 post LCMV infection. Data are pooled from 3 independent experiments with at least 3 mice per group. Statistical analyses were performed using the unpaired two-tailed Student’s t-test. Scatter plots indicate mean (middle line) with error bars indicating standard error mean. (f) Percentage of GFP+ B cells that are MBCs (B220+IgDloGL7−CD38+CD95+CD73+) in Hhexflox/+ and Hhexflox/floxUbcCre –ERT2RosamTmG mice at day 80 post LCMV infection. Mice were treated with tamoxifen beginning at day 35 p.i. Data are pooled from 2 independent experiments with at least 6 mice per group. Scatter plots indicate mean (middle line) with error bars indicating standard error mean. See also Figure S7.
Hhex promotes the development of PreMem B cells
To determine whether Hhex promotes the development of PreMem B cells, we analyzed tamoxifen treated Hhexf/f S1pr2-ERT2creTdTomato mice at day 11 post LCMV infection. We found that Hhex KO mice had a significant reduction in PreMem B cells, identified based on previous work as the percentage of GC B cells (identified as B220+IgDloGL7+CD95+Ephrinb1+S1pr2-Tomato+) expressing CD38 (Fig. 7c, gating shown in Extended Data Fig. 7a)16. We also found that while there was a decrease in the percentage of MBCs at day 11 in Hhex-deficient cells, there was an increase in the percentage of GC B cells (Fig. 7d, e). The transient increase in GC B cells at day 11 might reflect cells that normally would transition into MBCs but rather are being temporally maintained in the GC.
To evaluate whether Hhex regulates MBC maintenance, we crossed Hhexflox/flox and UbcCre –ERT2RosamTmG mice. We then infected Hhexflox/floxUbcCre –ERT2RosamTmG and control mice with LCMV. At day 35 p.i. the mice were treated with tamoxifen to ablate Hhex expression in all cells. Consistent with previous work, MBCs largely develop by day 16 post LCMV infection so loss of Hhex after day 35 p.i. is expected to have a negligible impact on the development of MBCs (Extended Data Fig. 7b, c)14,15. Mice were then analyzed at day 80 p.i. and the percentage of Cre expressing (GFP+) MBCs was determined. We found that there was no difference in the percentage of MBCs present in mice after Hhex ablation, indicating that Hhex does not regulate MBC maintenance (Fig. 7f).
Hhex enhances MBC development through induction of Bcl-2
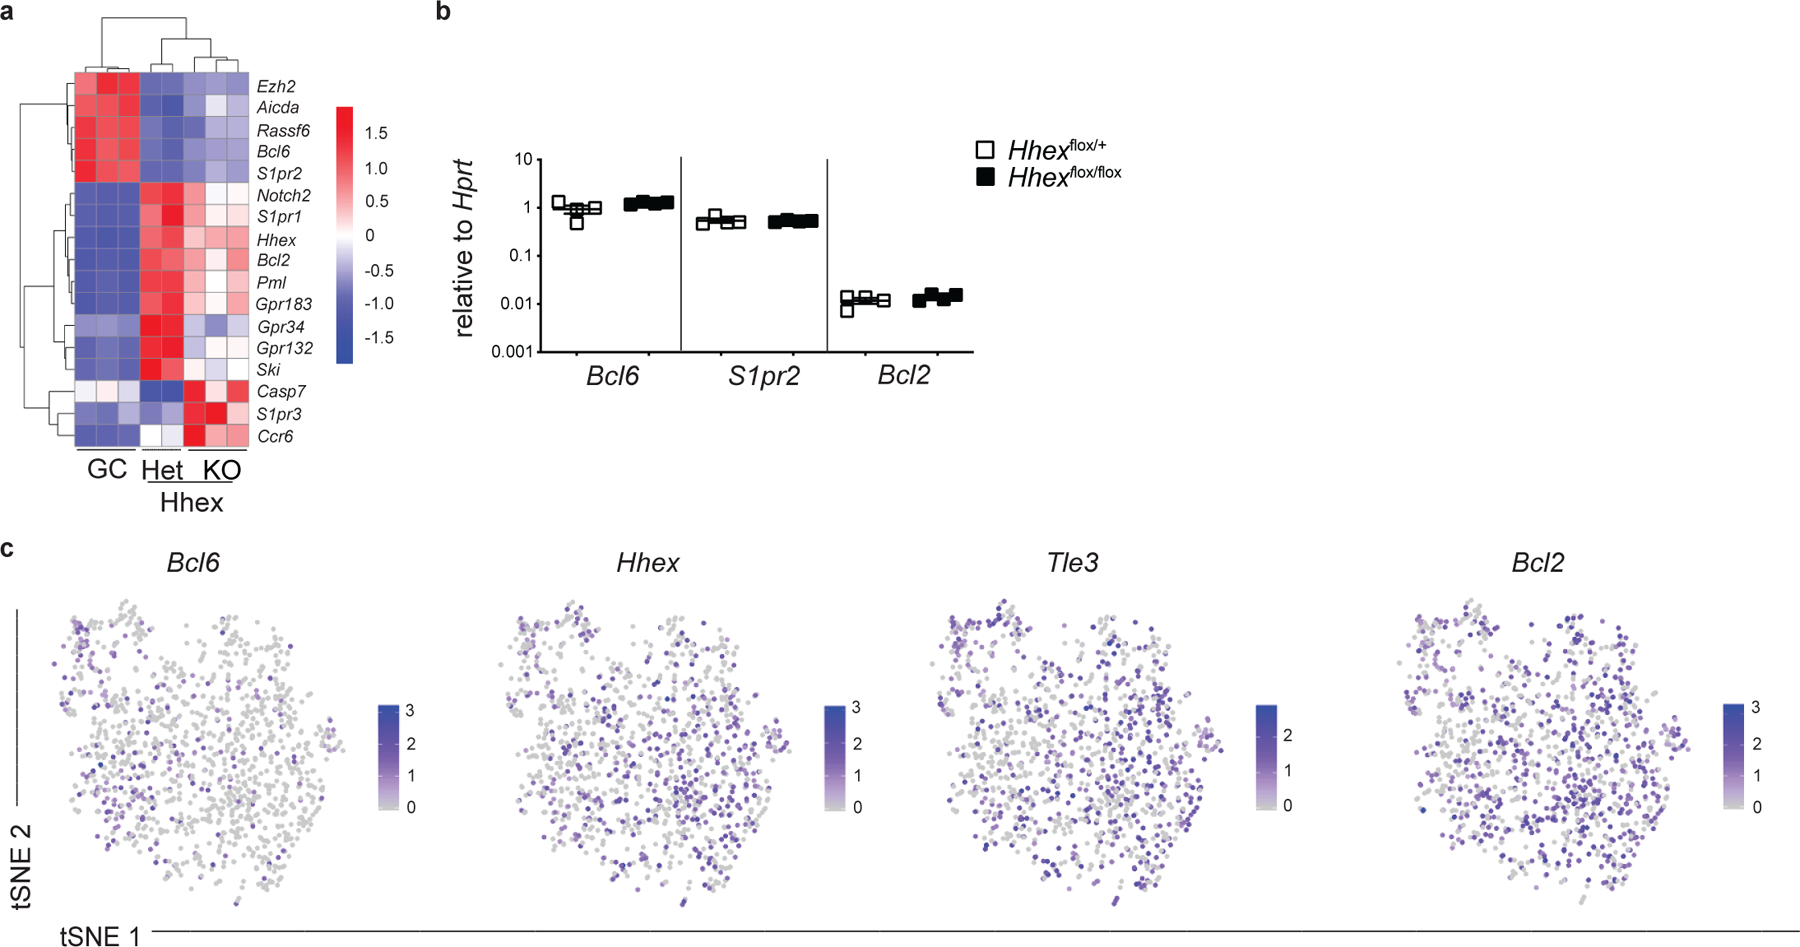
To further probe how Hhex regulates MBC development we performed RNA-seq analysis on Hhex-deficient MBCs (B220+IgDloGL7−CD38+S1pr2-Tomato+ cells) at day 11 post LCMV infection. We found that there were 149 differentially expressed genes (DEGs) between Hhex−/− and Hhex+/– MBCs, with 82 upregulated and 67 downregulated genes in the Hhex-deficient MBCs. DEGs were defined as genes with a padj<0.1 and base count >100. Bcl6 was upregulated in Hhex-deficient cells with differential expression of Bcl-6 regulated genes, including Gpr183, S1pr2, Aicda, and Bcl2 also being observed (Fig. 8a). Bcl6 expression in Hhex-deficient MBCs was still markedly reduced from that found in GC B cells (Extended Data Fig. 8a). Expression of Bcl6, S1pr2, and Bcl2 was intact in Hhex-deficient GC B cells (Extended Data Fig. 8b). Reduction in Bcl6 expression correlated with increased expression of Hhex, Tle3, and Bcl2 in MBCs based on scRNA-seq analysis (Extended Data Fig. 8c). Tle3 and Bcl2 were among the DEGs with enhanced expression in the Mem β cluster, with Bcl6 expression being higher in the Mem α cluster. Hhex-deficient MBCs displayed reduced expression of the TF Ski, which is highly expressed in MBCs16 (Fig. 8a). Notably, Ski expression is also reduced in Hhex-deficient lymphoid precursor cells39.
Figure 8. Hhex promotes MBC development through induction of Bcl2 and Ski.

(a) Heatmap of select genes from RNA-seq analysis of MBCs (B220+IgDloGL7−CD38+S1pr2-Tomato+) from Hhexflox/+ (Het) and Hhexflox/flox (KO) S1pr2-ERT2creTdTomato mice at day 11 post LCMV infection. Data are from 3 independent experiments with at least 3 mice per experiment pooled for each sample. (b) Representative FACS plots of the percentage of S1pr2-Tomato+ cells among splenic B220+IgDloGL7−CD38+ MBCs in Hhex Het and KO B6 and Bcl2-Tg S1pr2-ERT2creTdTomato mice at day 30 post LCMV infection. Data are representative of 2 independent experiments with 3 mice per group. (c) Ratio of MBCs to GC B cells (B220+IgDloGL7+CD95+S1pr2-Tomato+) in Hhex Het and KO B6 and Bcl2-Tg S1pr2-ERT2creTdTomato mice at day 30 post LCMV infection. Data are pooled from 2 independent experiments with 3 mice per group. Statistical analyses were performed using the unpaired two-tailed Student’s t-test. Scatter plots indicate mean (middle line) with error bars indicating standard error mean. (d) Ratio of transduced GC to FO B cells (left), MBCs to FO B cells (middle), and MBCs to GC B cells (right) in Hhex-overexpressing Bcl2-Tg bone marrow chimeras at day 30 post LCMV infection. Data are representative of 2 independent experiments with at least 4 mice per group. Statistical analyses were performed using the unpaired two-tailed Student’s t-test. Scatter plots indicate mean (middle line) with error bars indicating standard error mean. (e) Ratio of MBCs to GC B cells among empty vector or Ski-overexpressing Hhex Het or KO bone marrow chimeras at day 30 post LCMV infection. Data are representative of 2 independent experiments with at least 4 mice per group. Statistical analyses were performed using the ordinary one-way ANOVA with two-sided Dunnett multiple comparison testing (****, p < 0.0001). Scatter plots indicate mean (middle line) with error bars indicating standard error mean. See also Figure S8.
Bcl-2 promotes memory B cell development through repression of GC B cell apoptosis40,41. To investigate whether the reduced Bcl2 expression in Hhex-deficient MBCs contributes to impairment in differentiating into MBCs we crossed Hhexf/f S1pr2-ERT2-cre-TdTomato mice to Bcl2-Tg mice, a mouse line that overexpresses Bcl-2 selectively in B cells 42. Hhex+/– and Hhex−/− Bcl2-Tg mice were then infected with LCMV, treated with tamoxifen, and analyzed at day 30 p.i. We found that Hhex−/− Bcl2-Tg mice displayed comparable development of MBCs relative to their Hhex+/– Bcl2-Tg counterparts (Fig. 8b,c). These data suggest that Hhex promotes MBC development at least in part through induction of Bcl2, possibly via repression of Bcl6. Given that MBC maintenance is not impaired in the absence of Hhex, it is likely that the Bcl2 expression in these cells, which is still markedly elevated relative to GC B cells, is sufficient for cell survival but insufficient to facilitate initial GC B cell survival and differentiation into PreMem B cells.
Hhex enhances MBC development through induction of Ski
It is likely that Hhex mediates MBC development through pathways besides Bcl-2. Indeed, retroviral overexpression of Hhex was still sufficient to bolster MBC development in Bcl2-Tg cells (Fig. 8d). Given that Hhex-deficient MBCs have reduced expression of the TF Ski and that Ski overexpression was sufficient to promote MBC development, we next explored whether Hhex promotes MBC development through induction of Ski. We retrovirally overexpressed Ski in Hhexf/f S1pr2-ERT2-cre-TdTomato bone marrow and infected these mice with LCMV following reconstitution. Tamoxifen-treated mice were then analyzed at day 30 p.i. We found that Ski overexpression in Hhex-deficient cells was sufficient to rescue MBC development (Fig. 8e). These data indicate that Hhex induction of Ski expression is another mechanism by which Hhex promotes MBC development.
DISCUSSION
Understanding of the transcriptional networks regulating MBC development is important for the design of vaccines better able to induce protective humoral immunity. Here, we find that the TF Hhex cooperates with the corepressor Tle3 to promote GC B cell differentiation into MBCs. We also revealed roles for other TFs including Ski, Runx3, and Klf2 in regulating MBC differentiation. Our approach to inducibly ablate or overexpress genes specifically in GC B cells serves as a powerful tool for deciphering the signals regulating GC B cell differentiation in an in vivo setting. Furthermore, our scRNA-seq analysis identified MBC clusters that could be distinguished based on the surface markers CD44 and CD62L. These subsets transcriptionally resemble MBC subsets previously identified using CD80 and PD-L2 22.
Promotion of MBC development by Hhex is dependent on direct binding to target DNA. Tle3 is a transcriptional corepressor that also promotes MBC development but lacks DNA-binding domains. Rather, Tle3 functions through interaction with DNA-binding TFs and histone deacetylases (HDACs), which regulate histone acetylation to mediate gene repression34,43. We find that Tle3 can interact with the N-terminal domain of Hhex. An Eh1-motif mutant of Hhex that interacts poorly with Tle3 is unable to promote MBC development. Tle proteins can interact with a number of TFs expressed by lymphocytes including Tcf-1, Lef1, Runx1, and Runx334. Our finding that ablation of Runx3 in GC B cells leads to a slight enhancement in MBC development supports a model in which competition for Tle3 between Hhex and other TFs regulates MBC development.
Hhex is a homeodomain TF that is highly expressed in FO and MBCs while being downregulated in GC B cells. We find that Bcl6 directly represses the expression of Hhex. Moreover, newly generated Hhex-deficient MBCs have increased expression of Bcl6 and altered expression of Bcl6 target genes. These data support a model in which Bcl6 and Hhex function in opposition, potentially by inhibiting each other, to regulate GC B cell differentiation. Repression of Bcl6 by Hhex would provide a rationale for the reduction in GC B cell development among Hhex-overexpressing cells.
Currently the extracellular signals promoting MBC development within the GC are unclear. TFH cell-derived IL-9 has been suggested to promote MBC development12. However, subsequent studies found that 0.1% of TFH cells produce IL-9 following immunization13. Ingenuity Upstream Regulator Analysis found that downregulation of Bcl-6 was one of the primary drivers of the differences in gene expression between GC B cells and PreMem B cells16. BCR and CD40 signaling can transiently disrupt Bcl-6 activity through mitogen activated protein kinase (MAPK) signaling and posttranslational modification of the Bcl-6 corepressors SMRT and NCOR44–46. Sustained CD40 signaling can also promote the TF Irf4, which can repress Bcl6 expression through a negative feedback loop resulting in plasma cell differentiation47. The TFH cell cytokines IL-4 and IL-21 counteract BCR-mediated degradation of Bcl-6 and help maintain high Bcl6 expression in GC B cells48. Together, these studies suggest that a low level of CD40 and/or BCR-dependent signaling in GC B cells, along with minimal exposure to IL-4 and IL-21, may promote MBC development through downregulation of Bcl-6 and subsequent expression of Hhex. Hhex may also negatively feedback to drive further repression of Bcl6. This model is supported by the finding that GC B cells receiving low T cell help are predisposed to enter the memory pool14.
Hhex promotes MBC development through multiple mechanisms. We find that newly formed Hhex-deficient MBCs have reduced expression of Bcl2 and that Bcl-2 overexpression in Hhex-deficient cells is sufficient to rescue MBC development. Bcl-2 promotes MBC development through inhibition of apoptosis40,41. Bcl-6 represses expression of Bcl2 in GC B cells by directly binding to the Bcl2 promoter and suppressing Miz1-induced activation of Bcl249. Inadequate repression of Bcl6 in Hhex-deficient GC B cells may therefore result in impaired Bcl2 upregulation and a reduced ability for GC B cells receiving low T cell help to survive and differentiate into MBCs. Mature Hhex-deficient MBCs do not display impaired maintenance indicating that Hhex is not required for the survival of MBCs once they exit the GC state. While Hhex was not required for MBC recall following LCMV infection, it did promote the development of CD138+ cells following NP-CGG in alum challenge. This difference likely reflects that the TH2 response induced by NP-CGG in alum is less skewed towards CD44+CD62L+ MBCs than the strong TH1 response induced by LCMV. This allows differences in MBC subset composition in the absence of Hhex to be revealed, which are reflected in their subsequent properties upon recall.
Another gene regulated by Hhex in MBCs was the transcriptional repressor Ski. Hhex-deficient lymphoid progenitor cells also have reduced Ski expression, supporting that notion that Hhex may be a direct regulator of Ski expression 29. Interestingly, our findings indicate that while overexpression of Ski was sufficient to rescue MBC development in Hhex-deficient cells, ablation of Ski in GC B cells did not reduce MBC development. These data suggest that the transcriptional regulatory functions of Ski may be partially redundant with those of Hhex.
In summary, our work has provided important insight into the transcriptional circuitry governing MBC development following acute viral infection. Further investigations of the mechanisms by which TFs such as Hhex, Tle3, Ski, and Runx3 contribute to MBC development will be important to understand how best to modulate these pathways to elicit MBCs capable of inducing long-lasting protective immunity.
METHODS
Mice.
Adult C57BL/6 CD45.1+ (stock number 564) mice at least 6 weeks of age were purchased from the National Cancer Institute (NCI) or NCI at CRV. S1PR2-ERT2-Cre mice were provided by T. Okada, RIKEN Center for Integrative Medicine 14. UbcCre–ERT2 and RosamTmG mice were provided by M. Krummel, UCSF 50,51. Rosa26-LSL-Cas9 (026175), Cg1Cre (010611), Bcl2-Tg (002321), and Hhexflox (025396) mice were purchased from Jackson laboratories 24,25,42,52. Mice were housed in a specific pathogen-free environment in the Laboratory Animal Research Center at the University of California, San Francisco (UCSF), and all animal procedures were approved by the UCSF Institutional Animal Care and Use Committee.
Infections, immunizations, adoptive transfers, and treatments.
Male and female mice were infected with 2× 10⁵ plaque-forming units of LCMV Armstrong administered i.p. Mice were immunized with 100 µg NP-(20–29)-CGG (Biosearch Technologies) mixed 1:1 with alum (Aldygrogel) for a total of 200 µl volume. Tamoxifen (Sigma) was dissolved in Corn Oil (Sigma) at 20 mg/ml and injected at 2 mg/20g mouse i.p.. TAM diet (Envigo) containing chow replaced normal chow on the day after the final tamoxifen dose when indicated. To overcome initial taste aversion, additional crushed TAM diet was placed in the cage at the time of first TAM diet feeding. For adoptive transfer experiments, B and T cells were enriched from LCMV immune splenocytes through EasySep (Stem Cell) negative enrichment (using CD138, NK1.1, and CD8-Biotin antibodies) and approximately 5 × 10⁶ cells were transferred per recipient mouse.
Bone marrow chimeras
WT CD45.1 mice were lethally irradiated with 1,100 rads gamma-irradiation (split dose separated by 3 h) and then i.v. injected with relevant bone marrow cells. Bone marrow was harvested by flushing the tibia and femurs of donor mice.
Retroviral constructs and transductions.
Murine Hhex, Tle3, Runx3, Ski, Mndal, Zmynd11, Klf2, and Klf3 retroviral constructs were made by inserting the mouse open reading frame into the MSCV2.2 retroviral vector followed by an internal ribosome entry site (IRES) and Thy1.1 as an expression marker. Hhex point mutations were introduced by PCR followed by assembly using NEBuilder HiFi DNA Assembly Master Mix (New England BioLabs). Hhex truncation was introduced by PCR. Loxp-EGFP-loxp was also cloned into the MSCV2.2 retroviral vector followed by an internal ribosome entry site (IRES) and Thy1.1 as an expression marker. The murine Hhex open reading frame was then inserted the Loxp-EGFP-IRES-Thy1.1 MSCV2.2 vector. For the TF screen, sgRNAs were cloned into the pTR-MSCV-IRES-Thy1.1 or pTR-MSCV-IRES-BFP vector. sgRNA sequences were selected using the Broad Institute sgRNA Designer cross referenced with the Benchling Crispr Guide tool. For sgRNAs that did not begin with a G, a G was added. A primer with the sequence 5′-GTGGAAAGGACGAAACACC-sgRNA sequence-GTTTTAGAGCTAGAAATAG-3′ was then ordered and cloned into the pTR-MSCV-IRES vector using the NEBuilder HiFi DNA Assembly Reaction protocol (New England BioLabs). Transduction efficiencies for all experiments varied between constructs and sets of bone marrow chimeras.
The following sgRNA were used:
Hhex sgRNA 1: 5′-GATACAGCGGGACTCCCACGG-3′;
sgRNA 2: 5′-GTCGACGACATCTTGGGTCGC-3′
Foxp1 sgRNA 1: 5′-GTGGTCTCTCGGTGCAAACTA-3′;
sgRNA 2: 5′-GCAGCTGCACGCTGTGCTCG-3′
Ski sgRNA 1: 5′-GATGGTGCGATCGGGCTCCCC-3′;
sgRNA 2: 5′-GCTCCCGCTCCCGTGCGCCC-3′
Ski sgRNA 3: 5′-GATGTGCAGCTCATCGCACA-3′;
sgRNA 4: 5′-GGGCACCGGCGCCGGCACTG-3′
Klf2 sgRNA 1: 5′-GTGAGGACCTAAACAACGTGT-3′;
sgRNA 2: 5′-GTCCATGGGATTGGACGGTCT-3′
Klf3 sgRNA 1: 5′-GACCCCACCCGCGCGTCCGTG-3′;
sgRNA 2: GTCTGGGCAGTCACATGACGC-3′
Tle3 sgRNA 1: GCCGGGATTTAAATTCACTG-3′;
sgRNA 2: 5′-GCTTGCGGATACATGGCAGGG-3′
Foxo3 sgRNA 1: 5′-GCCCGAGAGTCCCCTCGTCG-3′;
sgRNA 2: 5′-GCAGCATGGCCGAATCCTCG-3′
Bhlhe41 sgRNA 1: 5′-GCGCAGTGCGTGTGTGCGCG-3′;
sgRNA 2: 5′-GAGGGCGAGCGAGCGAGCACG-3′
Runx3 sgRNA 1: 5′-GCAGAGTATCATTAAATGGT-3′;
sgRNA 2: 5′-GTTTGTGGCTAGACATTCCTG-3′
Zeb2 sgRNA 1: 5′-GTAACACGTCAGTCCGTCCCC-3′;
sgRNA 2: 5′-GACGCGCCACCTATCTTTGTG-3′
Jun sgRNA 1: 5′-GACGGTCCGTCACTTCACGCG-3′;
sgRNA 2: 5′-GACTCCGCTAGCACTCACGT-3′
Pml sgRNA 1: 5′-GCAGAGTCCTGTTGTCGACA-3′;
sgRNA 2: 5′-GCTCGAAGAACACGTTATCCA-3′
Bhlhe40 sgRNA 1: 5′-GTGGCATCCCAGCGCATTGCA-3′;
sgRNA 2: 5′-GAGGATCCGAGGGTCTCAAG-3′
Tcf4 sgRNA 1: 5′-GATTATCAATGTGACTCCTCG-3′;
sgRNA 2: 5′-GATTGTAATCCATTCACATCC-3′
Zfp182 sgRNA 1: 5′-GCTACATCCTCAAATGTCAC-3′;
sgRNA 2: 5′-GTGTAGCTGTGGATTTCACTC-3′
Mndal sgRNA 1: 5′-GAAAGCGATCGCAAAAACTGA-3′;
sgRNA 2: 5′-GTGTCTAGTCCAGCATATTTG-3′
Zmynd11 sgRNA 1: 5′-GATTGTCGAAACTCTAACAGT-3′;
sgRNA 2: 5′-GAATGATACACACGAAAACAC-3′
Sub1 sgRNA 1: 5′-GTGGTGAGACTTCTAGAGCAC-3′;
sgRNA 2: 5′-GTCAGTGTTCGGGACTTCAA-3′
Arid5a sgRNA 1: 5′-GATAGTGGCGGCGTGTGCAT-3′;
sgRNA 2: 5′-GAGCGACACACGCCCATCGAG-3′
Cd38 sgRNA 1: 5′-GCGCCTTGGTAGTAGGGATCG-3′;
sgRNA 2: 5′-GAGCCCAGATCGGTCTCGGAG-3′
Cxcr3 sgRNA 1: 5′-GTGAGGGCTACACGTACCCGG-3′;
sgRNA 2: 5′-GTAGCACCACCAGGTGATAGG-3′
Control sgRNA: 5′-GCGAGGTATTCGGCTCCGCG-3′
Retrovirus was generated by transfecting PLAT-E packaging cell line with 10 µg plasmid DNA and 10 mg Lipofectamine 2000 (Fischer). For transduction of bone marrow, WT, Bcl2-Tg, Hhexflox/+ S1pr2-ERT2creTdTomato, Hhexflox/flox S1pr2-ERT2creTdTomato, Rosa26-LSL-Cas9f/+ Cg1Cre/+ were injected i.v. with 3 mg 5-fluorouracil (Sigma). Bone marrow was collected after 4 days and cultured in DMEM containing 15% FBS, antibiotics (penicillin (50 IU/mL) and streptomycin (50 mg/mL); Cellgro) and 10 mM HEPES, pH 7.2 (Cellgro), supplemented with IL-3, IL-6 and stem cell factor (at concentrations of 20, 50 and 100 ng/mL, respectively; Peprotech). Cells were ‘spin-infected’ twice at days 1 and 2 and then transferred into irradiated recipients.
Antibodies for flow cytometry staining.
Spleens were mashed through a 70-µm cell strainer, and red blood cells were lysed with RBC lysing buffer. Lymphocytes were then washed and counted. The following antibodies were used for flow cytometry and microscopy staining: Phycoerythrin (PE) anti-CD86 (105008), phycoerythrin–indotricarbocyanine (PE-Cy7) anti-CD38 (102718), A647 anti-CD38 (102716), Brilliant Violet 605 (BV605) anti-CD45.1 (110738), allophycocyanin (APC) anti-GL7 (144606), Pacific Blue (PacBlue) anti-GL7 (144614), peridinin chlorophyll protein Cy5.5 (PerCpCy5.5) anti-CD73 (127214), PacBlue anti-IgD (405712), PerCpCy5.5 anti-IgD (405710), APC anti-CD80 (104718), PE anti-CD44 (103008), PE anti-IgD (405705), APC Cy7 anti-B220 (103224), FITC anti-GL7 (144604), PE anti-CD138 (142504), BV412 anti-CD138 (142506), BV711 anti-Thy1.1 (202539), Alexa647 anti-Thy1.1 (202508), PerCpcy5.5 anti-Thy1.1 (202516), A647 anti-Bcl-2 (633510), FITC anti-CD44 (103006), APC anti-CD62L (104412), APC Cy7 anti-CD19 (115530) (all from BioLegend); APC anti-CXCR4 (558644), PE anti-CD95 (554258), PE Cy7 anti-CD95 (557653), APC anti-Bcl6 (561525), APC anti-CCR6 (557976), Biotin anti-CXCR4 (551968), BV605 Streptavidin (563260), FITC Rabbit anti-active Caspase3 (560901), A647 anti-Bcl-6 (561525) (all from BD Biosciences); PerCPCy5.5 anti-CD45.2 (65–0454-U100) (Tonbo Biosciences); Biotin goat anti-mouse polyclonal Ephrin-B1 (BAF473) (R&D Systems); FITC anti-BrDU (11-5071-42) ; Fixable viability dye eFluor780 (65-0865-18) (eBiosciences). Flow cytometry data were acquired on a BD LSRII with FACSDiva software and were analyzed with FlowJo software (TreeStar).
RNA-seq library preparation and data analysis.
Total RNA was purified from FACS sorted cells using the RNeasy Micro kit (Qiagen). RNA quality was assessed with an Agilent 2100 Bioanalyzer (RNA integrity number>9 for all samples). Barcoded sequencing libraries were generated with 100 ng of RNA with an Ovation RNA-seq System V2 (Nugen), KAPA Hyper Prep Kit for Illumina (KAPA Biosystems), and NEXTflex DNA barcodes (Bioo Scientific). Single-end sequencing was performed on an Illumina HiSeq 4000 (UCSF Center for Advanced Technology) and sequences reported as FASTQ files, which were aligned to the mm10 genome with STAR (Spliced Transcripts Alignment to a Reference). Mappable reads were counted with HTseq and imported into RStudio software (v1.1.463) for analysis of differential expression with DESeq2 software.
Droplet-based single-cell RNA sequencing.
Immediately post-sorting, the indicated B cell populations were run on the 10X Chromium (10X Genomics) and then through library preparation by the Institute for Human Genetics at UCSF following the recommended protocol for the Chromium Single Cell 3′ Reagent Kit (v3 Chemistry) 53. Libraries were run on the HiSeq4000 for Illumina sequencing. Post-processing and quality control were performed by the Genomics Core Facility at the Institute for Human Genetics at UCSF using the 10X Cell Ranger package (v3.0.2, 10X Genomics). Reads were aligned to mm10 reference assembly and analyzed using the Seurat (v3.1.4) software package. Cells were filtered based on number of genes expressed, number of unique molecular identifiers, and the percentage of mitochondrial genes present to exclude outlier cells as described in the Seurat package.
Expression and purification of GST fusion proteins.
Mouse GST-Hhex fusion proteins (containing the N-terminal domain) were generated using the GST Gene Fusion System (GE), according to manufacturer’s instructions. Briefly, gene segments encoding amino acids 1–141 of Hhex PCR amplified from a wild-type or F33E mutant template were cloned into the pGEX-2T vector and then expressed in BL21 pLysS cells. Fusion protein expression was induced with 1 mM isopropyl-1-thio-β-D-galactopyranoside. Cells were harvested and lysed by sonication in PBS containing 1% Triton X-100, 1mM EDTA, and protease inhibitors (aprotinin, leupeptin, PMSF) GST-Hhex fusion proteins were purified over glutathione-Sepharose 4B beads (Sigma) and eluted with 10 mM glutathione according to manufacturer’s instructions. GST-Hhex fusion proteins were then assayed for purity by SDS-PAGE followed by staining with Coomassie Blue. GST has a MW of 26.9 kDa and the expected size of the fusion protein was 15.5 kDa.
In vitro Binding Assays.
Tle3 containing a flag tag in the C-terminus was cloned into the pTNT plasmid and transcription and translation was subsequently performed using the TNT Quick Coupled Transcription/Translation System (Promega) according to the manufacturer’s protocol. Approximately 20 µg of each GST fusion protein or an equimolar amount of GST protein as judged by Coomassie staining was incubated with 10 µl of the in vitro translated Tle3 for 1 h at room temperature. 25 µl of glutathione-Sepharose 4B beads (Sigma), prepared according to the manufacturer’s protocol, was then added. The beads were then washed four times with binding buffer (TBS, 50mM Tris-HCl pH 7.4, 150mM NaCl). Bound proteins were eluted by boiling the beads in 2x Laemmli Sample Buffer (BIO-RAD). Samples were then loaded onto a NuPAGE 4–12% Bis-Tris Protein Gel (Thermo) and then transferred onto a nitrocellulose membrane. Membranes were stained using rabbit anti-Flag primary antibody (Cell Signaling Technologies, #14793S) followed by a donkey anti-rabbit IRDye 680 RD (Licor, #926–68073) and visualized using a Licor Odyssey CLx.
For the radioactive ligand binding assay, EasyTag L-[35S]-Methionine (Perkin Elmer) was added to the TNT Quick Coupled Transcription/Translation reaction. Buffer exchange was then performed using a NAP-5 column (GE Healthcare) and protein amount quantified using a MicroBeta TriLux liquid scintillation counter. Approximately 12 µg of each GST fusion protein or an equimolar amount of GST protein as judged by Coomassie staining was incubated with the in vitro translated Tle3 for 1 hour at room temperature in a 96-well plate. All samples were then added to a preblocked 96-well filter plate (Corning) containing 5µl of glutathione-Sepharose 4B beads (Sigma), prepared according to the manufacturer’s protocol. Samples were incubated for 20 minutes at room temperature and then washed four times. Samples were then quantified using a MicroBeta TriLux liquid scintillation counter with counts normalized based on the amount of input protein.
Real-time PCR.
Total RNA was isolated and converted to cDNA. A StepOnePlus realtime PCR system (Applied Biosystems) with Power SYBR Green PCR Master Mix (Thermo Fisher) and the appropriate primer pairs (Integrated DNA Technologies) were used for real-time PCR. The following primers were used:
Bcl6 Forward: TTGTCATCGTGGTGAGCCG ; Reverse: TTGCATTTCAACTGGTCAGTG
Hhex Forward: AAATACCTCTCCCCACCCGA; Reverse: TGTTGCTTTGAGGATTCTCCTGT
Bcl2 Forward: GTACCTGAACCGGCATCTGC ; Reverse: AAACAGAGGTCGCATGCTGG
S1pr2 Forward: GGCCTAGCCAGTGCTCAGC ; Reverse: CCTTGGTGTAATTGTAGTGTTCCAGA
NP VH186.2 Mutation Analysis.
20,000–40,000 cells for each population were FACS sorted and DNA was isolated using a QIAamp DNA Micro Kit (Qiagen). DNA was eluted in 20ul and used as a template for nested PCR 54. PCR product was then excised and purified from 1.2% agarose gels using a QIAquick Gel Extraction Kit (Qiagen). The purified gel product was cloned into the pCR4 Blunt-TOPO vector according to manufacturer’s instructions (Invitrogen). Colonies were submitted for preparation and sequencing (TACgen). Data was analyzed using IgBLAST and the frequency of W33L mutations were counted in non-frame shifted IGHV1–72*01 sequences. Primers: Nested Forward 1: CATGGGATGGAGCTGTATCATGC; Nested Reverse 1: CTCACAAGAGTCCGATAGACCCTG ; Nested Forward 2: GGTGACAATGACATCCACTTTGC ; Nested Reverse 2: GACTGTGAGAGTGGTGCCTTG.
Statistical analysis.
Results represent the mean ± SEM unless indicated otherwise. Statistical significance was determined by the unpaired Student’s t test, the ordinary one-way ANOVA with Dunnett multiple comparison testing, or the Holm-Sidak multiple comparison test. Statistical analyses were performed using Prism GraphPad software v8.0. (*, p < 0.05; **, p < 0.01; ***, p < 0.001; ****, p < 0.0001). Further information about the methods, reagents, and statistical methods used in this manuscript can be found in the Life Science Reporting Summary.
Extended Data
Extended Data Figure 1. Differential gene expression for eight B cell clusters.
(a) Gating strategy for the sorted B cells used for droplet-based scRNA-seq analysis from S1pr2-ERT2creTdTomato mice at day 11 post LCMV infection. The sorted population consisted of a mixture of 90% GC B cells, 5% FO B cells, and 5% MBCs. Colored gates and labels are used to show the order of the gating scheme. Cells for scRNA-seq sort were pooled from 4 mice. (b) Heatmap of each cell’s (column) expression of the top ten DEGs per cluster (rows). Select genes are labeled. Log-normalized expression scaled for each gene. Cluster name displayed below. (c) Violin plots of select gene from LZ 1 (n=2,675 cells), DZ 1 (n=2,412 cells), DZ 2 (n=2,017 cells), Mem (n=1,255 cells), LZ 2 (n=1,079 cells), DZ 3 (n=713 cells), FO (n=670 cells), and Myc+ clusters (n=207 cells) with highest log-normalized expression value labeled. Violin plots are presented with floating boxes showing median (middle line) and quartiles (top and bottom). Minima and maxima are shown as the bottom and top of the violin plot. (d) Enrichment score for gene signature distinguishing MBCs (far left), GC B cells (middle left), and DZ GC B cells (middle right) projected onto tSNE plots. Color scaled for each gene signature with log-normalized expression level noted. Stage of cell cycle based on gene expression projected onto tSNE plot (far right). Cells for scRNA-seq sort were pooled from 4 mice.
Extended Data Figure 2. Analysis of memory cluster cells.
(a) Number of cells per cluster (left) and DEGs per cluster (right) following subclustering analysis of Mem cluster. (b) Enrichment score for gene signature distinguishing CD80−PDL2− MBCs (left) and CD80+PDL2+ MBCs (right) projected onto tSNE plots of Mem cluster (n=1,255 cells). Color scaled for each gene signature with highest log-normalized expression level noted. Cells for scRNA-seq sort were pooled from 4 mice. (c) Violin plots of Sell, Cd44, and Il21r expression in cells from PreMem (n=106 cells), Mem α (n=482 cells), and Mem β clusters (n=677 cells) with log-normalized expression value labeled. Violin plots are presented with floating boxes showing median (middle line) and quartiles (top and bottom). Minima and maxima are shown as the bottom and top of the violin plot. (d) Representative FACS plots of CD44 and CD62L expression at day 11 post LCMV infection on MBCs (B220+IgDloGL7−CD38+S1pr2-Tomato+) showing example gating scheme for identification of CD44+CD62L+ and CD44+/−CD62L− subsets. Data are representative of 4 independent experiments with at least 2 mice per group.
Extended Data Figure 3. Transcription factor expression in mouse and human memory B cells.
(a) Heatmap of each cell’s (column) expression of select TFs per cluster (rows). Log-normalized expression scaled for each gene. Cluster name displayed below. (b) Heatmap of TF expression from bulk RNA-seq of splenic GC B cells, PreMem B cells, and MBCs at day 11 post LCMV infection. (c) TF expression in human naïve, GC, and MBCs as determined using datasets compiled by Genevestigator. 3 samples were included in each dataset. Level of expression is a unitless value on a log2 scale computed following normalization and scaling of raw data in order to allow comparison of expression of given gene between samples. Statistical analyses were performed using the two-sided Holm-Sidak multiple comparisons test (****, p < 0.0001). Scatter plots indicate mean (middle line) with error bars indicating standard error mean. (d) Representative FACS plots of CXCR3+ cells (left) among Thy1.1+BFP+ MBCs (B220+IgDloGL7−CD38+GFP+) at day 30 post LCMV infection in mice containing cells transduced with sgRNAs targeting a control nonexpressed gene and CXCR3. Percentage of CXCR3+ cells among Thy1.1+, BFP+, Thy1.1+BFP+, and Thy1.1−BFP− MBCs (right). Data are pooled from 4 independent experiments with at least 4 mice per group. Scatter plots indicate mean (middle line) with error bars indicating standard error mean. (e) Representative FACS plots of CD38+ cells (left) among Thy1.1+BFP+ B220+IgDloGFP+ cells at day 30 post LCMV infection in mice containing cells transduced with sgRNAs targeting a control nonexpressed gene and CD38. Percentage of CD38+ cells among Thy1.1+, BFP+, Thy1.1+BFP+, and Thy1.1−BFP− B220+IgDloGFP+ (right). Data are pooled from 4 independent experiments with at least 4 mice per group. Scatter plots indicate mean (middle line) with error bars indicating standard error mean. (f) Ratio of MBCs to GC B cells (B220+IgDloGL7+CD95+GFP+) among sgRNA 1-Thy1.1+sgRNA 2-BFP+ B cells in the experiment described in Fig. 3c. Data are pooled from 6 independent experiments with at least 3 mice per group. Statistical analyses were performed using the ordinary one-way ANOVA with two-sided Dunnett multiple comparison testing. Scatter plots indicate mean (middle line) with error bars indicating standard error mean.
Extended Data Figure 4. Hhex promotes memory B cell differentiation following TH1-type and TH2-type immunization.

(a) Ratio of transduced (Thy1.1+) splenic MBCs (B220+IgDloGL7−CD38+CD95+CD73+) to GC B cells (B220+IgDloGL7+CD95+) in Hhex-overexpressing bone marrow chimeras at day 15, 30, and 60 post LCMV infection. Data are pooled from 8 independent experiments with at least 4 mice per group. Statistical analyses were performed using the unpaired two-tailed Student’s t-test. Scatter plots indicate mean (middle line) with error bars indicating standard error mean. (b) Representative FACS plots of the percentage of transduced (Thy1.1+) cells among splenic FO (B220+IgDhiGL7−CD38+CD95−), GC (B220+IgDloGL7+CD95+NP+), and MBCs (B220+IgDloGL7−CD38+NP+) at day 30 post NP-CGG in alum immunization in empty vector and Hhex-overexpressing bone marrow chimeras. Data are representative of 2 independent experiments with at least 4 mice per group. (c) Ratio of transduced GC to FO B cells (left), MBCs to FO B cells (middle), and MBCs to GC B cells (right). Data are representative of 2 independent experiments with at least 4 mice per group. Statistical analyses were performed using the unpaired two-tailed Student’s t-test. Scatter plots indicate mean (middle line) with error bars indicating standard error mean.
Extended Data Figure 5. Ski and Klf2 promote memory B cell differentiation.
(a) Representative FACS plots of the percentage of transduced (Thy1.1+) cells among splenic FO (B220+IgDhiGL7−CD38+CD95−), GC (B220+IgDloGL7+CD95+), and MBCs (B220+IgDloGL7−CD38+CD95+CD73+) at day 30 post LCMV infection in Ski and Klf2-overexpressing bone marrow chimeras. Data are representative of 4 independent experiments with at least 3 mice per group. (b) Ratio of transduced GC to FO B cells (top), MBCs to FO B cells (bottom left), and MBCs to GC B cells (bottom right). Vector used to transduce cells listed below. Data are pooled from 4 independent experiments with at least 3 mice per group. Statistical analyses were performed using the unpaired two-tailed Student’s t-test for the GC/FO and Mem/FO comparisons (****, p < 0.0001). Statistical analyses were performed using the ordinary one-way ANOVA with two-sided Dunnett multiple comparison testing for the Mem/GC comparisons (*****, p < 0.0001). Scatter plots indicate mean (middle line) with error bars indicating standard error mean. (c) Coomassie staining of gel loaded with GST (lane 1), GST-Hhex (lane 2), and GST-Hhex F33E (lane 3) fusion proteins. Arrow indicates full-length fusion protein. Data are from 1 independent experiment. (d) Interaction of in vitro translated and transcribed Tle3 with glutathione beads coated with GST, GST-Hhex, or GST-Hhex F33E as quantified using a radioactive ligand binding assay. Counts per minute (cpm) are normalized based on the count of the input Tle3 used in the binding assay. Data are pooled from 2 independent experiments with 4 samples per group. Statistical analyses were performed using the ordinary one-way ANOVA with two-sided Dunnett multiple comparison testing (*****, p < 0.0001). Scatter plots indicate mean (middle line) with error bars indicating standard error mean. (e) Interaction of in vitro translated and transcribed Nkx6 (left) and Rfx6 (right) with glutathione beads coated with GST, GST-Hhex, or GST-Hhex F33E as quantified using a radioactive ligand binding assay. Counts per minute (cpm) are normalized based on the count of the input Nkx6 or Rfx6 used in the binding assay. Data are from 1 independent experiment with 2 samples per group.
Extended Data Figure 6. Ablation of Hhex in GC B cells impairs memory B cell differentiation following TH2-type immunization.
(a) Representative FACS plots of the percentage of S1pr2-Tomato+ cells among splenic B220+IgDloGL7−CD38+NP+ cells in Hhex Het and KO mice at day 30 post NP-CGG in alum immunization. Data are representative of 2 independent experiments with 3 mice per group. (b) Percentage of B cells that are GC B cells (B220+IgDloGL7+CD95+NP+S1pr2-Tomato+) and MBCs (B220+IgDloGL7−CD38+NP+S1pr2-Tomato+) in Hhex Het and KO mice at day 30 post NP-CGG in alum immunization. Statistical analyses were performed using the unpaired two-tailed Student’s t-test. Scatter plots indicate mean (middle line) with error bars indicating standard error mean. (c) Ratio of NP+ MBCs to NP+ GC B cells in Hhex Het and KO mice at day 30 post NP-CGG in alum immunization. Data are pooled from 2 independent experiments with 3 mice per group. Statistical analyses were performed using the unpaired two-tailed Student’s t-test. Scatter plots indicate mean (middle line) with error bars indicating standard error mean. (d) Representative FACS plots of CD44 and CD62L expression on MBCs (B220+IgDloGL7−CD38+S1pr2-Tomato+) at day 12 post NP-CGG in alum immunization. Data are representative of 2 independent experiments with 3 mice per group. (e) Percentage of CD44−CD62L− (left), CD44+CD62L− (middle), and CD44+CD62L+ (right) MBCs at day 12 post NP-CGG in alum immunization. Data are pooled from 2 independent experiments with 3 mice per group. Statistical analyses were performed using the unpaired two-tailed Student’s t-test. Scatter plots indicate mean (middle line) with error bars indicating standard error mean. (f) Frequency of GC B cells (B220+IgDloGL7+CD95+S1pr2-Tomato+) and MBCs (B220+IgDloGL7−CD38+S1pr2-Tomato+) in Hhex Het and KO mice at day 12 post NP-CGG in alum immunization that have W33L mutation in the canonical NP-responding gene VH186.2. Data are pooled from 2 independent experiments with 3 mice per group. (g) Representative FACS plot (left) and percentage (right) of CD138+ cells that are CD45.2+S1pr2-Tomato+ at day 5 post challenge with NP-CGG in alum. Equivalent numbers of splenic CD45.2+ T and B cells from Hhex Het and KO NP-CGG in alum immune mice were transferred to naïve CD45.1+ recipients one day prior to challenge. Data are pooled from 2 independent experiments with 3 mice per group. Statistical analyses were performed using the unpaired two-tailed Student’s t-test. Scatter plots indicate mean (middle line) with error bars indicating standard error mean. (h) Percentage of CD138+ cells (left) and GC B cells (right) that were CD45.2+S1pr2-Tomato+ at day 5 post challenge with NP-CGG in alum when normalized to the percentage of MBCs present in the transferred cells. Data are pooled from 2 independent experiments with 3 mice per group. Statistical analyses were performed using the unpaired two-tailed Student’s t-test. Scatter plots indicate mean (middle line) with error bars indicating standard error mean.
Extended Data Figure 7. Memory B cells develop early following LCMV infection.

(a) Gating scheme for PreMem B cells at day 11 post LCMV infection. (b) Representative FACS plots of S1pr2-Tomato expression in B220+IgDloGL7−CD38+ cells at day 60 post LCMV infection in S1pr2-ERT2creTdTomato mice treated with tamoxifen beginning at day 4, 11, 16, or 30 p.i. Data are representative of 3 independent experiments with at least 4 mice per group. (c) Percentage of S1pr2-Tomato+ GC (left) and MBCs (right) at day 60 post LCMV infection in S1pr2-ERT2creTdTomato mice treated with tamoxifen (Tam) beginning at day 4, 11, 16, or 30 p.i. Data are representative of 3 independent experiments with at least 4 mice per group. Statistical analyses were performed using the ordinary one-way ANOVA with two-sided Dunnett multiple comparison testing (****, p < 0.0001). Scatter plots indicate mean (middle line) with error bars indicating standard error mean.
Extended Data Figure 8. Expression of differentially expressed genes in MBCs.
(a) Heatmap of select genes from RNA-seq analysis of MBCs (B220+IgDloGL7−CD38+S1pr2-Tomato+) from Hhexflox/+ (Het) and Hhexflox/flox (KO) S1pr2-ERT2-cre-TdTomato mice and GC B cells (B220+IgDloGL7+CD95+Ephrinb1+S1pr2Venus/+) 16 at day 11 post LCMV infection. Data are from 3 independent experiments with at least 3 mice per experiment pooled for each sample. (b) Expression of Bcl6 (left), S1pr2 (middle), and Bcl2 (right) in Hhex Het and KO GC B cells (B220+IgDloGL7+CD95+S1pr2-Tomato+) at day 12 post LCMV infection. Data are from 1 independent experiments with 4 mice. (c) Expression of Bcl6, Hhex, Tle3, and Bcl2 projected onto tSNE plot of Mem cluster (n=1,255 cells). Color scaled for each gene with log-normalized expression level noted. Cells for scRNA-seq sort were pooled from 4 mice.
Supplementary Material
ACKNOWLEDGEMENTS
We thank T. Roth and A. Marson (University of California, San Francisco) for the pTR plasmid, T. Okada for S1PR2-CreERT2 mice, J. An for expert technical assistance, J. Derisi for support and P.S. Jayaraman for helpful discussions. This work was supported by grants from the NIH (R01AI045073 [J.G.C], R01AI040098 [J.G.C], T32AI07019 [B.L.]). B.J.L. is a Howard Hughes Medical Institute Fellow of the Damon Runyon Cancer Research Foundation (DRG-2265-16). J.G.C. is an investigator of the Howard Hughes Medical Institute.
Abbreviations used
- GC
germinal center
- MBC
memory B cell
- TFH
T follicular helper cell
- DEGs
differentially expressed genes
- TF
transcription factor
- scRNA-seq
single cell RNA sequencing
- FO
follicular
- DZ
dark zone
- LZ
light zone
- FO
follicular
- sg
single guide
- ChIP
chromatin immunoprecipitation
- GST
glutathione S-transferase
- HDAC
histone deacetylase
- LCMV
lymphocytic choriomeningitis virus
- MAPK
mitogen activated protein kinase
- NP-CGG
nitrophenyl–chicken γ-globulin
- EV
empty vector
Footnotes
DATA AVAILABILITY
Raw and processed data files for the scRNA-seq and RNA-seq analysis have been deposited in the NCBI Gene Expression Omnibus under accession number: GSE148805.
COMPETING INTERESTS
The authors declare no competing financial interests.
REFERENCES
- 1.Purtha WE, Tedder TF, Johnson S, Bhattacharya D & Diamond MS Memory B cells, but not long-lived plasma cells, possess antigen specificities for viral escape mutants. J. Exp. Med 208, 2599–2606 (2011). [DOI] [PMC free article] [PubMed] [Google Scholar]
- 2.McCarthy KR et al. Memory B Cells that Cross-React with Group 1 and Group 2 Influenza A Viruses Are Abundant in Adult Human Repertoires. Immunity 48, 174–183.e9 (2018). [DOI] [PMC free article] [PubMed] [Google Scholar]
- 3.Toyama H et al. Memory B cells without somatic hypermutation are generated from Bcl6-deficient B cells. Immunity 17, 329–339 (2002). [DOI] [PubMed] [Google Scholar]
- 4.Taylor JJ, Pape KA & Jenkins MK A germinal center-independent pathway generates unswitched memory B cells early in the primary response. J. Exp. Med 209, 597–606 (2012). [DOI] [PMC free article] [PubMed] [Google Scholar]
- 5.Pritchard GH et al. The Development of Optimally Responsive Plasmodium-specific CD73+CD80+ IgM+ Memory B cells Requires Intrinsic BCL6 expression but not CD4+ Tfh cells. Biorxiv (2019). 10.1101/564351 [DOI]
- 6.Vikstrom I et al. Mcl-1 is essential for germinal center formation and B cell memory. Science 330, 1095–1099 (2010). [DOI] [PMC free article] [PubMed] [Google Scholar]
- 7.Béguelin W et al. EZH2 is required for germinal center formation and somatic EZH2 mutations promote lymphoid transformation. Cancer Cell 23, 677–692 (2013). [DOI] [PMC free article] [PubMed] [Google Scholar]
- 8.Tomayko MM et al. Systematic comparison of gene expression between murine memory and naive B cells demonstrates that memory B cells have unique signaling capabilities. J. Immunol 181, 27–38 (2008). [DOI] [PMC free article] [PubMed] [Google Scholar]
- 9.Linterman MA et al. IL-21 acts directly on B cells to regulate Bcl-6 expression and germinal center responses. J. Exp. Med 207, 353–363 (2010). [DOI] [PMC free article] [PubMed] [Google Scholar]
- 10.Zotos D et al. IL-21 regulates germinal center B cell differentiation and proliferation through a B cell-intrinsic mechanism. J. Exp. Med 207, 365–378 (2010). [DOI] [PMC free article] [PubMed] [Google Scholar]
- 11.Bannard O et al. Germinal center centroblasts transition to a centrocyte phenotype according to a timed program and depend on the dark zone for effective selection. Immunity 39, 912–924 (2013). [DOI] [PMC free article] [PubMed] [Google Scholar]
- 12.Wang Y et al. Germinal-center development of memory B cells driven by IL-9 from follicular helper T cells. Nat. Immunol 18, 921–930 (2017). [DOI] [PubMed] [Google Scholar]
- 13.Takatsuka S et al. IL-9 receptor signaling in memory B cells regulates humoral recall responses. Nat. Immunol 19, 1025–1034 (2018). [DOI] [PubMed] [Google Scholar]
- 14.Shinnakasu R et al. Regulated selection of germinal-center cells into the memory B cell compartment. Nat. Immunol 17, 861–869 (2016). [DOI] [PubMed] [Google Scholar]
- 15.Weisel FJ, Zuccarino-Catania GV, Chikina M & Shlomchik MJ A Temporal Switch in the Germinal Center Determines Differential Output of Memory B and Plasma Cells. Immunity 44, 116–130 (2016). [DOI] [PMC free article] [PubMed] [Google Scholar]
- 16.Laidlaw BJ et al. The Eph-related tyrosine kinase ligand Ephrin-B1 marks germinal center and memory precursor B cells. J. Exp. Med 214, 639–649 (2017). [DOI] [PMC free article] [PubMed] [Google Scholar]
- 17.Suan D et al. CCR6 Defines Memory B Cell Precursors in Mouse and Human Germinal Centers, Revealing Light-Zone Location and Predominant Low Antigen Affinity. Immunity 47, 1142–1153.e4 (2017). [DOI] [PubMed] [Google Scholar]
- 18.Swingler TE, Bess KL, Yao J, Stifani S & Jayaraman P-S The proline-rich homeodomain protein recruits members of the Groucho/Transducin-like enhancer of split protein family to co-repress transcription in hematopoietic cells. J. Biol. Chem 279, 34938–34947 (2004). [DOI] [PubMed] [Google Scholar]
- 19.Satija R, Farrell JA, Gennert D, Schier AF & Regev A Spatial reconstruction of single-cell gene expression data. Nat. Biotechnol 33, 495–502 (2015). [DOI] [PMC free article] [PubMed] [Google Scholar]
- 20.Victora GD et al. Identification of human germinal center light and dark zone cells and their relationship to human B-cell lymphomas. Blood 120, 2240–2248 (2012). [DOI] [PMC free article] [PubMed] [Google Scholar]
- 21.Dominguez-Sola D et al. The proto-oncogene MYC is required for selection in the germinal center and cyclic reentry. Nat. Immunol 13, 1083–1091 (2012). [DOI] [PMC free article] [PubMed] [Google Scholar]
- 22.Zuccarino-Catania GV et al. CD80 and PD-L2 define functionally distinct memory B cell subsets that are independent of antibody isotype. Nat. Immunol 15, 631–637 (2014). [DOI] [PMC free article] [PubMed] [Google Scholar]
- 23.Hruz T et al. Genevestigator v3: a reference expression database for the meta-analysis of transcriptomes. Adv Bioinformatics 2008, 420747 (2008). [DOI] [PMC free article] [PubMed] [Google Scholar]
- 24.Platt RJ et al. CRISPR-Cas9 knockin mice for genome editing and cancer modeling. Cell 159, 440–455 (2014). [DOI] [PMC free article] [PubMed] [Google Scholar]
- 25.Casola S et al. Tracking germinal center B cells expressing germ-line immunoglobulin gamma1 transcripts by conditional gene targeting. Proc. Natl. Acad. Sci. U.S.A 103, 7396–7401 (2006). [DOI] [PMC free article] [PubMed] [Google Scholar]
- 26.Kurachi M, Ngiow SF, Kurachi J, Chen Z & Wherry EJ Hidden Caveat of Inducible Cre Recombinase. Immunity 51, 591–592 (2019). [DOI] [PubMed] [Google Scholar]
- 27.Bhattacharya D et al. Transcriptional profiling of antigen-dependent murine B cell differentiation and memory formation. J. Immunol 179, 6808–6819 (2007). [DOI] [PMC free article] [PubMed] [Google Scholar]
- 28.Green JA et al. The sphingosine 1-phosphate receptor S1P₂ maintains the homeostasis of germinal center B cells and promotes niche confinement. Nat. Immunol 12, 672–680 (2011). [DOI] [PMC free article] [PubMed] [Google Scholar]
- 29.Shields BJ et al. Acute myeloid leukemia requires Hhex to enable PRC2-mediated epigenetic repression of Cdkn2a. Genes Dev 30, 78–91 (2016). [DOI] [PMC free article] [PubMed] [Google Scholar]
- 30.Jackson JT et al. Hhex Regulates Hematopoietic Stem Cell Self-Renewal and Stress Hematopoiesis via Repression of Cdkn2a. Stem Cells 35, 1948–1957 (2017). [DOI] [PubMed] [Google Scholar]
- 31.Soufi A & Jayaraman P-S PRH/Hex: an oligomeric transcription factor and multifunctional regulator of cell fate. Biochem. J 412, 399–413 (2008). [DOI] [PMC free article] [PubMed] [Google Scholar]
- 32.Guiral M, Bess K, Goodwin G & Jayaraman P-S PRH represses transcription in hematopoietic cells by at least two independent mechanisms. J. Biol. Chem 276, 2961–2970 (2001). [DOI] [PubMed] [Google Scholar]
- 33.Kasamatsu S et al. Identification of the transactivating region of the homeodomain protein, hex. J. Biochem 135, 217–223 (2004). [DOI] [PubMed] [Google Scholar]
- 34.Xing S et al. Tle corepressors are differentially partitioned to instruct CD8+ T cell lineage choice and identity. J. Exp. Med 215, 2211–2226 (2018). [DOI] [PMC free article] [PubMed] [Google Scholar]
- 35.Jiménez G, Paroush Z & Ish-Horowicz D Groucho acts as a corepressor for a subset of negative regulators, including Hairy and Engrailed. Genes Dev 11, 3072–3082 (1997). [DOI] [PMC free article] [PubMed] [Google Scholar]
- 36.Koike T, Harada K, Horiuchi S & Kitamura D The quantity of CD40 signaling determines the differentiation of B cells into functionally distinct memory cell subsets. Elife 8, e44245 (2019). [DOI] [PMC free article] [PubMed] [Google Scholar]
- 37.MacLeod MKL et al. Memory CD4 T cells that express CXCR5 provide accelerated help to B cells. J. Immunol 186, 2889–2896 (2011). [DOI] [PMC free article] [PubMed] [Google Scholar]
- 38.Hatzi K et al. A hybrid mechanism of action for BCL6 in B cells defined by formation of functionally distinct complexes at enhancers and promoters. CellReports 4, 578–588 (2013). [DOI] [PMC free article] [PubMed] [Google Scholar]
- 39.Jackson JT et al. A crucial role for the homeodomain transcription factor Hhex in lymphopoiesis. Blood 125, 803–814 (2015). [DOI] [PubMed] [Google Scholar]
- 40.Smith KG, Weiss U, Rajewsky K, Nossal GJ & Tarlinton DM Bcl-2 increases memory B cell recruitment but does not perturb selection in germinal centers. Immunity 1, 803–813 (1994). [DOI] [PubMed] [Google Scholar]
- 41.Smith KG et al. bcl-2 transgene expression inhibits apoptosis in the germinal center and reveals differences in the selection of memory B cells and bone marrow antibody-forming cells. J. Exp. Med 191, 475–484 (2000). [DOI] [PMC free article] [PubMed] [Google Scholar]
- 42.Strasser A et al. Enforced BCL2 expression in B-lymphoid cells prolongs antibody responses and elicits autoimmune disease. Proc. Natl. Acad. Sci. U.S.A 88, 8661–8665 (1991). [DOI] [PMC free article] [PubMed] [Google Scholar]
- 43.Jangal M et al. The transcriptional co-repressor TLE3 suppresses basal signaling on a subset of estrogen receptor α target genes. Nucleic Acids Research 42, 11339–11348 (2014). [DOI] [PMC free article] [PubMed] [Google Scholar]
- 44.Polo JM, Ci W, Licht JD & Melnick A Reversible disruption of BCL6 repression complexes by CD40 signaling in normal and malignant B cells. Blood 112, 644–651 (2008). [DOI] [PMC free article] [PubMed] [Google Scholar]
- 45.Niu H, Ye BH & Dalla-Favera R Antigen receptor signaling induces MAP kinase-mediated phosphorylation and degradation of the BCL-6 transcription factor. Genes Dev 12, 1953–1961 (1998). [DOI] [PMC free article] [PubMed] [Google Scholar]
- 46.Allman D et al. BCL-6 expression during B-cell activation. Blood 87, 5257–5268 (1996). [PubMed] [Google Scholar]
- 47.Saito M et al. A signaling pathway mediating downregulation of BCL6 in germinal center B cells is blocked by BCL6 gene alterations in B cell lymphoma. Cancer Cell 12, 280–292 (2007). [DOI] [PubMed] [Google Scholar]
- 48.Chevrier S, Kratina T, Emslie D, Tarlinton DM & Corcoran LM IL4 and IL21 cooperate to induce the high Bcl6 protein level required for germinal center formation. Immunology and Cell Biology (2017). 10.1038/icb.2017.71 [DOI] [PubMed]
- 49.Saito M et al. BCL6 suppression of BCL2 via Miz1 and its disruption in diffuse large B cell lymphoma. Proc Natl Acad Sci USA 106, 11294–11299 (2009). [DOI] [PMC free article] [PubMed] [Google Scholar]
METHODS-ONLY REFERENCES
- 50.Ruzankina Y et al. Deletion of the Developmentally Essential Gene ATR in Adult Mice Leads to Age-Related Phenotypes and Stem Cell Loss. Cell Stem Cell 1, 113–126 (2007). [DOI] [PMC free article] [PubMed] [Google Scholar]
- 51.Muzumdar MD, Tasic B, Miyamichi K, Li L & Luo L A global double-fluorescent Cre reporter mouse. genesis 45, 593–605 (2007). [DOI] [PubMed] [Google Scholar]
- 52.Hunter MP et al. The homeobox gene Hhex is essential for proper hepatoblast differentiation and bile duct morphogenesis. Dev. Biol 308, 355–367 (2007). [DOI] [PMC free article] [PubMed] [Google Scholar]
- 53.Zheng GXY et al. Massively parallel digital transcriptional profiling of single cells. Nat Commun 8, 14049 (2017). [DOI] [PMC free article] [PubMed] [Google Scholar]
- 54.Bannard O et al. Ubiquitin-mediated fluctuations in MHC class II facilitate efficient germinal center B cell responses. J. Exp. Med 213, 993–1009 (2016). [DOI] [PMC free article] [PubMed] [Google Scholar]
Associated Data
This section collects any data citations, data availability statements, or supplementary materials included in this article.