

Abstract
Innate T cells, including invariant natural killer T (iNKT) and mucosal-associated innate T (MAIT) cells, are a heterogeneous T lymphocyte population with effector properties pre-programmed during their thymic differentiation. How this program is initiated is currently unclear. Here, we show that the transcription factor BCL-6 was transiently expressed in iNKT cells upon exit from positive selection and was required for their proper development beyond stage 0. Notably, development of MAIT cells was also impaired in the absence of Bcl6. BCL-6–deficient iNKT cells had reduced expression of genes that were associated with the innate T cell lineage, including Zbtb16, which encodes PLZF, and PLZF-targeted genes. BCL-6 contributed to a chromatin accessibility landscape that was permissive for the expression of development-related genes and inhibitory for genes associated with naïve T cell programs. Our results revealed novel functions for BCL-6 and illuminated how this transcription factor controls early iNKT cell development.
Introduction
Innate T cells, including invariant Natural Killer T (iNKT) cells and Mucosal-Associated Innate T (MAIT) cells, are present in mice and humans and are characterized by a poised effector state, which allows them to respond rapidly to microbial infection and to fight tumorigenesis1,2. iNKT cells express an oligoclonal T cell antigen receptor (TCR), which is selected in the thymus upon recognition of lipid ligands presented by the non-classical Major Histocompatibility Complex (MHC) I family molecule CD1D, expressed on cortical thymocytes2. In contrast to conventional T cell development, iNKT cell positive selection is assisted by signals emanating from the Signaling Lymphocytic Activating Molecule (SLAM) receptor family3. This positive selection process leads to the induction of the BTB-ZF family transcription factor Promyelocytic Lymphocyte Zinc Finger (PLZF), which specifies the innate program of iNKT cells4,5. PLZF is also expressed in other innate T lymphocytes, including MAIT cells5 and a subset of γδ T cells6,7, and in innate lymphoid cell (ILC) precursors8, suggesting that these cells share a common innate core program9.
Once iNKT cells are selected, they follow a developmental trajectory that enables their intrathymic differentiation and maturation10,11. A rare immature population of cells committed to the iNKT cell fate emerges after positive selection, which is characterized by high expression of the T cell maturation-associated marker CD24 (stage 0 cells, ST0). As selection proceeds, these cells downregulate CD24 and become stage 1 cells (ST1), which is a developmental intermediate that can produce cytokines upon stimulation, mainly interleukin 4 (IL-4)12,13. Subsequent upregulation of the T cell activation marker CD44 characterizes stage 2 (ST2) cells, which are a heterogeneous population consisting of both mature iNKT subsets and cells en-route to terminal differentiation14. Unfortunately, no surface markers have been discovered to unambiguously distinguish between subsets at this stage. At least three distinct mature iNKT subsets (NKT1, NKT2 and NKT17) develop in the thymus that resemble T helper (TH) 1, TH2 and TH17 conventional CD4+ T cells, based on signature transcription factor and cytokine expression.
Despite the identification of multiple factors that influence positive selection of iNKT cells15, there is much to be learned about the molecular mechanisms that control the early steps of this differentiation program. While PLZF is the signature transcription factor for the innate T cell lineage, it is not required until progression from ST14,5, suggesting that additional factors modulate the early stages of iNKT cell development. Here, we reveal that the BTB-ZF domain transcription factor B cell lymphoma 6 (BCL-6) is critical for early iNKT cell development. We found that BCL-6 was highly expressed in ST0 iNKT cells, whereas its expression was extinguished in subsequent developmental subsets. Despite this transient expression pattern, BCL-6–deficient iNKT cells showed a profound cell-intrinsic defect in development beyond ST0/ST1. Global transcriptomic analysis revealed that BCL-6 controls an iNKT cell maturation program associated with the ST0-to-ST1 transition, which includes PLZF and several of its target genes. Consistent with these results, we observed decreased chromatin accessibility at the Zbtb16 locus and other regions near genes associated with iNKT cell development in BCL-6–deficient ST0 cells and a failure to repress the ST0 program in ST1 cells. MAIT cell development was also impaired in the absence of BCL-6, indicating a broad and unprecedented function for this transcription factor in the thymic development of innate T cell populations.
Results
ST0 and ST1 immature iNKT cells expressed distinct transcriptomic profiles
To understand the molecular mechanisms that determine early iNKT cell development, we performed a global gene expression analysis in ST0 and ST1 iNKT cells. Pooled thymi from wild-type mice were magnetically enriched using CD1D tetramers loaded with the alpha-GalactosylCeramide analogue PBS57 (referred to as tetramer), and were sorted according to their expression of CD24 and CD44 (Extended Data Fig. 1a). Our analysis showed that 764 genes were differentially expressed by at least 2-fold (DESeq, P < 0.05) between ST0 and ST1 cells (Fig. 1a). Metascape analysis16 showed that several pathways involved in T cell activation, cytokine/cytokine receptor interactions and cytokine production, lymphocyte development and the immune response were enriched among the differentially expressed genes (Fig. 1b). To gain further insight into the gene programs that were affected during progression from ST0 to ST1, we performed Gene Set Enrichment Analysis (GSEA)17, which revealed that ST1 cells were enriched for genes upregulated in memory CD8+ and CD4+ T cells compared to their naïve counterparts (Fig. 1c). Thus, ST1 cells have a gene expression program distinct from their ST0 progenitors, which includes induction of genes associated with memory T cell transcriptional programs.
Figure 1. The gene expression profile of ST0 and ST1 iNKT cells.

a, Volcano plot showing genes that were differentially expressed between ST0 (sorted as Tetramer+TCRβ+CD24+CD44−) and ST1 (Tetramer+TCRβ+CD24−CD44−) iNKT cells. Lines indicate a 2-fold difference between ST0 and ST1 cells (DESeq, P < 0.05). b, Metascape analysis showing the pathways enriched among the genes that were differentially expressed. Metascape analysis was performed with hypergeometric test coupled with Benjamini-Hochberg P value correction algorithm. c, GSEA analysis of the RNA-seq data showing enrichment of T cell memory-related genes in ST1 cells, compared to ST0 cells. Gene sets were obtained from MSigDB for memory CD849 and memory CD450 (GSE11057) T cells. Normalized enrichment scores (NES) and FDR as implemented by GSEA, based on 1,000 permutations. d,e, Heatmaps showing the expression of select transcription factors (d, upper) and known ST0-expressed genes (d, lower), and cytokines, chemokines and their receptors (e) in the RNA-seq data. n=3 independent experiments with 4-6 pooled thymi each from 4-5 weeks old wild-type mice. Differential gene expression analysis was performed with the DESeq algorithm. *P < 0.05, **P < 0.01, ***P < 0.001
Our analysis revealed that genes associated with the earliest iNKT progenitors were highly expressed in ST0 cells, including Cd24a, Cd8a, Nr4a1 (encoding for NUR77) and Cd69, and were all downregulated in ST1 cells (Fig. 1d). Several transcription factors that were associated with iNKT cell development (differentiation-associated genes) were upregulated during transition from ST0 to ST1 (Fig. 1d). For example, Zbtb16 (encoding for PLZF) and Id2 significantly increased in ST1 cells. In addition, PLZF target genes such as Runx3, Maf, and Rora18 were expressed in ST1 but not in ST0 cells. Irf4, which is involved in the differentiation of conventional CD4 TH cell lineages19, also increased in ST1 cells. Moreover, Zbtb7b (encoding for Th-POK), a regulator of iNKT cell differentiation20-22, was induced in ST1 cells. Expression of Tbx21 (encoding for T-BET), which is highly expressed in mature NKT1 cells, started to be expressed in ST1 cells, consistent with the low expression of T-BET protein at this stage23 (Extended Data Fig. 1b). In addition to relevant transcription factors, ST1 cells exhibited higher expression of genes encoding multiple cytokines and cytokine receptors associated with mature NKT1 cells (Fig. 1e). In contrast, genes encoding receptors for immunoregulatory cytokines (e.g. Il10ra and Il4ra) were downregulated in ST1 cells. Taken together, these results revealed that a maturation program related to NKT1 cells emerged at the earliest immature stages of iNKT cell development in C57BL/6J mice.
Bach2, encoding a transcription factor associated with the maintenance of a naïve T cell state that is downregulated in effector cells24,25, was highly expressed in ST0, as compared to ST1 cells, in agreement with the activated T cell phenotype of iNKT cells (Fig. 1d). Genes encoding transcription factors related to innate lymphoid progenitors and early T cell precursors were preferentially expressed in ST0 cells, including Tox, Gfi-1, Runx1, and Sox426. These genes were co-expressed in ST0 cells with other relevant TF genes, including Tcf7, Gata3, Ets1 and Bcl11b, which continued to be expressed in ST1 cells (Fig. 1d). Genes encoding transcription factors related to TCR activation and co-stimulatory molecules (including Themis, Egr1, Egr2, Myb, Btla, Cd28, Cd69, and Rasgrp) were also highly transcribed in ST0 cells, probably as a consequence of iNKT cell positive selection, and were downregulated as cells transitioned to ST1. Therefore, ST0 cells were characterized by the expression of genes that were associated with adaptive and innate lymphocyte progenitors or naïve T cells, consistent with their developmental potential.
BCL-6 is expressed in ST0 iNKT cells
We noticed that Bcl6 was highly expressed in ST0 cells, but its expression was lost in ST1 cells (Fig. 1d and Extended Data Fig. 1c) and this was confirmed by qPCR (Fig. 2a). Analysis of conventional thymocyte subsets showed that Bcl6 was highly expressed in pre-selected CD4+CD8+ (double-positive, DP) cells, whereas it was dramatically reduced in post-selected DP and thymic CD4+ T cells (Fig. 2a).
Figure 2. BCL-6 is expressed specifically in ST0 iNKT cells.

a, Graph showing average Bcl6 mRNA expression in the indicated FACS-sorted populations. n=3 independent experiments with 3-5 pooled thymi each from 4-5 weeks old mice. Data represent mean ± SEM. b, Flow cytometry histograms showing expression of BCL-6 protein in the indicated populations. c, Flow cytometry plots showing expression of BCL-6 and CD24 in CD44− iNKT cells after magnetic bead-based enrichment. d, BCL-6 expression in pre-DP (CD69−TCRβ−CD4+CD8+), post-DP (CD69+TCRβ+CD4+CD8+) and ST0 iNKT cells. e, Graph showing the geometric mean fluorescence intensity (gMFI) of BCL-6 in the indicated thymic populations. Data represent mean ± SEM. n=6 independent experiments. Statistical analysis was performed with two-tailed unpaired t-test **P < 0.01, ***P < 0.001
BCL-6 protein mirrored mRNA expression; BCL-6 was highly expressed in DP cells but not in other conventional thymic subsets or in total thymic iNKT cells (Fig. 2b). CD69+ and EGR2+ ST0 iNKT cells expressed high amounts of BCL-6, whereas BCL-6 was downregulated in ST1 cells (Fig. 2c and Extended Data Fig. 1d). ST0 cells expressed slightly higher amounts of BCL-6 than pre-selected DP cells (Fig. 2d,e). These observations indicated that ST0 iNKT cells, in contrast to conventionally post-selected DP cells and other iNKT cell subsets, exhibited high BCL-6 protein and Bcl6 mRNA.
BCL-6 was required for iNKT cell development
To investigate the function of BCL-6 in iNKT cells, we crossed Cd4Cre mice with Bcl6F/F mice on the C57BL/6J background, to generate mice that lack BCL-6 starting from the DP stage of thymic development27,28 (hereafter referred to as Bcl6Δ/Δ); efficient Bcl6 deletion in iNKT cells was confirmed in Cd4CreBcl6F/+ (Extended Data Fig. 2a). Bcl6Δ/Δ thymi exhibited a large reduction in the number and percentage of iNKT cells (Fig. 3a,b). iNKT cells were substantially reduced in peripheral tissues including the liver and spleen of Bcl6Δ/Δ mice (Fig. 3a,b, middle and bottom). The lack of iNKT cells in the thymus and the periphery was a cell-intrinsic consequence of BCL-6 deficiency, as revealed by competitive bone marrow chimeras (Fig. 3c and Extended Data Fig. 2b,c). To investigate whether BCL-6 had a broad effect on the development of innate-like T cell populations, we examined MAIT cells, which largely failed to develop in Bcl6Δ/Δ thymi (Fig. 3d). In contrast, conventional T cell development was normal in the absence of BCL-6 (Extended Data Fig. 3a,b), consistent with published results27. Therefore, BCL-6 was essential for the development of innate-like T cells in the thymus.
Figure 3. BCL-6—deficient mice lack iNKT and MAIT cells.

a, Flow cytometry plots showing iNKT cells in the thymus (upper panel), liver (middle panel) and spleen (lower panel) of 3-6 weeks old control and Bcl6Δ/Δ mice. Numbers in the plots indicate the percent of iNKT cells in the respective tissues. b, Graphs showing the number and percentage of iNKT cells in the indicated tissues. Data represent mean ± SEM. n=10 independent experiments for the thymus and n=6 independent experiments for the spleen and liver. c, Flow cytometry plots showing the percentage of Tetr+TCRβ+ thymocytes in the indicated compartments of competitive bone marrow chimeric mice. Graphs show the percentage and the number of iNKT cells per DP cells among CD45.1+ (comp) and CD45.2+ (Bcl6Δ/Δ) thymocytes. Data represent mean ± SEM. n=5 independent experiments. d, Flow cytometry plots showing MAIT cells in the thymus of control and Bcl6Δ/Δ mice. Thymocytes were first magnetic bead-enriched with tetramers loaded with the MAIT ligand 5-OP-RU. Graphs show the cell number and percentage of MAIT cells among thymocytes. Data represent mean ± SEM. n=5 independent experiments. Statistical analysis was performed with two-tailed unpaired t-test. ** P < 0.01, ***P < 0.001
Accumulation of ST0 cells in BCL-6–deficient thymi
Because BCL-6 is expressed in both preselected DP cells and in ST0 iNKT cells, it was possible that BCL-6 influenced either selection of iNKT cells in the DP stage or iNKT cell development after commitment to the innate T cell lineage. To distinguish between these possibilities, we first performed a thorough analysis of the iNKT developmental stages in Bcl6Δ/Δ animals. To accurately calculate rare ST0 cells, we performed magnetic bead-based enrichment of thymic iNKT cells prior to flow cytometry (Fig. 4a and Extended Data Fig. 2d). Our analysis revealed that the number and percentage of ST0 iNKT cells increased in the absence of BCL-6 (Fig. 4b), indicating that iNKT cell positive selection was not altered. Corroborating these results, expression of several selecting molecules, including CD1D, CD150, LY108, and Sh2d1a, expression of Tcra Vα14-Jα18 transcripts and the number of DP cells were normal in Bcl6Δ/Δ mice (Extended Data Fig. 3b). In contrast, the numbers of ST1, ST2 and ST3 iNKT cells were severely reduced (Fig. 4c, left). However, the frequency of these populations among total iNKT cells was not altered in the absence of BCL-6, although ST1 cells were slightly enriched (Fig. 4c, right). Mixed bone chimeras also showed enrichment of Bcl6Δ/Δ ST0 and ST1 cells, with a concomitant loss of more mature cells, compared to their wild-type competitors (Fig. 4d,e, and Extended Data Fig. 2e,f). Taken together, our results indicated that the developmental pathway of Bcl6Δ/Δ iNKT cells was blocked at ST0/ST1.
Figure 4. Accumulation of immature iNKT cells in the absence of BCL-6.

a, Thymocytes from 3-6 weeks old control and Bcl6Δ/Δ mice were enriched for iNKT cells with magnetic beads and were subsequently stained with anti-TCRβ, anti-CD24, anti-CD44 and anti-NK1.1 to identify the various iNKT developmental stages (ST0-3). Numbers in the plots indicate the percentage of the respective populations. b, Graphs show the absolute cell number and percentage of ST0 cells in control and Bcl6Δ/Δ mice. Data represent mean ± SEM. n=4 independent experiments. c, Graphs showing the absolute cell number and percentage of ST1, ST2 and ST3 cells in control and Bcl6Δ/Δ mice. Data represent mean ± SEM. n=6 independent experiments with multiple mice for each experiment. d,e, Flow cytometry plots showing the percentage of (d) ST0 and (e) ST1-3 cells among CD45.1+ (Comp) and CD45.2+ (Bcl6Δ/Δ) iNKT cells. Graphs show the mean percentage ± SEM in the indicated populations. n=4 (ST0), or n=5 (ST1-3) independent experiments. Statistical analysis was performed with two-tailed unpaired t-test. *P < 0.05, ***P < 0.001
To examine whether BCL-6 influenced the fate of NKT1, NKT2 and NKT17 mature populations, we analyzed the thymi and the spleens of Bcl6Δ/Δ mice by flow cytometry for TH-related signature transcription factors. Our analysis revealed that the number of all mature iNKT subsets was reduced in Bcl6Δ/Δ mice (Fig. 5a,b and Extended Data Fig. 4). However, the frequency of NKT1 and NKT2 cells among the remaining iNKT cells was not altered, while the frequency of NKT17 cells was reduced in the absence of BCL-6 (Fig. 5a,b), consistent with the reduced expression of Rorc in ST1 Bcl6Δ/Δ iNKT cells (Extended Data Fig. 4c).
Figure 5. BCL-6–deficient mice lack mature iNKT cells.

a, FACS plots of total thymocytes showing the percentage of NKT1 (T-BET+PLZFlo), NKT2 (PLZFhiT-BET−) and NKT17 (RORγt+T-BET−) cells in 3-6 weeks old mice from the indicated strains. Numbers in the plots indicate the percent of the respective subsets among total iNKT cells. b, Average cell number and percentage of NKT1, NKT2 and NKT17 cells in control and Bcl6Δ/Δ mice. Data represent mean ± SEM. n=10 (NKT1 and NKT2), or n=7 independent experiments (NKT17). c, FACS plots showing the production of IFN-γ, IL-4 and IL-17 in total iNKT cells stimulated in vitro with PMA and ionomycin for 5h, in the presence of Brefeldin A. Numbers in the plots indicate the percent of iNKT cells that produce each cytokine. d, Graphs show the mean percentage (left) and number (right) of iNKT cells ± SEM expressing the indicated cytokines. n=6 independent experiments. Statistical analysis was performed with two-tailed unpaired t-test (b), or two-tailed paired t-test (d). *P < 0.05, **P < 0.01, ***P < 0.001.
Our results showed that the iNKT cell population in Bcl6Δ/Δ thymi was enriched for immature subsets, especially ST0 cells. To investigate the functional consequences of BCL-6 deficiency, we determined whether these cells were able to produce cytokines after PMA and ionomycin stimulation. The number of iNKT cells producing interferon-γ (IFN-γ), IL-4, and IL-17A was reduced in Bcl6Δ/Δ mice, consistent with their reduced total iNKT cell number (Fig. 5c,d). We also found a reduced frequency of cells producing IFN-γ and IL-17A, consistent with the reduced frequency of mature iNKT cells. However, the frequency of IL-4–producing cells was unaffected, consistent with previous results showing that immature CD44—/lo iNKT cells were able to produce IL-4 (Fig. 5c,d)12,13. These findings were consistent with our phenotypic analysis and suggested an enrichment of immature cells among iNKTs in the Bcl6Δ/Δ thymus.
BCL-6–deficient iNKT cells showed normal proliferation and apoptosis
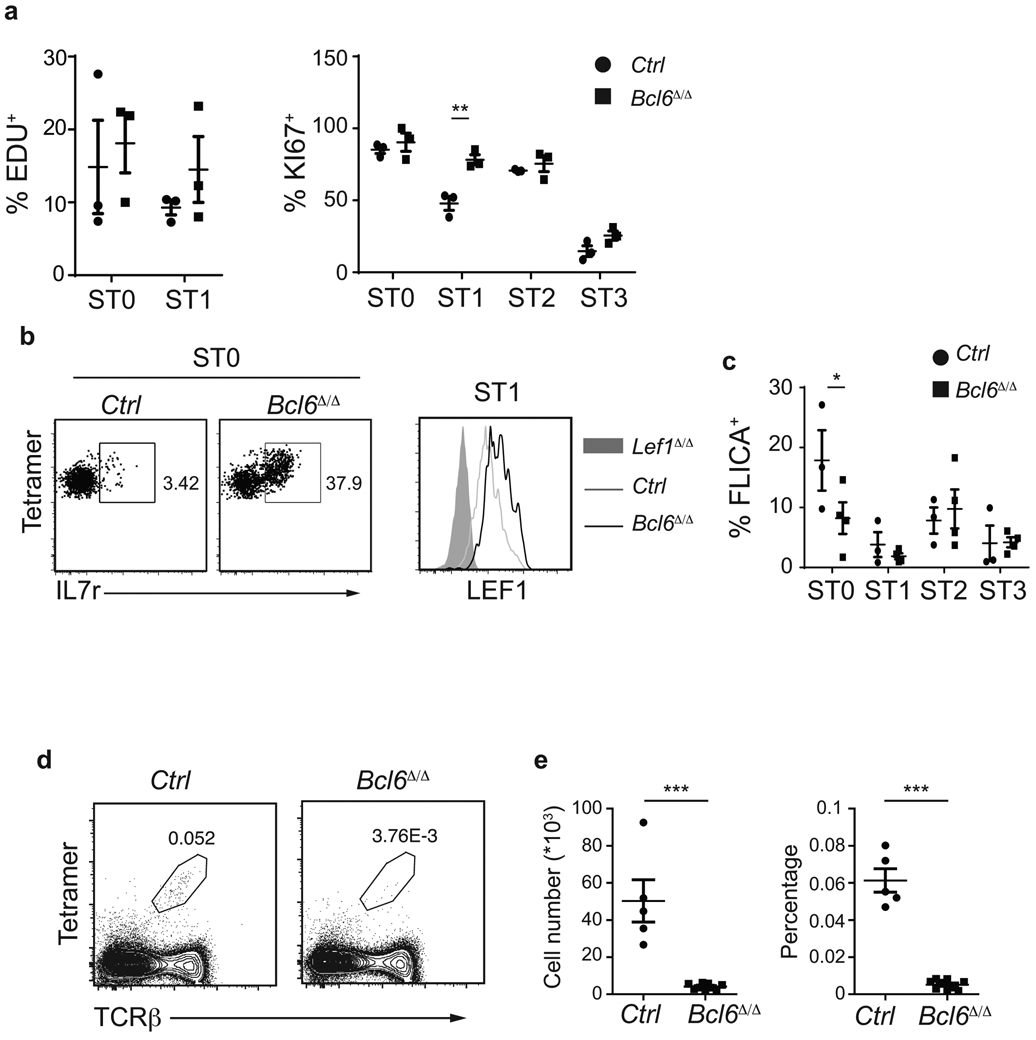
Immature iNKT cells undergo a vigorous intrathymic proliferation phase that ultimately leads to an expansion of mature populations. Therefore, the loss of Bcl6Δ/Δ iNKT cells may be due to an impaired proliferative capacity. However, Ki67 staining and EDU incorporation showed that Bcl6Δ/Δ iNKT cells did not have a proliferation defect (Extended Data Fig. 5a). In fact, a higher percentage of Bcl6Δ/Δ iNKT cells were EDU+ and Ki67+ in ST1, compared to their control littermates, consistent with the increased expression of IL-7R and LEF1, two regulators of iNKT cell proliferation29 (Extended Data Fig. 5b). Bcl6Δ/Δ iNKT cells showed no evidence of increased apoptosis, as assessed ex vivo by staining with fluorescent pan-caspase inhibitor (Extended Data Fig. 5c). Therefore, the loss of iNKT cells in the absence of BCL-6 was not due to altered proliferation or apoptosis.
We noted that BCL-6–deficient adult mice still contained a few mature iNKT cells and hypothesized that increased proliferation may explain the appearance of these cells. Indeed, 10-day old Bcl6Δ/Δ mice had a greater decrease in iNKT cell numbers in the thymus compared to adult Bcl6Δ/Δ mice (Extended Data Fig. 5d,e) indicating that iNKT cell numbers may increase with age due to their increased proliferation capacity.
Progression from ST0 to ST1 required BCL-6
We hypothesized that the impaired development of BCL-6–deficient iNKT cells was due to an early differentiation defect. To investigate this hypothesis, we examined the expression of the iNKT signature transcription factor PLZF at early stages of development. Quantitative (q)PCR analysis from sorted ST0 and ST1 cells revealed that Zbtb16 mRNA was impaired in ST0 and ST1 Bcl6Δ/Δ cells (Extended Data Fig. 6a). While approximately 15% of ST0 cells from control animals expressed PLZF, only 5% of Bcl6Δ/Δ ST0 cells were PLZF-positive, as assessed by flow cytometry (Extended Data Fig. 6b, top). PLZF geometric mean fluorescence intensity (gMFI) was reduced by half in the absence of BCL-6 (Extended Data Fig. 6c). Consequently, only 60% of Bcl6Δ/Δ ST1 cells were PLZF-positive, whereas 90% of ST1 cells in control littermates expressed PLZF (Extended Data Fig. 6b, bottom). However, PLZF was expressed appropriately in subsequent developmental stages (Extended Data Figure 6d). These results indicated a blunted PLZF induction at the point of iNKT lineage specification after Bcl6 deletion, despite normal TCR signaling, as indicated by expression of CD5 and CD69, which are markers of TCR signal strength (Extended Data Fig. 6e).
To investigate how the gene expression program of early iNKT cell progenitors was influenced by deletion of Bcl6, we performed global transcriptomic analysis of ST0 and ST1 iNKT cells. Our analysis showed that 942 genes were differentially expressed between control and Bcl6Δ/Δ ST0 iNKT cells and 277 between control and Bcl6Δ/Δ ST1 cells (Fig. 6a). In both cell populations, 50% of differentially expressed genes (DEGs) were upregulated and 50% were downregulated in the absence of BCL-6. Of note, 21.5% of the DEGs between wild-type ST0 and ST1 showed altered expression in Bcl6Δ/Δ ST0 cells (Fig. 6b). These genes belonged to pathways involved in the regulation of leukocyte differentiation and effector processes, cytokine production and cytokine-cytokine receptor interactions (Fig. 6c), which were also involved in iNKT cell differentiation. Interestingly, pathways involved in T cell activation were not regulated by BCL-6. Therefore, in ST0 cells, BCL-6 controlled a set of genes that contributes to iNKT cell differentiation.
Figure 6. Impaired progression from ST0 to ST1 in the absence of BCL-6.

a, Volcano plots showing the differentially expressed genes (2-fold change, DESeq, P < 0.05) between control and Bcl6Δ/Δ mice in ST0 and ST1 cells, based on RNA-seq data. b, Venn diagrams showing the genes that are both dependent on BCL-6 in ST0 and change their expression when transitioning from ST0 to ST1. Numbers in each compartment indicate the number of genes in that compartment. The percentage indicates the percent of common genes relative to the DEGs between ST0 and ST1 (164/764). c, Metascape analysis showing the pathways enriched for the BCL-6—dependent genes that also changed their expression during the ST0-ST1 transition. Analysis was performed with hypergeometric test coupled with Benjamini-Hochberg P value correction algorithm d, Venn diagrams showing the ST0-specific genes that are dependent on BCL-6 in ST1. Numbers in each compartment indicate the number of genes in that compartment. The percentage indicates the percent of common genes relative to all ST0-specific genes (69/425). e, Scatterplots showing the differentially expressed genes in the indicated comparisons. Dashed lines indicate 2-fold change thresholds. Numbers in each quadrant indicate the number of genes in that quadrant. f, Venn diagrams showing the differentiation-associated genes that are dependent on BCL-6 in ST1. Numbers in each compartment indicate the number of genes in that compartment. The percentage indicates the percent of common genes relative to all ST0-specific genes (33/339). g, GSEA analysis showing enrichment of NKT1-associated genes30 in ST1 cells, compared to ST0 cells. h, GSEA analysis showing enrichment of NKT1-associated genes in wild-type ST1 cells, compared to Bcl6Δ/Δ ST1 cells. i, GSEA analysis showing enrichment of NKT0-associated genes30 in Bcl6Δ/Δ ST1 cells, compared to wild-type ST1 cells. Normalized enrichment scores (NES) and FDR as implemented by GSEA, based on 1,000 permutations. Statistical analysis of the overlaps in the Venn diagrams (b,d,f) was performed with permutation test after 10,000 resamplings. n=3 independent experiments with 4-6 pooled mice for each genotype. ***P < 0.0001.
Interestingly, 16.2% of the ST0-specific genes showed altered expression in BCL-6–deficient ST1 iNKT cells (Fig. 6d). The vast majority of these genes (62/69, 90%, Fig. 6e, compare Q1 to Q2) showed increased expression in BCL-6–deficient ST1 cells, indicating that ST0-specific genes failed to be repressed in ST1 in the absence of BCL-6. In addition, 9.7% of the differentiation-associated genes were not properly induced in Bcl6Δ/Δ ST1 iNKT cells (Fig. 6f). Therefore, the differentiation program of iNKT cells is not fully deployed in the absence of BCL-6 and is also dissociated from down-regulation of CD24.
To further explore this hypothesis on a global level, we performed GSEA analysis. In accordance with the known developmental trajectory of iNKT cells, wild-type ST1 cells were enriched for a gene signature associated with NKT1 cells, which constitute the vast majority of mature iNKT cells in C57BL/6J mice (Fig. 6g). Not surprisingly, wild-type ST0 cells were enriched for the NKT0 gene signature, defined as Tetr+CD24hiTCRβintCD8α−CD44−NK1.1− cells30 (Extended Data Fig. 7a). Interestingly, Bcl6Δ/Δ ST1 cells showed a gene expression profile associated with NKT0 cells, but not NKT1 or NKT17 cells (Fig. 6h,i and Extended Data Fig. 7b). However, Bcl6Δ/Δ ST1 cells were enriched for genes associated with the NKT2 signature (Extended Data Fig. 7c), consistent with previous reports showing that NKT2 cells resembled NKT0 progenitors30. Taken together, these results demonstrated that progression of ST0 cells towards the ST1 developmental intermediate was dependent upon the function of BCL-6.
Because Bcl6 deletion affected expression of PLZF, we investigated whether PLZF target genes showed altered expression in Bcl6Δ/Δ iNKT cells. Our analysis of previously published microarrays18 confirmed that 134 genes were deregulated in the absence of PLZF in ST1 iNKT cells. Of those genes, 87 were also deregulated in Bcl6Δ/Δ ST1 cells by more than 2-fold, although only 22 genes were changed significantly (DESeq, P < 0.05, Fig. 7a). Importantly, with the exception of five genes, all genes were concordantly deregulated in both BCL-6- and PLZF-deficient cells (Fig. 7a). Bach2, which is directly repressed by PLZF, was upregulated more than 10-fold in the absence of BCL-6, as confirmed by qPCR (Fig. 7b). L-selectin (CD62L), which is also repressed by PLZF and is a key homing receptor for naïve T cells, was expressed at greater frequency in Bcl6Δ/Δ ST1 iNKT cells than in control littermate ST1 iNKT cells, as shown by flow cytometry (Fig. 7c). Similarly, CD69 was maintained on a greater percentage of Bcl6Δ/Δ ST1 iNKT cells (Fig. 7d). Although our RNA-seq data did not reveal a decrease in Icos transcripts in the absence of BCL-6, flow cytometry analysis demonstrated that ICOS was reduced in Bcl6Δ/Δ ST1 iNKT cells (Fig. 7e). Our data revealed that PLZF expression was blunted at the point of iNKT cell specification and that multiple PLZF target genes failed to be repressed in the absence of BCL-6.
Figure 7. BCL-6 is required for repression of a subset of PLZF target genes.

a, Scatterplot showing the expression of PLZF target genes in the Bcl6Δ/Δ ST1 NKT cells. Numbers in each quadrant indicate the number of genes in that quadrant. b, qPCR analysis showing Bach2 mRNA expression in sorted ST1 iNKT cells from control and Bcl6Δ/Δ mice. Numbers in the y axis indicate mean fold change over the reference gene ± SEM. n=3 independent experiments. c,d, FACS plots showing the expression of CD62L (c) and CD69 (d) in ST1 iNKT cells from the indicated mouse strains. Data represent the mean percentage ± SEM of the indicated subset among ST1 cells. n=5 (CD62L) and n=3 (CD69) independent experiments. e, Histograms showing the expression of ICOS in ST1 iNKT cells from the indicated mouse strains. Graphs show the mean gMFI of ICOS ± SEM in control and Bcl6Δ/Δ ST1 iNKT cells. n=5 independent experiments. Statistical analysis was performed with two-tailed unpaired t-test (b,c,d), or one-sample two-tailed t-test (e). *P < 0.05, **P < 0.01.
BCL-6 regulated chromatin accessibility in ST0 iNKT cells
To investigate whether the early stages of the iNKT maturation program were critical for determining the chromatin accessibility profile of mature iNKTs, we performed ATAC-seq in ST0, ST1, and mature NKT1 (sorted as Tetr+TCRβ+CD24−CD44+NK1.1+) cells. To exclude loci that may be open transiently in ST0 cells due to positive selection and TCR signaling, we restricted our analysis in loci that were more accessible in mature NKT1 cells as compared to DP thymocytes31 (iNKT-related regions). Our results showed that these regions were already accessible in ST0 cells (Fig. 8a and Extended Data Fig. 8a), indicating early opening of iNKT-related loci after iNKT cell lineage determination.
Figure 8. Chromatin accessibility around developmentally-regulated genes depends on BCL-6.

a, Heatmaps of ATAC-seq reads of DP, ST0, ST1, and mNKT cells in wild-type mice. Statistical difference between profiles was estimated with two-sided Kolmogorov-Smirnov test. b, Schematic diagram showing the number of ATAC-accessible regions in wild-type ST0 and ST1 iNKT cells. While the majority of regions are accessible both in ST0 and ST1 cells (number in the overlap), a number of regions are more accessible in ST0 cells (left circle), or in ST1 cells, based on a 2-fold differential accessibility (edgeR, P < 0.05). Percentages represent the percent of peaks for the respective compartment relative to all peaks. c, Average genomic profiles of ATAC-seq reads of ST0 and ST1 cells in the indicated mouse strains. d, Scatterplot showing the accessibility of DA loci between wild-type ST0 and ST1, in Bcl6Δ/Δ ST1 cells. Numbers in each quadrant indicate the number of peaks in that quadrant. e, Dendrogram showing hierarchical clustering analysis of accessible loci in the indicated populations. f, Genome track view of the Zbtb16 locus in wild-type and Bcl6Δ/Δ ST0 cells. g, Histograms showing the percent of the developmentally-regulated genes, whose accessibility depends on BCL-6 in ST0 cells. Statistical analysis was performed with permutation test after 10,000 resamplings. n=2 independent experiments with 4-6 pooled mice for each genotype. **P = 0.0023, ****P < 10−16.
To gain further insight into how BCL-6 may regulate iNKT cell development, we examined the chromatin accessibility profiles of ST0 and ST1 cells in the presence or absence of Bcl6 by ATAC-seq. Our analysis showed that 43,158 chromatin regions were open in wild-type ST0 and/or ST1 cells. The vast majority of these loci (37,227) were open in both ST0 and ST1 cells, including regions near key genes involved in iNKT cell development (Fig. 8b and Extended Data Fig. 8a). A total of 4,165 regions were more accessible in ST0 cells and 1,766 gained accessibility in ST1 cells (Fig. 8b).
ST0-accessible regions remained open in Bcl6Δ/Δ ST1 cells, whereas ST1-associated open chromatin regions were mostly closed in Bcl6Δ/Δ ST1 cells (Fig. 8c and Extended Data Fig. 8b). Specifically, 46% (1,915/4,165) of the ST0-accessible sites were still highly accessible in Bcl6Δ/Δ ST1 cells (Fig. 8d, Q1), including loci near genes associated with the naïve T cell program, such as Bach2 and Sell (Supplementary Fig. 8c). In addition, 27.2% (481/1,766) of the ST1 accessible regions were less accessible in Bcl6Δ/Δ ST1 cells (Fig. 8d, Q3). Consistent with these results, hierarchical clustering analysis showed that the chromatin accessibility profile of Bcl6Δ/Δ ST1 cells clustered close to wild-type ST0 cells and away from wild-type ST1 cells (Fig. 8e). Collectively, these results indicated that BCL-6 shaped the chromatin accessibility profile of iNKT cells during transition from ST0 to ST1.
To investigate how BCL-6 may influence the chromatin landscape and gene expression of developing iNKT cells, we focused our chromatin analysis on the loci of genes with altered expression between wild-type ST0 and ST1 cells, which are thus relevant to iNKT cell development. Our analysis demonstrated that 16.2% (55/339) of differentiation-related genes (upregulated in wild-type ST1 compared to ST0) contained at least one region within 50 kb upstream or downstream of their transcription start site (TSS) that was less accessible in Bcl6Δ/Δ ST0 cells compared to wild-type ST0 cells, (compared to only 4.5% of non-DEGs). We found that 43.6% (24/55) of these genes were also differentially expressed in Bcl6Δ/Δ ST0 cells compared to wild-type ST0 cells. Of note, the Zbtb16 gene locus contained multiple regions that were less accessible in Bcl6Δ/Δ ST0 cells compared to their wild-type counterparts (Fig. 8f). Chromatin regions associated with several PLZF target genes or other important genes for iNKT cell biology were also affected, including Icos, Il18r1/Il18rap, Cxcr3, Maf, Il13, and Tbx21 (Supplementary Fig. 8d). In contrast, only 3.2% (11/339) of the differentiation-related genes contained at least one locus that was more accessible in Bcl6Δ/Δ ST0 cells than in wild-type ST0 cells, none of which were expressed in a BCL-6-dependent manner in ST0 cells (Fig. 8g). Therefore, BCL-6 was required, already at ST0, for increased chromatin accessibility near, and expression of, genes that were developmentally regulated in iNKT cells.
Discussion
The mechanisms that control the earliest stages of innate-like lymphocyte development are largely unknown. Here, we discovered that Bcl6 was highly expressed at the inception of iNKT cell development but downregulated by ST1, prior to the emergence of iNKT cell effector fates. We found a cell-intrinsic requirement for BCL-6 for the development of iNKT and MAIT cells, whereas conventional T cell development was unperturbed. BCL-6 did not appear to influence positive selection of iNKT cells or the degree of Tcra Vα14-Jα18 rearrangements in DP cells, despite its high expression at this stage, and apoptosis and proliferation were not impacted by BCL-6 deletion. Our transcriptomic analysis showed that transition from ST0 to ST1 was associated with the emergence of gene programs associated with mature iNKT cells, such as genes for cytokines and cytokine receptors, homing molecules and T cell effector molecules, and deployment of an innate-associated program. Indeed, a small fraction of ST0 cells upregulated PLZF, indicating that the innate T cell program may be specified even before CD24 is downregulated. Therefore, ST0 cells may be divided in two subsets, PLZF-negative ST0 (early ST0) and PLZF-positive ST0 cells (late ST0), which are becoming ST1 cells. In the absence of BCL-6, this program was not fully deployed and ST0 and ST1 iNKT cells had low expression of key innate T cell molecules, including PLZF and several PLZF target genes18. In addition, naïve T cell genes, such as Bach2, Lef1 and Sell, continued to be expressed in Bcl6Δ/Δ ST1 cells. Therefore, BCL-6 promotes the PLZF-negative to PLZF-positive transition within ST0/ST1, placing BCL-6 as an essential early regulator of the innate T cell fate.
By combining RNA-seq and ATAC-seq in wild-type ST0 and ST1 cells, we found that innate-associated genes were induced in ST1 cells, while several loci surrounding these genes, including Zbtb16, Tbx21, Id2, Il4/Il13, Ifng and Il2rb1, were already accessible in ST0 cells. In sharp contrast, these loci were not accessible in DP cells, or naïve CD4 T cells, where they open only after T cell activation32. These key loci had reduced accessibility in Bcl6Δ/Δ ST0 iNKT cells demonstrating that BCL-6 was required for the chromatin changes associated with induction of these innate genes. As differentiation proceeds towards ST1, several loci near genes associated with the naïve T cell fate became less accessible. These regions remained accessible in Bcl6Δ/Δ ST1 cells demonstrating that BCL-6 was necessary for their repression, either directly or indirectly. Because ST1 cells are heterogeneous (as indicated by the expression of T-BET and RORγt in a minor subset of cells), it remains unclear how each cell type may be affected by BCL-6 expression. Nonetheless, our results demonstrate that BCL-6 promotes a chromatin environment that is required to support the emergence of their ensuing innate program early in iNKT cell development.
Despite that PLZF fails to be properly induced in Bcl6Δ/Δ ST0 cells, low expression of PLZF in a few ST0/ST1 may support their differentiation into effector subsets. In agreement with this, iNKT cells in mice with transiently reduced PLZF at early developmental stages showed comparable maturation to their littermate controls, despite their lower numbers33. In addition, germline Bcl6−/− mice were shown to have near wild-type iNKT cell numbers in the spleen34, in contrast to our results. However, those experiments were performed in fetal liver chimeric mice, where the competitor bone marrow lacked iNKT cells (derived from SAP-deficient mice), thus abolishing any iNKT cell competition. Our observations may explain the presence of BCL-6–deficient iNKT cells observed previously34, since these cells may proliferate and accumulate with age; consistent with this hypothesis, we showed here that neonatal Bcl6Δ/Δ mice had a greater defect in iNKT cell development than adult mice.
While BCL-6 is considered the signature transcription factor of follicular helper T (TFH) cells, it has been broadly implicated in T cell differentiation. Previous studies showed that BCL-6 was transiently induced after activation of CD4+ and CD8+ T cells35-37 and it was required for the generation of memory T cells38,39. BCL-6 supports the progenitor-like memory CD8 T cell pool and these BCL-6–expressing CD8 memory precursor cells share a molecular signature with hematopoietic stem cells and TFH cells40-42. We found that BCL-6 was expressed in early iNKT cell progenitors and was required for the development of T cells with innate phenotype. However, it is not clear to what extent activated/memory conventional T cells and innate T cells share a common gene network and how BCL-6 may regulate these programs. BCL-6 contains two transcriptional repressor domains and interacts with multiple corepressor complexes; it is thus considered a bona fide transcriptional repressor43. Importantly, these domains are differentially required for the generation of TFH and germinal center B cells, indicating cell type-specific functions for BCL-644,45. BCL-6 appears to promote the TFH fate by suppressing alternative lineage programs, including TH1, TH2 and TH1746-48. However, only a limited number of genes are bound and directly regulated by BCL-6 in TFH cells48. In addition, only 10% of the bound genes contain BCL-6 binding motifs, suggesting that BCL-6 may cooperate with other transcription factors to determine lineage fate47,48. We postulate that BCL-6 may repress genes associated with the naïve T cell fate, or alternatively, BCL-6 may suppress expression of transcription factors that repress Zbtb16 and other innate-related molecules that repress this naïve gene program. Identification of direct BCL-6 target genes in ST0 iNKT cells would help to clarify how BCL-6 regulates iNKT cell development. Taken together, our results reveal a novel role for BCL-6 in enforcing the identity of early iNKT committed progenitors and shaping the genomic landscape for the subsequent unfolding of iNKT cell maturation programs and are consistent with BCL-6 being a broad regulator of T cell differentiation programs.
Methods
Mice
Wild-type, littermate controls and Cd4CreBcl6F/F mice were kept on the C57BL/6J background. Cd4CreBcl6F/F (referred to as Bcl6Δ/Δ) mice were described previously27. Both male and female mice were used in experiments. Competitive bone marrow chimeras were performed as previously described51. All mice were housed either at The University of Chicago Animal Resource Center or at the Biomedical Sciences Research Center (BSRC) Alexander Fleming Animal Facility. Experiments were performed according to the guidelines of The Institutional Animal Care and Use Committee of the University of Chicago and of the BSRC Alexander Fleming.
Flow cytometry, cell sorting and antibodies
Thymocyte suspensions from 10-days old or three-to-six weeks old mice were incubated with anti-FcγR prior to staining with fluorochrome-conjugated antibodies. Cells were acquired in a FACSCanto II, or LSRII Fortessa, or sorted in a FACSAria III, and analyzed with FLOWjo. Enrichment of thymocytes for iNKT cells was performed by staining total thymocytes with APC- or PE-conjugated CD1dPBS57 tetramers (NIH tetramer facility at Emory University), followed by anti-APC or anti-PE microbeads and subjected to MACS-based magnetic cell separation. Similarly, enrichment of thymocytes for MAIT cells was performed by staining with APC-conjugated MR1-OP-5RU tetramer (NIH tetramer facility at Emory University) for 1h at 25°C. Propidium iodide (PI) was included in all samples to exclude dead cells from the analysis. Pan-caspase staining was performed with the carboxyfluorescein (FAM)-FLICA in vitro Caspase Detection kit (ImmunoChemistry Technologies), according to the manufacturer’s instructions.
To calculate ST0 cell numbers, a small fraction of the thymus was stained with Tetramer, TCRβ, and CD24 prior to tetramer enrichment and analyzed by flow cytometry. From this staining, the total number of iNKT cells was calculated, as Tetr+TCRβ+ cells. Then, the number of ST0-ST3 cells was calculated according to the percentages in the enriched samples. Antibodies specific for the following antigens were purchased from BD Biosciences, eBiosciences, Biolegend and Cell Signaling Technology: CD127 (A7R34) CD4 (GK1.5), CD8α (53-6.7), TCRβ (H57-597), CD62L (MEL14), CD44 (IM7), CD24 (M1/69), IFN-γ (XMG1.2), IL-4 (11B11), IL-17A (eBio17B7), CD69 (H1.2F3), NK1.1 (PK136), CD45.1 (A20), CD45.2 (104), PLZF (R17-809), RORγt (AFKJS-9), T-BET (4B10), LEF1 (C12A5), PLZF (R17-809 or Mags.21F7), Ki67 (SolA15) and BCL-6 (K112-91). Intracellular staining for PLZF, RORγt, LEF1, BCL-6, EGR-2 and T-BET was performed using the Foxp3/Transcription Factor Staining Buffer Set (eBiosciences, 00-5523-00).
Cell culture, cytokine production and staining
Thymocytes were treated with 50 ng phorbol 12-myristate 13-acetate (PMA), 1 μg ionomycin and Brefeldin A for 4 h, before harvesting and staining intracellularly for IFN-γ, IL-4 and IL-17A using the eBiosciences IC kit (88-8824-00).
In vivo EDU incorporation
In vivo EDU incorporation assays were performed with ClickIT EDU Alexa Fluor 488 according to the manufacturer’s instructions (Molecular Probes, C10420).
RNA analysis and real-time quantitative (q)PCR
RNA was extracted from sorted thymocytes using the RNAeasy micro kit (QIAGEN 74004), DNAase-treated, and reverse-transcribed using Superscript III (Invitrogen). QPCR was performed with gene-specific primers in STEPOne (Applied Biosystems), using the FAST START Universal SYBR Green Master (Roche, 04913914001). Hprt was used to normalize expression. Relative expression was calculated using the ΔCT method.
RNA next-generation sequencing and data analysis
Total RNA for RNA-seq was isolated from sorted ST0 (Tetramer+TCRβ+CD24+CD44−) and ST1 (Tetramer+TCRβ+CD24−CD44−) cells with RNAeasy Micro Kit (Qiagen) according to manufacturer’s recommendations. Libraries were constructed with NuGEN’s Ovation Ultralow Library systems (NuGEN Technologies) and were subsequently subjected to 50–76 cycles of sequencing on a NextSeq500 (Illumina). RNA-seq analysis was performed with the Bioconductor package metaseqR, as previously described52. Differential gene expression analysis was performed with the DESeq algorithm. Genes presenting a DESeq P < 0.05 and fold change greater than 1.0 or less than −1.0 in log2 scale, corresponding to 2-fold up or down in natural scale respectively, were considered differentially expressed. Venn diagrams were generated by integrating the lists of differentially expressed genes with the Bioconductor package VennDiagram. Statistical significance of the overlaps was assessed with permutation tests with an estimated P-value after 10,000 resamplings. Heatmaps were drawn with the Bioconductor package heatmap2. Scatter plots were generated with the Bioconductor package ggplot2.
ATAC-seq analysis
For each ATAC-seq experiment, 10,000 Tetr+TCRβ+CD24+CD44− cells and 10,000 Tetr+TCRβ+CD24−CD44− cells from wild-type and Bcl6Δ/Δ thymocytes were sorted after magnetic bead-based tetramer enrichment. Mature iNKT cells were sorted as Tetr+TCRβ+CD24−CD44+NK1.1+. Cells were prepared for ATAC-seq with the Omni-ATAC protocol53. After transposition, samples were purified with the MinElute kit (QIAGEN, Cat No 28004) and were amplified with Nextera PCR primers and the NEBNext PCR MasterMix (NEB, Cat No 0541), for a total of 12-15 cycles. Libraries were purified with PCR Cleanup kit (QIAGEN, Cat No 28204), prior to next generation sequencing on an Illumina NextSeq 500.
Quality control of the generated 50-bp single-end reads was performed with the FastQC package. Reads were aligned to the mm10 genome build using bowtie2 with the “--local --very-sensitive-local” parameters54. Reads that mapped to chrM and other blacklisted regions were removed. Samtools55 were used to sort and isolate uniquely mapped reads and bedtools56 to remove duplicated reads. Peak calling was performed for each replicate, using MACS257 on the de-duplicated bam files, with the “--nomodel --shift −100 --extsize 200 --keep-dup all” parameters. Only overlapping peaks between the two replicates of each condition were kept and then were merged resulting in a reproducible peak set (one for each condition). Finally, an “overall” set of 43,317 peaks was generated by combining and merging the peak sets of the four conditions and was used as a reference peak set for the subsequent analysis.
ATAC-Seq read counting was performed with the DiffBind package (http://bioconductor.org/packages/release/bioc/vignettes/DiffBind/inst/doc/DiffBind.pdf) and differential accessibility analysis was performed with edgeR (P < 0.05). For these analyses, duplicated reads were considered, as it has been shown that their removal can reduce the detection power of differential analysis in highly abundant regions58. Only peaks with at least 10 reads in at least one of the replicates were kept for counting.
Peaks were assigned to genes according to their distance in a gene-centric manner. Therefore, each peak was assigned to its closest gene in a total 100 kb window distance from the TSS, while peaks located further were not assigned at all. Based on this peak annotation, differentially expressed genes between wilde-type ST0 and wild-type ST1 were further examined for the assignment of at least one differentially accessible peak between Bcl6Δ/Δ ST0 and wild-type ST0 (BCL-6—dependent regions). Statistical significance of the number of BCL-6—dependent genes was assessed with Monte Carlo simulations (P < 0.05). Specifically, a total population of expressed genes was generated by considering the expression levels of genes in wild-type cells from the RNA-seq experiment. Random subsets were derived from the total population, equal to the number of up-regulated or down-regulated genes accordingly, and their overlap with the differentially accessible genes was estimated. The expected value, which served as a background, was calculated as the average of all the overlap estimations, after 10,000 resamplings. P-value was estimated as the ratio of the number of occurrences that exceeded the experimental overlap estimation to the total population (10,000). Average genomic profiles and the relevant heatmaps were generated with the Bioconductor package recoup (https://www.bioconductor.org/packages/release/bioc/html/recoup.html), using the second replicate of all samples after down-sampling to the lowest library size. Specifically, the peaks of interest were split in 100 bins of dynamic length and for each bin, a normalized coverage per base-pair was estimated, resulting in 100 data points for each peak. The average value of each bin across all peaks was used for generating the coverage profile for each sample.
To determine whether there was an early opening of iNKT-related loci in ST0 cells, we compared ATAC-seq from iNKT cells and publicly available data for DP thymocytes (GSE107076). Differential accessibility analysis was performed (as mentioned before) using the overall peakset as reference genome. Average profile plots were generated for all samples after merging of the replicates and down-sampling to the lowest library size. Statistical difference between the coverage profiles of two samples was estimated with two-sample Kolmogorov-Smirnov test. Genome track views were generated with IGV.
Statistics and Reproducibility
A standard two-tailed unpaired t-test was used (unless otherwise stated) to determine the statistical probability of the differences observed between two populations of cells, using the GraphPad Prism software. Detailed information is provided in each figure legend.
Reporting Summary
Further information on research design is available in the Nature Research Reporting Summary linked to this article.
Data availability
RNA-seq and ATAC-seq data are deposited to the Gene Expression Omnibus, GSE134212. Source data for Figs 2-5 and 7-8, and Extended Data Figs 1-6 are provided with the paper. The data that support the findings of this study are available from the corresponding authors upon request.
Extended Data
Extended Data Fig. 1. Bcl6 mRNA expression in ST0 and ST1 cells.

a, Flow cytometry plots showing the sorting strategy and the purity of ST0 and ST1 cells after sorting. Shown one representative experiment out of three. b, Flow cytometry plots showing expression of PLZF, T-BET and RORγt in ST1 wild-type cells. Graphs show mean percentage and number ± SEM of the indicated populations. n=7 (PLZFhi, PLZFhiT-BET+, and PLZFloT-BET+), or n=3 (PLZFintRORγt+) independent experiments c, Graphs showing the normalized counts of Bcl6 mRNA in ST0 and ST1 cells based on RNA-seq data. n=3 independent experiments (DESeq, **P < 0.01). d, Flow cytometry plots showing the expression of BCL-6 and CD69 (left) or BCL-6 and EGR-2 (right) in Tetr+TCRβ+CD24+CD44− iNKT cells. Shown one representative experiment out of four (CD69) or two (EGR-2).
Extended Data Fig. 2. The iNKT phenotype is cell-intrinsic.

a, The indicated populations were FACS-sorted from Cd4Cre-expressing heterozygous Bcl6 floxed mice and DNA was submitted to PCR genotyping. In ST3 iNKT, CD4 and DP thymocytes only the germline Bcl6 allele was amplified, whereas in DN and tail samples, both the floxed and the germline alleles were amplified. One experiment shown out of one. b, Flow cytometry plots showing the percentage of iNKT cells in CD45.1+ (wild-type competitor) and CD45.2+ controls (Bcl6F/F) in the thymus from competitive BM chimeric mice. Graphs show the mean percentage ± SEM of iNKT cells in the indicated chimeric mice. n=5 independent experiments. c, Flow cytometry plots showing the percentage of iNKT cells in CD45.1+ (wild-type competitor) and CD45.2+ (Bcl6Δ/Δ) in the spleen from competitive BM chimeric mice. Graphs showing the mean percentage ± SEM of iNKT cells in the indicated chimeric mice. n=3 independent experiments. d, Flow cytometry plots showing the percent of Tetr+TCRβ+ iNKT cells after MACS enrichment in the indicated mice. These experiments were repeated twice with similar results. e,f, Flow cytometry plots showing the percent of ST0 (e) and ST1-3 (f) cells in CD45.1+ (competitor) and CD45.2+ control (Bcl6F/F) iNKT cells in competitive bone marrow chimeras. Graphs indicate the mean percentage ± SEM. n=3 (ST0) or n=4 (ST1-3) independent experiments. Statistical analysis was performed with two-tailed unpaired t-test. ** P < 0.01
Extended Data Fig. 3. Conventional T cell development is normal in the absence of BCL-6.

a, FACS plots showing the expression of CD4 and CD8 (upper panel), and TCRβ (lower panel) in total thymocytes from the indicated mouse strains. b, Histograms showing the total number of the indicated thymocyte populations in control and Bcl6Δ/Δ mice. Graphs show the mean ± SEM. n=5 independent experiments. c, Histograms showing the abundance of Tcra Vα14-Jα18 and Sh2d1a transcripts in control and Bcl6Δ/Δ sorted DP thymocytes. Graphs show the mean ± SEM. n=3 independent experiments. d, Histograms showing the expression of CD1D, CD150, and LY108 in DP thymocytes from control and Bcl6Δ/Δ mice. These experiments were repeated three times with identical results. Statistical analysis was performed with two-tailed unpaired t-test.
Extended Data Fig. 4. BCL-6–deficient spleens lack mature iNKT cells.

a, FACS plots of Tetr+TCRβ+ splenocytes showing the percentage of NKT1 (T-BET+PLZFlo), NKT2 (PLZFhiT-BET−) and NKT17 (RORγt+TBET−) cells in the indicated mouse strains. b, Cell number and percentage of NKT1, NKT2 and NKT17 cells in control and Bcl6Δ/Δ spleens. Graphs show mean ± SEM. n=5 (NKT1 and NKT2), or n=4 (NKT17) independent experiments. Statistical analysis was performed with two-tailed unpaired t-test. * P < 0.05, ** P < 0.01, *** P < 0.001. c, Histograms showing the fold reduction of Rorc mRNA in Bcl6Δ/Δ ST1 cells compared to wild-type, based on the RNA-seq data. n=3 independent experiments (DESeq, **P < 0.01).
Extended Data Fig. 5. Proliferation and apoptosis of immature iNKT cells is independent of BCL-6.
a, Graphs show the percentage of EDU+ and Ki67+ cells in ST0 and ST1 cells in control littermates and Bcl6Δ/Δ mice. Data represent mean ± SEM. n=3 independent experiments. b, FACS plots showing expression of IL-7 receptor and LEF1, in control littermates and Bcl6Δ/Δ mice. Experiments were repeated three times with identical results. c, Percentage of FLICA+ cells in the indicated iNKT cell stages, in control littermates and Bcl6Δ/Δ mice. Graphs show mean ± SEM. n=3 independent experiments with 3 (control) and 4 (Bcl6Δ/Δ) mice. d, Flow cytometry plots showing the percent of total iNKT thymocytes, as Tetramer+TCRβ+ cells, in 10-days old control littermates and Bcl6Δ/Δ mice. e, Numbers and percentage of iNKT cells in the indicated mouse strains. Graphs represent mean ± SEM. n=2 independent experiments with 5 control and 9 Bcl6Δ/Δ mice. * P < 0.05, ** P < 0.01, *** P < 0.001. Statistical analysis was performed with two-tailed unpaired t-test (a,e), or one-tailed unpaired t-test (c).
Extended Data Fig. 6. PLZF expression is reduced in the absence of BCL-6.

a, qPCR analysis showing the transcript levels of Zbtb16 in sorted ST0 and ST1 cells from control and Bcl6Δ/Δ mice. Graphs represent the mean ± SEM. n=3 independent experiments with 3-5 pooled thymi for each genotype. b, FACS plots showing the expression of PLZF protein in ST0 (upper panel) and ST1 (lower panel) cells from the indicated mouse strains. Graphs show the mean percentage ± SEM of PLZF+ cells in the indicated populations. n=5 (ST0) and n=8 (ST1) independent experiments. c, Graph showing the geometric MFI of PLZF expression in PLZF-expressing ST0 cells. Graphs represent the mean ± SEM. n=4 independent experiments. d, Histograms showing the expression of PLZF in ST2 and ST3 cells in the indicated mouse strains. Graphs show the mean percentage ± SEM of PLZF— cells. n=5 independent experiments. e, Histograms showing the expression of CD69 and CD5 in ST0 iNKT cells from the indicated mouse strains. The corresponding graphs show the mean geometric MFI ± SEM. n=3 independent experiments. * P < 0.05, ** P < 0.01, *** P < 0.001. Statistical analysis was performed with one-sample t-test (a), two-tailed unpaired t-test (b,d, and e) or two-tailed paired t-test (c).
Extended Data Fig. 7. Impaired progression from ST0 to ST1 in the absence of BCL-6.

a, GSEA analysis showing enrichment of NKT0-associated genes in ST0 cells, compared to ST1 cells. b, GSEA analysis showing enrichment of NKT17-associated genes in wild-type ST1 cells, compared to Bcl6Δ/Δ ST1 cells. c, GSEA analysis showing enrichment of NKT2-associated genes in Bcl6Δ/Δ ST1 cells, compared to wild-type ST1 cells. n=3 independent experiments. Normalized enrichment scores (NES) and FDR as implemented by GSEA, based on 1,000 permutations.
Extended Data Fig. 8. Chromatin accessibility profiles near genes that are developmentally regulated.

a, Genome track views of several loci of developmentally-regulated genes in the indicated populations from wild-type mice. b, Heatmaps showing aligned ATAC-seq reads around the center of peaks that are more accessible in ST1 cells (left), or in ST0 cells (right), in the indicated populations. c, Genome track views of Bach2 and Sell genes in wild-type and Bcl6Δ/Δ ST1 cells. d, Genome track views of several loci of developmentally-regulated genes in wild-type and Bcl6Δ/Δ ST0 cells.
Supplementary Material
Acknowledgements
This work was supported by a European Commission H2020-MSCA-IF grant (No 655271), and a Hellenic Foundation for Research and Innovation grant (No 486) to M.V., and grants from the National Institute of Allergy and Infectious Diseases (R56 AI104303 and R01 AI123396) to B.L.K. M.V. and P.M. were supported by a Stavros Niarchos Foundation start-up grant to BSRC Alexander Fleming (GRA-14451), as part of the Foundation’s initiative to support the Greek research ecosystem. M.S. was supported by Knut and Alice Wallenbergs Foundation and Cancerfonden. A.L.D. was supported by NIH 5R01 AI32771. This work was benefited by the project “Strategic Development of the Biomedical Research Institute Alexander Fleming” (MIS 5002562) to P.H., which was implemented under the “Action for the Strategic Development on the Research and Technological Sector”, funded by the Operational Programme “Competitiveness, Entrepreneurship and Innovation” (NSRF 2014-2020) and co-financed by Greece and the European Union. We thank A. Melnick (Weill Cornell Medicine) for advice, and C. Dagla, G. van der Voort, A. Rao, and L. Lenner for technical support. We also thank the InfrafrontierGR Infrastructure for providing mouse and flow cytometry facilities, BSRC Fleming Flow Facility, the University of Chicago Genomics Core Facility and the Cytometry and Antibodies Core Facility, The University of Chicago Comprehensive Cancer Center (P30 CA014599) and the NIH Tetramer Facility.
Footnotes
Competing interests
The authors declare no competing interests.
References
- 1.Verykokakis M & Kee BL Transcriptional and epigenetic regulation of innate-like T lymphocyte development. Curr Opin Immunol. 51, 39–45 (2018). [DOI] [PMC free article] [PubMed] [Google Scholar]
- 2.Bendelac A Savage PB & Teyton L The biology of NKT cells. Annu Rev Immunol. 25, 297–336 (2007). [DOI] [PubMed] [Google Scholar]
- 3.Griewank K et al. Homotypic interactions mediated by Slamf1 and Slamf6 receptors control NKT cell lineage development. Immunity. 27, 751–762 (2007). [DOI] [PMC free article] [PubMed] [Google Scholar]
- 4.Kovalovsky D et al. The BTB-zinc finger transcriptional regulator PLZF controls the development of invariant natural killer T cell effector functions. Nat Immunol. 9, 1055–1064 (2008). [DOI] [PMC free article] [PubMed] [Google Scholar]
- 5.Savage AK et al. The transcription factor PLZF directs the effector program of the NKT cell lineage. Immunity. 29, 391–403 (2008). [DOI] [PMC free article] [PubMed] [Google Scholar]
- 6.Kreslavsky T et al. TCR-inducible PLZF transcription factor required for innate phenotype of a subset of gammadelta T cells with restricted TCR diversity. Proc Natl Acad Sci U S A. 106, 12453–12458 (2009). [DOI] [PMC free article] [PubMed] [Google Scholar]
- 7.Verykokakis M et al. Inhibitor of DNA binding 3 limits development of murine slam-associated adaptor protein-dependent "innate" gammadelta T cells. PLoS One. 5, e9303 (2010). [DOI] [PMC free article] [PubMed] [Google Scholar]
- 8.Constantinides MG, McDonald BD, Verhoef PA & Bendelac A A committed precursor to innate lymphoid cells. Nature. 508, 397–401 (2014). [DOI] [PMC free article] [PubMed] [Google Scholar]
- 9.Lee YJ et al. Lineage-Specific Effector Signatures of Invariant NKT Cells Are Shared amongst γδ T, Innate Lymphoid, and Th Cells. J Immunol. 197, 1460–1470 (2016). [DOI] [PMC free article] [PubMed] [Google Scholar]
- 10.Benlagha K, Kyin T, Beavis A, Teyton L & Bendelac A A thymic precursor to the NK T cell lineage. Science. 296, 553–555 (2002). [DOI] [PubMed] [Google Scholar]
- 11.Benlagha K, Wei DG, Veiga J, Teyton L & Bendelac A Characterization of the early stages of thymic NKT cell development. J Exp Med. 202, 485–492 (2005). [DOI] [PMC free article] [PubMed] [Google Scholar]
- 12.Gadue P & Stein PL NK T cell precursors exhibit differential cytokine regulation and require Itk for efficient maturation. J Immunol. 169, 2397–2406 (2002). [DOI] [PubMed] [Google Scholar]
- 13.Dickgreber N et al. Immature murine NKT cells pass through a stage of developmentally programmed innate IL-4 secretion. J Leukoc Biol. 92, 999–1009 (2012). [DOI] [PMC free article] [PubMed] [Google Scholar]
- 14.Lee YJ, Holzapfel KL, Zhu J, Jameson SC & Hogquist KA Steady-state production of IL-4 modulates immunity in mouse strains and is determined by lineage diversity of iNKT cells. Nat Immunol. 14, 1146–1154 (2013). [DOI] [PMC free article] [PubMed] [Google Scholar]
- 15.D'Cruz LM, Yang CY & Goldrath AW Transcriptional regulation of NKT cell development and homeostasis. Curr Opin Immunol. 22, 199–205 (2010). [DOI] [PMC free article] [PubMed] [Google Scholar]
- 16.Tripathi S et al. Meta- and Orthogonal Integration of Influenza "OMICs" Data Defines a Role for UBR4 in Virus Budding. Cell Host Microbe. 18, 723–735 (2015). [DOI] [PMC free article] [PubMed] [Google Scholar]
- 17.Subramanian A et al. Gene set enrichment analysis: a knowledge-based approach for interpreting genome-wide expression profiles. Proc Natl Acad Sci U S A. 102, 15545–15550 (2005). [DOI] [PMC free article] [PubMed] [Google Scholar]
- 18.Mao AP et al. Multiple layers of transcriptional regulation by PLZF in NKT-cell development. Proc Natl Acad Sci U S A. 113, 7602–7607 (2016). [DOI] [PMC free article] [PubMed] [Google Scholar]
- 19.Krishnamoorthy V et al. The IRF4 Gene Regulatory Module Functions as a Read-Write Integrator to Dynamically Coordinate T Helper Cell Fate. Immunity. 47, 481–497.e487 (2017). [DOI] [PMC free article] [PubMed] [Google Scholar]
- 20.Engel I et al. Co-receptor choice by V alpha14i NKT cells is driven by Th-POK expression rather than avoidance of CD8-mediated negative selection. J Exp Med. 207, 1015–1029 (2010). [DOI] [PMC free article] [PubMed] [Google Scholar]
- 21.Engel I, Zhao M, Kappes D, Taniuchi I & Kronenberg M The transcription factor Th-POK negatively regulates Th17 differentiation in Vα14i NKT cells. Blood. 120, 4524–4532 (2012). [DOI] [PMC free article] [PubMed] [Google Scholar]
- 22.Enders A et al. ZBTB7B (Th-POK) regulates the development of IL-17-producing CD1d-restricted mouse NKT cells. J Immunol. 189, 5240–5249 (2012). [DOI] [PMC free article] [PubMed] [Google Scholar]
- 23.Verykokakis M et al. Essential Functions for ID Proteins at Multiple Checkpoints in Invariant NKT Cell Development. J Immunol.191, 5973–5983 (2013). [DOI] [PMC free article] [PubMed] [Google Scholar]
- 24.Roychoudhuri R et al. BACH2 represses effector programs to stabilize T(reg)-mediated immune homeostasis. Nature.498, 506–510 (2013). [DOI] [PMC free article] [PubMed] [Google Scholar]
- 25.Tsukumo S et al. Bach2 maintains T cells in a naive state by suppressing effector memory-related genes. Proc Natl Acad Sci U S A.110, 10735–10740 (2013). [DOI] [PMC free article] [PubMed] [Google Scholar]
- 26.Zook EC, Kee BL. Development of innate lymphoid cells. Nat Immunol. 17, 775–782 (2016). [DOI] [PubMed] [Google Scholar]
- 27.Hollister K et al. Insights into the role of Bcl6 in follicular Th cells using a new conditional mutant mouse model. J Immunol. 191, 3705–3711 (2013). [DOI] [PMC free article] [PubMed] [Google Scholar]
- 28.Mathew R et al. A negative feedback loop mediated by the Bcl6-cullin 3 complex limits Tfh cell differentiation. J Exp Med. 211, 1137–1151 (2014). [DOI] [PMC free article] [PubMed] [Google Scholar]
- 29.Carr T et al. The transcription factor lymphoid enhancer factor 1 controls invariant natural killer T cell expansion and Th2-type effector differentiation. J Exp Med.212, 793–807 (2015). [DOI] [PMC free article] [PubMed] [Google Scholar]
- 30.Engel I et al. Innate-like functions of natural killer T cell subsets result from highly divergent gene programs. Nat Immunol. 17, 728–739 (2016). [DOI] [PMC free article] [PubMed] [Google Scholar]
- 31.Hosoya T et al. Global dynamics of stage-specific transcription factor binding during thymocyte development. Sci Rep. 8, 5605 (2018). [DOI] [PMC free article] [PubMed] [Google Scholar]
- 32.Shih HY et al. Developmental Acquisition of Regulomes Underlies Innate Lymphoid Cell Functionality. Cell. 165, 1120–1133 (2016). [DOI] [PMC free article] [PubMed] [Google Scholar]
- 33.Mao AP, Ishizuka IE, Kasal DN, Mandal M & Bendelac A A shared Runx1-bound Zbtb16 enhancer directs innate and innate-like lymphoid lineage development. Nat Commun. 8, 863 (2017). [DOI] [PMC free article] [PubMed] [Google Scholar]
- 34.Chang PP et al. Identification of Bcl-6-dependent follicular helper NKT cells that provide cognate help for B cell responses. Nat Immunol. 13, 35–43 (2012). [DOI] [PubMed] [Google Scholar]
- 35.Lund R et al. Identification of genes involved in the initiation of human Th1 or Th2 cell commitment. Eur J Immunol. 35, 3307–3319 (2005). [DOI] [PubMed] [Google Scholar]
- 36.Fukuda T et al. The murine BCL6 gene is induced in activated lymphocytes as an immediate early gene. Oncogene. 11, 1657–1663 (1995). [PubMed] [Google Scholar]
- 37.DiToro D et al. Differential IL-2 expression defines developmental fates of follicular versus nonfollicular helper T cells. Science. 361, (6407):eaao2933 (2018). [DOI] [PMC free article] [PubMed] [Google Scholar]
- 38.Ichii H et al. Role for Bcl-6 in the generation and maintenance of memory CD8+ T cells. Nat Immunol. 3, 558–563 (2002). [DOI] [PubMed] [Google Scholar]
- 39.Ichii H et al. Bcl6 is essential for the generation of long-term memory CD4+ T cells. Int Immunol. 19, 427–433 (2007). [DOI] [PubMed] [Google Scholar]
- 40.Wu T, Ji Y, Moseman EA, et al. The TCF1-Bcl6 axis counteracts type I interferon to repress exhaustion and maintain T cell stemness. Sci Immunol. 1, (6):eaai8593 (2016). [DOI] [PMC free article] [PubMed] [Google Scholar]
- 41.Im SJ et al. Defining CD8+ T cells that provide the proliferative burst after PD-1 therapy. Nature. 537, 417–421 (2016). [DOI] [PMC free article] [PubMed] [Google Scholar]
- 42.Choi YS et al. Bcl6 expressing follicular helper CD4 T cells are fate committed early and have the capacity to form memory. J Immunol. 190, 4014–4026 (2013). [DOI] [PMC free article] [PubMed] [Google Scholar]
- 43.Bunting KL & Melnick AM New effector functions and regulatory mechanisms of BCL6 in normal and malignant lymphocytes. Curr Opin Immunol. 25, 339–346 (2013). [DOI] [PMC free article] [PubMed] [Google Scholar]
- 44.Huang C, Hatzi K & Melnick A Lineage-specific functions of Bcl-6 in immunity and inflammation are mediated by distinct biochemical mechanisms. Nat Immunol. 14, 380–388 (2013). [DOI] [PMC free article] [PubMed] [Google Scholar]
- 45.Huang C et al. The BCL6 RD2 domain governs commitment of activated B cells to form germinal centers. Cell Rep. 8, 1497–1508 (2014). [DOI] [PMC free article] [PubMed] [Google Scholar]
- 46.Liu X et al. Bcl6 expression specifies the T follicular helper cell program in vivo. J Exp Med. 209, 1841–1852, S1841-1824 (2012). [DOI] [PMC free article] [PubMed] [Google Scholar]
- 47.Liu X et al. Genome-wide Analysis Identifies Bcl6-Controlled Regulatory Networks during T Follicular Helper Cell Differentiation. Cell Rep. 14, 1735–1747 (2016). [DOI] [PMC free article] [PubMed] [Google Scholar]
- 48.Hatzi K et al. BCL6 orchestrates Tfh cell differentiation via multiple distinct mechanisms. J Exp Med. 212, 539–553 (2015). [DOI] [PMC free article] [PubMed] [Google Scholar]
- 49.Luckey CJ et al. Memory T and memory B cells share a transcriptional program of self-renewal with long-term hematopoietic stem cells. Proc Natl Acad Sci U S A. 103, 3304–3309 (2006). [DOI] [PMC free article] [PubMed] [Google Scholar]
- 50.Abbas AR, Wolslegel K, Seshasayee D, Modrusan Z & Clark HF Deconvolution of blood microarray data identifies cellular activation patterns in systemic lupus erythematosus. PLoS One. 4, e6098 (2009). [DOI] [PMC free article] [PubMed] [Google Scholar]
- 51.Verykokakis M, Boos MD, Bendelac A & Kee BL SAP protein-dependent natural killer T-like cells regulate the development of CD8(+) T cells with innate lymphocyte characteristics. Immunity. 33, 203–215 (2010). [DOI] [PMC free article] [PubMed] [Google Scholar]
- 52.Moulos P & Hatzis P Systematic integration of RNA-Seq statistical algorithms for accurate detection of differential gene expression patterns. Nucleic Acids Res. 43, e25 (2015). [DOI] [PMC free article] [PubMed] [Google Scholar]
- 53.Corces MR et al. An improved ATAC-seq protocol reduces background and enables interrogation of frozen tissues. Nat Methods. 14, 959–962 (2017). [DOI] [PMC free article] [PubMed] [Google Scholar]
- 54.Langmead B & Salzberg SL Fast gapped-read alignment with Bowtie 2. Nat Methods. 9, 357–359 (2012). [DOI] [PMC free article] [PubMed] [Google Scholar]
- 55.Li H et al. The Sequence Alignment/Map format and SAMtools. Bioinformatics. 25, 2078–2079 (2009). [DOI] [PMC free article] [PubMed] [Google Scholar]
- 56.Quinlan AR & Hall IM BEDTools: a flexible suite of utilities for comparing genomic features. Bioinformatics. 26, 841–842 (2010). [DOI] [PMC free article] [PubMed] [Google Scholar]
- 57.Zhang Y et al. Model-based analysis of ChIP-Seq (MACS). Genome Biol. 9:R137 (2008). [DOI] [PMC free article] [PubMed] [Google Scholar]
- 58.Lun AT & Smyth GK csaw: a Bioconductor package for differential binding analysis of ChIP-seq data using sliding windows. Nucleic Acids Res. 44, e45 (2016). [DOI] [PMC free article] [PubMed] [Google Scholar]
Associated Data
This section collects any data citations, data availability statements, or supplementary materials included in this article.
Supplementary Materials
Data Availability Statement
RNA-seq and ATAC-seq data are deposited to the Gene Expression Omnibus, GSE134212. Source data for Figs 2-5 and 7-8, and Extended Data Figs 1-6 are provided with the paper. The data that support the findings of this study are available from the corresponding authors upon request.