

Abstract
The full neutrophil heterogeneity and differentiation landscape remains incompletely characterized. Here we profiled >25,000 differentiating and mature mouse neutrophils using single-cell RNA sequencing to provide a comprehensive transcriptional landscape of neutrophil maturation, function, and fate decision in their steady state and during bacterial infection. Eight neutrophil populations were defined by distinct molecular signatures. The three mature peripheral blood neutrophil subsets arise from distinct maturing bone marrow neutrophil subsets. Driven by both known and uncharacterized transcription factors, neutrophils gradually acquire microbicidal capability as they traverse the transcriptional landscape, representing an evolved mechanism for fine-tuned regulation of an effective but balanced neutrophil response. Bacterial infection reprograms the genetic architecture of neutrophil populations, alters dynamic transition between each subpopulation, and primes neutrophils for augmented functionality without affecting overall heterogeneity. In summary, these data establish a reference model and general framework for studying neutrophil-related disease mechanisms, biomarkers, and therapeutic targets at single-cell resolution.
Keywords: Neutrophil, single-cell, transcriptome, granulopoiesis, heterogeneity, maturation, innate immunity infection
Introduction
Neutrophils migrate from the circulating blood to infected tissues in response to inflammatory stimuli, where they protect the host by phagocytosing, killing, and digesting bacterial and fungal pathogens1, 2. Neutrophil populations are not, however, homogenous1, 3, 4, 5, 6, 7, 8. Differentiation and maturation produce distinct neutrophil subpopulations which may be pre-programmed with different functions. Discrete microenvironments can modify neutrophil function and behavior. In addition, rapid neutrophil aging, their short lifespan, and mechanically-induced cellular responses as they enter and exit capillaries9, 10 also contribute to neutrophil heterogeneity. Neutrophil classification has traditionally relied on morphology, surface marker expression, or gradient separation, which while simple and robust do not capture the full neutrophil compartment repertoire. Some neutrophil subpopulations overlap, making nomenclature confusing and contributing to controversies regarding neutrophil function and ontogeny. In addition, the exact function of some neutrophil subpopulations and the molecular bases of heterogeneity are varied and remain elusive.
Single-cell RNA sequencing (scRNA-seq) is a powerful tool to explore immune cell heterogeneity11, 12. Here we adopt an unbiased, systematic approach to dissect mouse neutrophil populations in the BM, peripheral blood, and spleen at single-cell resolution. In doing so, we provide the first comprehensive reference map of differentiating and mature neutrophil transcriptional states in both healthy and E. coli-infected hosts.
Results
Mouse neutrophil atlas in the steady state
Gr1+ cells were isolated from the bone marrow (BM-Gr1), peripheral blood (PB-Gr1), and spleen (SP-Gr1) by FACS (Fig. 1a). To capture the whole spectrum of neutrophil maturation and identify potential neutrophil populations with lower Gr1 antigen (mainly Ly6G) expression, we also included Gr1low and a few Gr1− cells in each sample. In addition, due to the low abundance of HSPC, to gain insights into granulopoiesis in its entirety, we included a sample enriched for c-Kit+ BM HSPCs mixed with BM-Gr1 cells at a 2:3 ratio to artificially create a BM-cKit/Gr1 population. Using mixed cell population minimized the sample-to-sample variation (batch effect).
Figure 1. Single-cell RNA-seq analysis of steady-state bone marrow (BM), peripheral blood (PB), and spleen (SP) neutrophils.
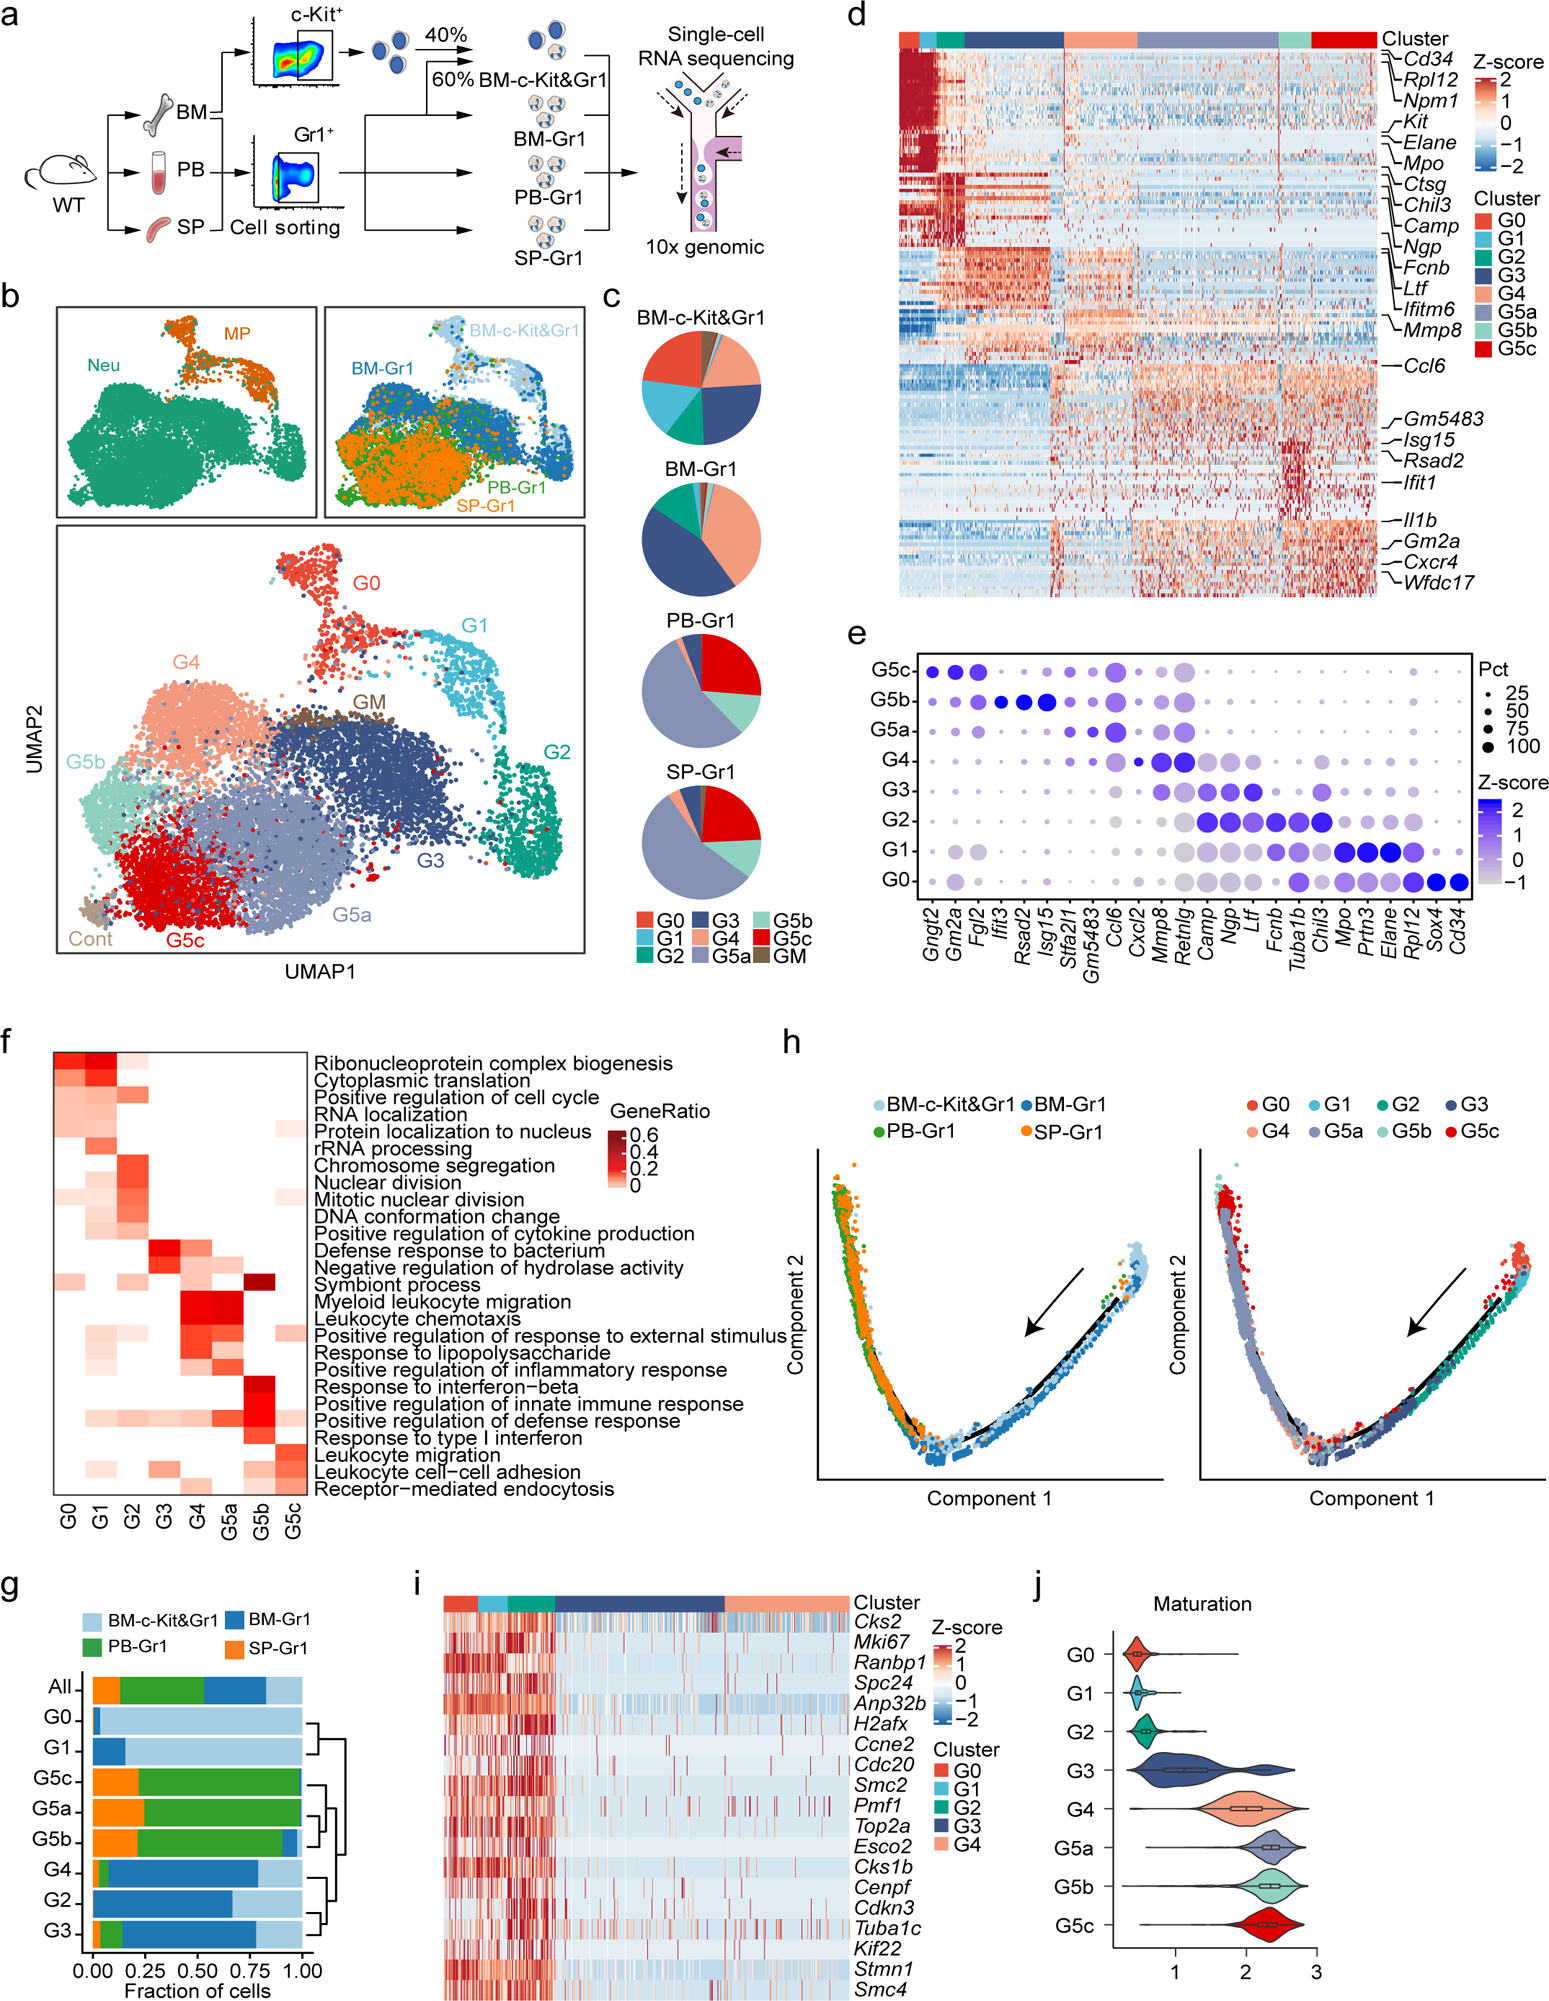
a, Overview of study design.
b, Uniform manifold approximation and projection (UMAP) of 12,285 neutrophils from BM, PB, and SP colored by cell type, sample origin, and inferred cluster identity, respectively. MP: myeloid progenitors. Cont: the contaminating population mainly consisted of low-quality cells so was discarded from further analysis. GM: low-quality G3-like cells (low UMI count per cell, low UMI count per gene, and high percentage of mitochondrial UMI counts). Similarly, unless otherwise stated, GM were excluded from all other downstream analyses.
c, Proportions of the nine neutrophil clusters in four samples.
d, Heatmap showing row-scaled expression of the 20 highest differentially expressed genes (DEGs, Bonferroni-corrected P-values < 0.05, Student’s t-test) per cluster for all neutrophils except cells from the GM population.
e, Dot plot showing scaled expression of selected signature genes for each cluster colored by average expression of each gene in each cluster scaled across all clusters. Dot size represents the percentage of cells in each cluster with more than one read of the corresponding gene.
f, Gene ontology (GO) analysis of DEGs for each cluster. Selected GO terms with Benjamini-Hochberg-corrected P-values < 0.05 (one-sided Fisher’s exact test) are shown and colored by gene ratio.
g, Unsupervised hierarchical clustering of the eight clusters based on the average gene expression of cells in each cluster. For each neutrophil subpopulation, the proportion of cells from indicated BM, PB, or SP samples was calculated and presented.
h, Monocle trajectories of neutrophils colored by sample origin (left) and cluster identity (right). Each dot represents a single cell. Cell orders are inferred from the expression of the most variable genes across all cells. Trajectory directions were determined by biological prior.
i, Heatmap showing row-scaled expression of cell cycle-related genes for G0-G4 neutrophils.
j, Violin plot of maturation scores for each cluster.
After rigorous quality control (Extended Data Fig. 1a–d), we obtain 19,582 high-quality cells with average 1,241 genes per cell profiled, resulting in a total of 18,269 mouse genes detected in all cells (Extended Data Fig. 1e and Supplementary Table 1). Unbiased, graph-based clustering identified seven major cell populations (Extended Data Fig. 1f–h and Supplementary Table 2). To dissect neutrophil heterogeneity, we examined the neutrophil-related populations (Myeloid progenitors (MPs) and neutrophils). Unsupervised clustering partitioned differentiating and mature neutrophils into eight clusters (G0–4; G5a-c; Fig. 1b). G0–4 mainly originated from the BM and represented neutrophils differentiating in the BM, while G5a-c mainly originated from peripheral tissue samples (Fig. 1c). There was substantial differential gene expression between the groups (Fig. 1d and Supplementary Table 3). For quality assurance, we merged our raw data with another high-quality published dataset13 (Extended Data Fig. 1i–j), which agreed with our data well, our data detecting even greater numbers of genes (Extended Data Fig. 1j). We identified 2,922 differentially-expressed genes (DEGs) and 24 signature genes that distinguished each subpopulation (Fig. 1e). In a gene ontology analysis of DEGs (Fig. 1f), cell cycle-related genes were as expected highly expressed in earlier phases of neutrophil maturation (G0, G1, and G2).
Neutrophil differentiation and maturation trajectories
According to known gene signatures14, 15, 16, 17, we concluded that the G0 population mainly consisted of GMPs expressing typical genes such as Cd117 (Kit), Cd34, and Sox4 and neutrophil primary granule genes (Fig. 1e). We also conducted hierarchical clustering (Fig. 1g). Consistent with UMAP clustering, neutrophils in the PB (G5a, G5b, and G5c) were closely associated but more remote from BM G1–4 cells. Using Monocle18 to place differentiating neutrophil populations along possible granulopoiesis trajectories in pseudo-time, neutrophil differentiation and maturation occurred on a tightly organized trajectory, starting from G1 cells in the BM and ending with G5 cells in the PB and the spleen (Fig. 1h). G1 to G2 cells underwent active proliferation, with cell division stopping abruptly thereafter (Fig. 1i). A cluster of G3 cells followed G2 expansion and expressed secondary granule genes such as Ltf, Camp, and Ngp (Fig. 1e). Neutrophil differentiation in the BM concluded with a more mature G4 population highly expressing Mmp8, a key granule protein for neutrophil-mediated host defenses, and Cxcl2 which is important for neutrophil mobilization19 (Fig. 1d–e). We measured the maturation score of each differentiating neutrophil population based on the expression of genes related to neutrophil differentiation and maturation (Supplementary Table 4). G5 cells, which accounted for the majority of neutrophils in the peripheral tissues, were the most mature neutrophils, while G4 cells showed the highest maturation score among BM maturating (G0 to G4) neutrophils (Fig. 1j).
A “sorting mechanism” for generating heterogeneous neutrophil granules
A well-accepted mechanism explaining neutrophil granule heterogeneity is “targeting by timing of biosynthesis”20, 21, i.e., granule proteins synthesized at the same time in developing neutrophils will end up in the same granule without granule type-specific sorting. We examined the expression of various granule genes in differentiating neutrophils (Fig. 2a–c). Lactoferrin-positive granules are often defined as specific (secondary) granules, while lactoferrin-negative but gelatinase-positive granules are known as gelatinase (tertiary) granules. As expected, Camp, the gene for a major antibacterial specific granule protein CAP-1822, was expressed in G2 and G3 cells when specific granules were formed. Surprisingly, this gene, whose product is not in the tertiary granules and secretary vesicles, was also expressed in G4 neutrophils containing tertiary granules and secretary vesicles. Such inconsistency was also observed for Lcn2 and Mmp8. Granule proteins belong to a subset of proteins for which RNA expression dropped during differentiation while protein expression remained similar. This may be indicative of protein storage or sequestration in various granules23. Alternative, “targeting by timing of biosynthesis” may not explain all granule heterogeneity, and some granule proteins may in fact be tagged to direct them to particular granules.
Figure 2. (a-f) Transcriptional landscape of neutrophils along differentiation and maturation trajectories.
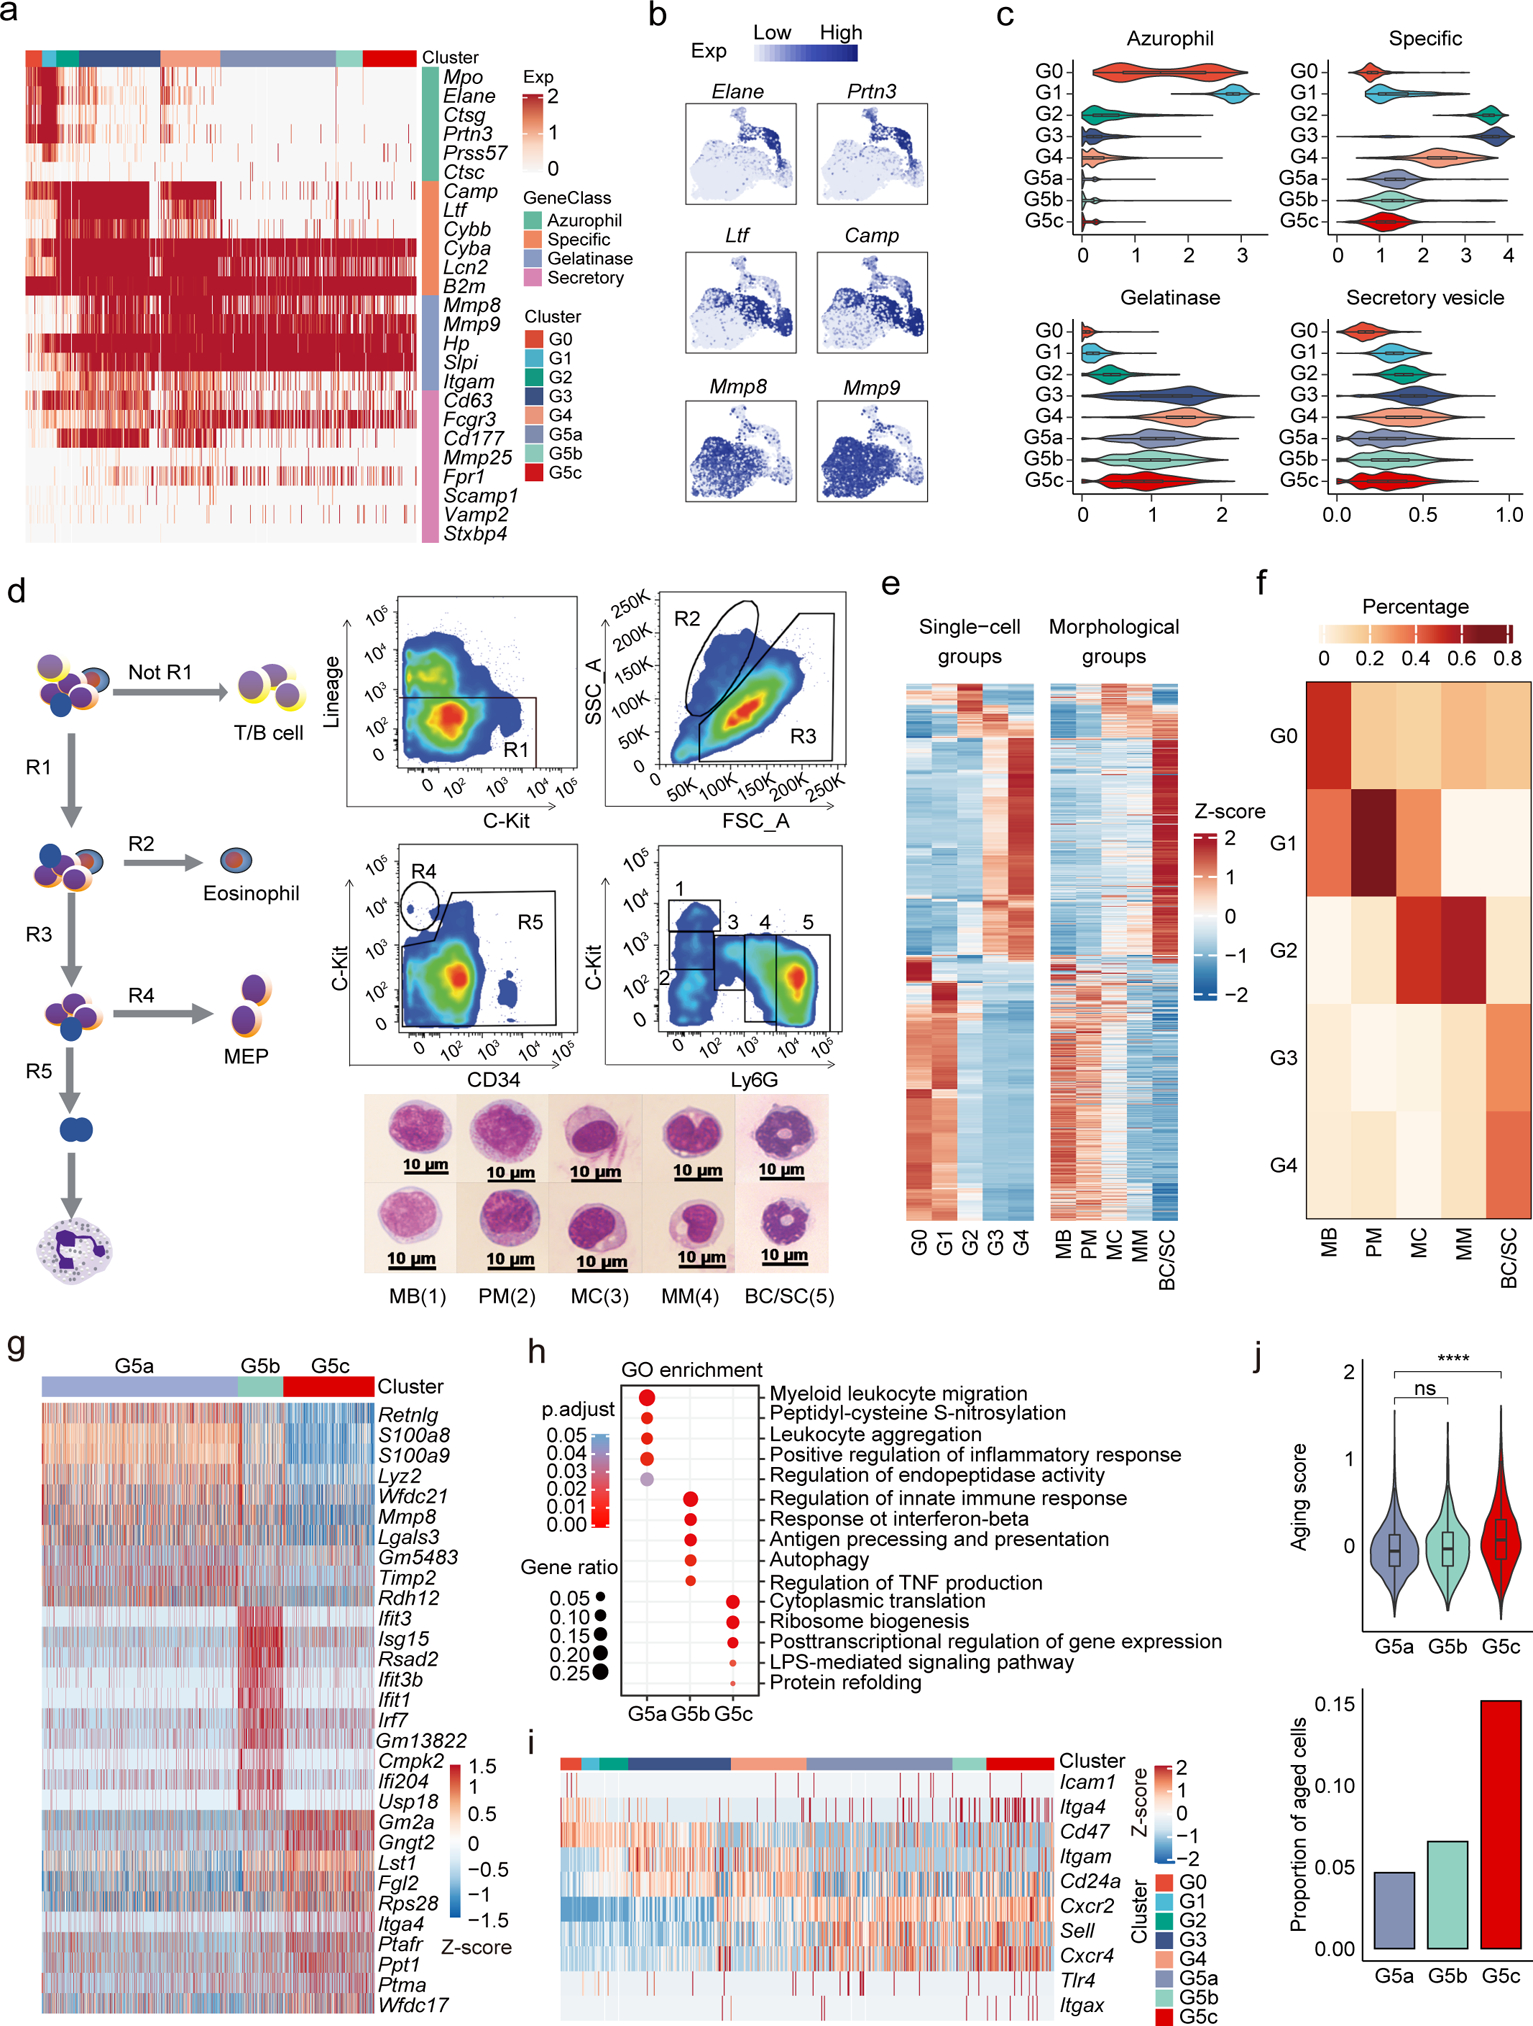
a, Heatmap showing expression of neutrophil granule-related genes for all neutrophils.
b, Expression of six typical neutrophil granule genes.
c, Violin plots of azurophil score, specific score, gelatinase score, and secretory score for each cluster.
(d-f) scRNA-seq-defined differentiating neutrophil populations correlated with classical morphology-defined neutrophil subpopulations.
d, FACS sorting and staining of five mouse BM neutrophil populations for bulk sequencing. Left: Gating diagram. R1 (CD4− CD8a−CD45R/B220−Ter119−) was selected, R2 (eosinophil) and R4 (MEP) were excluded, and remaining R5 (neutrophils) were selected. Top right: Same R1-R5 from (left) but showing FACS gating of five detailed neutrophil subpopulations and the morphology of the sorted cells, among which: 1 was c-KithiLy6Gneg (MB); 2 was c-KitintLy6Gneg (PM); 3 was c-KitnegLy6Glow (MC); 4 was c-KitnegLy6Gint (MM), and 5 was c-Kit−Ly6Ghi (BC/SC). Bottom right: Representative Wright-Giemsa staining of these populations (scale bar represents 10 μm); Data are representative of three independent experiments.
e, Heatmaps showing row-scaled expression of scRNA-seq-defined DEGs across averaged single-cell groups (left) and morphological groups (right). Only genes detected in both scRNA-seq data and bulk RNA-seq data are visualized.
f, Coefficient matrix showing deconvolution results of morphological bulk profiles. The 20 highest DEGs per single-cell group were selected as signatures for deconvolution. Each column is normalized by column sums.
(g-h) Transcriptional landscape of mature neutrophils in the peripheral blood and spleen.
g, Heatmap showing row-scaled expression of the ten highest DEGs per cluster for G5a, G5b, and G5c neutrophils.
h, Gene ontology (GO) analysis of DEGs for each of the three G5 clusters. Selected GO terms with Benjamini-Hochberg-corrected P-values < 0.05 (one-sided Fisher’s exact test) are shown.
(i-j) Expression of neutrophil aging signatures.
i, Heatmap showing row-scaled expression of aging-related genes for all neutrophils.
j, Top: Violin plot of aging score defined as weighted average Z-scores of aging-related genes for the three G5 clusters. Bottom: Proportions of aged cells in each G5 clusters.
scRNA-seq-morphology correlates
Neutrophil maturation typically follows five main morphological stages: myeloblasts (MBs), promyelocytes (PMs), myelocytes (MCs), metamyelocytes (MMs), band neutrophils and segmented neutrophils (BC/SCs)20. We compared scRNA-seq-defined neutrophil populations with the classic morphology-defined neutrophils which were isolated by FACS based on c-Kit and Ly6G expression24 and bulk-sequenced (Fig. 2d). Most of the molecular signatures identified by scRNA-seq were also detected in bulk RNA-seq data (Fig. 2e and Supplementary Fig. 1a). To further dissect morphological heterogeneity, a regression-based deconvolution approach was applied on bulk expression profiles. MB were a mixture of G0/G1, PM were G1, MC were G1/G2, MM were G2, and BC/SC were G3/G4 (Fig. 2f and Supplementary Fig. 1a–c).
Correlation with previously defined neutrophil subpopulations
Previous studies revealed a variety of distinct neutrophil subpopulations arising during differentiation and maturation. Olsson et al.25 performed scRNA-seq on stem/multipotent progenitor cells (LSK), common myeloid progenitor (CMP) cells, GMP cells, and LK CD34+ cells (lin−c-Kit+CD34+) that included granulocytic precursors. We calculated the fraction of each scRNA-seq defined neutrophil subpopulation in these four samples and revealed that LSK and CMP cells exhibited a gene expression profile matching that of G0 cells. Importantly, G1 neutrophils started to appear in GMP population. LK CD34+ myeloid progenitor precursor population contained a significant number (~20%) of G2 neutrophils (Extended Data Fig. 2a). We also correlated our scRNA-seq defined neutrophil populations with the neutrophil subtypes reported by Evrard et al.26. Regression-based deconvolution analysis showed that the therein identified pre-neutrophils (pre-Neu), CXCR2lo immature neutrophils (im-Neu), and CXCR2high mature neutrophils (m-Neu) were correlated with the G2, G3, and G4 neutrophils, respectively (Extended Data Fig. 2b). Next, we compared the C1 and C2 cells defined by Zhu et al.27 with the neutrophil subpopulations identified in our study. The result suggested C1 to be a mixture of G0/G1 and C2 to be G2/G3 (Extended Data Fig. 2c-d). Notably, in an earlier study, Kim et al. also defined a population of proliferative late-stage neutrophil precursors (NeuP) in the BM characterized by a lin−cKit+CD11b+Ly6GloLy6BintCD115−Gfi1+ signature28 that should be located in the G1/G2 population. It was later found that this NeuP population was highly heterogeneous and contained other myeloid progenitors (G0 cells)27. Furthermore, we examined the correlation of scRNA-seq defined neutrophil populations with the Stage I and Stage II neutrophils defined by Giladi et al.13 and revealed that Stage I neutrophils were mainly G2-G4 cells while Stage II neutrophils were a mixture of G4 and G5 cells (Extended Data Fig. 2e–f). Finally, a population of committed neutrophil progenitors (proNeu) was proposed6. Recently, Muench et al.29 and Kwok et al.30 (Lai Guan NG, personnel communication) independently characterized this population. We compared the neutrophil subpopulations identified in our study with the proNeu population and found that proNeu perfectly correlated with G1 neutrophils (Extended Data Fig. 2g–h).
The PB and spleen contain three distinct neutrophil subpopulations
Three major neutrophil subpopulations were identified in the PB and spleen with 172 DEGs (Supplementary Table 3, Fig. 2g). Similar to G4 BM cells, G5a cells highly expressed Mmp8 and S100a8 (Fig. 2g) and genes related to neutrophil migration and inflammatory responses (Fig. 2h). Interestingly, a group of G5b neutrophils expressed a set of interferon-stimulated genes (ISGs) such as Ifit3 and Isg15 (Extended Data Fig. 3a). Trajectory analysis showed that G5a and G5b neutrophils gradually developed into G5c neutrophils (Extended Data Fig. 3b) the latter showing the highest aging score (Fig. 2i–j). By applying a two-component Gaussian mixture model, we further identified 15% of G5c neutrophils as aged, significantly higher than in G5b or G5a populations (Fig. 2j). Although G5c cells appeared to more aged, the mitochondrial UMI percentage was not elevated in G5c cells, indicating continued viability in the PB and spleen (Extended Data Fig. 3c). Noticeably, the initial cell clustering was performed from a mixture of cKit+ BM HSPCs and Gr1+ neutrophils from the BM, SP and PB. Clustering of circulating (PB) neutrophils only gave rise to the same three G5 clusters (Supplementary Fig. 2a–b).
Experimental isolation of neutrophil subsets
scRNA-seq defined BM differentiating neutrophil populations (G0-G4) tightly correlated with the morphology-defined neutrophil subpopulations (Fig. 2f). Based on this correlation, we were able to identify and sort G1 and G2 neutrophils in the BM (Fig. 3a). To separate G3 and G4, we added another surface marker CXCR2 which was more highly expressed on G4 cells (Fig. 3b). The proportions of G1-G4 neutrophils in the BM measured by FACS analysis (Fig. 3c) fit well with those calculated based on the scRNA-seq data (Fig. 1c).
Figure 3. Analysis of neutrophil subpopulations by flow cytometry.
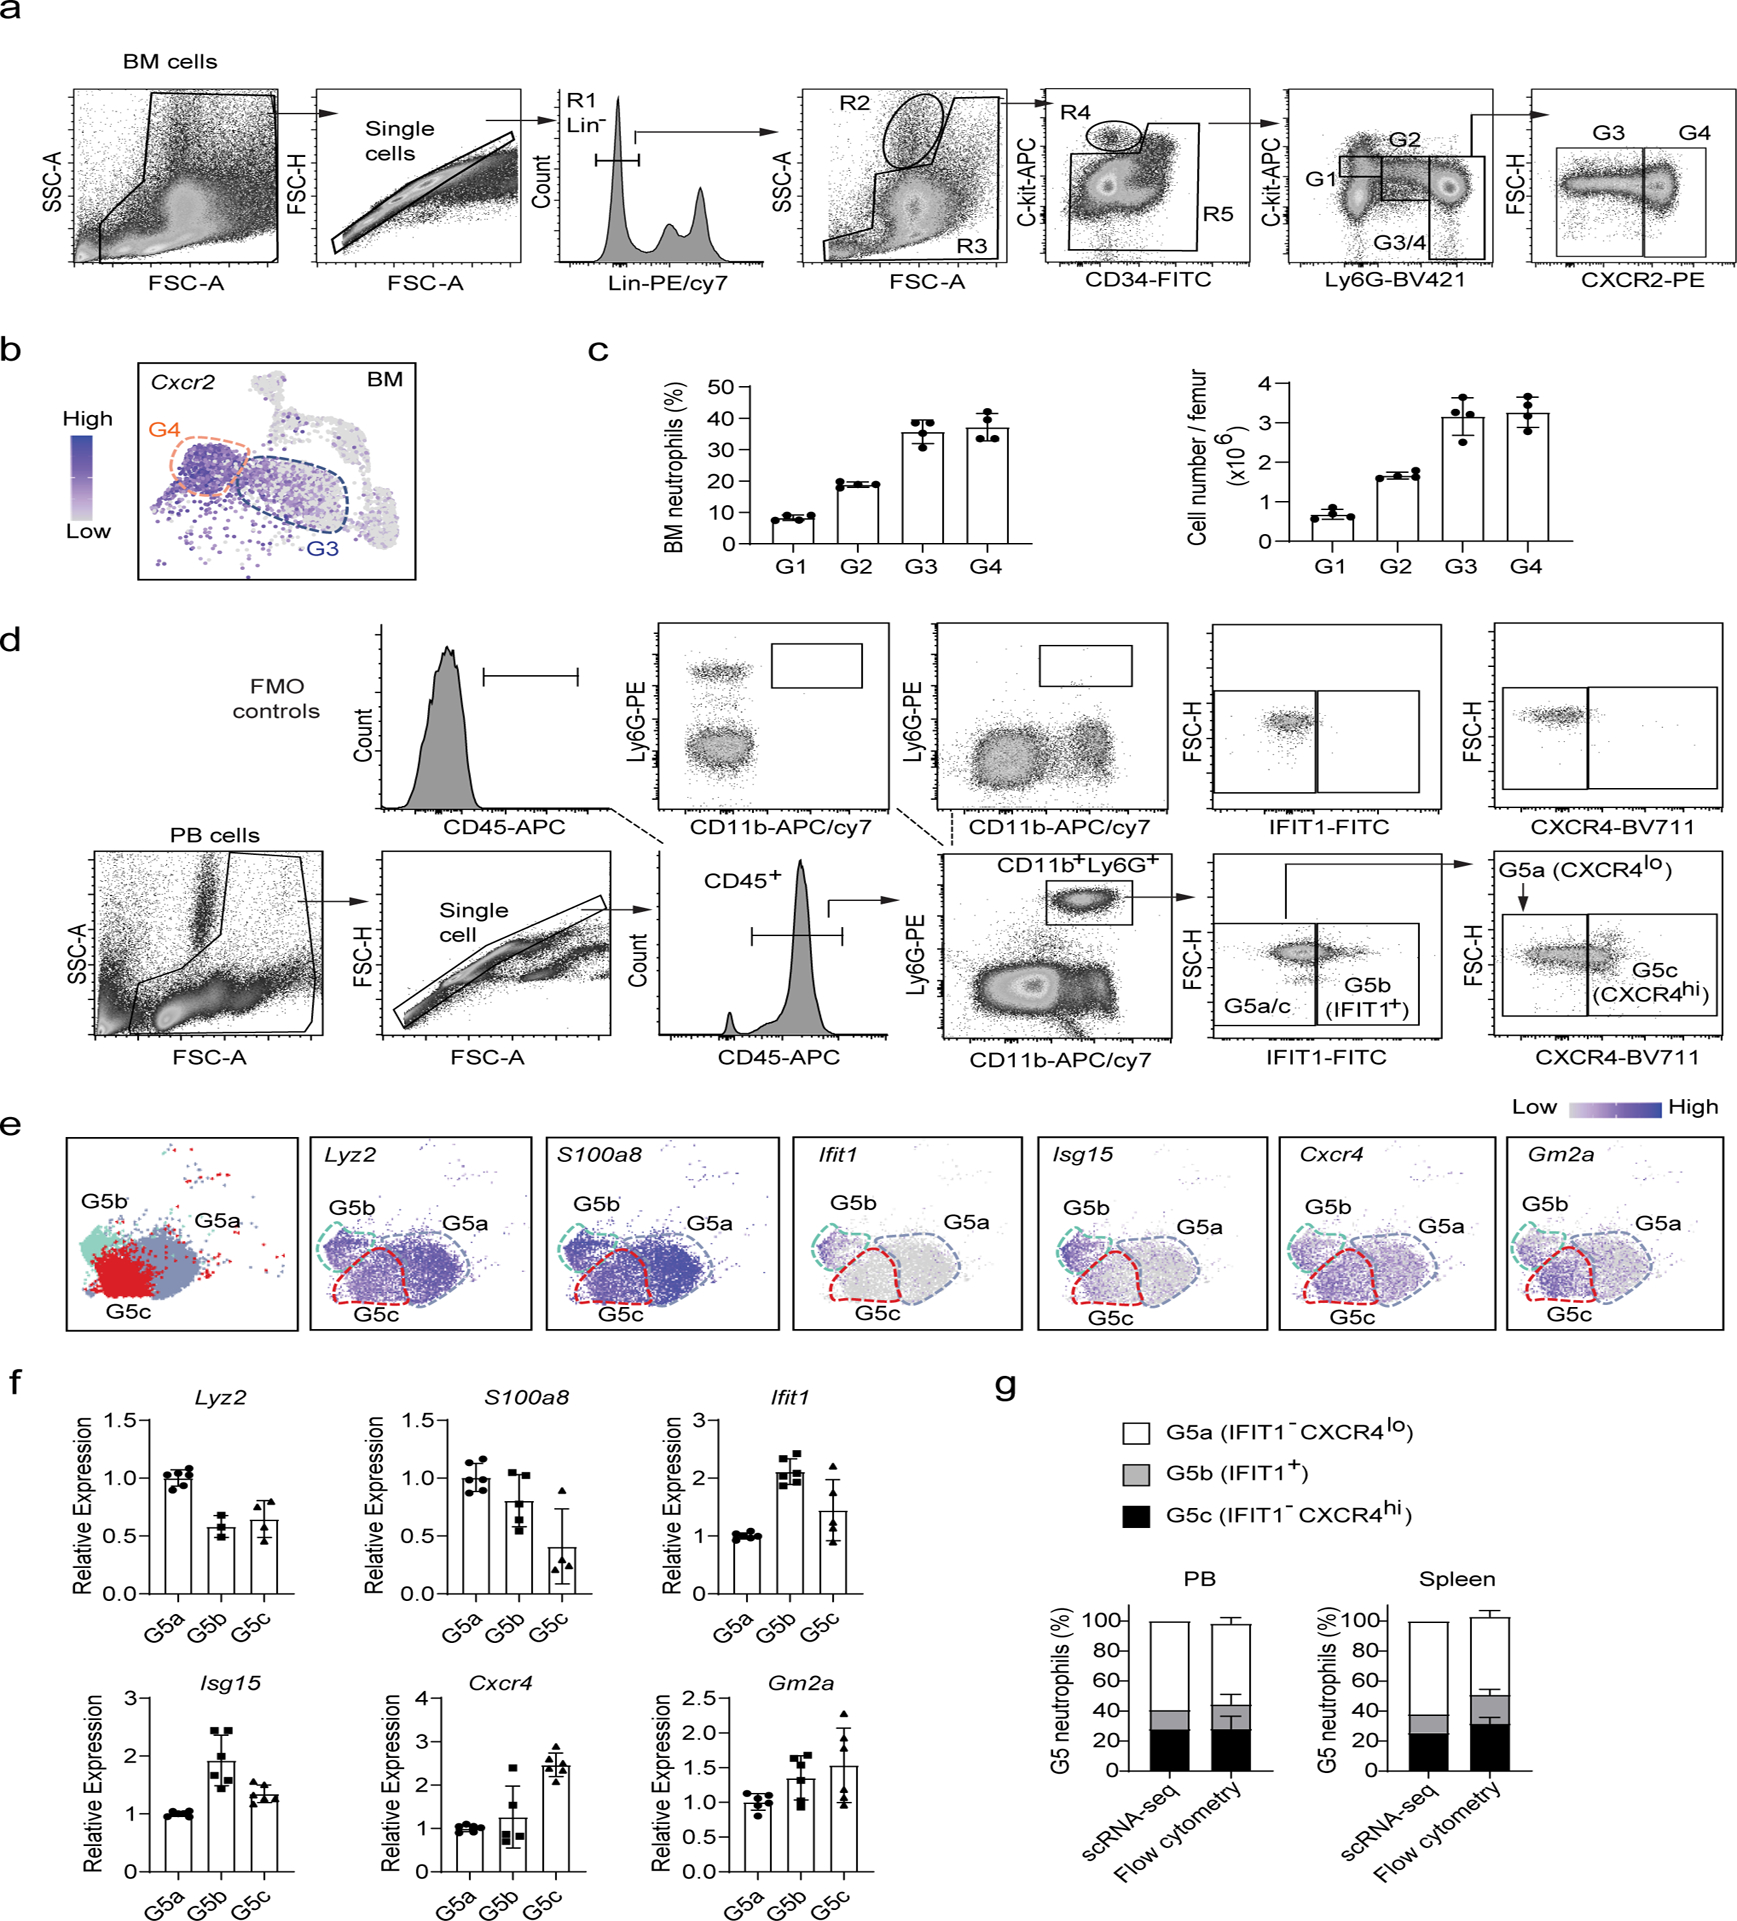
(a-c) Separation of bone marrow maturating G1-G4 neutrophils.
a, FACS and staining strategy. The experiments were conducted as described in Fig. 2d. Data are representative of two independent experiments
b, Expression pattern of the gene Cxcr2 projected on the UMAP plot. Only bone morrow cells are shown.
c, Percentage and absolute number of different neutrophil populations in the bone marrow. Data represent mean ± SD (n= 4 mice) of two independent experiments.
(d-f) Separation of G5a, G5b and G5c neutrophils by flow cytometry.
d, FACS and staining strategy for peripheral blood G5a (IFIT1−CXCR4lo), G5b (IFIT1+) and G5c (IFIT1− CXCR4hi) neutrophils. Fluorescence minus one (FMO) controls were used to control for spillover-related contribution to background in each channel.
e, Left: UMAP plot of G5a, G5b and G5c neutrophils colored by cluster identity. Right: Expression pattern of the marker genes of G5a (Lyz2 and S100a8), G5b (Ifit1 and Isg15), and G5c (Cxcr4 and Gm2a) projected on the UMAP plot.
f, Relative mRNA expression of the 6 marker genes in sorted peripheral blood G5a, G5b and G5c neutrophils measured by qRT-PCR. Data represent mean ± SD (n=15 mice) of two independent experiments.
g, Comparation of FACS and scRNA-seq-based analyses of G5 subpopulations in the peripheral blood and spleen. The scRNA-seq-based percentages of each G5 subpopulation were derived from Fig. 1c. FACS-based measurement was conducted as described in (D). Data represent mean ± SD (n=3–6 mice) of two independent experiments.
We isolated PB G5b cells based on their expression of IFIT1 (Fig. 3d). G5c cells are relatively aged neutrophils with high surface expression of CXCR4 and thus were isolated as IFIT1−CXCR4hi neutrophils by FACS sorting, while G5a cells were identified as IFIT1−CXCR4lo neutrophils (Fig. 3d). The identity of the sorted G5a, G5b, and G5c neutrophils was confirmed by measuring the expression of distinct signature genes (Fig. 3e–f). Using this approach, we calculated the percentage of each G5 subpopulation in the PB and SP. The result was consistent with that derived from the scRNA-seq analysis (Fig. 3g).
The pathogen clearance machinery is continuously and gradually built during neutrophil differentiation, maturation, and aging
Phagocytosis, chemotaxis, and neutrophil activation scores increased drastically during the early stages of granulopoiesis, peaked at G3, and remained relatively stable thereafter (Extended Data Fig. 4a–c). Similarly, “NADPH oxidase score” increased during G0 to G1 and G2 transition, peaked at G3, and then decreased by 20% in mature neutrophils (Extended Data Fig. 4d). However, the dynamics of the oxidase complex subunits varied through neutrophil differentiation (Extended Data Fig. 4e). Sequential subunit expression ensures maximal stimulation-triggered NADPH oxidase activation at the later stages of neutrophil maturation and minimal activation in immature neutrophils in the BM. Notably, genes related to mitochondria-mediated ROS production were significantly downregulated during neutrophil maturation, further supporting that neutrophil ROS production is mainly mediated by phagocytic NADPH oxidase (Extended Data Fig. 4f).
Mature neutrophils derive energy mainly from glycolysis31. However, metabolism-related genes (Extended Data Fig. 4g), including those related to glycolysis (Extended Data Fig. 4h) were downregulated in mature neutrophils. Similarly, genes related to glucose transportation were also not upregulated in mature neutrophils (Extended Data Fig. 4i). These data suggest that glycolysis-dominant metabolism in neutrophils is likely to be driven by post-transcriptional or/and post-translational mechanisms rather than transcriptional upregulation of related genes.
Organ-specific transcriptome features
Compared to early-stage maturing BM neutrophils, most neutrophils in the PB and SP were mature G5 cells with similar gene expression patterns (Extended Data Fig. 5a). KEGG enrichment analysis revealed PB neutrophils were enriched for genes related to malaria and African trypanosomiasis, while SP neutrophils were more enriched for genes related to leishmaniasis and Yersinia infection, suggesting that PB and SP neutrophils may play distinct roles in combating different infections (Extended Data Fig. 5a–b). SP neutrophils also expressed T cell differentiation, IL-17 signaling, TNF signaling, and antigen processing and presentation-related genes, suggesting a role for splenic neutrophils in adaptive immunity. Under homeostatic condition, more than 98% neutrophils (about 200 million) stored in the BM32, 33. Although the percentage of G5 neutrophils in the BM was significantly lower (Fig. 1c and Extended Data Fig. 5c), their absolute number was comparable or even higher than that was in the PB or SP (Extended Data Fig. 5d). Compared to their counterparts in the PB and SP, BM G5a and G5c neutrophils preferentially expressed genes related to cell migration, chemotaxis, adhesion, and antimicrobial peptides (Extended Data Fig. 5e–h). PB and SP G5 neutrophils displayed higher maturation and apoptosis scores than BM G5 neutrophils (Extended Data Fig. 5i–j). These results suggest that although the identity of each neutrophil subpopulation is determined by programed expression of distinct signature genes, the organ-specific microenvironment also plays a significant role in driving transcription in each subpopulation.
Unexpected complexity in neutrophil mobilization
Next, we traced cell fate and reconstructed cell lineage direction using the recently developed RNA ‘velocity’ approach34 (Fig. 4a and Supplementary Fig. 3). Consistent with Monocle (Fig. 1h), BM maturation (from G2 to G4) followed a single main branch without significant division, with G3 bearing long vectors and indicating a strong tendency to progress to G4 (Fig. 4a and Supplementary Fig. 3). G5c cells were firmly at the end of neutrophil maturation and differentiation, showing the highest apoptosis scores (Fig. 4b) and proportion of apoptotic cells (~20%; Fig. 4c) among the most mature G5 population. There was also significant apoptosis in G5a and G5b cells (Fig. 4c), suggesting that death programs can be independent of maturation. We next performed velocity analysis using only G3 to G5 subsets and the cells in different compartments were presented separately to accurately assess their relationship with other cell populations and/or cells in other compartments (Supplementary Fig. 4). Interestingly, the trajectory of a significant number of G3 neutrophils was toward the peripheral G5a population, suggesting mobilization of G3 cells to the PB or tissue without first undergoing full G4 maturation (Supplementary Fig. 4). BM G4 population split into: (i) the peripheral G5a population, and (ii) the ISG-related G5b population without entering the G5a stage. Thus, although G5a and G5b were most similar (Fig. 1g), they are two separate and independent PB neutrophil populations, with G5a derived from BM G3 and G4 cells and G5b derived solely from G4 cells. G5a to G5b conversion was rarely detected in the PB (Fig. 4a and Supplementary Fig. 4).
Figure 4. (a-d) The origin and inter-relationship of neutrophil subpopulations.
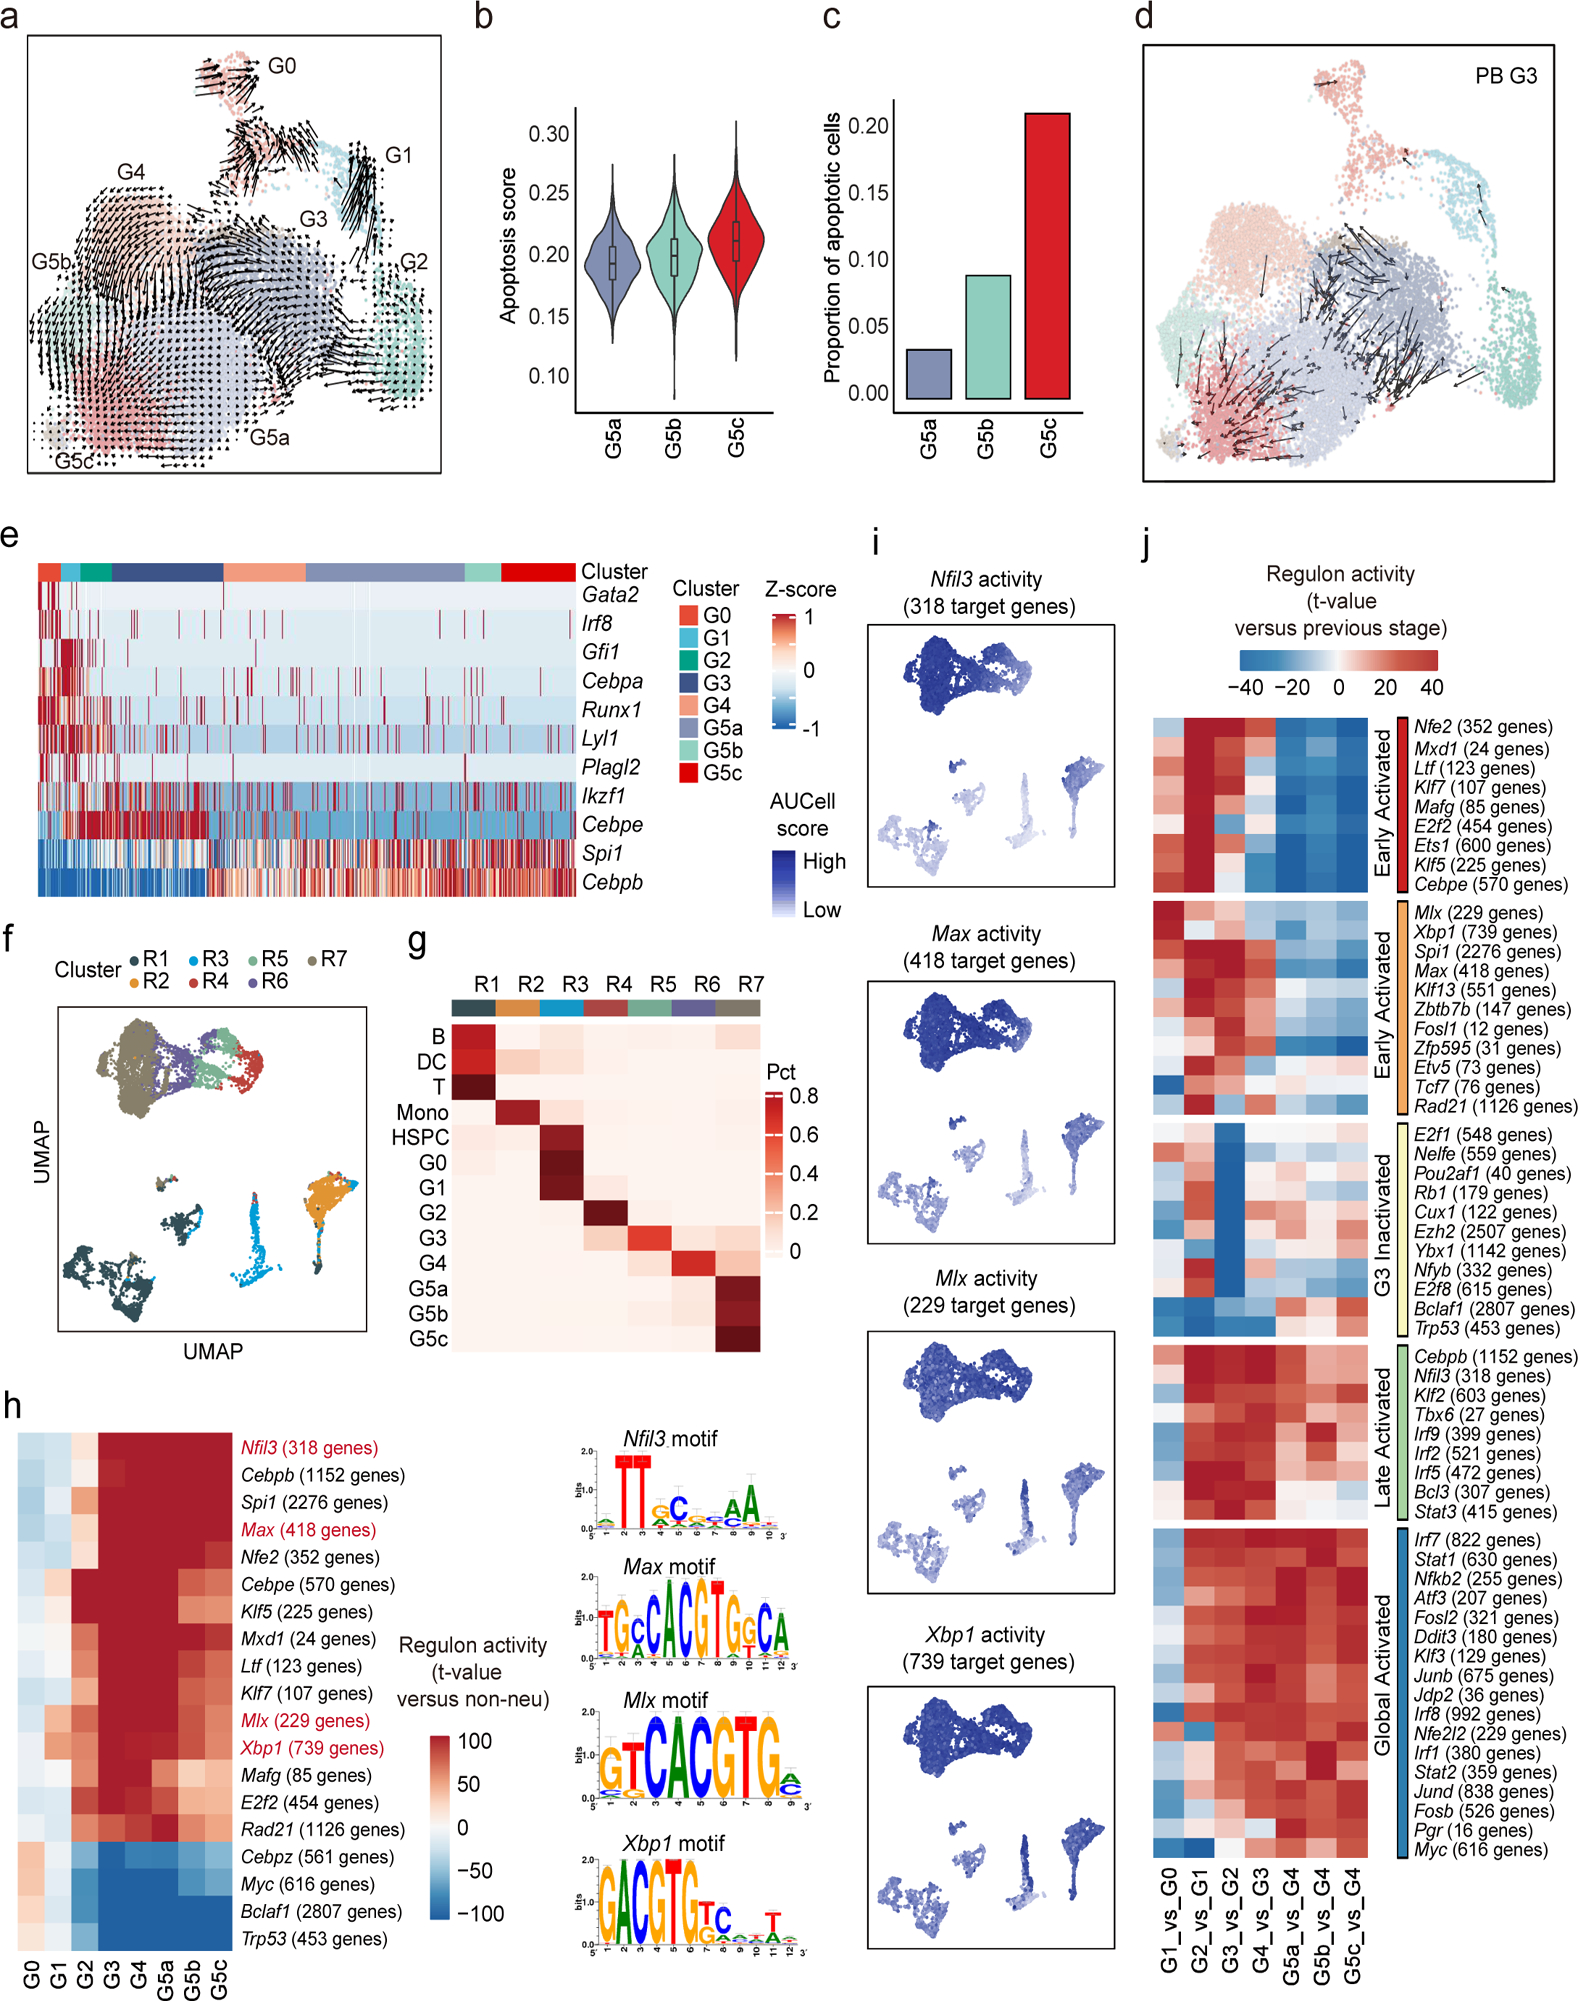
a, Velocity analysis reveals the origin and inter-relationship of neutrophil subpopulations. Velocity fields were projected onto the UMAP plot.
b, Violin plot of apoptosis scores (GO:0043065) for G5 clusters.
c, Proportions of apoptotic cells in each cluster identified by a two-component Gaussian mixture model.
d, As in (a) but only of G3 neutrophils originating from PB.
(e-j) The formation of neutrophil subpopulations is driven by both known and a large set of uncharacterized transcription factors.
e, Heatmap showing row-scaled gene expression of TFs known to be involved in granulopoiesis and neutrophil function.
f, UMAP of the regulon activity matrix of neutrophils and 7209 non-neutrophils under normal conditions. K-means clustering was performed on the first 20 principal components (PCs) of the regulon activity matrix with cluster number k = 7. Each cell is assigned the color of its K-means cluster.
g, Confusion matrix showing the percentage overlap of Seurat transcriptome-based clusters with K-means regulon-based clusters.
h, Heatmap of the t-values of regulon activity derived from a generalized linear model of the difference between cells from one neutrophil subpopulation and cells from other non-neutrophil populations. Only regulons with at least one absolute t-value >100 are visualized. Previously uncharacterized neutrophil-specific transcription factors are marked in red with binding motif shown on the right.
i, Activities of the four newly identified neutrophil-specific regulons.
j, As in (H), but t-values representing activity change between the current developmental stage and the previous one. Only regulons with at least one absolute t-value >40 are visualized. Regulons are hierarchically clustered based on activation pattern (red and orange: early-activated, yellow: G3-inactivated, green: late-activated, blue: global-activated).
Both the G3 and G4 populations are differentiating neutrophils that mainly exist in the BM (Extended Data Fig. 5d). A small number of immature neutrophils also circulate, which are thought to be derived from accidental release of cells closest to maturation35, 36, 37. We detected significantly more G3 cells in the periphery of healthy mice (5% of PB and 6% of SP neutrophils; Fig. 1c) compared to G4 cells. Thus, during BM granulopoiesis, more G3 neutrophils escape from the BM niche, migrate into PB, and travel to other organs. PB and BM G3 cells consistently overlapped on velocity analysis, with some falling into the PB G5a cluster (Fig. 4d and Supplementary Fig. 4). Further, PB G3 cells directly differentiated into G5a without going through G4, consistent with the low number of G4 cells in the PB and SP (Fig. 4d and Supplementary Fig. 4).
Both known and uncharacterized transcription factors drive neutrophil subpopulations
We next sought to characterize transcription factor (TF) dynamics across neutrophil differentiation and maturation38, 39 (Fig. 4e). Genes related to stem cell maintenance and early lineage commitment such as Gata2, Irf8, and Runx1 were highly expressed in the G0 population. Genes highly expressed in G1 included Gfi1 and Cepba, which play essential roles in neutrophil development, strongly suggesting that specific neutrophil lineage commitment occurs during G1. To assess specific global gene regulatory networks associated with neutrophil maturity, we applied SCENIC analysis40 (Fig. 4f). There was high consistency between Seurat clusters and SCENIC clusters (Fig. 4g). To further dissect the regulatory differences between neutrophils and other cell types, we compared regulon activities from each neutrophil group versus all non-neutrophil populations using a generalized linear model41. This identified 19 neutrophil-specific networks, including previously reported TFs such as Cebpe, Spi1, and Klf5 (Fig. 4h and Supplementary Table 5). Importantly, this analysis also identified four new regulons, Nfil3, Max, Mlx, and Xbp1, which are closely related to the expression of neutrophil-specific genes (Fig. 4i). We next examined the regulatory events responsible for transitioning between consecutive neutrophil differentiation stages (Fig. 4j). Coarse-grained clustering revealed at least five regulon groups with distinct activation patterns, including two early-activated, one late-activated, one globally-activated, and one specifically-inactivated after G2. While many TF networks like Cebpe, Ets1, Klf5, Rad21, and E2f2 contributed to neutrophil commitment, changes in Xbp1 and Mlx networks were specifically associated with G0/G1 transition. Additionally, the dramatic loss of regulatory networks such as E2f1, Nelfe, and Rb1 indicated a potential functional change between G2 and G3.
Bacterial infection primes neutrophils for augmented functionality without affecting overall heterogeneity
We next investigated how bacterial infection affected neutrophil subpopulations, including in the liver and peritoneal cavity (Extended Data Fig. 6a–f). At the same sequencing depth, the gene number and total UMIs both increased in neutrophils isolated from the PB, SP, and PB of E. coli-challenged mice compared to control mice, indicating elevated transcriptional activity during bacterial infection (Extended Data Fig. 6g–h). Leveraging the fact that cells in each subpopulation from unchallenged mice retain core signature genes beyond perturbations, we were able to identify every population in challenged mice using a well-accepted data integration method42 (Fig. 5a–b) and validated independently through unsupervised dimension reduction at transcriptome levels. The expression of signature molecules (Fig. 5c), NADPH oxidase components (Extended Data Fig. 6i), and granular proteins (Extended Data Fig. 6j) remained remarkably consistent after E. coli challenge. Thus, the identity of each neutrophil population was maintained during acute bacterial infection and the signature genes still successfully determined neutrophil identity under inflammatory conditions (Fig. 5c). However, infection up- and downregulated numerous genes in each neutrophil subpopulation (Fig. 5d). In differential gene expression analysis (Extended Data Fig. 7a and Supplementary Table 6), DEGs in G0 and G1 cells were also preferentially involved in regulating immune effector processes and ROS metabolism, respectively, suggesting that immune adaptation to bacterial infection could occur as early as within early progenitor cells (Fig. 5e and Extended Data Fig. 7b). In relatively mature G4 and G5 neutrophils, bacterial infection triggered significant upregulation of cytokine production and secretion genes (Fig. 5e and Extended Data Fig. 7b). Finally, in bacteria-challenged hosts, neutrophil functions related to bactericidal activities including synthesis of granular proteins (Fig. 5f), NADPH oxidase complex (Fig. 5g), phagocytosis, and chemotaxis (Fig. 5h) were all upregulated. Thus, during bacterial infection, core neutrophil subpopulations are maintained but genes related to pathogen clearance are upregulated at each stage of neutrophil maturation to maximize host defenses.
Figure 5. Bacterial infection primes neutrophils for augmented functionality without affecting their overall heterogeneity.
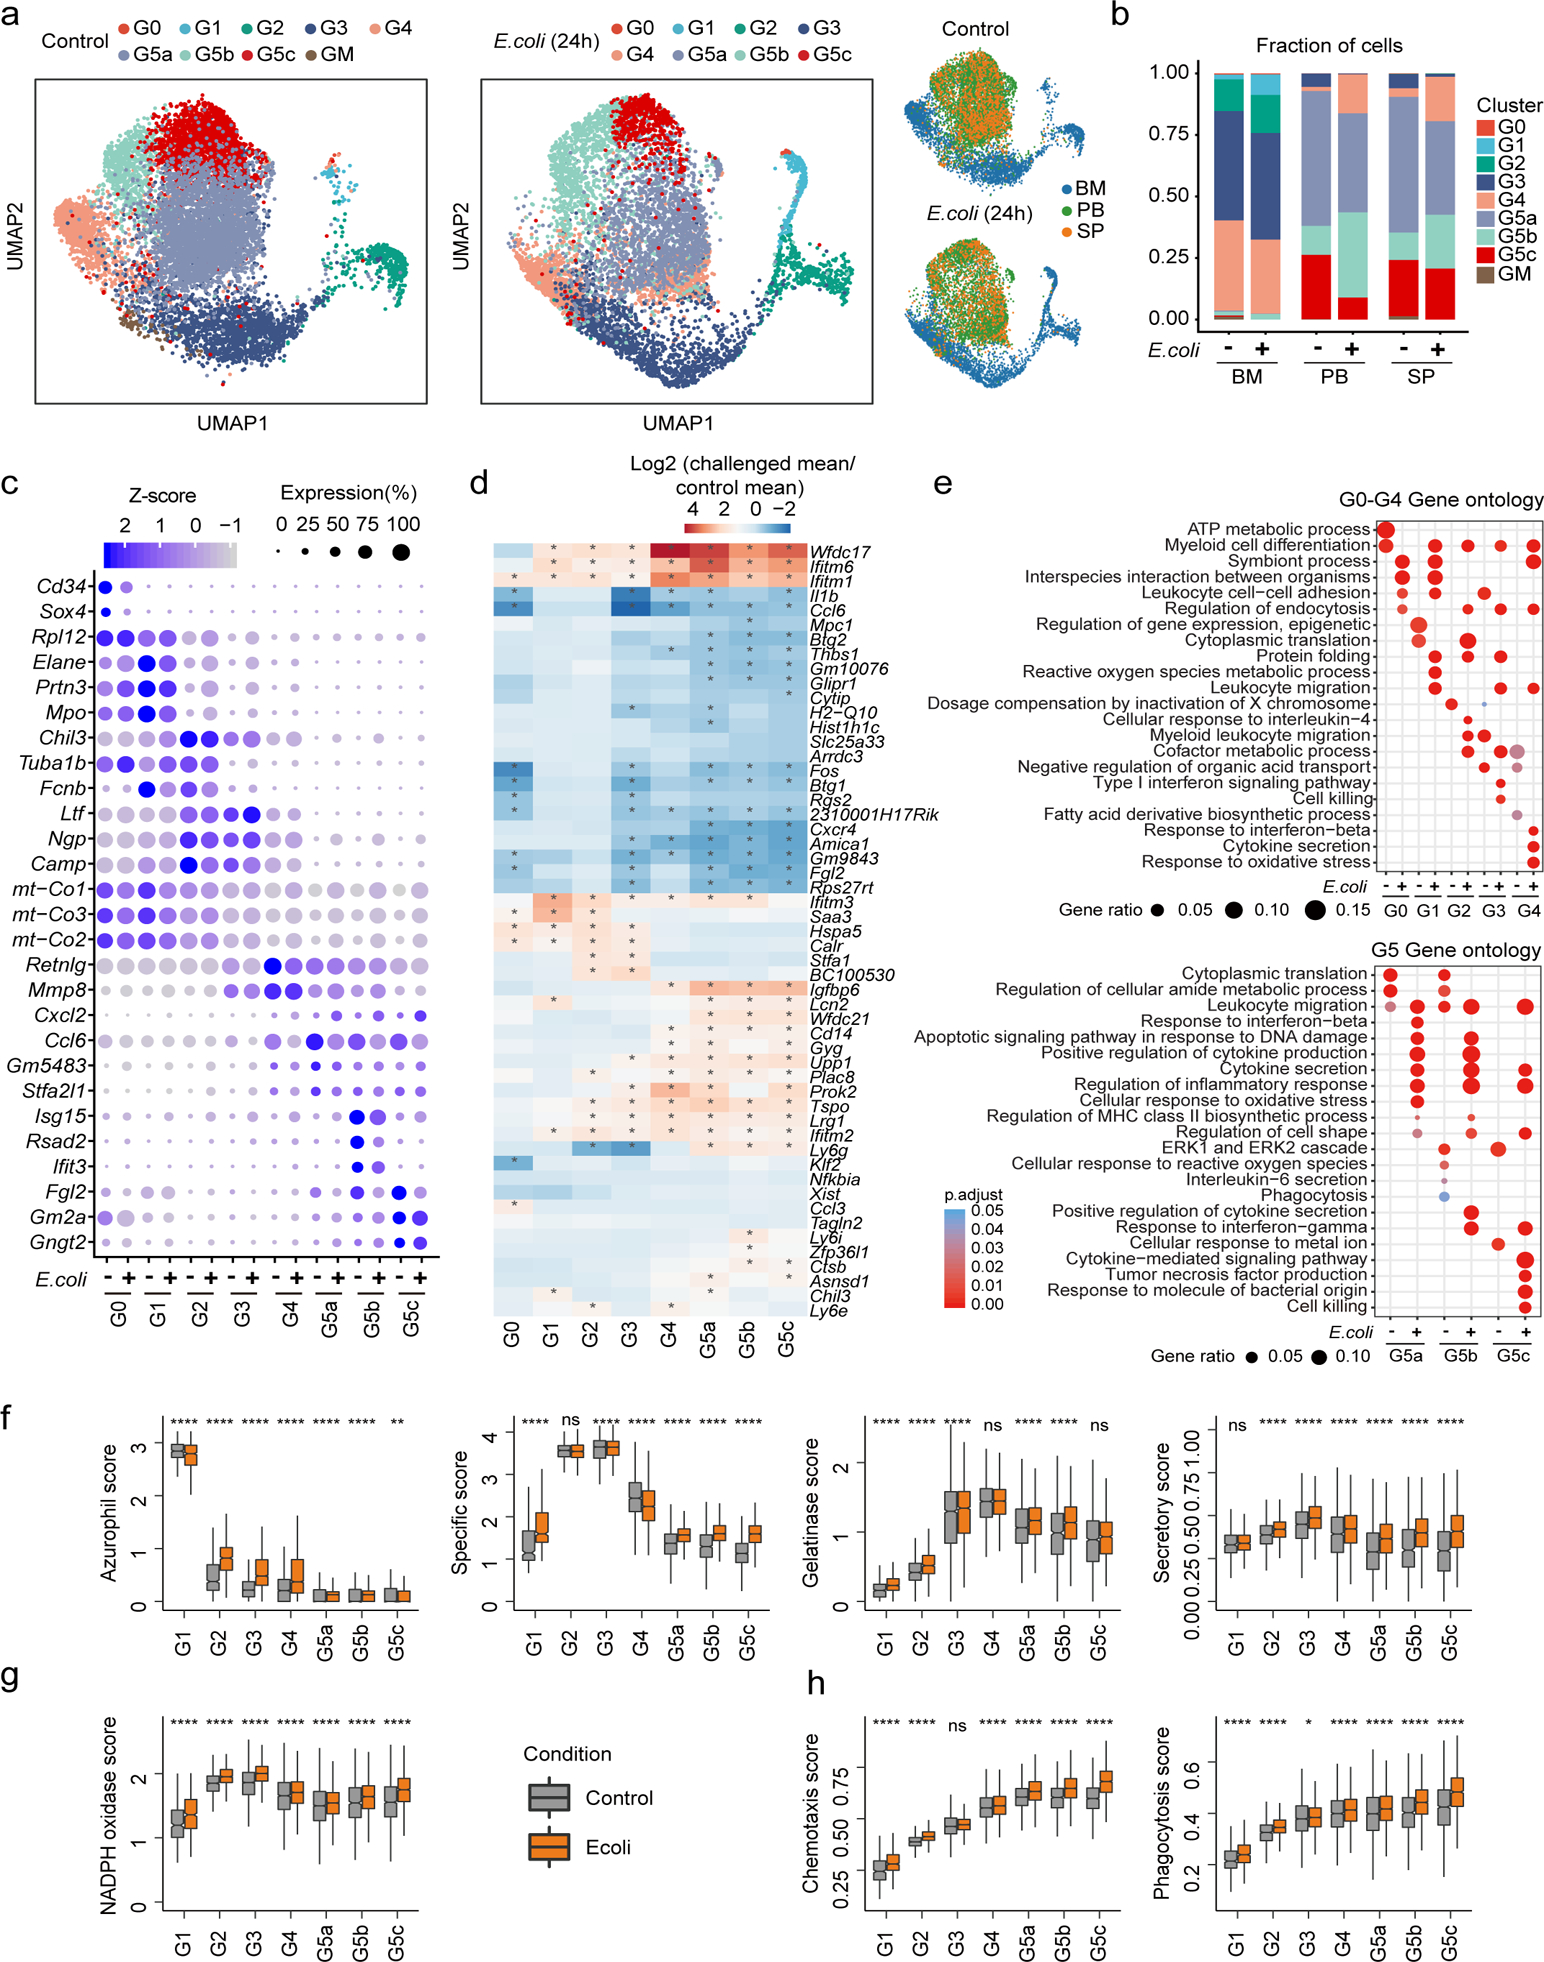
a, Comparison of control and E. coli-challenged neutrophils originating from BM, PB, and SP. All neutrophils under both control and E. coli-challenged conditions (13,687 cells) are projected together by UMAP but are displayed separately by experimental condition.
b, Comparisons of neutrophil composition between control and E. coli challenge in BM, PB, and SP before and after E. coli challenge. Each cell in the E. coli-challenged dataset was annotated based on the transcriptomic similarity between this cell and cells in the reference dataset. Neutrophils sharing similar transcriptomic profiles were placed into the same cluster.
c, Dot plot showing scaled expression of signature genes for each cluster before and after E. coli challenge colored by average expression of each gene in each cluster scaled across all clusters. Dot size represents the percentage of cells in each cluster with more than one read of the corresponding gene.
d, Heatmap showing log2(fold-change) in gene expression of the representative cluster-based DEGs between control and E. coli-challenged neutrophils. The asterisks mean log2(fold-change)>1 in corresponding cells.
e, GO analysis of cluster-based DEGs between control and E. coli-challenged neutrophils. Selected GO terms with Benjamini-Hochberg-corrected P-values < 0.05 (one-sided Fisher’s exact test) are shown.
(f-h) Comparisons of functional scores between control and E. coli-challenged neutrophils for each cluster. (f): Granule scores; (g): NADPH oxidase complex score; (h): Chemotaxis score and phagocytosis score. ns, P>0.05; *, P <=0.05; **, P <= 0.01; ***, P < 0.001; ****, P <= 0.0001. Student’s t-test.
We also examined whether bacterial infection had a universal impact on transcriptional regulatory networks across neutrophil populations. Overall, there was a coherent drift in gene regulatory network activities in each subpopulation after bacterial challenge (Extended Data Fig. 8a), perhaps driven by upregulation of defense-response-associated TF networks like Irf7 and downregulation of metabolic TF networks like Foxp1 and Ctcf (Extended Data Fig. 8b). Interestingly, we also identified TF networks (e.g. Fos and Atf4) showing different responses in immature (upregulated) and mature (downregulated) populations (Extended Data Fig. 8b). These networks were gradually activated from G1 to G5 under normal conditions (Extended Data Fig. 8c and Supplementary Table 5), and their target genes were enriched for a variety of processes including signaling, biosynthesis, and transcriptional regulation. Presumably, bacterial challenge accelerates neutrophil maturation by upregulating these networks at earlier stages and thus re-allocates cellular resources to defense responses by downregulating these networks at later stages.
The ISG-related G5b neutrophil population exists in both humans and mice and expands during infection
The percentage of G5b cells increased significantly in E. coli-challenged hosts (Fig. 5b). We investigated the distribution of G5b neutrophils in the spleen using a laser scanning cytometer (LSC), co-staining spleen tissue sections with an anti-S100a8 antibody and an anti-IFIT1 antibody to identify G5b neutrophils (Fig. 6a). Under normal conditions, S100a8+ neutrophils were uniformly distributed in the red pulp, while G5b (S100a8+ IFIT1+) cells were preferentially subcapsular. After E. coli challenge, overall number of neutrophils in the spleen increased significantly, as did the percentage and number of G5b (Fig. 6b), which were still preferentially subcapsular, their specialized location further demonstrating the uniqueness of this subpopulation. Although multiple ISGs (e.g. Ifitm1) were upregulated in basically all neutrophil subpopulations after bacterial stimulation (Fig. 6c), many ISGs such as Isg15 and Oas2 which are specifically expressed in G5b were not upregulated, suggesting that ISG-related G5b expansion was not due to bacteria-induced ISG expression.
Figure 6. The ISG-expressing neutrophil population is present in both humans and mice and expands during bacterial infection.
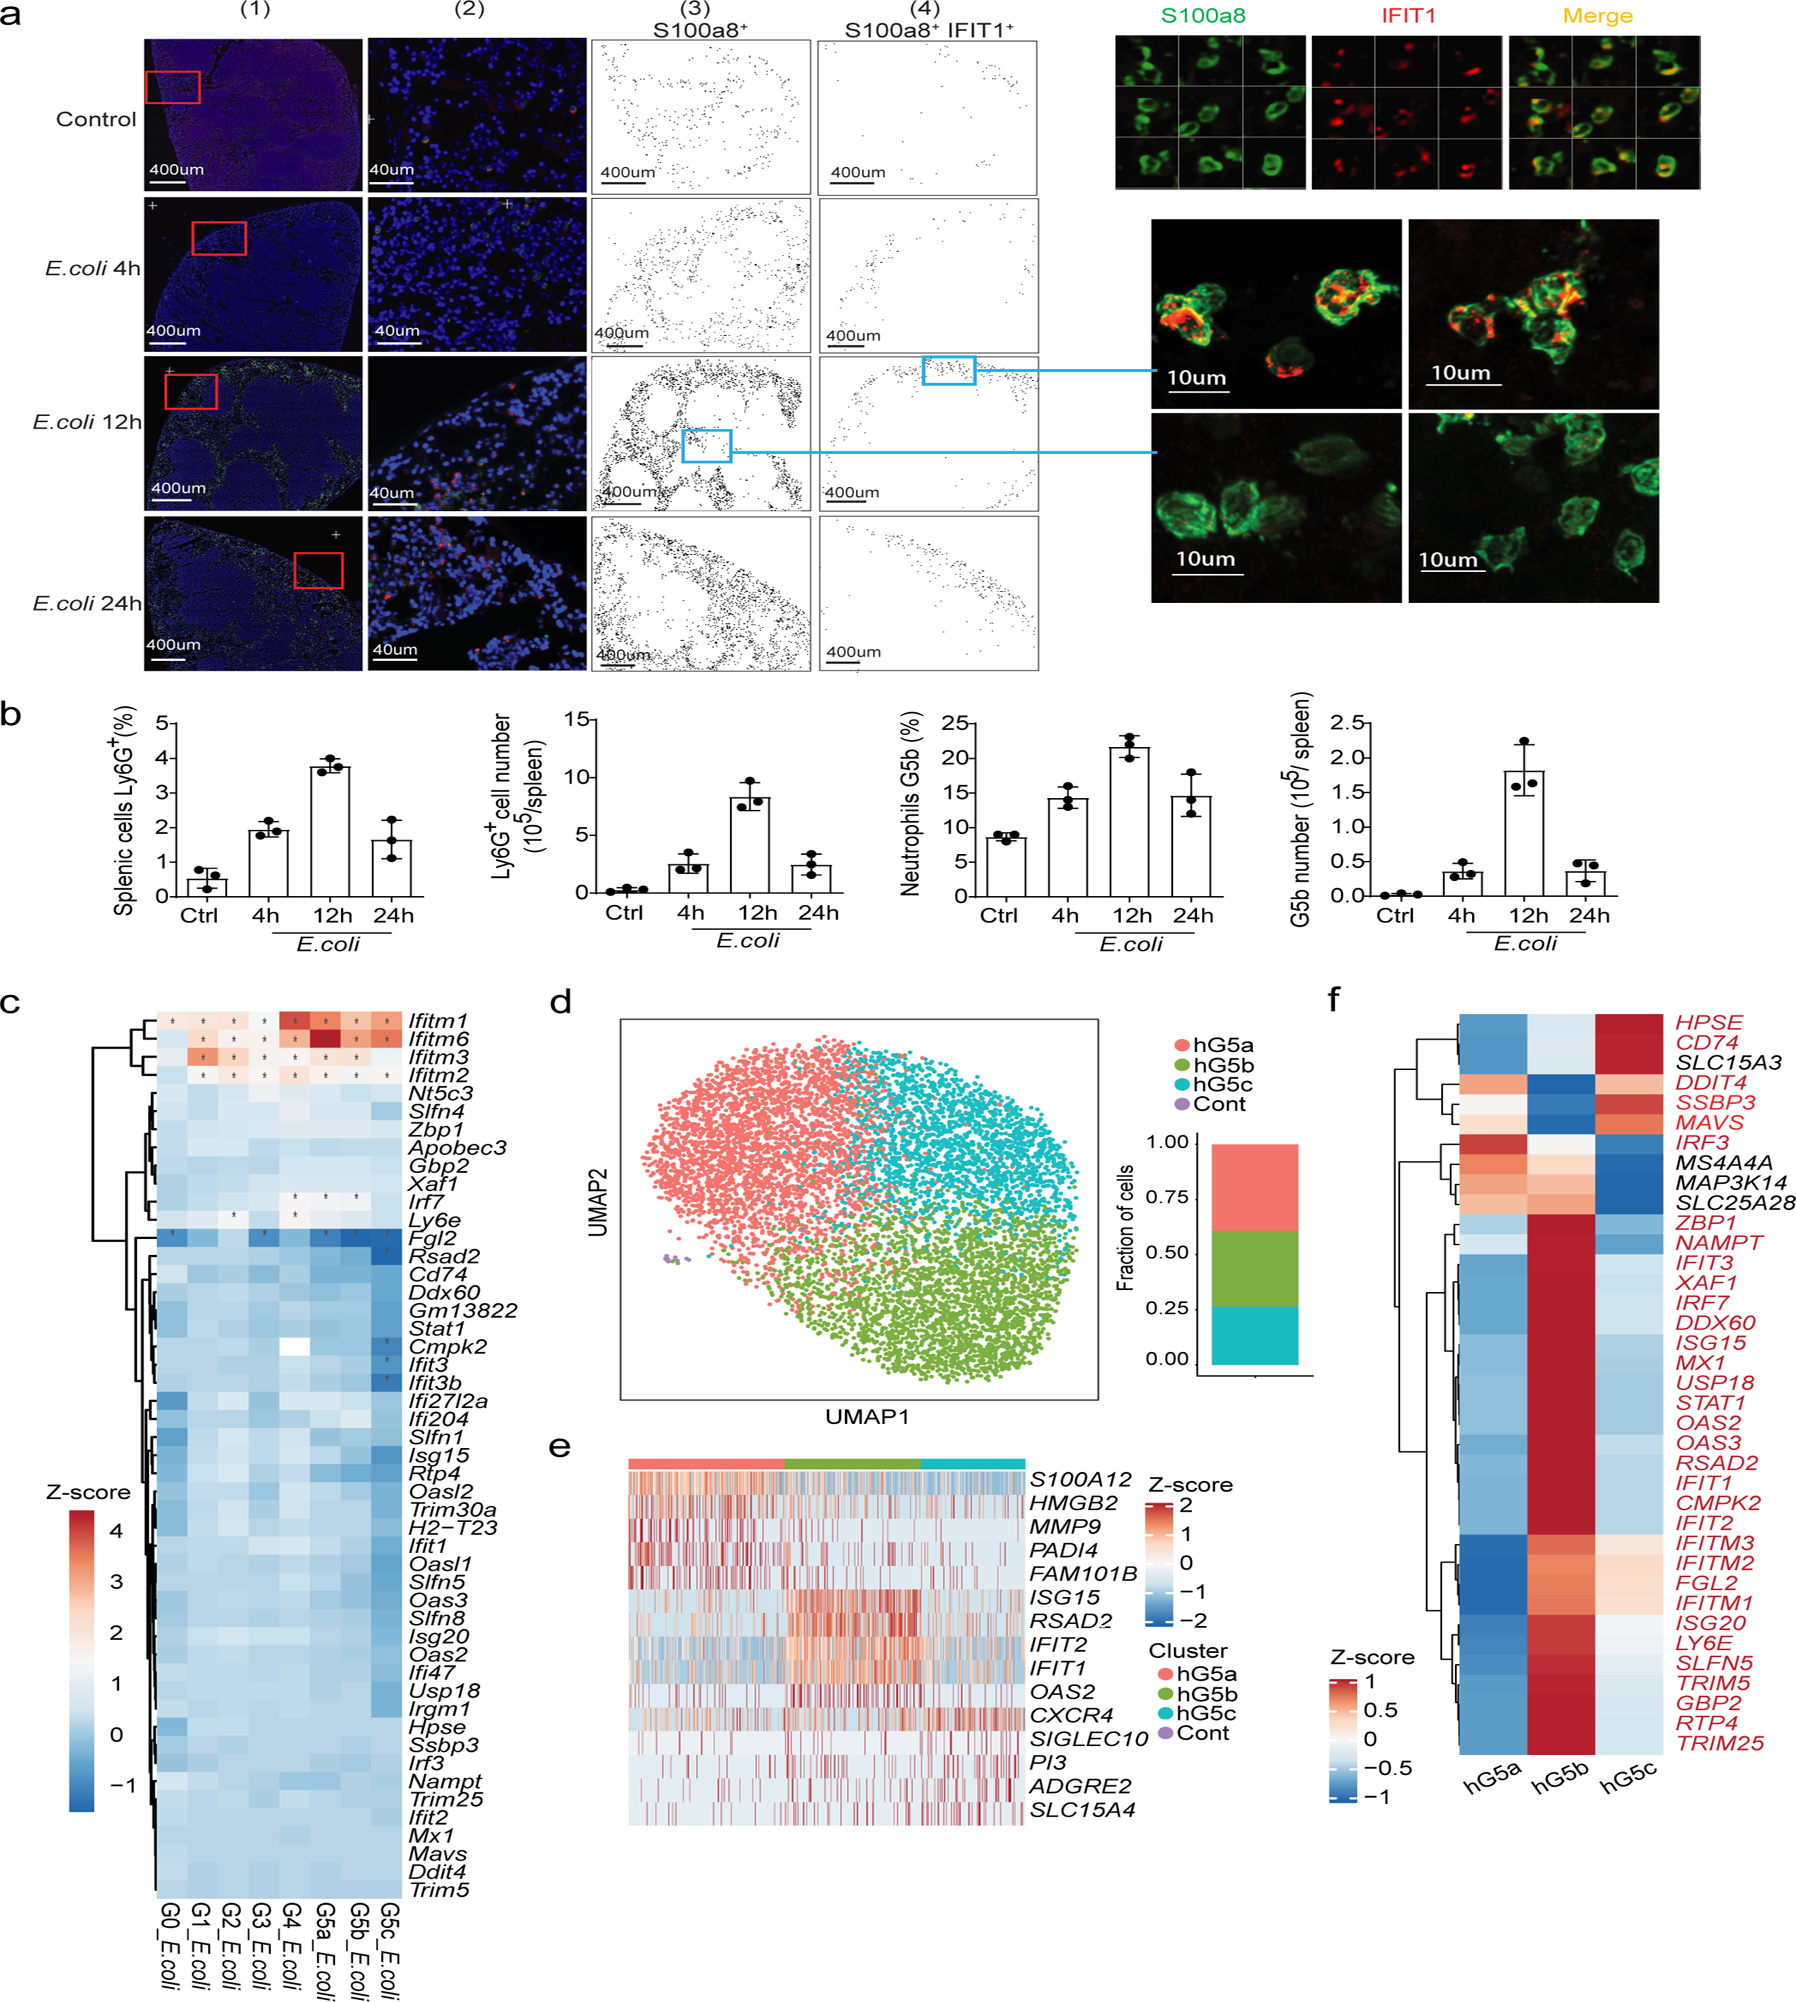
a, Quantitative image analysis of the spatial distribution of G5b in whole spleen sections. Left: Laser scanning cytometry (LSC) image analysis of the whole spleen. (1) Low-magnification image of axial spleen cryosection immunostained for DAPI (blue), S100a8 (green), and IFIT1 (red). (2) Representative images of spleens from the selected region from (1). (3) Localization diagram of S100a8+ cells in the whole spleen from (1). Cells gated positive based on the fluorescence intensity in the S100a8 channel. Each dot represents a single cell. (4) Localization diagram of S100a8+ IFIT1+ (G5b) cells gated from (3). Each dot represents a single cell. Right: LSC images (top) and confocal images (bottom) of representative G5b neutrophils.
b, Quantification and relative frequency of spleen Ly6G+ cells (left, measured by FACS) and spleen G5b cells (right, S100a8+ IFIT1+, measured by LSC) at different time points after E. coli infection. Results are the mean ± SD of three independent experiments (n=3 mice for each timepoint, 3–5 slides were scanned and quantified for each mice).
c, Heatmap showing log2 fold change in expression of 49 ISGs before and after E. coli challenge for each cluster. Genes are marked with an asterisk if their expression changed significantly as identified by a Student’s t-test (Bonferroni-corrected P-value < 0.05).
d, UMAP of neutrophils from human peripheral blood (PB) colored by cluster identity. The fraction of cells in each cluster is displayed on the right.
e, Heatmap showing row-scaled expression of the five highest DEGs (Bonferroni-corrected P-values < 0.05, Student’s t-test) per cluster for all hG5 neutrophils.
f, Heatmap showing expression of 37 ISGs for the three human neutrophil clusters. Genes marked in red are conserved across mouse and human.
We next examined whether this G5b population was also present in human blood by scRNA-seq of sorted human PB neutrophils from a healthy donor (Extended Data Fig. 9a). Unsupervised clustering revealed three major neutrophil populations, one of which was a human G5b (hG5b) population expressing ISGs (Fig. 6d–f and Supplementary Table 7). We also performed cell clustering on the mixture of PB neutrophils from three donors and obtained similar results with the same three G5 clusters (Extended Data Fig. 9b–f).
Bacterial infection accelerates G1 cell division and post-mitotic maturation without altering overall neutrophil differentiation
Neutrophil populations significantly expand during bacterial infection43, 44. However, the neutrophil differentiation and maturation trajectory was largely maintained in E. coli-challenged mice (Fig. 7a). The overall stability of the neutrophil differentiation program after bacterial infection was also demonstrated by correlation of SCENIC transcription regulatory networks in control and challenged samples (Fig. 7b). While both G1 and G2 cells are proliferative, the proliferation score increased only in the G1 population (Fig. 7c), as were genes related to G2/M phase progression45, while genes related to S phase progression were paradoxically reduced in G2 cells during acute infection (Fig. 7d).
Figure 7. Bacterial infection accelerates G1 cell division and post-mitotic maturation without altering overall neutrophil differentiation programs.
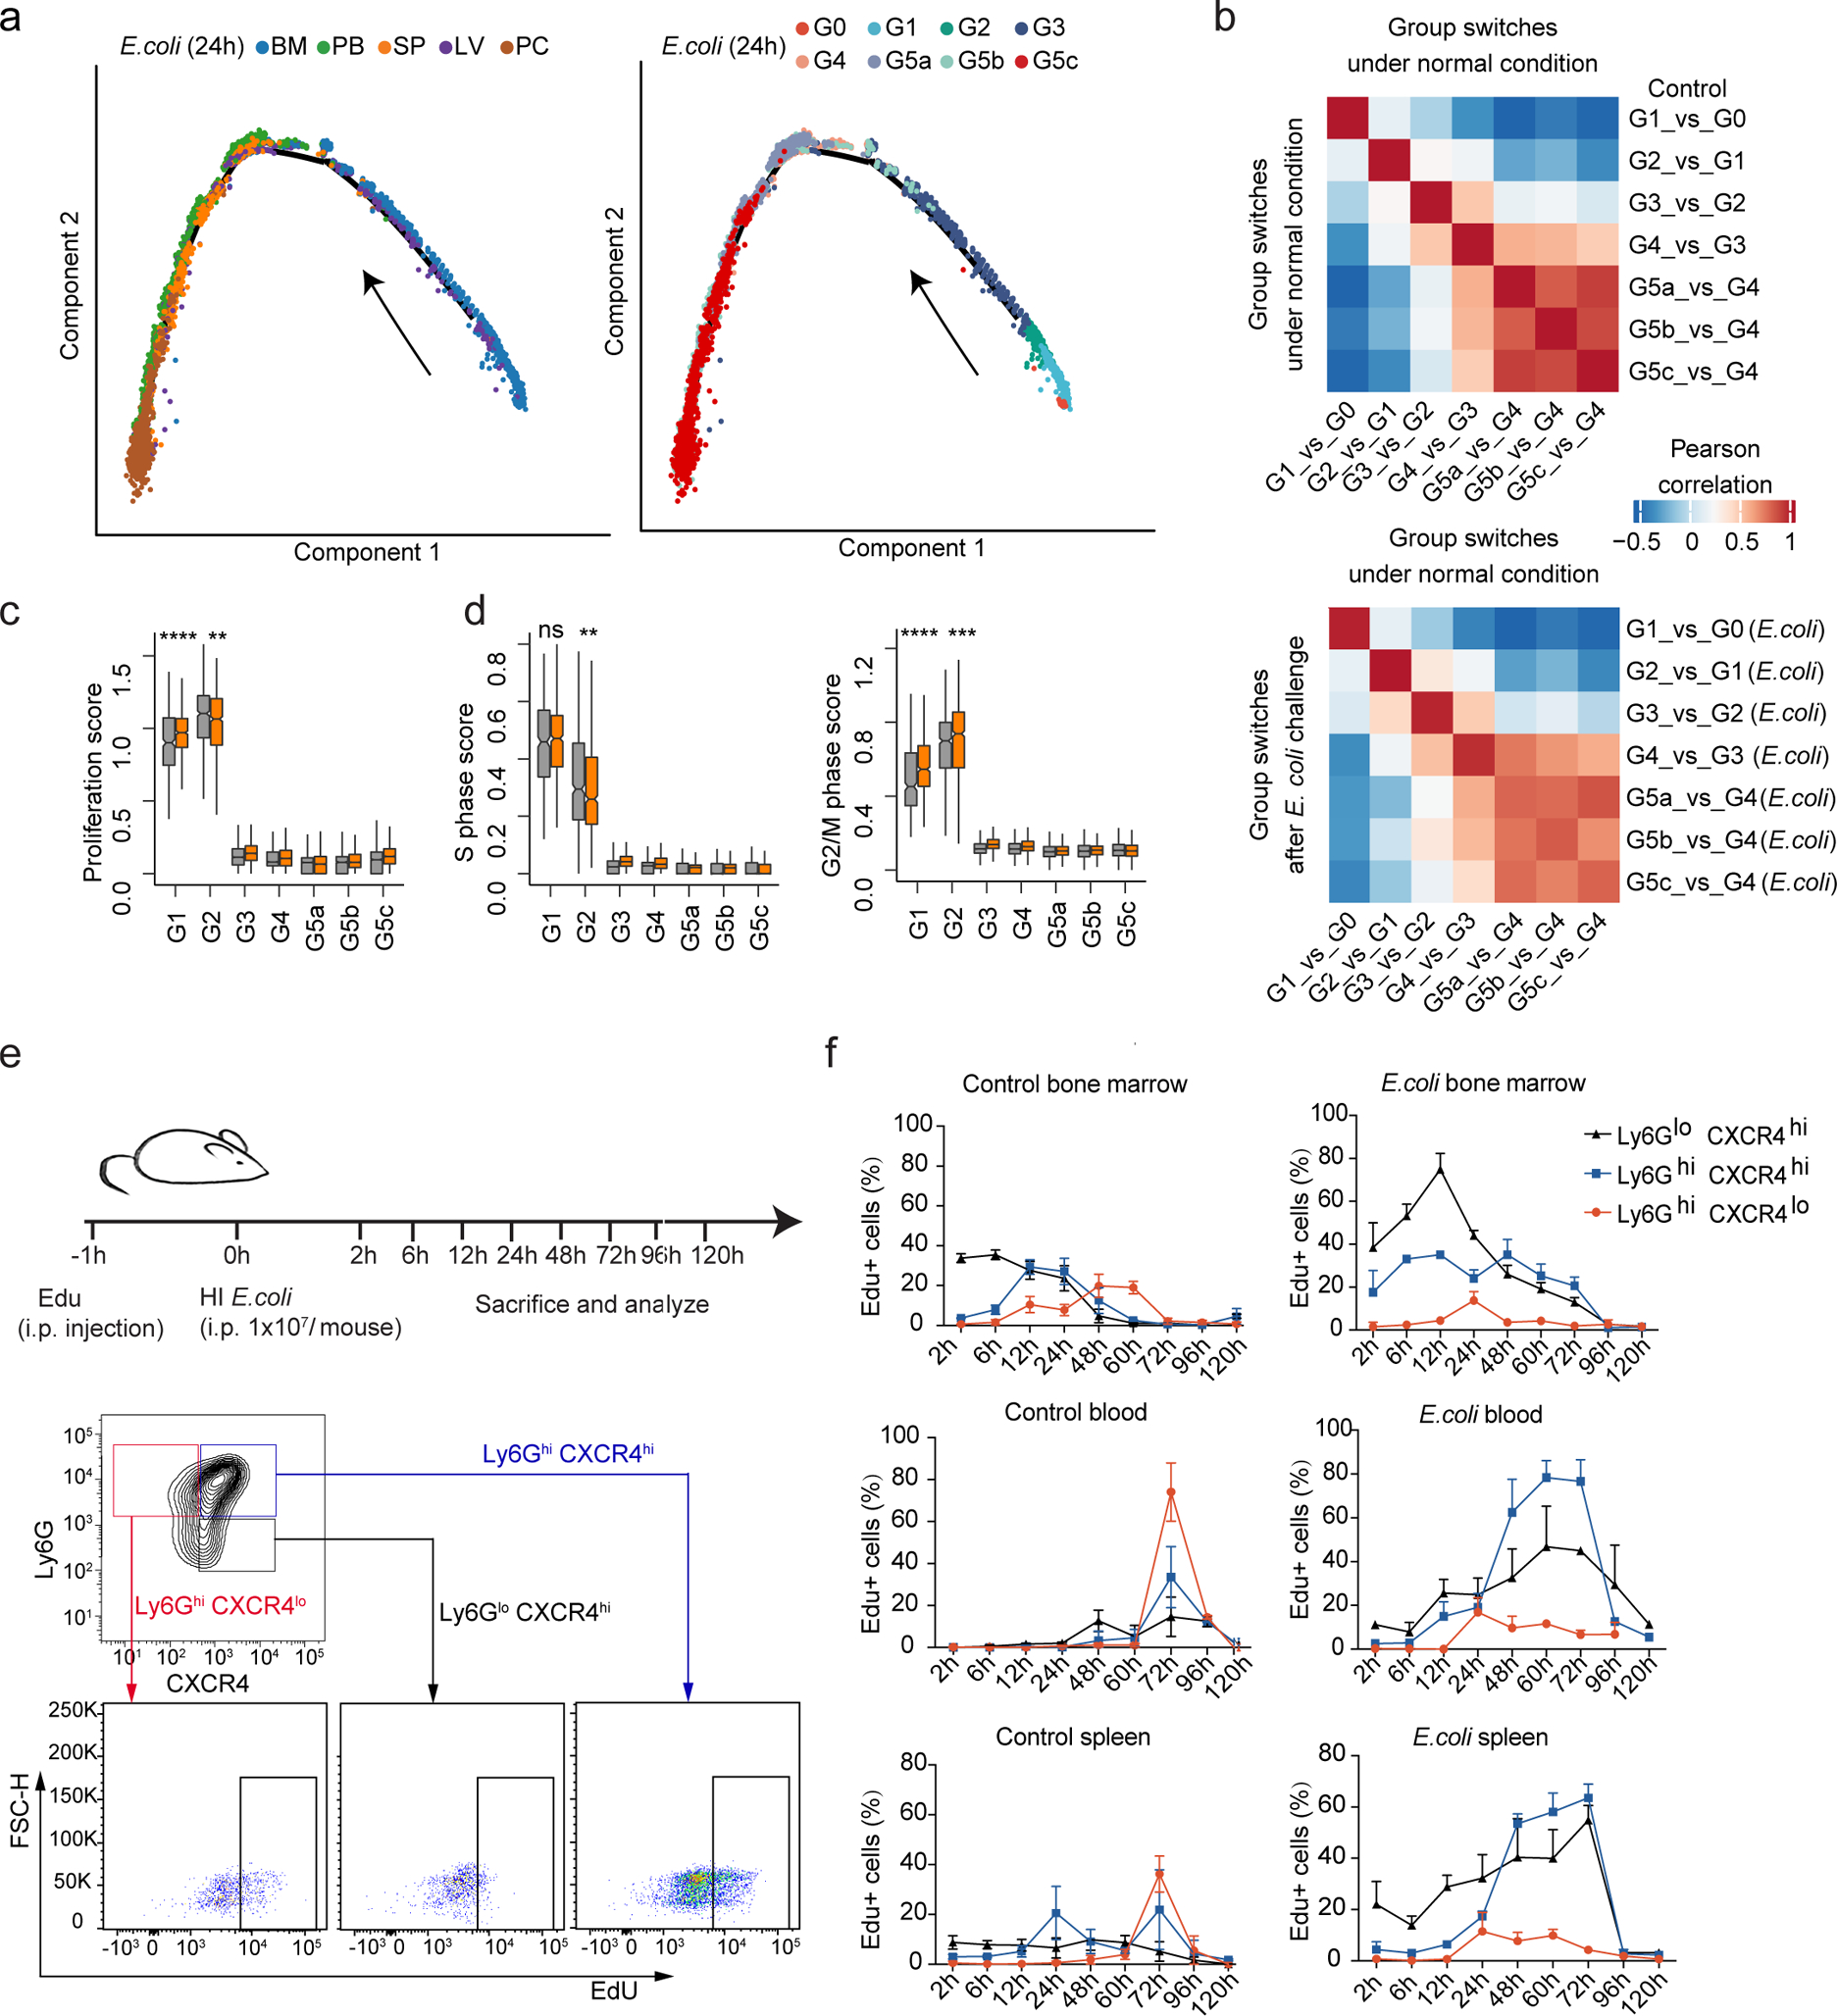
a, Monocle trajectories of E. coli-challenged neutrophils colored by sample origin (left) and cluster identity (right). Each dot represents a single cell. Cell orders are inferred from the expression of the most variable genes across all cells. The trajectory direction was determined by biological prior.
b, Correlation matrices of t-values for regulon activity change during each group transition event under normal conditions (top) or after E. coli challenge (bottom). For each group transition event after challenge, the direct comparison to all normal transition events is demonstrated (bottom).
(c-d) Comparisons of proliferation score (c), S-phase score, and G2M score (d) between control and E. coli-challenged neutrophils for each of the 8 clusters.
(e-f) In vivo EdU incorporation assay. (e) Top: Schematic. Bottom: Gating strategy of the three neutrophil subpopulations: immature (Ly6GlowCXCR4hi, black), intermediate (Ly6GhiCXCR4hi, blue), and mature (Ly6GhiCXCR4low, red) neutrophils. (f) In vivo EdU proliferation assay of neutrophil subsets in BM, PB, and SP at sequential time points with or without E. coli challenge. Data are represented as percentages of EdU+ cells in the corresponding gated subpopulation. Results are the mean (±SD) of three independent experiments (n=3–5 mice for each timepoint).
During bacterial infection, the G3 and G4 pool must increase to produce more mature neutrophils. Nevertheless, the proportions of G3 and G4 cells were not increased in the BM of E. coli-challenged hosts (Fig. 5b), indicating that post-mitotic maturation may be accelerated in the BM. To test this hypothesis, we labeled dividing cells with 5-ethynyl-2´-deoxyuridine (EdU) and tracked these cells post-mitotically in the BM and PB (Fig. 7e). Based on the surface expression of Ly6G and CXCR4 in differentiating neutrophils13, 19, 26, we separated relatively immature (Ly6Glow CXCR4hi), intermediate mature (Ly6Ghi CXCR4high), and mature (Ly6Ghi CXCR4low) neutrophils, and examined the emergence of EdU-labeled cells in these subpopulations at different time points. In the BM of unchallenged mice, EdU-labeled cells entered the immature neutrophil stage after 2 h, intermediate maturation after 12 h, and became mature neutrophils at 48 h. The duration of each stage was about 24 h, and EdU+ cells appeared in the PB and SP after 72 h (Fig. 7f). In E. coli-challenged hosts, the percentage of Ly6Ghi CXCR4low cells reduced significantly, and Ly6Glow CXCR4hi and Ly6Ghi CXCR4hi cells predominated in both the BM and PB. These neutrophils mobilized to the periphery following a similar dynamic pattern but over only two rather than three days, a drastic reduction in the post-mitotic neutrophil maturation period in infected hosts (Fig. 7f).
Bacterial infection reprograms the neutrophil population structure and dynamic transitions between subpopulations
In the BM, the proportion of G1 cells increased during bacterial infection, indicating elevated proliferation of myeloid progenitors (Fig. 5b and Fig. 8a). The percentage of BM G2 cells remained the same, suggesting balanced influx from G1 cells and transformation from G2 to G3 cells. Velocity analysis showed that the obvious transformation from G3 to G5a cells under homeostatic conditions was suppressed during infection, and G3 cells in infected hosts predominantly differentiated to G4 cells (Fig. 8b and Supplementary Fig. 5). G4 cells decreased from 38% to 30% in the BM but significantly increased in the PB and SP (Fig. 5b and Fig. 8a). PB G4 cells were mainly derived from the BM G3 cells (Fig. 8b). Additionally, infection significantly suppressed the G5a and G5b to G5c transition, leading to a smaller G5c population in E. coli challenged hosts (Fig. 5b and Fig. 8b). In the velocity analysis, cells from the BM and PB were analyzed together to reveal the origin and interrelationship of neutrophil subpopulations in each compartment. Regardless of whether we investigated all (G0-G5) (Fig. 8b and Supplementary Fig. 5) or only postmitotic (G3-G5) (Supplementary Fig. 6) neutrophils, similar pattern of cell transition and fate direction was observed. In the PB and SP, the conversion between G5a and G5b neutrophils was rarely detected and G5c clearly localized at the end of neutrophil maturation trajectory (Supplementary Fig. 6). Significant number of G5b neutrophils also existed in the BM (Extended Data Fig. 5d). A bidirectional transition was observed in the BM G5b population with BM G4 and PB/SP G5b at each end. It was switched to an overly unidirectional transition from BM G5b to PB/SP G5b during bacterial infection (Supplementary Fig. 6).
Figure 8. Bacterial infection reprograms the structure of the neutrophil population and the dynamic transition between each subpopulation.
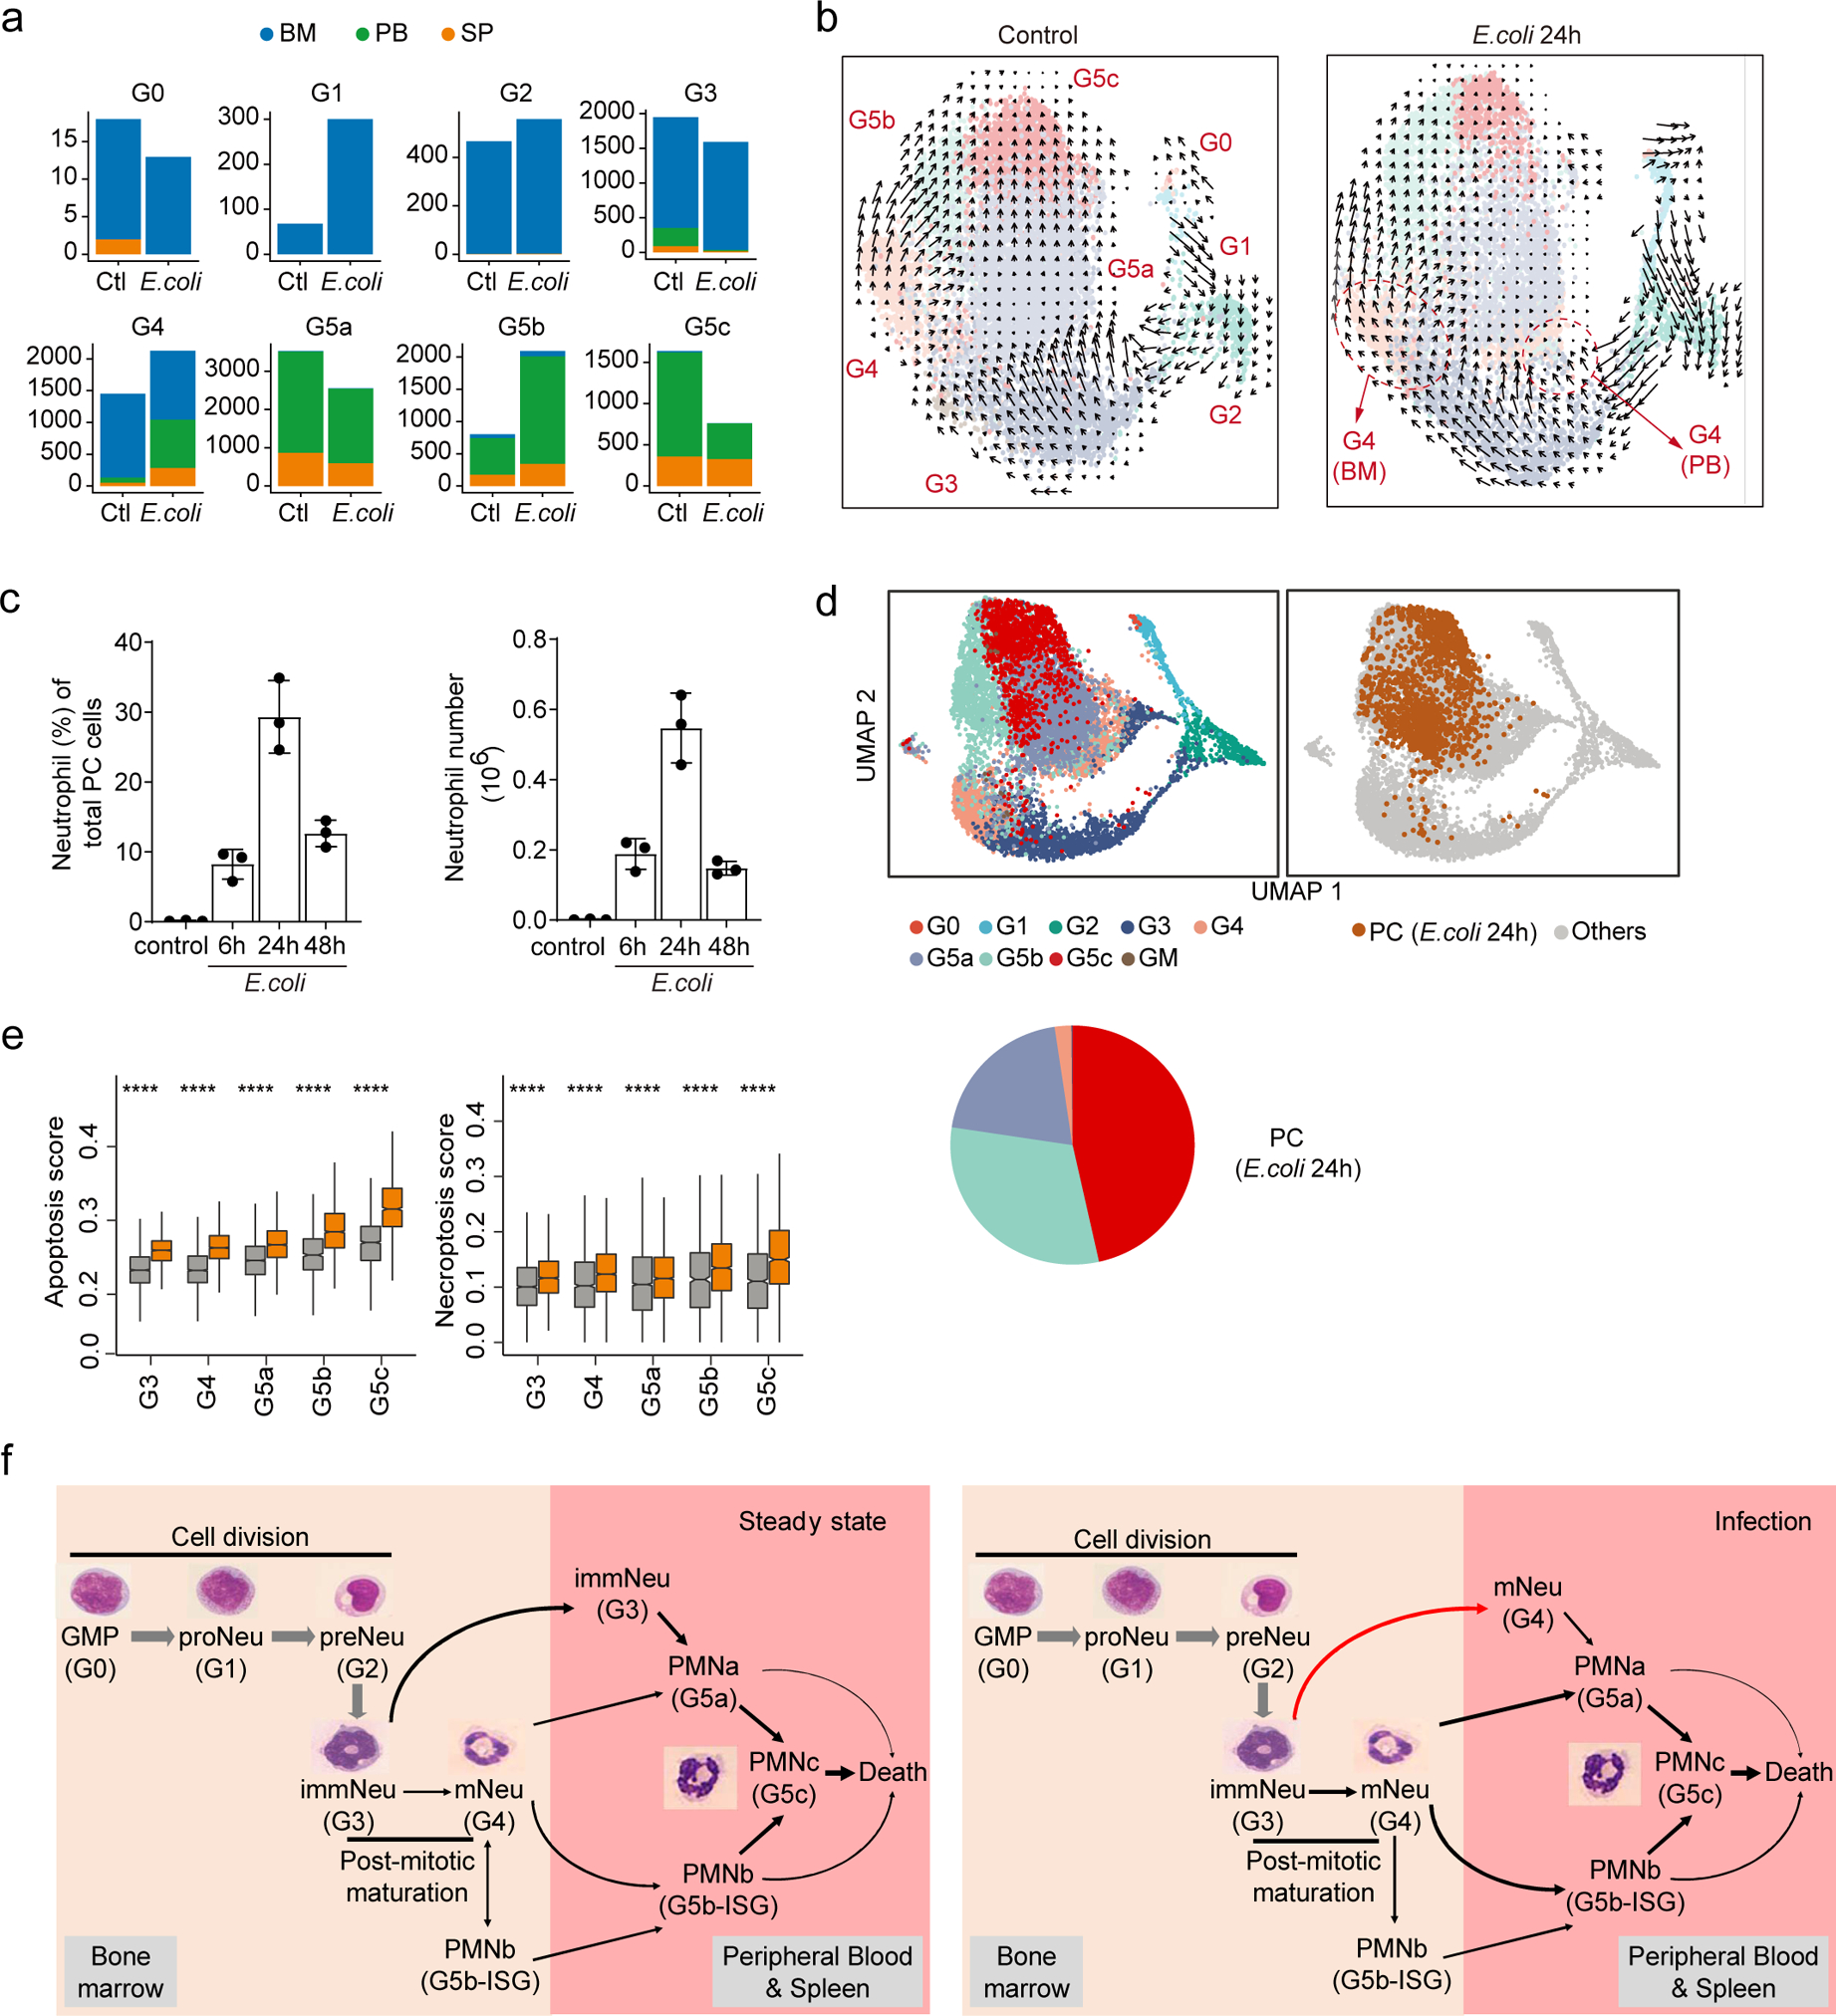
a, Comparisons of organ distributions of each neutrophil subpopulation before and after E. coli challenge, measured by cell number.
b, Comparison of neutrophil dynamics (velocity field projected on the UMAP plot) before and after E. coli challenge.
c, Neutrophil proportion and cell number in the peritoneal cavity measured at different time points after E. coli challenge. Results are the mean (±SD) of three independent experiments (n=3 mice for each timepoint).
d, Left: UMAP of E. coli-challenged neutrophils from BM, PB, SP, and peritoneal cavity (PC) colored by cluster identity. Right: PC cells are highlighted in the UMAP plot. Proportions of each neutrophil clusters in LV were shown.
e, Comparisons of apoptosis score and necroptosis score between control and E. coli-challenged neutrophils for G3-G5 clusters. ****, P ≤ 0.0001. Student’s t-test.
f, Dynamic transition between neutrophil subpopulations under steady-state and bacterial infection conditions. We cataloged differentiating and mature mouse neutrophils in an unbiased manner using single-cell RNA sequencing. Based on the correlation analyses (Fig.S3), the G0, G1, G2, G3, and G4 clusters characterized here were aligned to bone marrow GMP, proNeu, preNeu, immature Neu (immNeu), and mature Neu (mNeu), respectively. The names proNeu, preNeu, immNeu, and mNeu were adopted from ref6. G5a, G5b, and G5c, the major neutrophil populations in the peripheral blood, represented the most mature neutrophils with typical polymorphonuclear morphology and were named PMNa, PMNb, and PMNc, respectively. Under homeostatic condition, the PMNa cells in the PB can arise from both mNeu and immNeu cells, while PMNb cells mainly arise from BM mNeu cells. The transformation from immNeu to PMNa cells was suppressed during infection and immNeu cells in infected hosts predominantly differentiated to mNeu cells.
To assess neutrophil heterogeneity at the site of infection, neutrophils were extracted from the inflamed peritoneal cavity (PC) (Fig. 8c–d). Velocity analysis on all G3-G5 cells in E.coli-challenged mice, including those in the BM, PB, SP, and PC, revealed irregular multiple directions and short vectors in PC G5 populations, indicating a rather inactive transition among these populations (Supplementary Fig. 7). Interestingly, although G5c cells accounted for only about 25% of PB neutrophils before bacterial challenge and <10% PB neutrophils after bacterial challenge, >45% of PC neutrophils in challenged mice were G5c cells (Fig. 8d), suggesting that these cells may possess higher trans-endothelial migration capability than G5a or G5b cells. G5c neutrophils showed the highest aging score compared to other G5 cells (Fig. 2i–j) with no difference detected among BM, PB, and SP G5c cells in unchallenged mice (Supplementary Fig. 8a). During bacteria-infection, the aging score and the proportion of aged cells in PC G5c population became significantly higher compared to the PB and SP G5c (Supplementary Fig. 8b). These results are in agreement with a previous study showing that in the acute inflammatory response during endotoxemia, aged neutrophils stop returning to the BM and instead rapidly migrate to sites of inflammation46, 47. Infection delays neutrophil death48. Paradoxically, genes related to apoptosis or necroptosis were significantly upregulated in every neutrophil subpopulation in E. coli challenged mice (Fig. 8e), indicating that the delayed neutrophil death in infected hosts is mainly determined by the activation of apoptotic factors and pathways rather the level of the related proteins.
Discussion
In this study, we used single-cell transcriptome profiling to reveal neutrophil heterogeneity and orchestrated maturation during homeostasis and bacterial infection. The scRNA-seq defined neutrophil populations characterized here were correlated with classical morphology-based and various previously reported distinct BM neutrophil subpopulations arising during differentiation and maturation (Extended Data Fig. 10). In an effort to unify the naming scheme for cellular clusters in neutrophil development, a set of recently used terms for differentiating neutrophils were adopted6, 29, 30. Based on correlation analyses (Extended Data Fig. 2), the G0, G1, G2, G3, and G4 clusters aligned to BM GMP, proNeu, preNeu, immature Neu (immNeu), and mature Neu (mNeu), respectively (Fig. 8f).
The PB contained three main neutrophil subsets, G5a, G5b, and G5c, which represented the most mature neutrophils with typical polymorphonuclear morphology and were named PMNa, PMNb, and PMNc, respectively (Fig. 8f). They are three transcriptionally distinct mature neutrophil subpopulations that may be pre-programmed with different functions. First, PMNb were discrete and definable ISG-expressing neutrophils. They were more similar to PMNa than PMNc neutrophils, and the majority of PMNb neutrophils directly developed from BM mNeu (Fig. 8f). Interferon and interferon-related pathways are implicated in both viral and non-viral infections and play a critical role in host defenses49. ISG-related PMNb neutrophils may be primed to combat invading pathogens even before infection occurs. Interestingly, while a group of ISG-expressing tumor-infiltrating neutrophils was recently identified in human and mouse lung cancers50, their transcriptome was significantly different to that of PMNb neutrophils, indicating significant neutrophil reprogramming in the tumor microenvironment. Second, the difference between PMNa, PMNb, and PMNc is unlikely to be due to mechanically-induced cellular responses caused by transendothelial migration9, 10. Most neutrophils in the PB have experienced the same mobilization from the BM to the circulation and have never crossed capillaries. Third, the difference between PMNa, PMNb, and PMNc is not a result of neutrophil activation. These distinct subpopulations existed in unchallenged mice, and their identity was stable and largely maintained during bacterial infection. Finally, these distinct subpopulations are not a direct result of neutrophil aging or death. Although PMNc clearly localized at the end of neutrophil maturation trajectory and had a higher aging score than PMNa and PMNb (Fig. 2i–j), only 15% of PMNc neutrophils could be defined as aged neutrophils. Aged neutrophils also existed in the PMNa and PMNb populations, albeit at lower percentages. Additionally, PMNc marker genes were significantly enriched for ribosome biogenesis, cytoplasmic translation, post-transcriptional regulation, and LPS-mediated signaling pathways by GO analysis, indicating high functionality of this population.
Methods
Mouse strains
Female C57BL/6 mice were purchased from the Jackson Laboratory (Bar Harbor, ME). Eight-to-ten-week-old mice were used in all experiments. All animal experiments were conducted in accordance with the Animal Welfare Guidelines of the Children’s Hospital Boston. The Children’s Hospital Animal Care and Use Committee approved and monitored all procedures.
Mouse peritonitis model
Wild-type mice were intraperitoneally injected with 1×10⁷ E. coli (ATCC® 19138™) in 300 μl PBS. At different timepoints after injection, mice were anesthetized with isoflurane, retro-orbital blood was collected, and then mice were sacrificed by euthanizing with CO251. Cells from different organs such as bone marrow, spleen, liver, and peritoneal exudate were collected as detailed below.
Mouse neutrophil isolation
Neutrophils display circadian oscillations in number and phenotype, and neutrophil aging is an intrinsically-driven bona fide circadian process52. Thus, all samples in this study were prepared from mice sacrificed at the same time in the morning (8:00 AM). Eight-week-old female mice were used for sc-RNA-seq analysis. Peripheral blood (600–800 μl) was collected by retro-orbital bleeding and diluted with 3 ml HBSS containing 15 mM EDTA53. Cells were centrifuged for 10 min at 500 x g. Red blood cells were lysed by resuspension in 5 ml ACK (ammonium-chloride-potassium) lysis buffer (Thermo Fisher Scientific, Waltham, MA) for 5 min at RT. 10 ml RPMI + 2% FBS were added to stop lysis followed by centrifugation at 500 x g for 5 min. Cells were washed twice with 10 ml HBSS + 2 mM EDTA + 1% BSA before being re-suspended in 500 μl PBS + 1% BSA. For bone marrow neutrophil isolation, whole bone marrow cells were flushed from the femur, tibia, and ilia leg bones with 5 ml HBSS + 2 mM EDTA + 1% BSA and filtered through a 70 μm cell strainer. Cells were centrifuged for 10 min at 500 x g. Red blood cells were lysed with 1 ml ACK lysis buffer for 2 min at room temperature (RT) and washed twice with HBSS + 2 mM EDTA + 1% BSA and re-suspended in 200 μl PBS + 1% BSA. c-kit-positive bone marrow cells were first enriched by positive selection using c-kit (CD117) microbeads (Miltenyi Biotec, Bergisch Gladbach, Germany) and further purified by FACS sorting c-kit-positive cells. To isolate spleen neutrophils, spleens were dissected, placed in 3 ml PBS + 1mM EDTA, and then gently disaggregated through a 70 μm cell strainer using a 1 ml syringe plunger. Whole spleen cells were collected, centrifugated, and resuspended in 1 ml PBS + 1mM EDTA. The red blood cells were then lysed with 5 ml ACK lysis buffer for 2 min at room temperature. After centrifugation, cells were washed twice with PBS + 1 mM EDTA and re-suspended in 500 μl PBS + 1% BSA. Finally, peritoneal cavity exudate cells were harvested by three successive washes with 10 ml HBSS + 15 mM EDTA + 1% BSA. After centrifugation, cells were washed twice with the same solution and re-suspended in 100 μl PBS + 1% BSA.
Human sample collection
Peripheral blood (10 ml) was collected from healthy donors into heparin anticoagulant tubes54. An equal volume (10 ml) of 6% hydroxyethyl solution was added into the heparinized blood and inverted gently several times for adequate mixing. The blood was kept at RT for 20–30 min before pipetting the supernatant into a 50 ml Falcon tube followed by centrifugation at 290 x g for 5 mins without braking. Cells were washed twice and lysed with ACK to completely remove red blood cells. Samples were stained with Percp-cy5.5-conjugated anti-human CD33 antibody for 20 min and DAPI was added to cells prior to sorting by FACS with a FACSAria III cell sorter (BD Biosciences, Franklin Lakes, NJ). The Ethics Committee of Tianjin Blood Disease Hospital approved the study protocol, and the donor provided written informed consent for sample collection and data analysis.
Single cell collection, library construction, and sequencing
Single cell suspensions were stained for 30 min at 4°C with fluorophore-conjugated antibodies (APC/CY7-conjugated anti-Gr1, FITC-conjugated-anti-CD45), filtered through 40 μm cell strainers, and DAPI was added prior to sorting by FACS with a FACSAria III cell sorter (BD Biosciences). For mouse cells, designated cells were sorted into PBS containing 0.05% BSA following the 10X Genomics protocol. Cell preparation time before loading onto the 10X Chromium controller was <2 h. Cell viability and counting were evaluated with trypan blue by microscopy, and samples with viabilities >85% were used for sequencing. Libraries were constructed using the Single Cell 3’ Library Kit V2 (10X Genomics, Pleasanton, CA). Transcriptome profiles of individual cells were determined by 10X genomic-based droplet sequencing. Once prepared, indexed cDNA libraries were sequenced with paired-end reads on an Illumina NovaSeq6000 (Illumina, San Diego, CA). For human cells, the sample preparation, library construction, and single cell sequencing were performed using a BD Rhapsody™ Single-Cell Analysis System following a standard protocol provided by the manufacturer (BD Biosciences).
Bulk RNA isolation and sequencing
BM cells were prepared as previously described55. BM cells were first stained with: biotin-conjugated anti-CD4; biotin-conjugated anti-CD8a; biotin-conjugated anti-Ter119; and biotin-conjugated anti-B220/CD45R antibodies for 20 min and then stained with PE/cy7-conjugated streptavidin; APC-conjugated anti-c-kit; PE-conjugated anti-Ly6G; FITC-conjugated anti-CD34 antibodies for 90 min at 4°C. MB, PM, MM, MC, mature band, and segmented neutrophils were sorted with a Moflo cell sorter (Beckman Coulter, Brea, CA). Total RNA was extracted from those populations using the Qiagen RNeasy Mini Kit (Qiagen, Hilden, Germany). RNA quality was evaluated spectrophotometrically, and the quality was assessed with the Agilent 2100 Bioanalyzer (Agilent Technologies, Santa Clara, CA). All samples showed RNA integrity >7.5; RNA-seq libraries were prepared using the KAPA mRNA HyperPrep Kit (Illumina). Once prepared, indexed cDNA libraries were pooled in equimolar amounts and sequenced with paired-end reads on an Illumina HiSeq2500.
Wright-Giemsa staining and examination of morphology-defined neutrophil populations
The first recognizable cells of neutrophil lineage in the BM are myeloblasts (MBs), which are characterized by a high nuclear-to-cytoplasmic (NC) ratio and dispersed chromatin. MBs then irreversibly differentiate into promyelocytes (PMs), which are characterized by a round nucleus and azurophil granules, followed by myelocytes (MCs) characterized by a round nucleus and specific granules. Metamyelocytes (MMs) are characterized by nuclear indentations (kidney-shaped nuclei) and the emergence of secretary vesicles. Finally, MMs are divided into band cells (BCs) with a band-shaped nucleus and segmented cells (SCs, aka polymorphonuclear granulocytes) with a segmented nucleus. Cells were sorted (Fig. 2d) and concentrated onto microscope slides by cytospinning. Slides were dried and stained using the Diff-Quick Stain Set (Siemens, Munich, Germany). Stained slides were rinsed under running tap water and air-dried for 10 min. Images were obtained under a microscope with a 63x objective.
EDU incorporation assay
5-ethynyl-2´-deoxyuridine (EdU), a thymidine analogue, can track cells post-mitotically in the BM and PB (Fig. 7e). EdU is incorporated into DNA in the S-phase of the cell cycle, and the half-life of EdU is only about 30 min, so incorporation can only occur in the first 1–2 h after EdU intraperitoneal injection. After 1 h of i.p. injection with 0.5 mg EdU, mice were injected with E. coli as above to induced peritonitis. Mice were sacrificed at designated timepoints, and BM, blood, and spleen cells were harvested followed by staining with fluorescent-conjugated antibodies: APC-conjugated anti-CD11b; APC/cy7-conjugated anti-Ly6G; and PE-conjugated anti-CXCR4 antibodies. Labeled cells were fixed, permeabilized, and stained with azide dye using an EdU Proliferation Kit (BD Biosciences). Cells were further washed and analyzed using a BD FACSCanto II (BD Biosciences). Data were analyzed using FlowJo software (FloJo, BD Biosciences).
Spleen cryosection preparation
Spleens were fixed in 1% formaldehyde (StatLab, McKinney, TX) for 4–8 h, rehydrated in 30% sucrose solution for 72 h, and snap frozen in OCT (Sakura Finetek, Japan). Single-cell-thick (5 μm) spleen cryosections were obtained using a Leica Cryostat and the CryoJane tape transfer system (Leica Microsystems, Wetzlar, Germany). For immunofluorescent staining, slides were rehydrated in PBS for 10 min followed by rinsing in PBST (PBS + 0.1% Tween20); blocking was performed with PBS + 10% donkey serum for 20 min; the diluted primary rat anti-S100a8 (Thermo Fisher Scientific #335806) and rabbit anti-IFIT1 (Abcam, Cambridge, UK #ab236256) antibodies were added and incubated for 1 h at RT. After 3x washes with PBST, AlexaFluor 488-conjugated donkey anti-rat antibody (Jackson ImmunoResearch, West Grove, PA #141697) and Cy™3-conjugated donkey anti-rabbit antibody (Jackson ImmunoResearch #143460) were added and incubated for 30 min at RT. Slides were washed 3x with PBST and then stained with DAPI (0.5 μM) for 3 min. Slides were rinsed in PBS and were covered with mounting solution (Vectashield, Vector Laboratories, Burlingame, CA).
Laser scanning cytometry (LSC)
Laser scanning cytometer (LSC) is an emerging technology that images and quantitatively analyzes cellular and subcellular criteria within tissues, re-interrogating identified cell subpopulation(s) for in situ characterization of the molecular and cellular events associated with those cells. LSC was performed with an iCys Research Imaging Cytometer four-laser system (Thorlabs, Newton, NJ)43. Each section was first scanned with a 10x objective using the 405 nm laser to generate low-resolution images of the DAPI-stained nuclei and obtain a general view of the spleen. Subsequently, the sections were divided into small regions and scanned with a 40x dry objective lens to create high-resolution field images. Data were analyzed using iCys Cytometric Analysis Software (Thorlabs).
Confocal imaging
20 μm thick sections were prepared and stained as described above. Confocal images were obtained using the Zeiss LSM 700 Laser Scanning Confocal microscope (Carl Zeiss AG, Oberkochen, Germany). Data were analyzed using Imaris Software (Oxford Instruments, Abingdon, UK).
Intracellular protein staining for FACS analysis
Peripheral blood and spleen cell suspensions were prepared as described above. After being washed with PBS twice, cells were blocked with rat anti-mouse CD16/CD32 antibody on ice for 10 min. APC-conjugated anti-CD45, APC/cy7-conjugated anti-CD11b, PE-conjugated anti-Ly6G, and BV711-conjugated anti-CXCR4 antibodies were added and incubated for 20 min at 4°C in dark. Cells were washed with PBS twice, fixed and permeabilized with 1 ml PBS containing 4% PFA (Electron Microscopy Sciences) and 0.1% saponin (Sigma-Aldrich) at 4°C for 30 min, and pelleted by centrifugation at 3000g for 3 min at 4°C. After being washed with 1 ml Wash Buffer (PBS containing 0.2% BSA and 0.1% saponin), cells were blocked for 30 min with blocking buffer (PBS containing 5% goat serum and 5% BSA) and then stained with anti-IFIT1/p56 antibody (Sigma) for 30 min at 4°C in 200 μl staining buffer (PBS containing 5% goat serum, 5% BSA, and 0.1% saponin). Cells were washed twice with 1 ml Wash Buffer followed by incubation with the secondary goat anti-rabbit-Alexa Fluor 488 antibody (Invitrogen) in staining buffer for 30 min. Cells were then washed with 1 ml Wash buffer and resuspended in 1 ml PBS containing 0.5% BSA. The stained cells were either sorted with a FACSAria III cell sorter (BD Biosciences, Franklin Lakes, NJ) or analyzed on a Attune NxT Flow Cytometer (ThermoFisher). Fixation, washing, staining and sorting were performed at a concentration of 5–10 × 106 cells/ml.
RNA purification, cDNA synthesis and preamplification, and qPCR
Total RNA was extracted from sorted fixed cells using a RecoverAll Total Nucleic Acid Isolation kit (ThermoFisher), starting at the protease digestion stage of manufacturer-recommended protocol. The following modification to the isolation procedure was made: instead of incubating cells in digestion buffer for 15 min at 50°C and 15 min at 80°C, we carried out the incubation for 3 hours at 50°C. The cDNA was subsequently generated using a PrimeScript RT Master Mix (Perfect Real Time) (Takara Bio Inc.), and then subjected to 14 cycles of preamplification using a Prelude PreAmp Master Mix (Takara Bio Inc.) according to the manufacturer’s recommendations. The pre-amplified cDNA was subjected to qPCR in which the amplified product was detected using TB Green® Premix Ex Taq™ (Tli RNase H Plus) (Takara Bio Inc.) on a CFX96 Real-Time PCR Detection System (Bio-Rad). ΔCt was calculated using GAPDH as a normalizer. The sequences of qRT-PCR primers are listed in Supplementary Table 8.
scRNA-seq data processing
The quality of sequencing reads was evaluated using FastQC and MultiQC. Cell Ranger v2.2.0 was used to align the sequencing reads (fastq) to the mm10 mouse transcriptome and quantify the expression of transcripts in each cell. This pipeline resulted in a gene expression matrix for each sample, which records the number of UMIs for each gene associated with each cell barcode. For human data, sequenced reads were aligned to the hg38 human transcriptome, then quantify the expression of transcripts in each cell using BD™ Rhapsody Whole Transcriptome Assay Analysis Pipeline. Unless otherwise stated, all downstream analyses were implemented using R v3.5.2 and the package Seurat v2.3.456. Due to dissimilar data qualities, low-quality cells were filtered using sample-specific cutoffs (Supplementary Table 1). The NormalizeData function was performed using default parameters to remove the differences in sequencing depth across cells.
For experiment described in Fig 1, cells from four samples were pooled and analyzed together. After rigorous quality control, we obtain 19,582 high-quality cells with average 1,241 genes per cell profiled, resulting in a total of 18,269 mouse genes detected in all cells (Extended Data Fig. 1e). For experiment described in Fig 5, after excluding low-quality cells, a total of 25,897 cells, including 4421 cells from the BM (eBM_Gr1), 6232 cells from the PB (ePB_Gr1), 5989 cells from the SP (eSP_Gr1), 4435 cells from the liver (eLV_Gr1), and 4169 cells from the peritoneal cavity (ePC_Gr1) were available for analysis (Extended Data Fig. 6e-f).
Batch correction
There was substantial variability between cells obtained from different samples, likely reflecting a combination biological and technical differences. In this case, the batch had little effect on partitioning cell types and thus cell clustering into neutrophils, B cells, T cells, monocytes, dendritic cells, erythrocytes, and progenitors. However, when clustering neutrophils alone, cells clustered first by sample rather than by biological clusters. Therefore, the ScaleData function was used to eliminate cell-cell variation in gene expression driven by batch and mitochondrial gene expression. Importantly, the batch-corrected data were only used for principal component analysis (PCA) and all steps relying on PCA (e.g., clustering, UMAP visualization); all other analyses (e.g., differential expression analysis) were based on the normalized data without batch correction.
Dimension reduction
Dimension reduction was performed at three stages of the analysis: the selection of variable genes, PCA, and uniform manifold approximation and projection (UMAP)57. The FindVariableGenes function (y.cutoff = 1 for control total cells; y.cutoff = 1.2 for control neutrophils; y.cutoff = 0.7 for E. coli-challenged total cells) was applied to select highly variable genes covering most biological information contained in the whole transcriptome. Then, the variable genes were used for PCA implemented with the RunPCA function. Next, we selected PCs 1–20 (for total cells) or 1–15 (for neutrophils) as input to perform the RunUMAP function to obtain bidimensional coordinates for each cell.
Unsupervised clustering and annotation
We performed the FindClusters function (resolution 0.3, 0.6, and 0.2 for control total cell, neutrophils, and E. coli-challenged total cells, respectively) to cluster cells using the Louvain algorithm based on the same PCs as RunUMAP function. Clusters G1 to G5 were neutrophils at different maturation stages. G1 and G2 were early-stage neutrophils with higher expression of Elane, Mpo, Fcnb, and Camp (Fig. 1d–e). Neutrophils are terminally differentiated. The transition from a proliferative cell to terminal differentiation was accompanied by a dramatic change in expression of important cell-cycle regulatory proteins, so we next performed a single-cell resolution analysis of cell cycle activation during neutrophil differentiation based on the expression of G1/S and G2/M phase-specific genes58, 59 (Fig. 1i). Cells in the G0 to G2 stages underwent active proliferation, while cell division stopped abruptly thereafter. CDC28 Protein Kinase Regulatory Subunit 2 (CKS2), Mki67, and Cdc20 were all strongly downregulated at the mRNA level.
Identification of differentially expressed genes
We used the FindMarkers or FindAllMarkers function (test.use = “t”, logfc.threshold = log(1.5)) based on normalized data to identify differentially expressed genes (DEGs). P-value adjustment was performed using Bonferroni correction based on the total number of genes in the dataset. DEGs with adjusted p-values>0.05 were filtered out. Gene ontology (GO) analysis was performed by using the R package clusterProfiler60. In experiment described in Extended Data Fig. 7, we conducted differential gene expression analysis in each neutrophil subpopulation using the non-parametric Wilcoxon rank sum test and identified DEGs with an average expression fold-change >2.
Developmental trajectory inference
Pseudotime was generated with Monocle v218 to infer the potential lineage differentiation trajectory. The newCellDataSet function (lowerDetectionLimit = 0.5, expressionFamily = negbinomial.size) was used to build the object based on the above highly variable genes identified by Seurat v2.3.4.
Bulk RNA-seq analysis
The quality of sequencing reads was evaluated using FastQC and MultiQC. Adaptor sequences and low-quality score bases were trimmed using trimmomatic/0.36. The resulting reads were then mapped to the mouse reference sequence (GRCm38/mm10, Ensembl release 81) and counted using STAR2.5.2b alignment software. Gene differential expression analysis was performed using the R package EdgeR.
Scoring of biological processes
Individual cells were scored for their expression of gene signatures representing certain biological functions. For all signatures except neutrophil aging, functional scores were defined as the average normalized expression of corresponding genes. Aging score was defined as the weighted average of Z-scores of age-related genes, where the Z-scores were calculated by scaling the normalized expression of a gene across all cells. Gene weights were set to either 1 or −1 to reflect positive or negative relationships. The neutrophil maturation signature was derived by identifying the top 50 DEGs (these genes were listed in Supplementary Table 4) with highest fold changes and adjusted p-values <0.05 between mature cluster (G4) and immature clusters (G0-G3). Granule signatures were from20. Other functional signatures were derived from the GO database61, with the full gene list provided in Supplementary Table 4. For instance, to access the phagocytosis function at the transcript level, we determined a “phagocytosis score” by calculating the average expression of genes in the GO term “phagocytosis, engulfment” (GO:0006911). Apoptosis score was measured by the upregulation of the integrated proapoptotic pathway (Fig 4b). To further dissect apoptotic heterogeneity in G5 populations independently of transcriptome-based sub-clustering, we fit a two-component Gaussian mixture model to the apoptotic score of all G5 cells using the R package mixtools version 1.1.062. We then chose the distribution with the higher mean as the apoptotic group and assigned each cell to one of the two groups based on its posterior (Fig 4c).
Age-related genes were summarized from the previous literature (Fig 2i). Aging is a main mechanism that accounts for neutrophil heterogeneity7, 63: aged neutrophils are smaller with fewer granules and granular multi-lobed nuclei and produce more NETs. Related to function, aged neutrophils express less adhesion molecule L-selectin (CD62L, encoded by Sell) and more CD11b (αM, encoded by Itgam), lymphocyte function-associated antigen-1 (CD11a/β2), CD49d (integrin α4, encoded by Itga4), TLR4, ICAM-1, CD44, and CD11c (encoded by Itgax). Additionally, aged neutrophils express more surface CXCR4 and less CXCR2, which regulates their release from and return to the BM. CXCR4 may also play a role in clearing aged, senescent neutrophils, particularly at BM sites. Anti-CXCR4 antibodies or CXCR4 antagonists impede neutrophil homing to the BM64, 65. Finally, aged neutrophils exhibit increased expression of CD24, a GPI-linked glycoprotein which induces apoptosis when crosslinked and reduced expression of CD47, the “don’t eat me” signal that inhibits efferocytosis, a process leading to clearance of dead neutrophils.
ROS-mediated pathogen killing is a major host defense mechanism. In neutrophils, ROS are mainly produced by the phagocytic NADPH oxidase (aka the NOX2 complex). During cell activation, cytosolic components of the NADPH oxidase NCF2 (p67phox), Rac1 and/or Rac2, NCF4 (p40-phox), and NCF1 (p47phox) are recruited to the membrane to form a complex with membrane proteins CYBA (p22-phox) and CYBB (gp91 or cytochrome-b 558 subunit beta). We evaluated the “NADPH oxidase score” based on the expression of the seven NADPH oxidase-related genes (Fig S6d).
Comparison of scRNA-seq-defined populations with morphology-defined neutrophil subpopulations
To benchmark single-cell transcriptomic neutrophil classification against existing morphological classification schemes, we deconvoluted bulk RNA-seq profiles based on expression of scRNA-seq-identified group-specific signatures. This approach was similar to other existing deconvolution methods like CIBERSORT66, but we used a linear regression model with the constraint of non-negative coefficients (i.e., non-negative least-squares problem) instead of the linear support vector regression in CIBERSORT. Although we manually chose 20 genes with highest fold-changes as signatures for each single cell group, we noted that the deconvolution in our case was robust to the choice of signatures. The regression model was built using R package nnls version 1.467. Bulk profiles were quantile normalized.
At different morphology-defined neutrophil differentiation stages, neutrophils produce different granules containing distinct enzymes and antimicrobial compounds. Thus, we also examined the expression of various granule genes in differentiating neutrophils. Genes related to primary (azurophilic) granules such as Mpo started to be expressed in some G0 cells, peaked in G1 cells, and then rapidly decreased in G2 cells (Fig. 2a–b). MPO-negative granules can be divided into granules containing lactoferrin (LTF) but no gelatinase (MMP9), granules that contain both, and granules that contain gelatinase but no lactoferrin68. We found sequential production of these granules in maturing neutrophils, with lactoferrin-containing granules emerging in G2 cells, lactoferrin and gelatinase-containing granules emerging in G3 cells, and gelatinase-containing granules (Ltf low) emerging in G4 cells (Fig. 2a–c). Of the proteins that localize exclusively to secretory vesicles such as Frp1 and Vamp2, their cognate mRNA profiles peaked in G4 cells in the BM and continued to be expressed in PB neutrophils.
SCENIC analysis
SCENIC is a computational tool that infers regulatory modules or regulons by analyzing co-expression of transcription factors (TFs) and their putative target genes characterized by enrichment of corresponding TF-binding motifs in their regulatory regions40. Regulatory network analysis was performed on all control and E. coli-challenged samples using Python package pySCENIC version 0.9.1140 with default parameters. We scaled the network inference step by first inferring regulons on a 6000-cell subset, then calculated AUCell scores for all 32,888 cells included in this analysis. Specifically, we randomly sampled 300 cells from each neutrophil population in each condition and 1200 non-neutrophil cells as the training set for network inference. Output co-expression modules were trimmed with cisTarget databases (mm10_refseq-r80_500bp_up_and_100bp_down_tss, mm9-tss-centered-10kb-7species, and mm9–500bp-upstream-10species). The identified 413 regulons were then scored to determine their activities in each cell. K-means clustering was performed on the first 20 principle components (PCs) of regulon activity matrix with cluster number k = 7.
Differential activity analysis of SCENIC regulons
To assess the effect of biological conditions on regulon activity, we applied a generalized linear model (GLM) as reported in41. We compared the AUCell score of each regulon with different baseline clusters corresponding to different biological questions like neutrophil cluster transition and infection response. GLM results were further filtered by p-values and visualized using R package ComplexHeatmap69.
RNA velocity analysis
Cell RNA velocity analysis was performed using Velocyto program70. This approach uses the relative proportion of unspliced and spliced mRNA abundance as an indicator of the future cell state34. The calculated RNA velocity is a vector that predicts individual cell transition, with the direction and speed of each transition assessed based on the amplitude and direction of individual cell velocity arrows on the UMAP plot. Accordingly, the hierarchical relationship between two cell populations can be inferred by the directional flow in the RNA velocity vector field. Annotation of spliced and unspliced reads was first performed using velocyto.py command-line tools. Then, downstream analysis was performed using the velocyto.R pipeline. We retained the genes expressed in at least one cell population. In total, 4815 genes were used for the analysis. RNA velocities of each cell were estimated using the gene.relative.velocity.estimates function. Finally, the velocity field was projected onto the existing UMAP space.
Cell label transfer
Total cells were partitioned into distinct cell types annotated by the expression of known marker genes. Neutrophils in their steady state were partitioned into eight clusters based on gene expression profiles annotated according to their development order. E. coli-challenged neutrophils were annotated using a well-accepted method42 . Briefly, we first identified pairwise correspondences (aka anchors) between single cells across datasets (before and after E. coli challenge) to quantify the batch effect. Each cell in the E. coli-challenged dataset was then annotated based on the transcriptomic similarity between this cell and cells in the reference dataset. Specifically, cells would receive corresponding labels with the highest similarity scores, whereas cells with the highest similarity score lower than 0.5 were defined as “unassigned”. The unassigned cells counted for less than 10% of the total cell population, distributed randomly on the UMAP plot, and thus were excluded from further investigation. In this way, each neutrophil from the new stimulated dataset was assigned a cluster name, and neutrophils sharing similar transcriptomic profiles would be placed into the same cluster. Hence, each cell in the bacterial infection state was assigned to one of the nine cluster labels. This transfer procedure was implemented using the FindTransferAnchors (dims = 1:15) and TransferData (dims = 1:15) functions in Seurat v3.0.242 with the combination of top 100 DEGs of each cluster.
Correlation of scRNA-seq defined neutrophil populations with previously reported neutrophil subpopulations
Previous studies revealed a variety of distinct BM neutrophil subpopulations arising during differentiation and maturation. Using single-cell RNA sequencing coupled with a new analytic tool, iterative clustering and guide-gene selection (ICGS), and clonogenic assays, Olsson et al. analyzed discrete genomic states and the transitional intermediates that span myelopoiesis25. They performed single-cell RNA sequencing on stem/multipotent progenitor cells (LSK), common myeloid progenitor (CMP) cells, granulocyte monocyte progenitor (GMP) cells, and LK CD34+ cells (lin−c-Kit+CD34+) that included granulocytic precursors. We calculated the fraction of each scRNA-seq defined cluster in the four samples. Each cell in these samples was annotated using the cell label transfer method described above. The cluster identity of each cell was inferred based on the transcriptomic similarity between this cell and the reference clusters (G0-G5) defined in current study. This same method was used to analyze the C1 and C2 neutrophil clusters reported by Zhu et al.27. Recently, a proliferative unipotent neutrophil precursor (NeP) that suppresses T cell activation and promotes tumor growth was identified in the mouse bone marrow that generates neutrophils after intra-bone marrow adoptive transfer. scRNA-seq analysis of BM Lin−ckit+Ly6A/E−Ly6G+/low cells revealed two populations: an early-stage ckit+Gfi1lowCebpahiLy6G−/low progenitor with stem cell morphology (C1) and a late-stage ckit+Gfi1hiCebpalowLy6G+ precursor with morphological features similar to transient neutrophil precursors (C2)27. Further analysis demonstrated that Cluster C1 is the early-stage committed unipotent NeP. Interestingly, the late-stage progenitors were mostly similar to the preNeu population identified by Evrard et al.27. In current study, the raw data related to C1 and C2 cells was retrieved and reanalyzed. We annotated each cell as described above, and performed t-distributed stochastic neighbor embedding (t-SNE) and clustering using the same arguments as in the original publication27 (12 first PCA, resolution parameter set at 0.03).
Using mass cytometry (CyTOF) and cell cycle-based analysis, Evrard et al. identified three neutrophil subsets within the bone marrow: committed c-Kitlow/int proliferative neutrophil precursors expressing primary and secondary granule proteins (pre-neutrophils or preNeu), CXCR2low non-proliferating immature neutrophils highly expressing secondary granule proteins (immature neutrophils), and CXCR2high mature neutrophils highly expressing gelatinase granule proteins (mature neutrophils)26. To reveal the correlation of these neutrophil subtypes with scRNA-seq defined neutrophil populations, we applied the same regression-based deconvolution approach used for comparing scRNA-seq-defined populations with morphology-defined neutrophil subpopulations (see above). We deconvoluted bulk RNA-seq profiles of BM GMP, preNeu, immature neutrophils, and mature neutrophils, as well as PB neutrophils based on their expression of scRNA-seq-identified group-specific signatures. The 20 highest DEGs of each single-cell group (G0-G5) were selected as signatures for deconvolution.
Finally, Giladi et al, also defined two BM neutrophil subpopulations13. c-Kit+ Stage I neutrophils express a set of genes used to approximate the neutrophil differentiation axis, while Stage II neutrophils display mature neutrophil signature defined by genes upregulated in the most terminally differentiated neutrophils. The initial increase in differentiation of Stage I neutrophils is independent of PU.1, but further neutrophil maturation and activation of stage II genes is completely blocked in PU.1 KO13. To reveal the correlation of Stage I and Stage II neutrophils with scRNA-seq defined neutrophil populations, individual cells in each scRNA-Seq defined neutrophil clusters were scored for their expression of Stage I and Stage II gene signatures13. The Stage I and Stage II scores were defined as the average normalized expression of corresponding genes.
Statistical analyses
For most experiments, comparisons were made using a 2-tailed, unpaired, Student’s t-test. Values shown in each figure represent mean ± SD. A p-value<0.05 was considered statistically significant. Experiments were repeated at least three times. All statistical analyses and graphics were made using GraphPad Prism (GraphPad, San Diego, CA) and R (The R Project for Statistical Computing).
Extended Data
Extended Data Fig. 1. Sample preparation, quality controls, and related parameters and results related to scRNA-seq analysis.
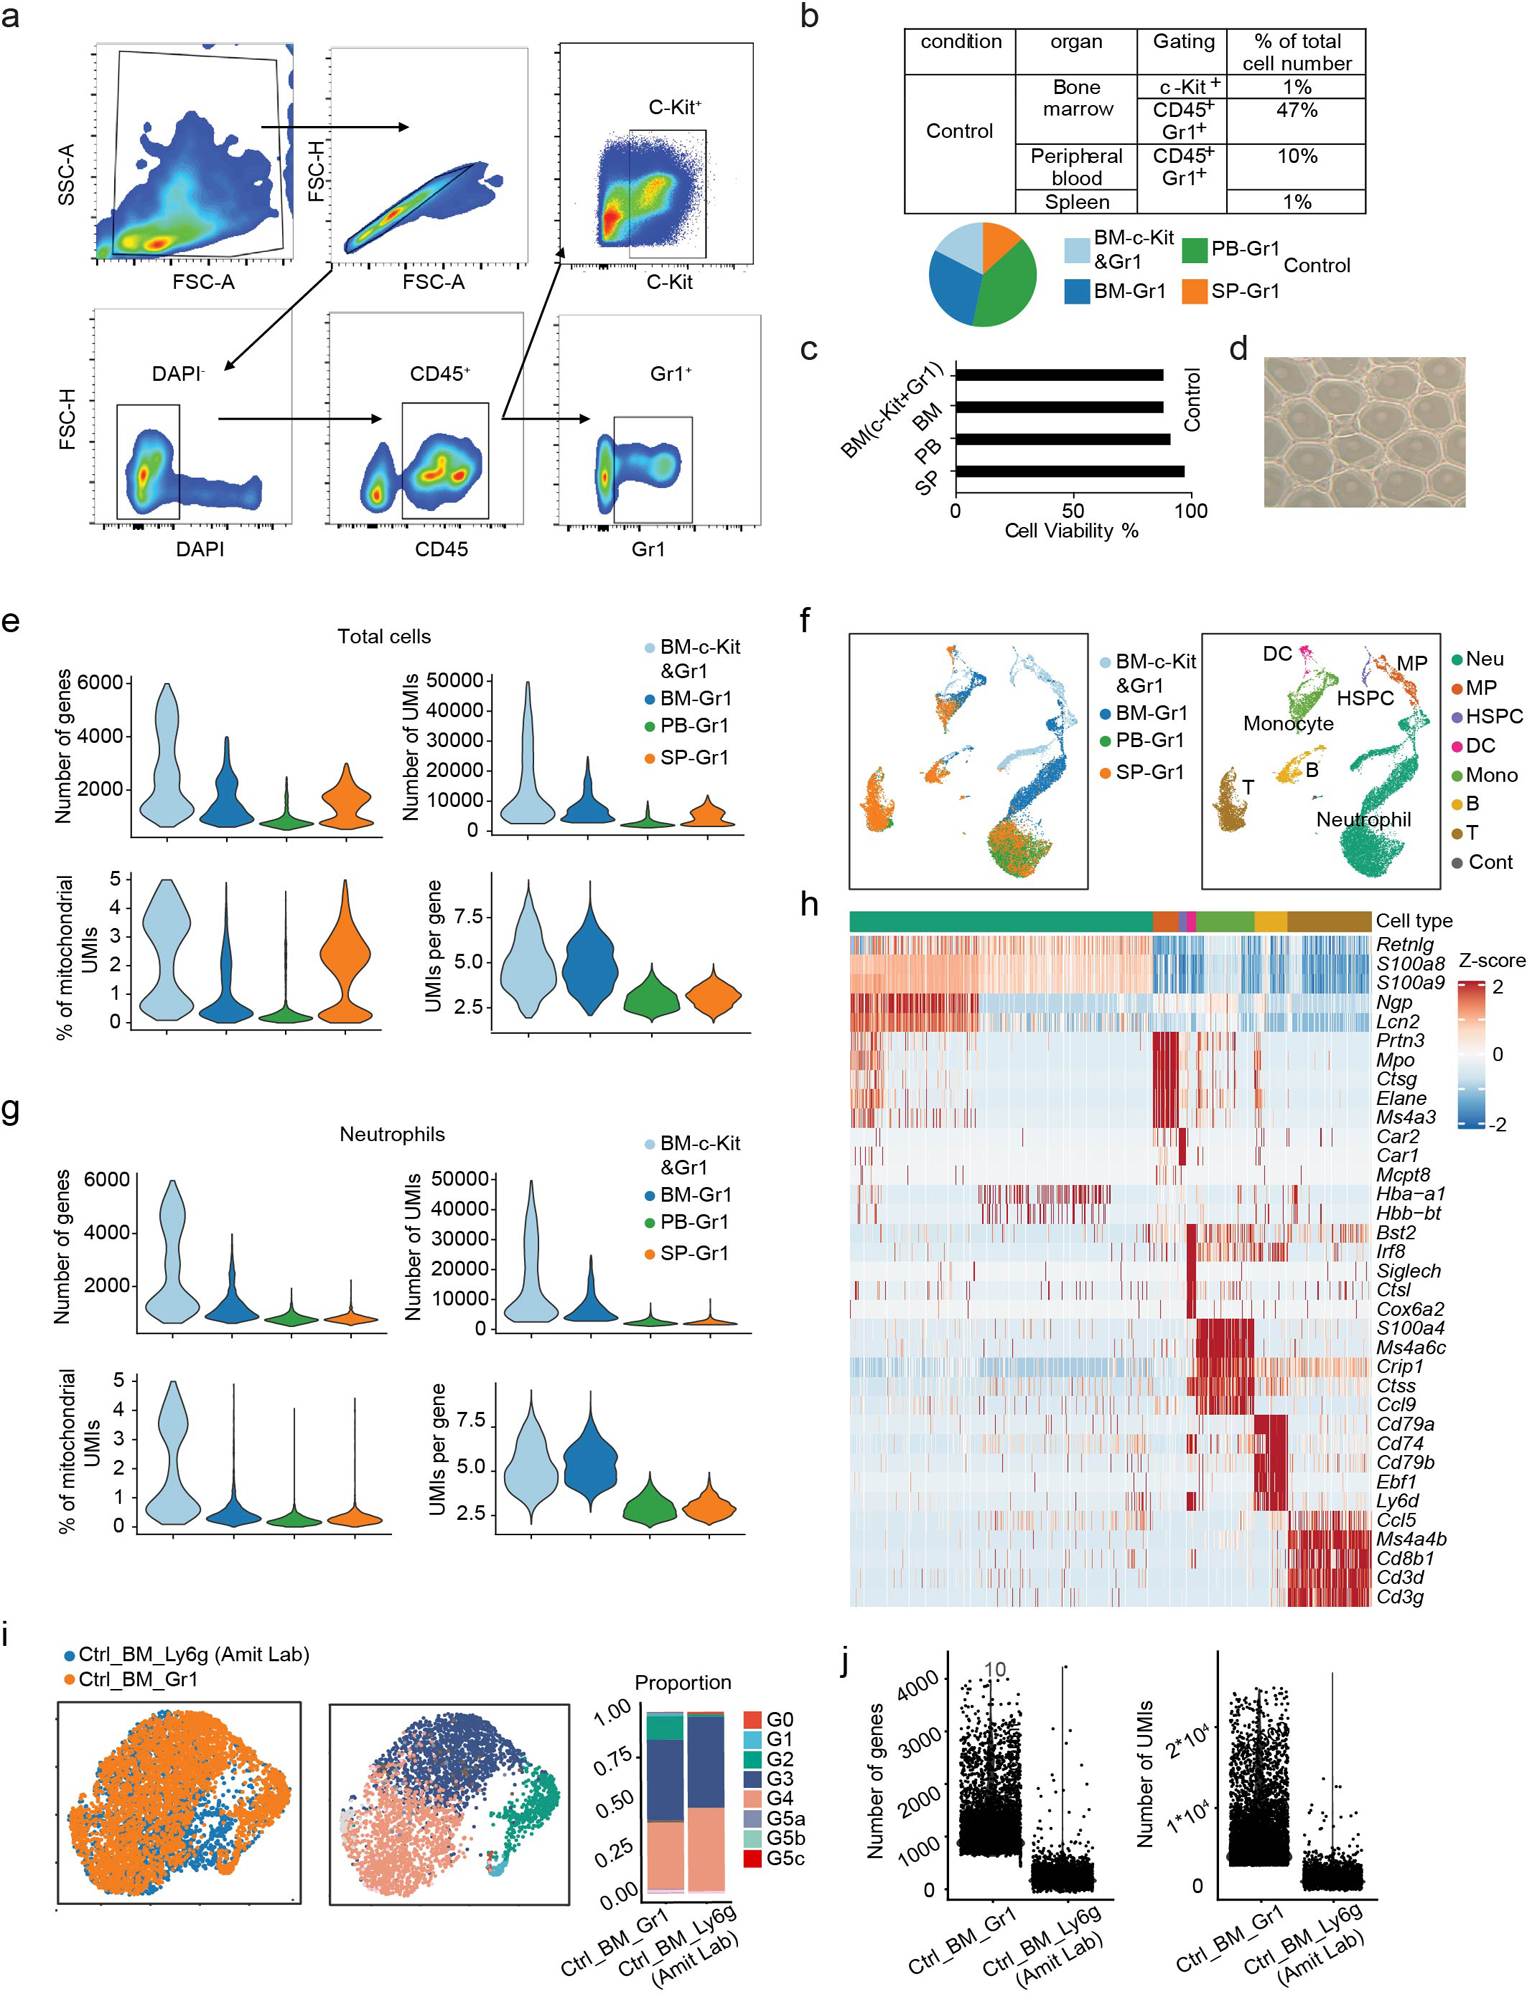
a, Fluorescence-activated cell sorting (FACS) strategy for scRNA-seq sample preparation.
b, Summary of sample information.
c, Cell viability percentages immediately before cells were loaded into the 10X Chromium Controller.
d, Representative GEM formation after the 10X Chromium Controller under the microscope.
e, Violin plots of the number of genes, number of UMIs, mitochondria count percentage, and UMI per gene of all QC-passed cells in different organs.
f, Uniform manifold approximation and projection (UMAP) of 19,582 cells from the bone marrow (BM), peripheral blood (PB), and spleen (SP) colored by sample origin and cell type, respectively. Expression of unique genes specifically distinguished each cluster and associated them with neutrophils (Neu) (S100a8 and S100a9), myeloid progenitors (MP) (Cd34, Kit, Mpo and Elane), hematopoietic stem progenitor cells (HSPC, not including MP) (Cd34, Kit, Mpo- and Elane-), monocytes (Mono) (S100a4 and Ccl9/MIP-1γ), B cells (Cd79a and Cd79b), T cells (Cd3d and Ccl5), and dendritic cells (DC) (Siglech), respectively. Cont: contaminated cells.
g, Heatmap showing the five highest differentially expressed genes (DEGs) per cell type for all QC-passed cells.
h, As in e but using only neutrophils in different organs.
i, Comparison of Gr1+ BM neutrophil populations in our data with Ly6g+ BM neutrophil populations in Dr. Ido Amit’s data. Cluster labels are transferred from our data to Dr. Ido Amit’s data13(Methods). Left: UMAPs of 3591 Gr1+ neutrophils and 2304 Ly6g+ neutrophils colored by data set or cluster identity. Right: Neutrophil compositions in our data and Dr. Ido Amit’s data.
j, Violin plots of the number of genes and number of UMIs of our Gr1+ neutrophils and Dr. Ido Amit’s Ly6g+ neutrophils.
Extended Data Fig. 2. scRNA-seq defined neutrophil populations correlated with previously reported neutrophil subpopulations.
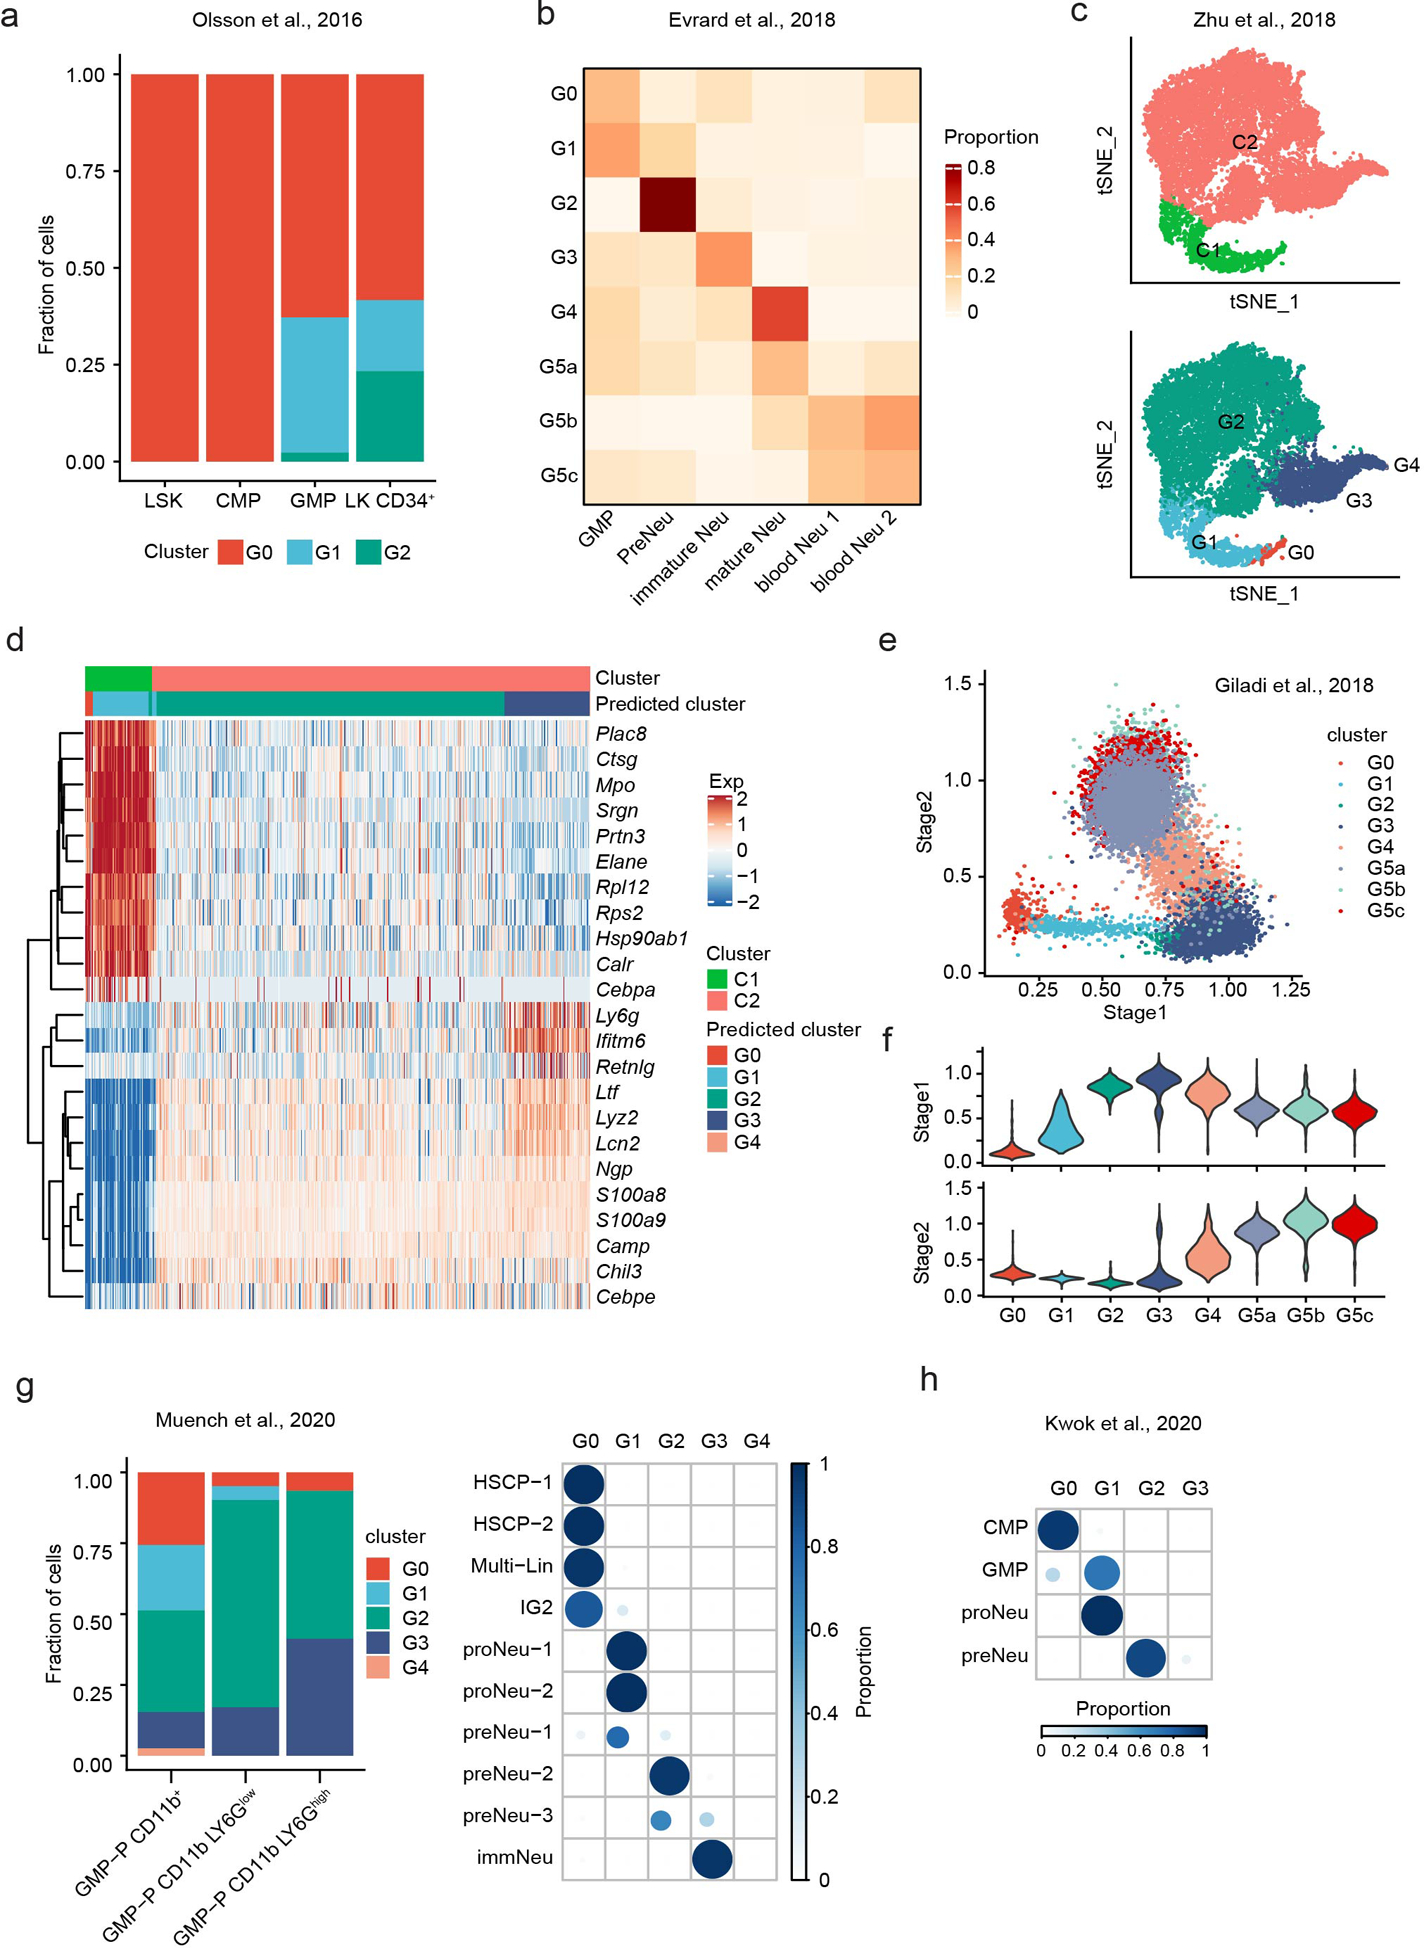
a, Correlation of scRNA-seq defined neutrophil populations with the indicated four samples characterized by Olsson et al.25. Shown are the fraction of each indicated scRNA-seq defined cluster in the four samples. The cluster identity of each cell was inferred based on the transcriptomic similarity between this cell and the reference clusters (G0-G5) defined in current study.
b, Correlation of scRNA-seq defined neutrophil populations with the neutrophil subtypes reported by Evrard et al.26. Coefficient matrix showing deconvolution results of bulk profiles of indicated neutrophil subpopulations. The 20 highest DEGs per single-cell group (G0-G5) were selected as signatures for deconvolution. Each column is normalized by column sums.
(c-d), Correlation of scRNA-seq defined neutrophil populations with the C1 and C2 neutrophil clusters reported by Zhu et al.27.
c, Top: t-distributed stochastic neighbor embedding (t-SNE) plot of the C1 and C2 cells characterized by Zhu et al. The raw data was retrieved from GEO website and reanalyzed. Bottom: t-SNE plot of C1 and C2 cells colored based on scRNA-seq defined clusters (G0-G5). The cluster identity of each cell was determined as described in (A).
d, Heatmap showing row-scaled expression of the 10 highest DEGs of C1 and C2 in indicated scRNA-seq defined clusters. Signature genes Ly6g, Cebpa and Cebpe were also included in the map.
(e-f), Correlation of scRNA-seq defined neutrophil populations with the Stage I and Stage II neutrophils defined by Giladi et al.13.
e, The Stage I (x-axis) and Stage II (y-axis) score of each single cell in the reference sample of current study (Fig.1b). The scRNA-seq defined neutrophil identity of each cell is indicated.
f, Violin plots of Stage I and Stage II score for each scRNA-seq defined neutrophil population.
g, Correlation between scRNA-seq-defined neutrophil populations and the neutrophil subpopulations reported by Muench et al.29 Left: The fraction of indicated scRNA-seq defined clusters (G0-G5) in samples characterized by Muench et al. Right: The fraction of indicated scRNA-seq defined clusters (G0-G5) in each neutrophil subtype. Each row is normalized by row sums. The cluster identity of each cell was determined as described in (a).
h, Correlation between scRNA-seq-defined neutrophil populations and the neutrophil subpopulations reported by Kwok et al.30 Shown are the fraction of indicated scRNA-seq defined clusters in each neutrophil subtype. Each row is normalized by row sums.
Extended Data Fig. 3. Three major neutrophil subpopulations, including an ISG-expressing G5b population, were identified in the PB and spleen.
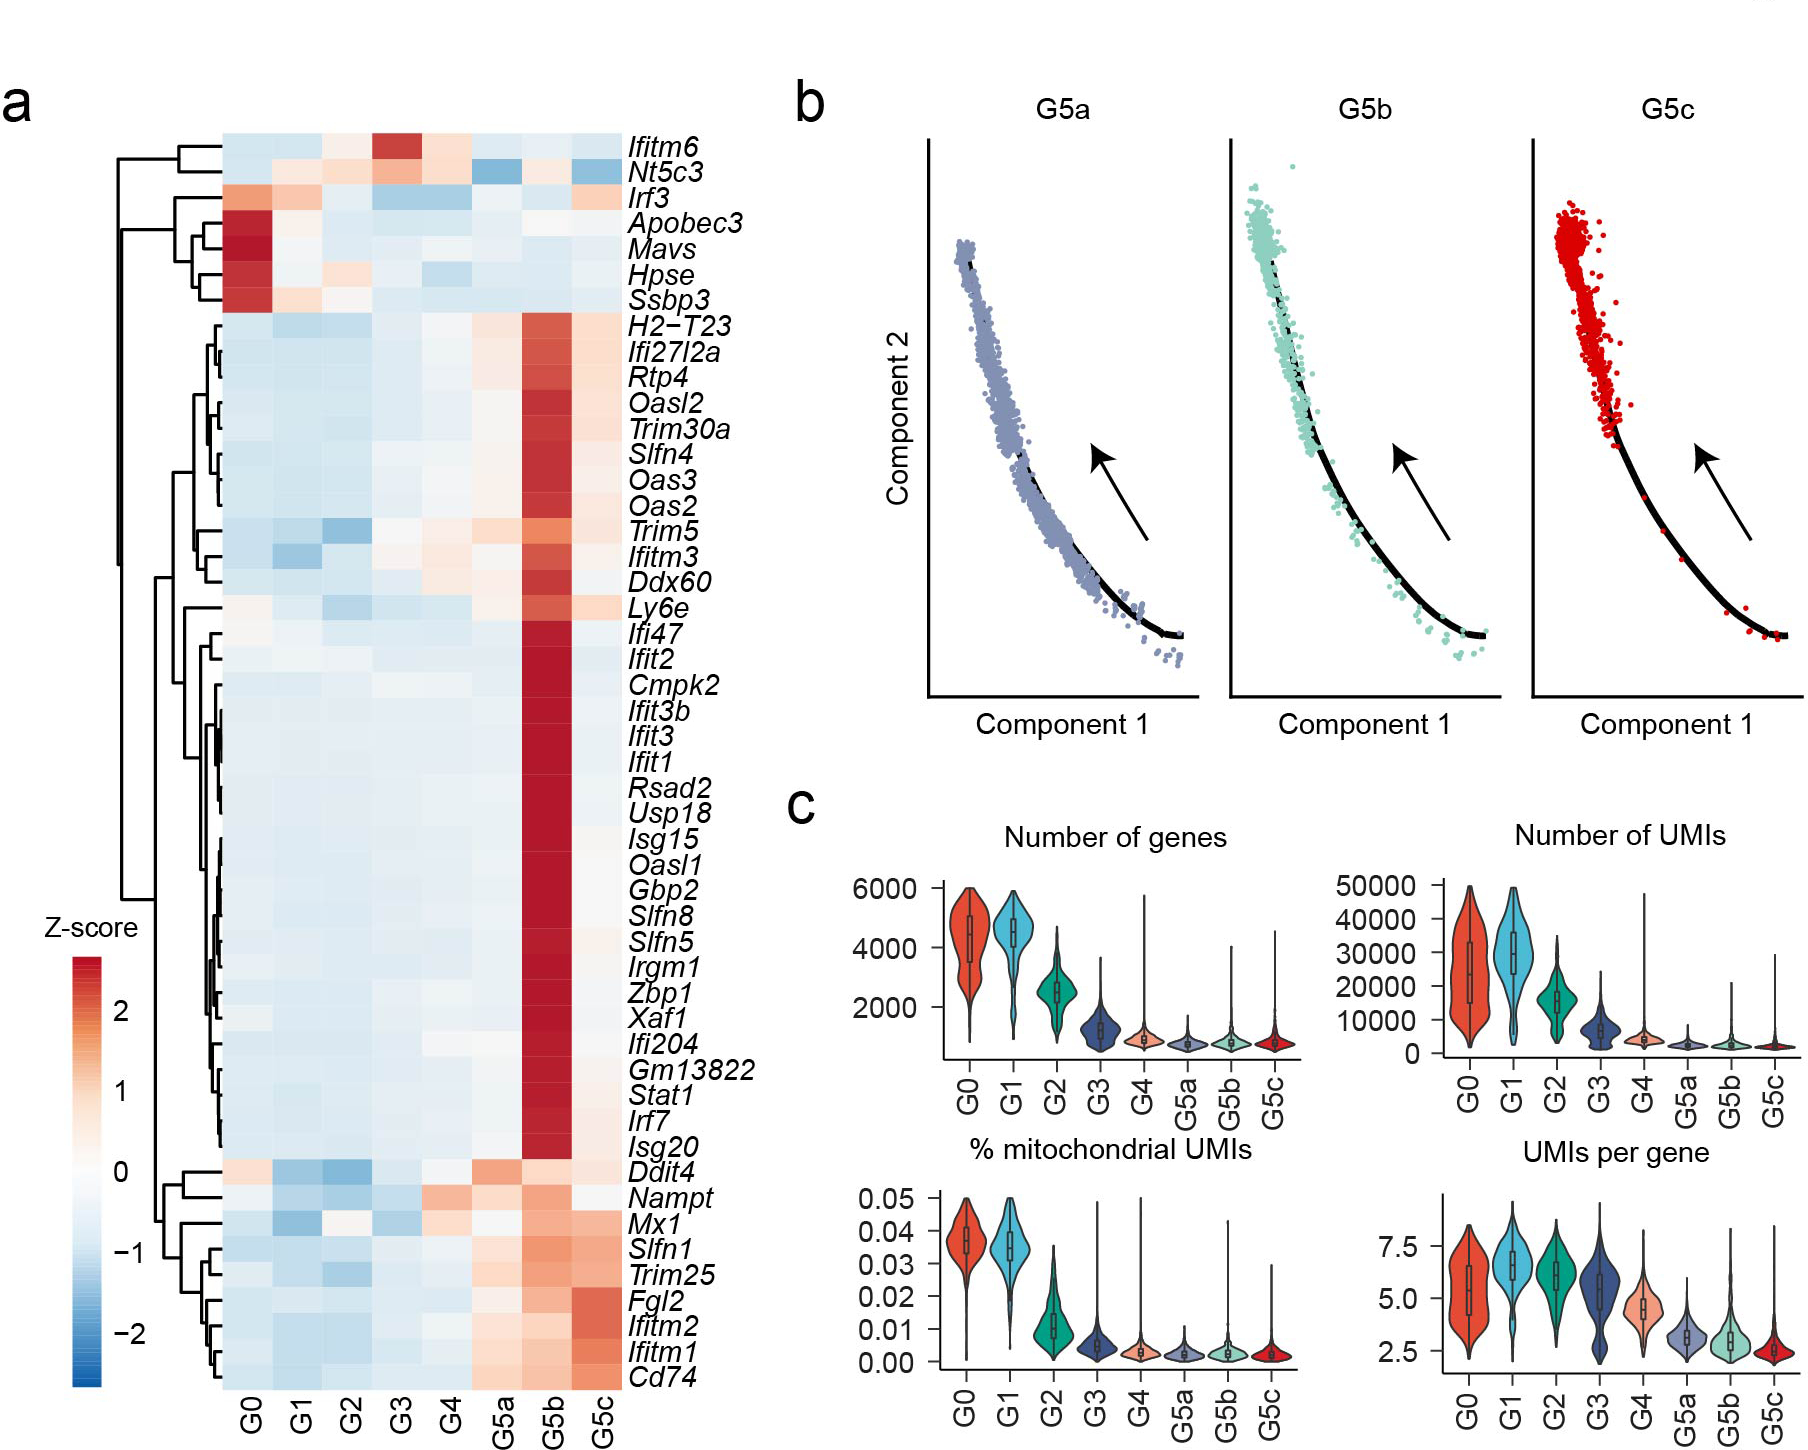
a, Heatmap showing row-scaled expression of 47 interferon-stimulated genes (ISGs) for each averaged cluster.
b, Monocle trajectories of neutrophil population G5a, G5b, and G5c. Each dot represents a single cell.
c, Violin plots of the number of genes, number of UMIs, mitochondria count percentage, and UMI per gene of neutrophils in each cluster.
Extended Data Fig. 4. Characterization of neutrophil subpopulations.
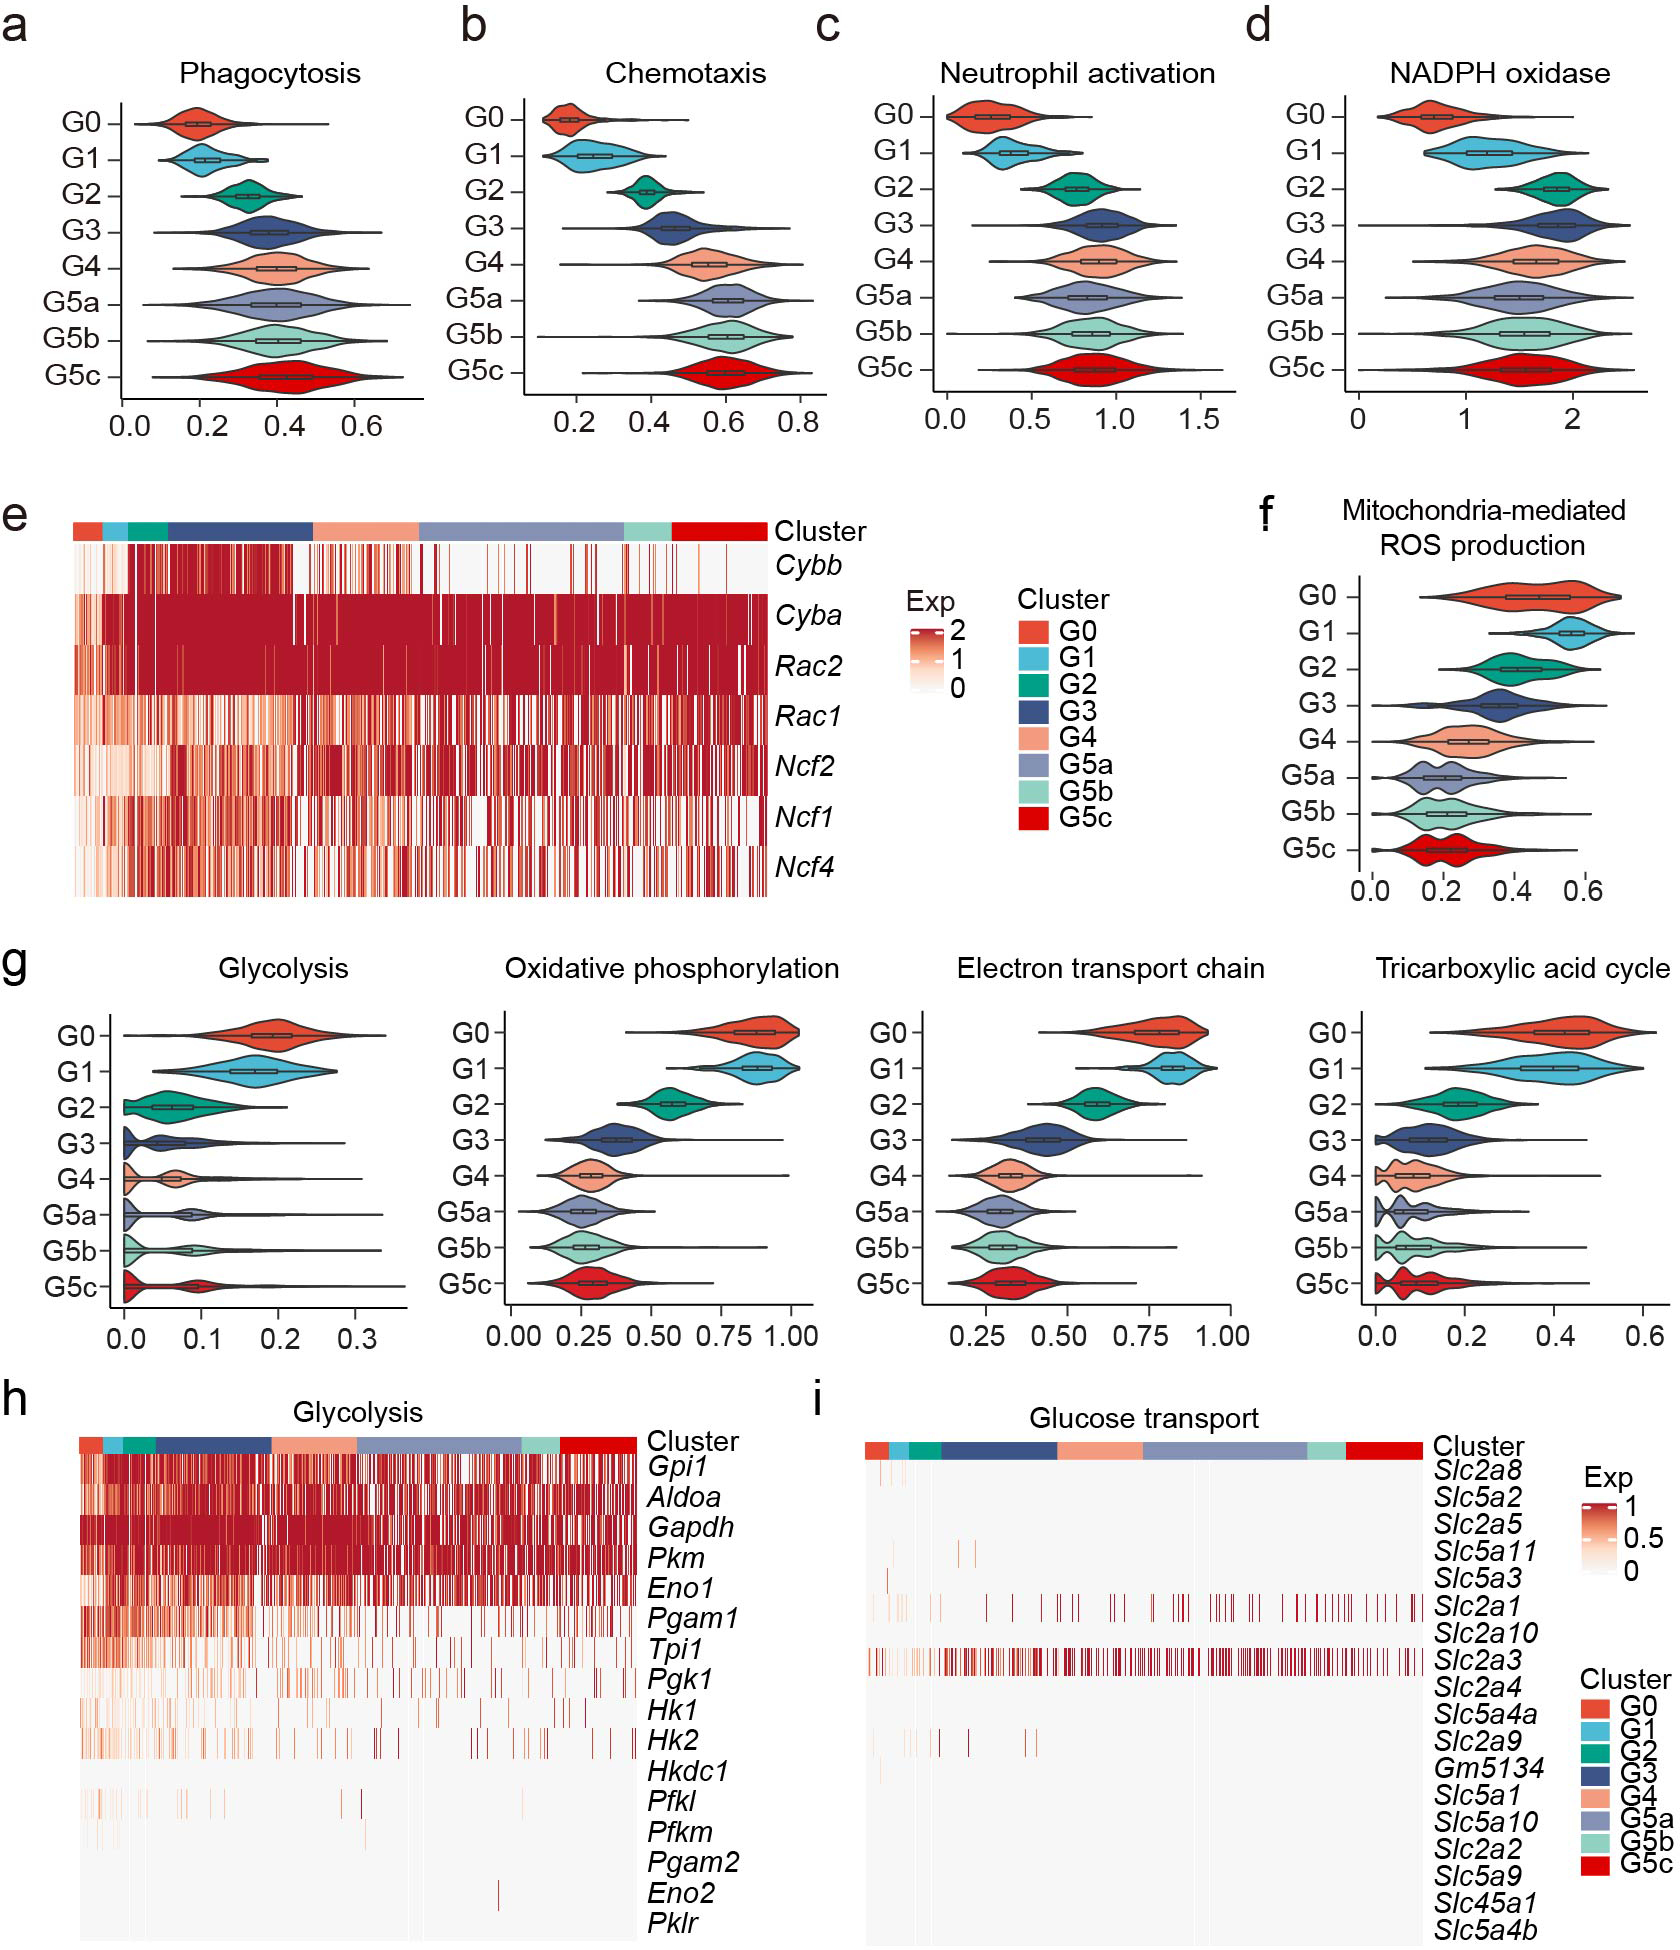
(a-d), Violin plot of phagocytosis score (GO:0006911), chemotaxis score (GO:0030593), neutrophil activation score (GO:0042119), and NADPH oxidase score for each cluster.
e, Heatmap showing relative expression of seven genes of the NADPH oxidase complex for all neutrophils.
f, As in (a-d) but displaying mitochondria-mediated ROS production score (reactive oxygen species biosynthetic process, GO:1903409) for each cluster.
g, Violin plots of metabolic scores for each cluster. Glycolysis (Reactome Pathway Database #R-MMU-70171); Oxidative phosphorylation (GO:000619); Electron transport chain (GO:0022900); Tricarboxylic acid cycle (GO:0006099).
(h-i), Heatmaps showing relative expression of glycolysis-related genes and glucose transport-related genes.
Extended Data Fig. 5. Organ-specific transcriptome features.
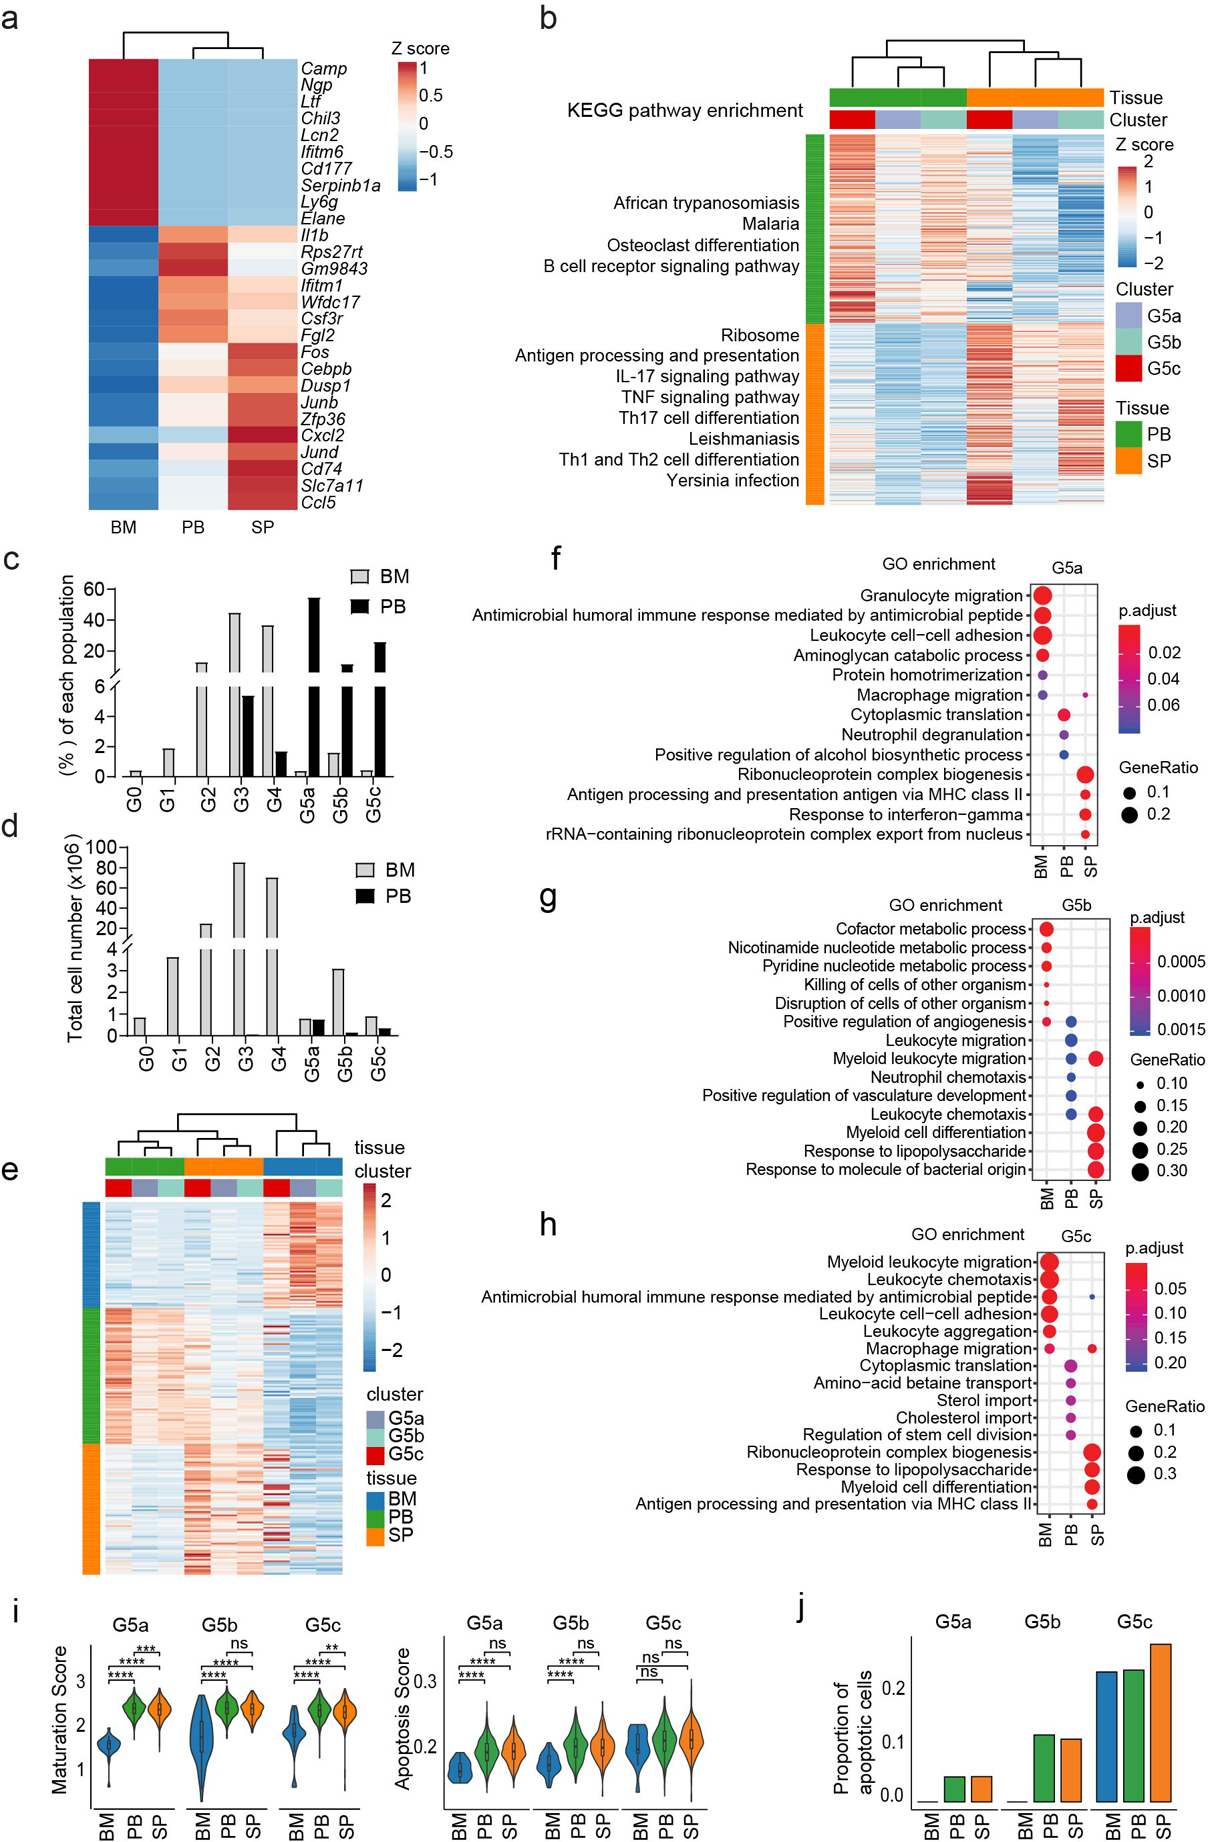
a, Heatmap showing row-scaled expression of the ten highest DEGs per organ for each averaged organ profile.
b, As in a. but for each G5 subpopulation between PB and SP. KEGG analysis of DEGs for each G5 in these two organs. Left: selected KEGG terms with Benjamini-Hochberg-corrected P-values < 0.05 are shown.
c, The percentages of each neutrophil subpopulation in the BM and PB calculated based on the scRNA-seq data (Fig.1c).
d, The absolute numbers of each neutrophil subpopulation in the BM and PB calculated based on the percentage in (c) and predicted total BM neutrophil count32, 33.
(e-j), The transcriptome feature of the three G5 populations in the BM, PB, and SP.
e, Heatmap showing row-scaled expression of DEGs across organs in each G5 cluster.
(f-h), GO analysis of DEGs across organs. Selected GO terms with Benjamini-Hochberg-corrected P-values < 0.05 (one-sided Fisher’s exact test) are shown.
i, Violin plots of maturation score and apoptosis score for each G5 neutrophil subpopulation across organs.
j, Proportions of apoptotic cells in each G5 neutrophil subpopulation across organs.
Extended Data Fig. 6. Single cell RNA-seq analysis of neutrophils in E. coli-challenged mice.
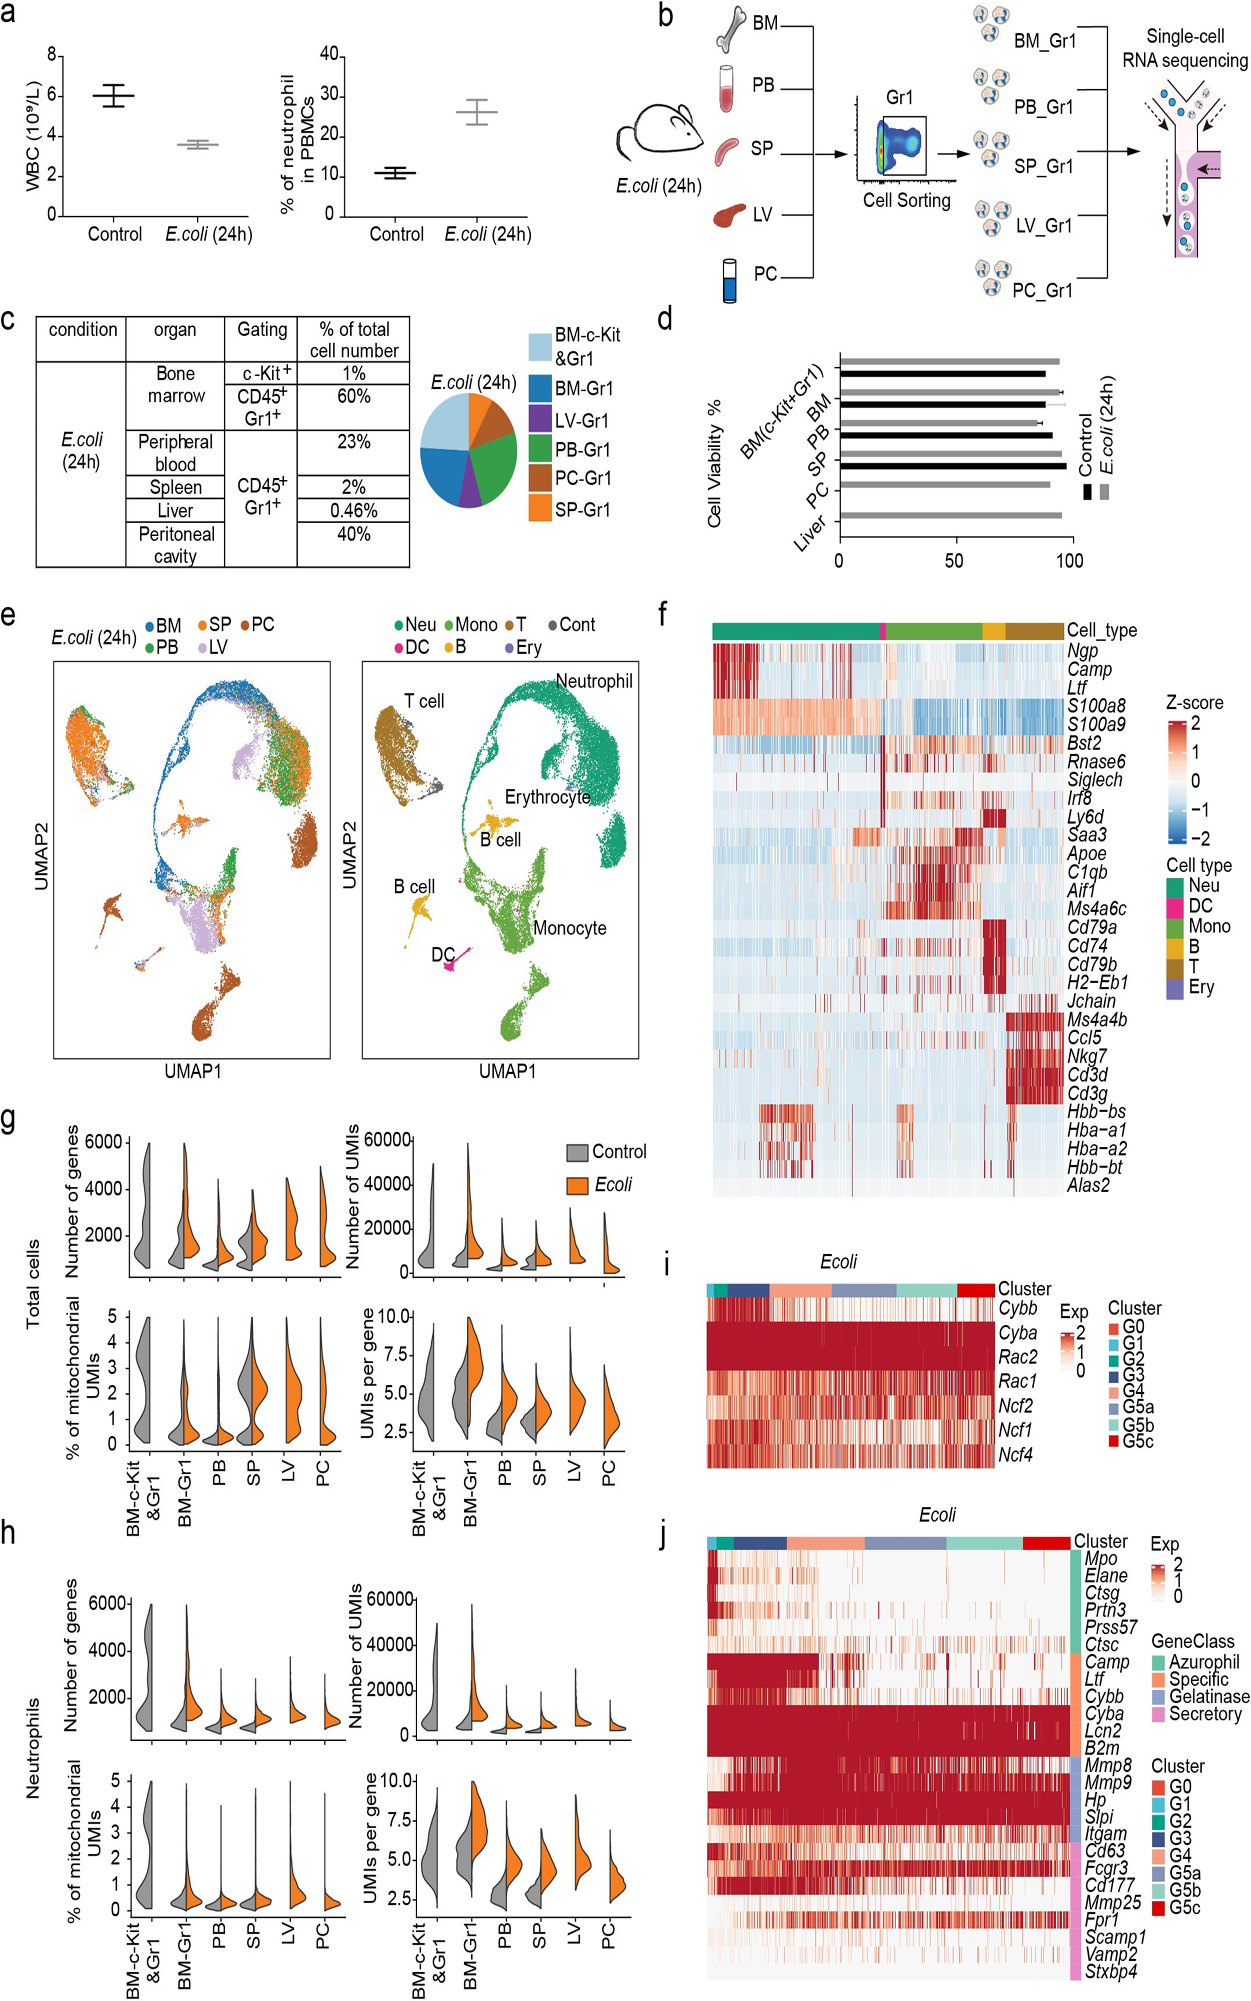
a, Number of white blood cells and the proportion of neutrophils in mice before and after E. coli challenge evaluated by a hematology analyzer (Mindray BC-5000 Vet). Results are the mean ± SD of three independent experiments.
b, Experimental scheme of the sample collection process after E. coli challenge.
c, Summary of sample information. Organ distribution of neutrophils is shown on the right.
d, Cell viability percentages immediately before cells were loaded into the 10X Chromium Controller.
e, UMAPs of all 24,943 cells from BM, PB, and SP from E. coli-challenged mice colored by sample origin and cell type, respectively.
f, Heatmap showing row-scaled expression of the five highest DEGs for all QC-passed cells colored by cell type.
g, Comparisons of the number of genes, number of UMIs, mitochondria count percentage, and UMI per gene of all QC-passed cells in each organ before and after E. coli challenge.
h, As in g but only of all neutrophils in each organ.
(i-j), Heatmaps showing expression of 7 genes of the NADPH oxidase complex (i) and neutrophil granule-related genes (j) for all neutrophils.
Extended Data Fig. 7. Differentially expressed genes in each neutrophil subpopulation in E. coli-challenged mice.
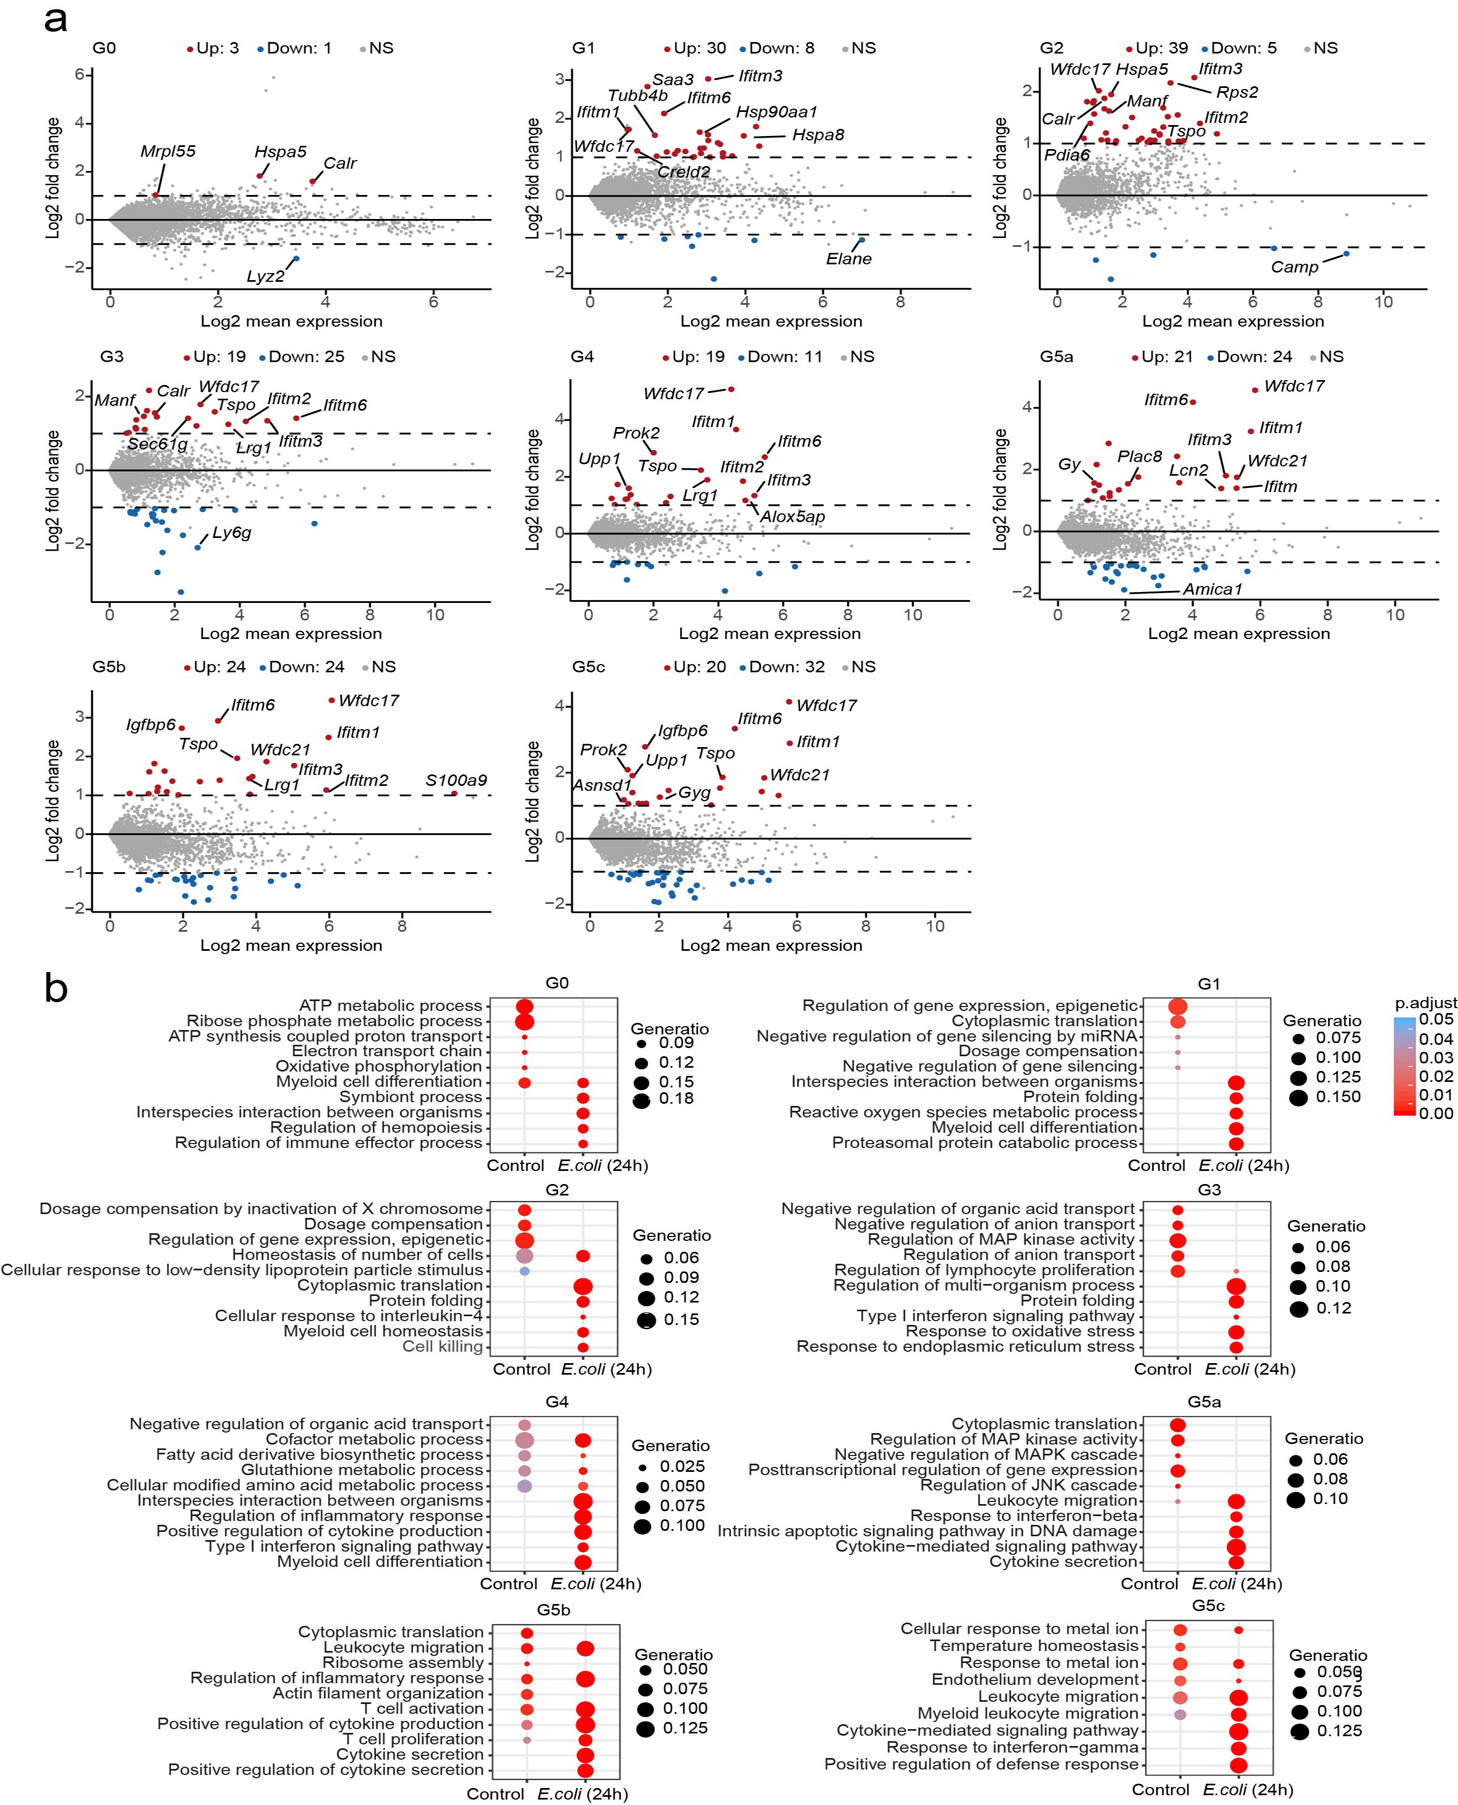
a, MA plots displaying genes that are up- (red) or downregulated (blue) after E. coli challenge for each cluster. Dashed lines denote fold change thresholds used when identifying DEGs.
b, Gene ontology (GO) analysis of DEGs before and after E. coli challenge for each cluster. Selected GO terms with Benjamini-Hochberg-corrected P-values < 0.05 (one-sided Fisher’s exact test) are shown.
Extended Data Fig. 8. Alteration of transcription networks in E. coli-challenged mice.
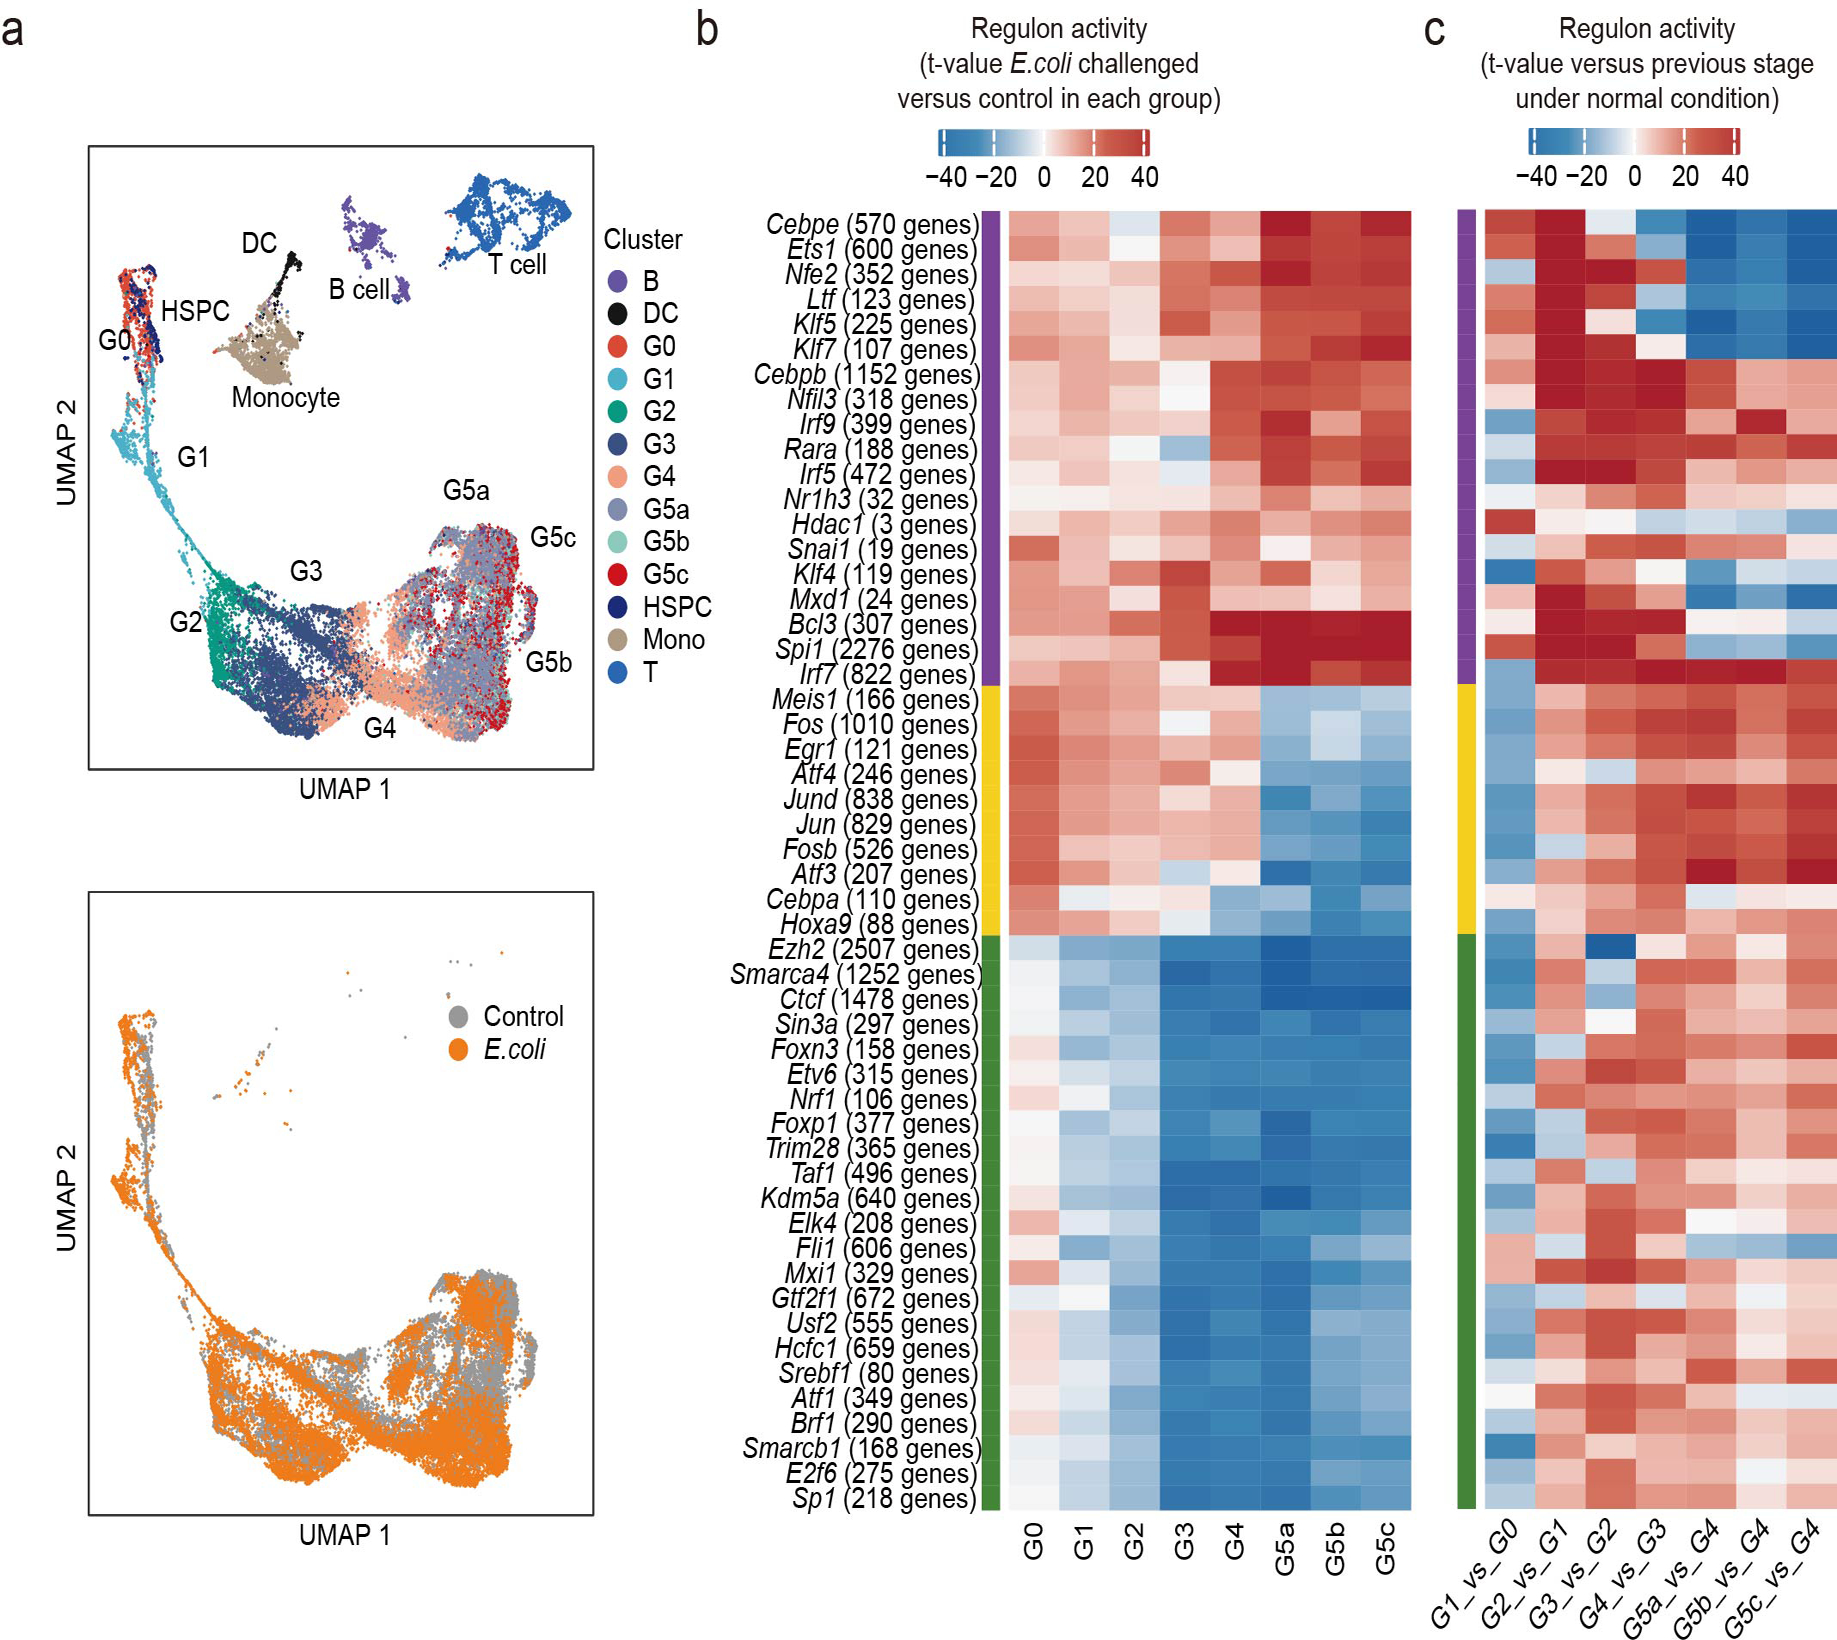
a, UMAP of the regulon activity matrix of 32,888 cells (11,992 normal neutrophils, 13,687 challenged neutrophils, and 7209 other cells under normal conditions) colored by Seurat cluster identity (top) or experimental condition (bottom, only neutrophils).
b, Heatmap of the t-values of regulon activity derived from a generalized linear model for the difference between cells from one challenged neutrophil subpopulation and cells from the corresponding normal subpopulation. Only regulons with at least one absolute t-value greater than 18 are visualized. Regulons are hierarchically clustered based on challenge-response pattern (purple: upregulated, yellow: first up- then downregulated, green: downregulated)
c, Heatmap showing activity change of regulons identified in (b) during normal group transitions.
Extended Data Fig. 9. Single-cell RNA-seq analysis of human peripheral blood neutrophils.
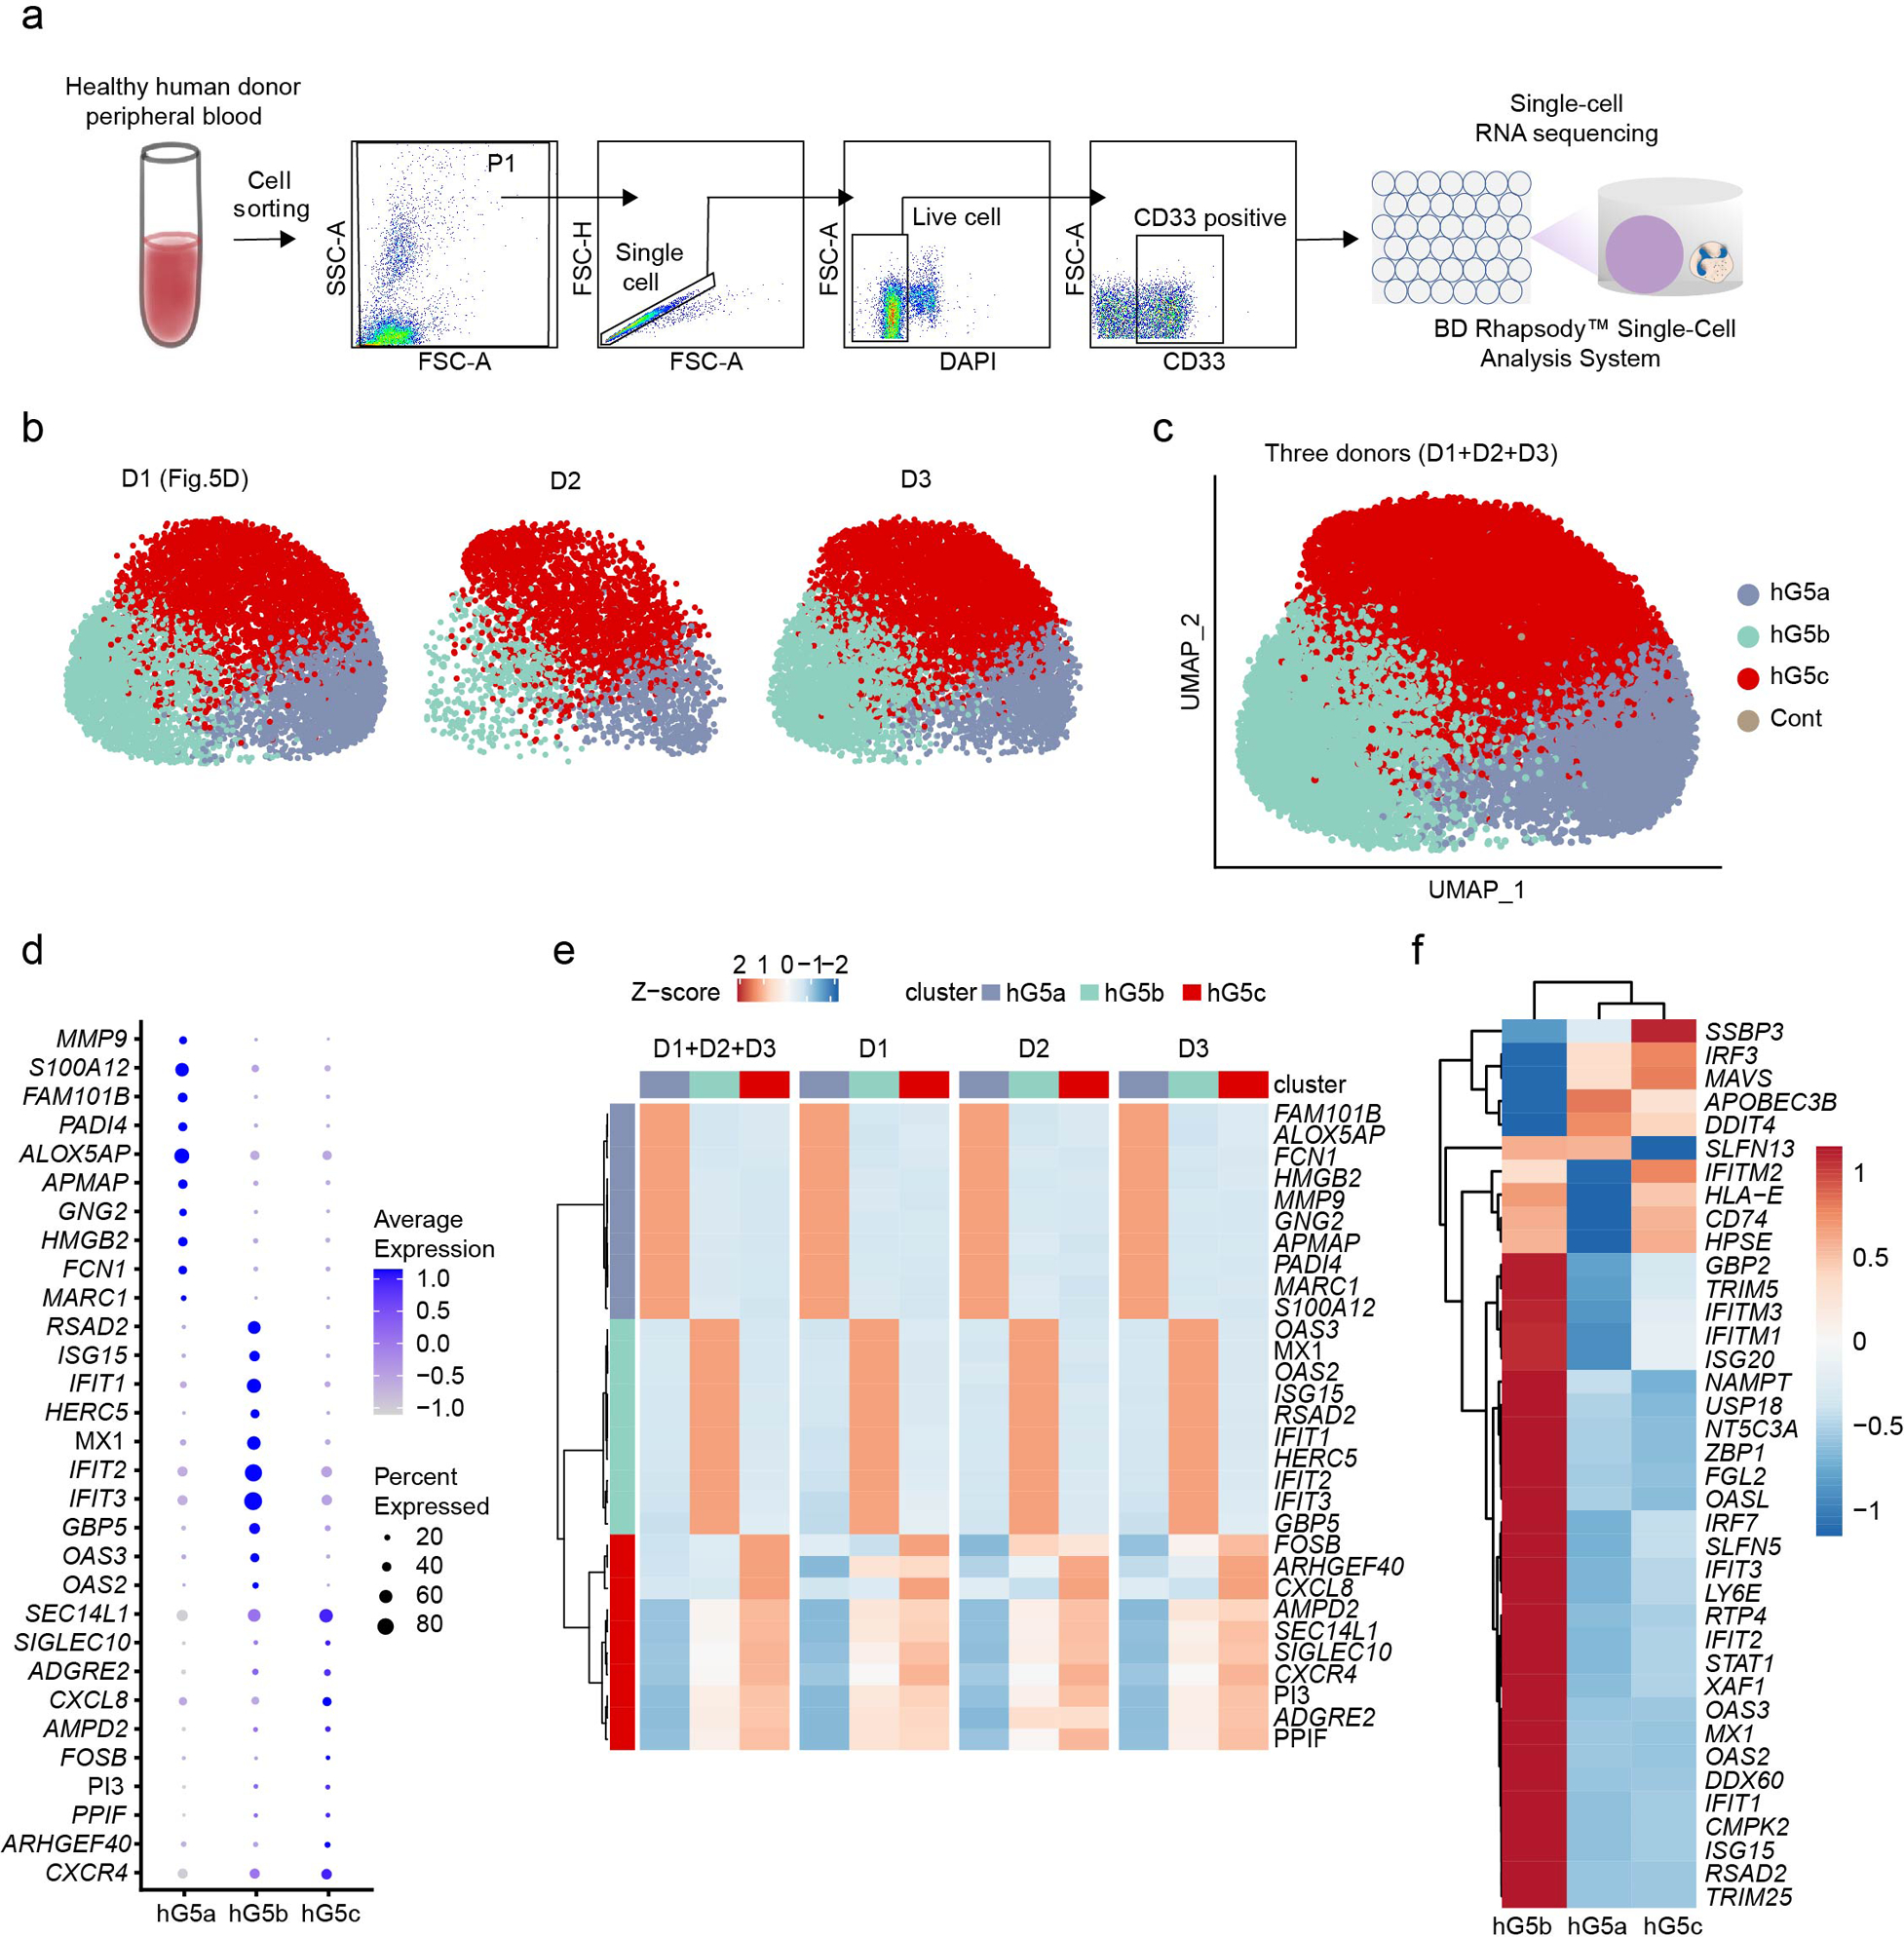
a, Overview of study design and the gating strategy for isolating human PB neutrophils.
b, UMAP plots of neutrophils from three healthy donors (D1, D2, or D3) colored by cluster identity.
c, The combined UMAP plot of the three donors.
d, Dot plot showing scaled expression of selected signature genes for each cluster colored by average expression of each gene in each cluster scaled across all clusters. Dot size represents the percentage of cells in each cluster with more than one read of the corresponding gene. The analysis was conducted using cells from all three human donors.
e, Row-scaled expression of the ten highest differentially expressed genes (Bonferroni-corrected P values < 0.05, Student’s t-test) in each neutrophil cluster. D1+D2+D3, the analysis was conducted using cells from all three human donors.
f, Row-scaled expression of 37 interferon-stimulated genes in each neutrophil cluster. The analysis was conducted using cells from all three human donors.
Extended Data Fig. 10. Single-cell transcriptome profiling reveals eight neutrophil subpopulations defined by distinct molecular signatures.
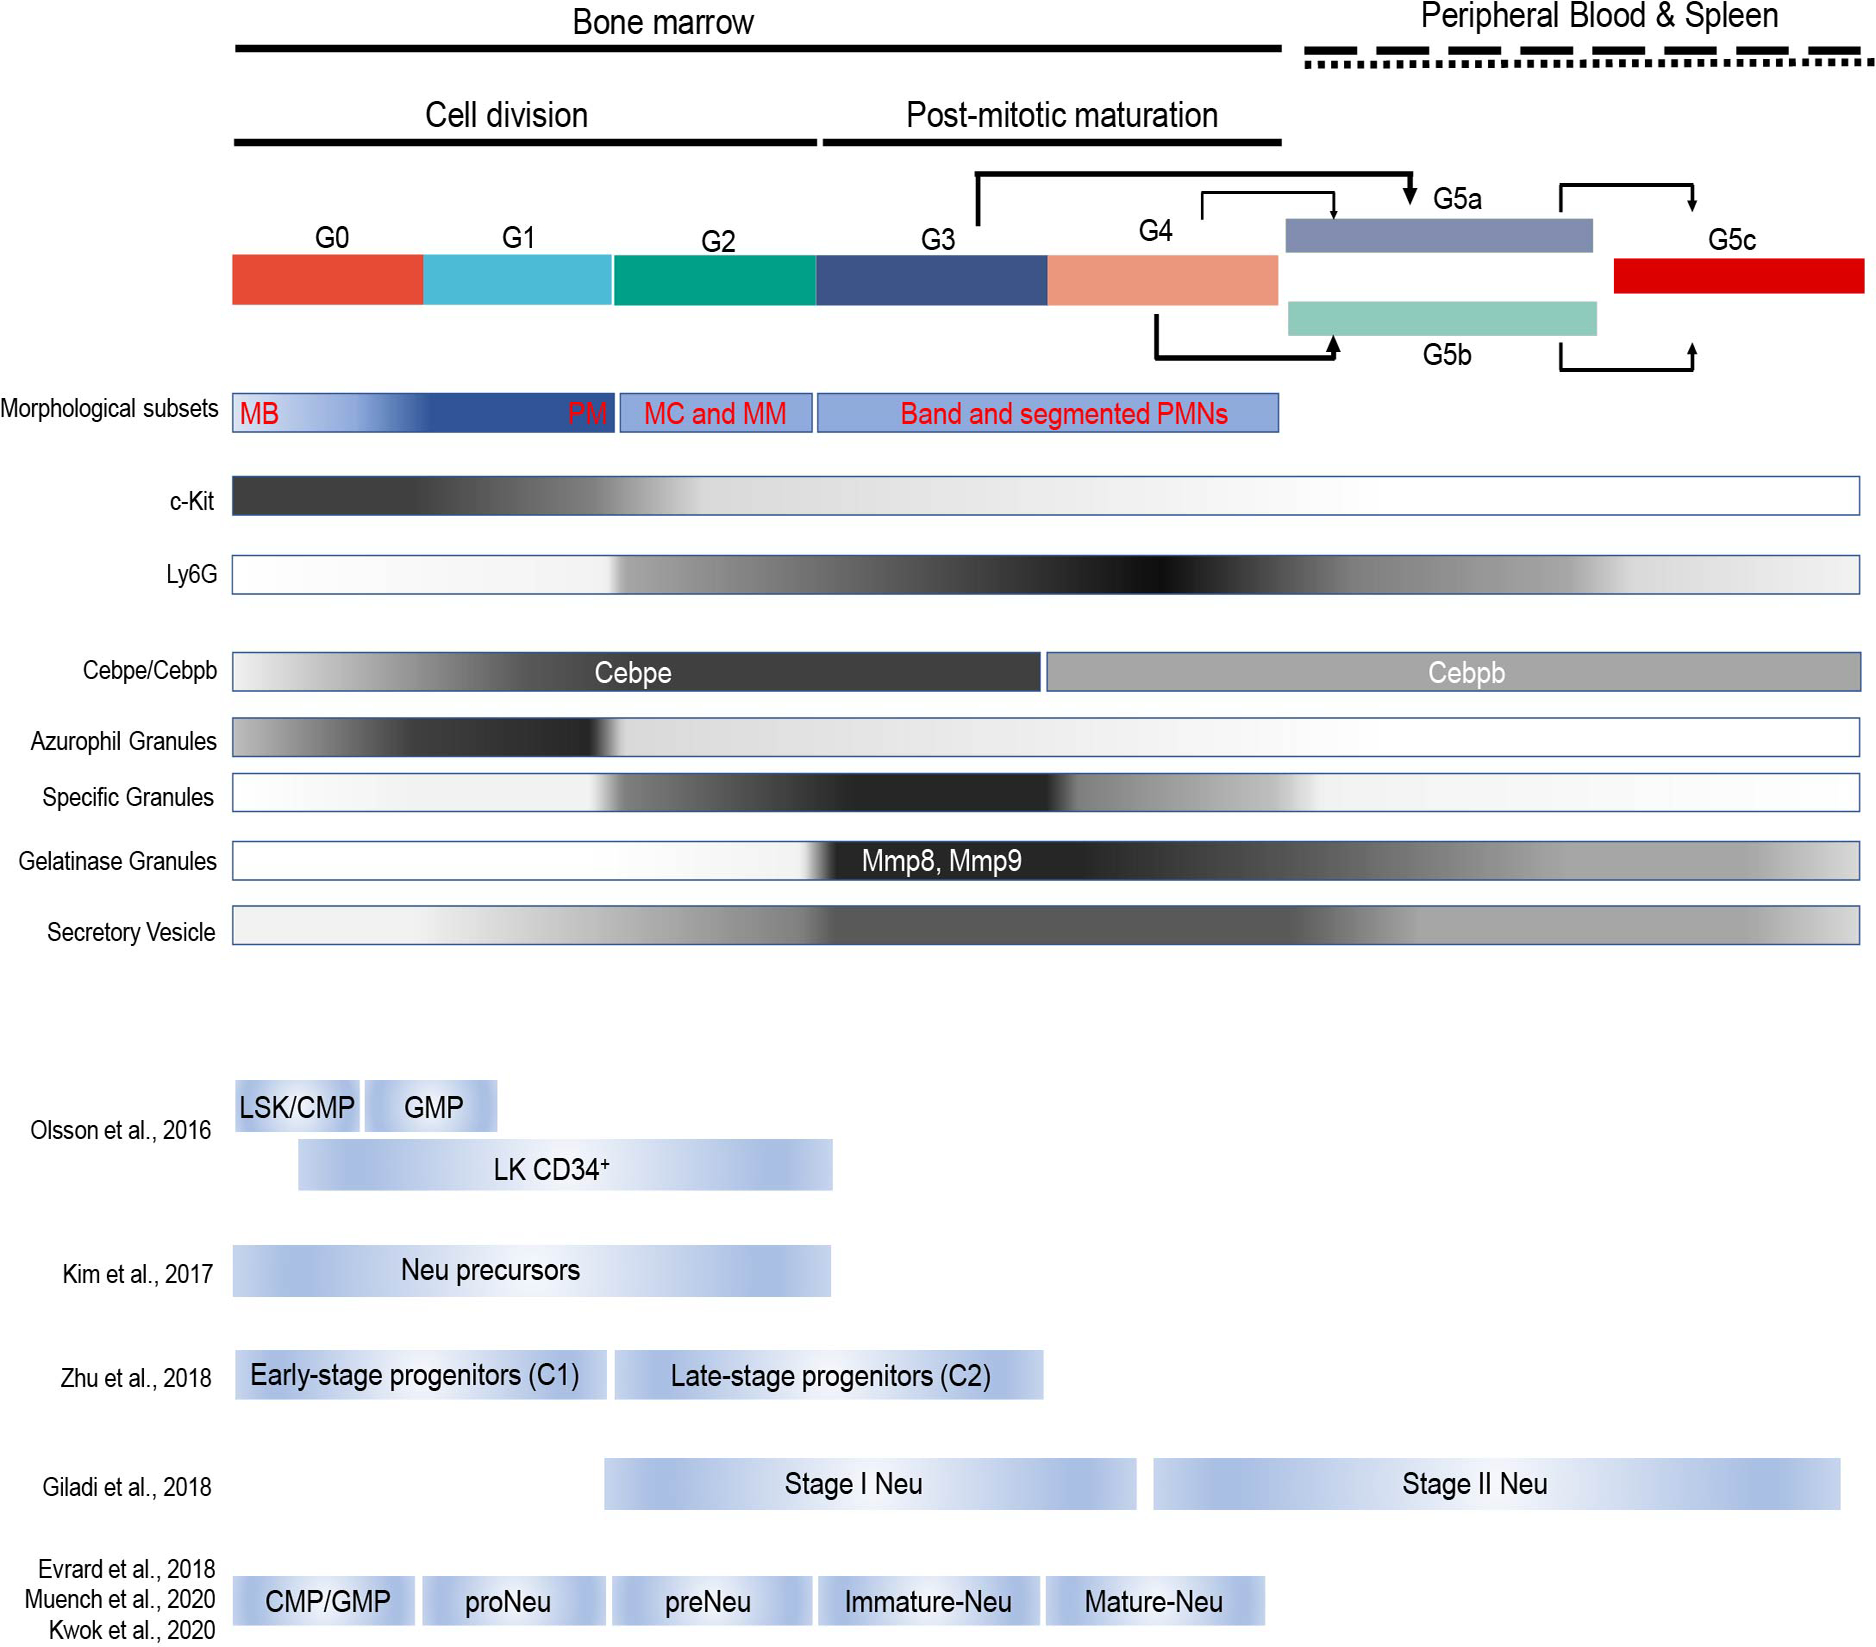
Summary of dynamic change of morphology, gene expression (Ly6g and c-kit), TF expression (Cebpe and Cebpb) and granules (Azurophil, Specific, Gelatinase granules and Secretory Vesicles) between each subpopulation. Comparison between our scRNA transcriptome profiles with other published neutrophil populations13, 25, 26, 27, 28, 29, 30.
Supplementary Material
Acknowledgements
The authors thank Andrés Hidalgo, Lai Guan Ng, John Manis and Li Chai for helpful discussions and suggestions. F.M., Y.X. and T.C. are supported by the grants from Chinese Academy of Medical Sciences (CAMS) Innovation Fund for Medical Sciences (2017-I2M-1-015, 2016-I2M-1-017, 2016-12M-1-003), the Non-profit Central Research Institute Fund of Chinese Academy of Medical Sciences (2018RC31002, 2018PT32034, 2017PT31033), National Natural Sciences Foundation of China (81970107 and 81421002), Natural Science Foundation of Tianjin City (18JCYBJC25700 ). Q.S. and C.L. were supported by National Natural Science Foundation of China (31871266), Chinese National Key Projects of Research and Development (2016YFA0100103), and NSFC Key Research Grant 71532001. H.R.L. is supported by National Institutes of Health grants (1 R01 AI142642, 1 R01 AI145274, 1 R01 AI141386, R01HL092020, and P01 HL095489) and a grant from FAMRI (CIA 123008). Part of the data analysis was performed on the High Performance Computing Platform of the Center for Life Sciences, Peking University.
Footnotes
Competing Interests Statement
The authors declare no competing financial interests.
Data availability
The data that support the findings of this study are available from the corresponding author upon request. All sequencing data generated in this study have been deposited at NCBI’s Gene Expression Omnibus (GEO) depository and are accessible through GEO Series accession number GSE137540 (https://www.ncbi.nlm.nih.gov/geo/query/acc.cgi?acc=GSE137540). Published data used in this study were retrieved from GEO: GSE70245 (Olsson et al., 2016), GSE109467 (Evrard et al., 2018), GSE117129 (Zhu et al., 2018), GSE92575 (Giladi et al., 2018), and GSE120409 (Muench et al., 2020). To align the differentiating neutrophil clusters characterized in this study to proNeu population, we also utilized the most recent data from Kwok et al. (kindly provided by Dr. Ng).
References
- 1.Nicolas-Avila JA, Adrover JM, Hidalgo A. Neutrophils in Homeostasis, Immunity, and Cancer. Immunity 2017, 46(1): 15–28. [DOI] [PubMed] [Google Scholar]
- 2.Nauseef WM, Borregaard N. Neutrophils at work. Nat Immunol 2014, 15(7): 602–611. [DOI] [PubMed] [Google Scholar]
- 3.Silvestre-Roig C, Hidalgo A, Soehnlein O. Neutrophil heterogeneity: implications for homeostasis and pathogenesis. Blood 2016, 127(18): 2173–2181. [DOI] [PubMed] [Google Scholar]
- 4.Ley K, Hoffman HM, Kubes P, Cassatella MA, Zychlinsky A, Hedrick CC, et al. Neutrophils: New insights and open questions. Science immunology 2018, 3(30): 1–14. [DOI] [PubMed] [Google Scholar]
- 5.Scapini P, Marini O, Tecchio C, Cassatella MA. Human neutrophils in the saga of cellular heterogeneity: insights and open questions. Immunol Rev 2016, 273(1): 48–60. [DOI] [PubMed] [Google Scholar]
- 6.Ng LG, Ostuni R, Hidalgo A. Heterogeneity of neutrophils. Nature Reviews Immunology 2019, 19(4): 255–265. [DOI] [PubMed] [Google Scholar]
- 7.Adrover JM, Nicolas-Avila JA, Hidalgo A. Aging: A Temporal Dimension for Neutrophils. Trends Immunol 2016, 37(5): 334–345. [DOI] [PubMed] [Google Scholar]
- 8.Yvan-Charvet L, Ng LG. Granulopoiesis and Neutrophil Homeostasis: A Metabolic, Daily Balancing Act. Trends Immunol 2019, 40(7): 598–612. [DOI] [PubMed] [Google Scholar]
- 9.Doerschuk CM. Leukocyte trafficking in alveoli and airway passages. Respir Res 2000, 1(3): 136–140. [DOI] [PMC free article] [PubMed] [Google Scholar]
- 10.Wang Q, Doerschuk CM. The signaling pathways induced by neutrophil-endothelial cell adhesion. Antioxid Redox Signal 2002, 4(1): 39–47. [DOI] [PubMed] [Google Scholar]
- 11.Adlung L, Amit I. From the Human Cell Atlas to dynamic immune maps in human disease. Nat Rev Immunol 2018, 18(10): 597–598. [DOI] [PubMed] [Google Scholar]
- 12.Stubbington MJT, Rozenblatt-Rosen O, Regev A, Teichmann SA. Single-cell transcriptomics to explore the immune system in health and disease. Science 2017, 358(6359): 58–63. [DOI] [PMC free article] [PubMed] [Google Scholar]
- 13.Giladi A, Paul F, Herzog Y, Lubling Y, Weiner A, Yofe I, et al. Single-cell characterization of haematopoietic progenitors and their trajectories in homeostasis and perturbed haematopoiesis. Nat Cell Biol 2018, 20(7): 836–846. [DOI] [PubMed] [Google Scholar]
- 14.Nestorowa S, Hamey FK, Pijuan Sala B, Diamanti E, Shepherd M, Laurenti E, et al. A single-cell resolution map of mouse hematopoietic stem and progenitor cell differentiation. Blood 2016, 128(8): e20–31. [DOI] [PMC free article] [PubMed] [Google Scholar]
- 15.Velten L, Haas SF, Raffel S, Blaszkiewicz S, Islam S, Hennig BP, et al. Human haematopoietic stem cell lineage commitment is a continuous process. Nat Cell Biol 2017, 19(4): 271–281. [DOI] [PMC free article] [PubMed] [Google Scholar]
- 16.Paul F, Arkin Y, Giladi A, Jaitin DA, Kenigsberg E, Keren-Shaul H, et al. Transcriptional Heterogeneity and Lineage Commitment in Myeloid Progenitors. Cell 2015, 163(7): 1663–1677. [DOI] [PubMed] [Google Scholar]
- 17.Karamitros D, Stoilova B, Aboukhalil Z, Hamey F, Reinisch A, Samitsch M, et al. Single-cell analysis reveals the continuum of human lympho-myeloid progenitor cells. Nature Immunology 2018, 19(1): 85–97. [DOI] [PMC free article] [PubMed] [Google Scholar]
- 18.Qiu X, Mao Q, Tang Y, Wang L, Chawla R, Pliner HA, et al. Reversed graph embedding resolves complex single-cell trajectories. Nature Methods 2017, 14: 979. [DOI] [PMC free article] [PubMed] [Google Scholar]
- 19.Eash KJ, Greenbaum AM, Gopalan PK, Link DC. CXCR2 and CXCR4 antagonistically regulate neutrophil trafficking from murine bone marrow. J Clin Invest 2010, 120(7): 2423–2431. [DOI] [PMC free article] [PubMed] [Google Scholar]
- 20.Cowland JB, Borregaard N. Granulopoiesis and granules of human neutrophils. Immunol Rev 2016, 273(1): 11–28. [DOI] [PubMed] [Google Scholar]
- 21.Borregaard N, Sorensen OE, Theilgaard-Monch K. Neutrophil granules: a library of innate immunity proteins. Trends Immunol 2007, 28(8): 340–345. [DOI] [PubMed] [Google Scholar]
- 22.Sorensen O, Arnljots K, Cowland JB, Bainton DF, Borregaard N. The human antibacterial cathelicidin, hCAP-18, is synthesized in myelocytes and metamyelocytes and localized to specific granules in neutrophils. Blood 1997, 90(7): 2796–2803. [PubMed] [Google Scholar]
- 23.Hoogendijk AJ, Pourfarzad F, Aarts CEM, Tool ATJ, Hiemstra IH, Grassi L, et al. Dynamic Transcriptome-Proteome Correlation Networks Reveal Human Myeloid Differentiation and Neutrophil-Specific Programming. Cell reports 2019, 29(8): 2505–2519 e2504. [DOI] [PubMed] [Google Scholar]
- 24.Satake S, Hirai H, Hayashi Y, Shime N, Tamura A, Yao H, et al. C/EBPbeta is involved in the amplification of early granulocyte precursors during candidemia-induced “emergency” granulopoiesis. J Immunol 2012, 189(9): 4546–4555. [DOI] [PubMed] [Google Scholar]
- 25.Olsson A, Venkatasubramanian M, Chaudhri VK, Aronow BJ, Salomonis N, Singh H, et al. Single-cell analysis of mixed-lineage states leading to a binary cell fate choice. Nature 2016, 537(7622): 698–702. [DOI] [PMC free article] [PubMed] [Google Scholar]
- 26.Evrard M, Kwok IWH, Chong SZ, Teng KWW, Becht E, Chen J, et al. Developmental Analysis of Bone Marrow Neutrophils Reveals Populations Specialized in Expansion, Trafficking, and Effector Functions. Immunity 2018, 48(2): 364–379.e368. [DOI] [PubMed] [Google Scholar]
- 27.Zhu YP, Padgett L, Dinh HQ, Marcovecchio P, Blatchley A, Wu R, et al. Identification of an Early Unipotent Neutrophil Progenitor with Pro-tumoral Activity in Mouse and Human Bone Marrow. Cell reports 2018, 24(9): 2329–2341.e2328. [DOI] [PMC free article] [PubMed] [Google Scholar]
- 28.Kim M-H, Yang D, Kim M, Kim S-Y, Kim D, Kang S-J. A late-lineage murine neutrophil precursor population exhibits dynamic changes during demand-adapted granulopoiesis. Scientific reports 2017, 7: 39804. [DOI] [PMC free article] [PubMed] [Google Scholar]
- 29.Muench DE, Olsson A, Ferchen K, Pham G, Serafin RA, Chutipongtanate S, et al. Mouse models of neutropenia reveal progenitor-stage-specific defects. Nature 2020. [DOI] [PMC free article] [PubMed] [Google Scholar]
- 30.Kwok I, Becht E, Xia Y, Ng M, Tan L, Teh YC, et al. Combinatorial single-cell analyses of granulocyte-monocyte progenitor heterogeneity reveals an early uni-potent neutrophil progenitor. Immunity 2020(in press). [DOI] [PubMed] [Google Scholar]
- 31.Borregaard N, Herlin T. Energy Metabolism of Human Neutrophils during Phagocytosis. The Journal of Clinical Investigation 1982, 70(3): 550–557. [DOI] [PMC free article] [PubMed] [Google Scholar]
- 32.Chervenick PA, Boggs DR, Marsh JC, Cartwright GE, Wintrobe MM. Quantitative studies of blood and bone marrow neutrophils in normal mice. Am J Physiol 1968, 215(2): 353–360. [DOI] [PubMed] [Google Scholar]
- 33.Colvin GA, Lambert JF, Abedi M, Hsieh CC, Carlson JE, Stewart FM, et al. Murine marrow cellularity and the concept of stem cell competition: geographic and quantitative determinants in stem cell biology. Leukemia 2004, 18(3): 575–583. [DOI] [PubMed] [Google Scholar]
- 34.La Manno G, Soldatov R, Zeisel A, Braun E, Hochgerner H, Petukhov V, et al. RNA velocity of single cells. Nature 2018, 560(7719): 494–498. [DOI] [PMC free article] [PubMed] [Google Scholar]
- 35.Broxmeyer HE. Chemokines in hematopoiesis. Curr Opin Hematol 2008, 15(1): 49–58. [DOI] [PubMed] [Google Scholar]
- 36.Furze RC, Rankin SM. Neutrophil mobilization and clearance in the bone marrow. Immunology 2008, 125(3): 281–288. [DOI] [PMC free article] [PubMed] [Google Scholar]
- 37.Suratt BT, Young SK, Lieber J, Nick JA, Henson PM, Worthen GS. Neutrophil maturation and activation determine anatomic site of clearance from circulation. Am J Physiol Lung Cell Mol Physiol 2001, 281(4): L913–921. [DOI] [PubMed] [Google Scholar]
- 38.Theilgaard-Monch K, Jacobsen LC, Borup R, Rasmussen T, Bjerregaard MD, Nielsen FC, et al. The transcriptional program of terminal granulocytic differentiation. Blood 2005, 105(4): 1785–1796. [DOI] [PubMed] [Google Scholar]
- 39.Monticelli S, Natoli G. Transcriptional determination and functional specificity of myeloid cells: making sense of diversity. Nat Rev Immunol 2017, 17(10): 595–607. [DOI] [PubMed] [Google Scholar]
- 40.Aibar S, González-Blas CB, Moerman T, Imrichova H, Hulselmans G, Rambow F, et al. SCENIC: single-cell regulatory network inference and clustering. Nature methods 2017, 14(11): 1083. [DOI] [PMC free article] [PubMed] [Google Scholar]
- 41.Lambrechts D, Wauters E, Boeckx B, Aibar S, Nittner D, Burton O, et al. Phenotype molding of stromal cells in the lung tumor microenvironment. Nature medicine 2018, 24(8): 1277–1289. [DOI] [PubMed] [Google Scholar]
- 42.Stuart T, Butler A, Hoffman P, Hafemeister C, Papalexi E, Mauck WM 3rd, et al. Comprehensive Integration of Single-Cell Data. Cell 2019, 177(7): 1888–1902 e1821. [DOI] [PMC free article] [PubMed] [Google Scholar]
- 43.Kwak HJ, Liu P, Bajrami B, Xu Y, Park SY, Nombela-Arrieta C, et al. Myeloid cell-derived reactive oxygen species externally regulate the proliferation of myeloid progenitors in emergency granulopoiesis. Immunity 2015, 42(1): 159–171. [DOI] [PMC free article] [PubMed] [Google Scholar]
- 44.Manz MG, Boettcher S. Emergency granulopoiesis. Nat Rev Immunol 2014, 14(5): 302–314. [DOI] [PubMed] [Google Scholar]
- 45.Tirosh I, Izar B, Prakadan SM, Wadsworth MH, Treacy D, Trombetta JJ, et al. Dissecting the multicellular ecosystem of metastatic melanoma by single-cell RNA-seq. Science 2016, 352(6282): 189–196. [DOI] [PMC free article] [PubMed] [Google Scholar]
- 46.Uhl B, Vadlau Y, Zuchtriegel G, Nekolla K, Sharaf K, Gaertner F, et al. Aged neutrophils contribute to the first line of defense in the acute inflammatory response. Blood 2016, 128(19): 2327–2337. [DOI] [PMC free article] [PubMed] [Google Scholar]
- 47.Kolaczkowska E The older the faster: aged neutrophils in inflammation. Blood 2016, 128(19): 2280–2282. [DOI] [PubMed] [Google Scholar]
- 48.Luo HR, Loison F. Constitutive neutrophil apoptosis: mechanisms and regulation. Am J Hematol 2008, 83(4): 288–295. [DOI] [PubMed] [Google Scholar]
- 49.Schneider WM, Chevillotte MD, Rice CM. Interferon-stimulated genes: a complex web of host defenses. Annu Rev Immunol 2014, 32: 513–545. [DOI] [PMC free article] [PubMed] [Google Scholar]
- 50.Zilionis R, Engblom C, Pfirschke C, Savova V, Zemmour D, Saatcioglu HD, et al. Single-Cell Transcriptomics of Human and Mouse Lung Cancers Reveals Conserved Myeloid Populations across Individuals and Species. Immunity 2019, 50(5): 1317–1334.e1310. [DOI] [PMC free article] [PubMed] [Google Scholar]
- 51.Sakai J et al. Reactive oxygen species-induced actin glutathionylation controls actin dynamics in neutrophils. Immunity 37, 1037–1049 (2012). [DOI] [PMC free article] [PubMed] [Google Scholar]
- 52.Adrover JM et al. A Neutrophil Timer Coordinates Immune Defense and Vascular Protection. Immunity 50, 390–402.e310 (2019). [DOI] [PubMed] [Google Scholar]
- 53.Hou Q et al. Inhibition of IP6K1 suppresses neutrophil-mediated pulmonary damage in bacterial pneumonia. Science Translational Medicine 10 (2018). [DOI] [PMC free article] [PubMed] [Google Scholar]
- 54.Loison F et al. Proteinase 3-dependent caspase-3 cleavage modulates neutrophil death and inflammation. J Clin Invest 124, 4445–4458 (2014). [DOI] [PMC free article] [PubMed] [Google Scholar]
- 55.Karatepe K et al. Proteinase 3 Limits the Number of Hematopoietic Stem and Progenitor Cells in Murine Bone Marrow. Stem Cell Reports 11, 1092–1105 (2018). [DOI] [PMC free article] [PubMed] [Google Scholar]
- 56.Butler A, Hoffman P, Smibert P, Papalexi E & Satija R Integrating single-cell transcriptomic data across different conditions, technologies, and species. Nature biotechnology (2018). [DOI] [PMC free article] [PubMed] [Google Scholar]
- 57.Becht E et al. Dimensionality reduction for visualizing single-cell data using UMAP. Nature Biotechnology 37, 38 (2018). [DOI] [PubMed] [Google Scholar]
- 58.Kowalczyk MS et al. Single-cell RNA-seq reveals changes in cell cycle and differentiation programs upon aging of hematopoietic stem cells. Genome Res 25, 1860–1872 (2015). [DOI] [PMC free article] [PubMed] [Google Scholar]
- 59.Tirosh I et al. Single-cell RNA-seq supports a developmental hierarchy in human oligodendroglioma. Nature 539, 309–313 (2016). [DOI] [PMC free article] [PubMed] [Google Scholar]
- 60.Yu G, Wang LG, Han Y & He QY clusterProfiler: an R package for comparing biological themes among gene clusters. OMICS 16, 284–287 (2012). [DOI] [PMC free article] [PubMed] [Google Scholar]
- 61.Consortium GO The gene ontology resource: 20 years and still GOing strong. Nucleic acids research 47, D330–D338 (2018). [DOI] [PMC free article] [PubMed] [Google Scholar]
- 62.Benaglia T, Chauveau D, Hunter D & Young D mixtools: An R package for analyzing finite mixture models. (2009). [Google Scholar]
- 63.Zhang D et al. Neutrophil ageing is regulated by the microbiome. Nature 525, 528–532 (2015). [DOI] [PMC free article] [PubMed] [Google Scholar]
- 64.Suratt BT et al. Role of the CXCR4/SDF-1 chemokine axis in circulating neutrophil homeostasis. Blood 104, 565–571 (2004). [DOI] [PubMed] [Google Scholar]
- 65.Martin C et al. Chemokines acting via CXCR2 and CXCR4 control the release of neutrophils from the bone marrow and their return following senescence. Immunity 19, 583–593 (2003). [DOI] [PubMed] [Google Scholar]
- 66.Newman AM et al. Robust enumeration of cell subsets from tissue expression profiles. Nature methods 12, 453 (2015). [DOI] [PMC free article] [PubMed] [Google Scholar]
- 67.Katharine M Mullen I.H.M.v.S. nnls: The Lawson-Hanson algorithm for non-negative least squares (NNLS). 2012. [Google Scholar]
- 68.Kjeldsen L, Bainton DF, Sengelov H & Borregaard N Structural and functional heterogeneity among peroxidase-negative granules in human neutrophils: identification of a distinct gelatinase-containing granule subset by combined immunocytochemistry and subcellular fractionation. Blood 82, 3183–3191 (1993). [PubMed] [Google Scholar]
- 69.Gu Z, Eils R & Schlesner M Complex heatmaps reveal patterns and correlations in multidimensional genomic data. Bioinformatics 32, 2847–2849 (2016). [DOI] [PubMed] [Google Scholar]
- 70.La Manno G et al. RNA velocity of single cells. Nature 560, 494–498 (2018). [DOI] [PMC free article] [PubMed] [Google Scholar]
Associated Data
This section collects any data citations, data availability statements, or supplementary materials included in this article.