Abstract
The ER membrane complex (EMC) cooperates with the Sec61 translocon to co-translationally insert a transmembrane helix (TMH) of many multi-pass integral membrane proteins into the ER membrane, and it is also responsible for inserting the TMH of some tail-anchored proteins 1–3. How EMC accomplishes this feat has been unclear. Here we report the first cryo-EM structure of the eukaryotic EMC. We found that the Saccharomyces cerevisiae EMC contains eight subunits (Emc1–6, 7, and 10); has a large lumenal region and a smaller cytosolic region; and has a transmembrane region formed by Emc4, 5, and 6 plus the transmembrane domains (TMDs) of Emc1 and 3. We identified a 5-TMH fold centered around Emc3 that resembles the prokaryotic insertase YidC and that delineates a largely hydrophilic client pocket. The TMD of Emc4 tilts away from the main transmembrane region of EMC and is partially mobile. Mutational studies demonstrated that Emc4 flexibility and the hydrophilicity of the client pocket are required for EMC function. The EMC structure reveals a remarkable evolutionary conservation with the prokaryotic insertases 4,5; suggests a similar mechanism of TMH insertion; and provides a framework for detailed understanding of membrane insertion for numerous eukaryotic integral membrane proteins and tail-anchored proteins.
MAIN
Most membrane proteins are synthesized by ribosomes docked on the endoplasmic reticulum (ER)–embedded Sec61 translocon and are folded in the ER membrane. How the topology of so many membrane proteins is maintained is not well understood, but the recently discovered EMC is involved in the process 1–4,6,7.
EMC functions as a TMH insertase for a subset of tail-anchored proteins 3, as well as for the first TMH of many multi-pass integral transmembrane proteins, thereby ensuring their accurate membrane topology in the ER 2. EMC is also required for the insertion of the second or other TMHs of certain multi-pass integral transmembrane proteins 8–10. The membrane–protein chaperone function explains why EMC is involved in a diverse set of cellular functions such as protein quality control, membrane protein and phospholipid biosynthesis, and virus replication 7,11–14.
The mammalian EMC is composed of 10 subunits, EMC1–10 12. The Saccharomyces cerevisiae EMC was first reported to have six subunits, Emc1–6. However, two additional proteins, Sop4p and Ydr056cp, were co-purified with Emc1–6 13. Bioinformatic analysis revealed that the yeast Sop4p and Ydr056cp are homologous to the mammalian EMC7 and EMC10, respectively, and therefore, may be the Emc7 and Emc10 subunits of the yeast EMC 15. To gain molecular understanding underlying EMC’s activity, we identified putative EMC client proteins, purified the endogenous S. cerevisiae EMC, determined the cryo-EM structure, and performed functional assays. We found that the yeast EMC is an eight-subunit complex that is evolutionarily conserved with the prokaryotic insertases.
Yeast EMC subunits and client proteins
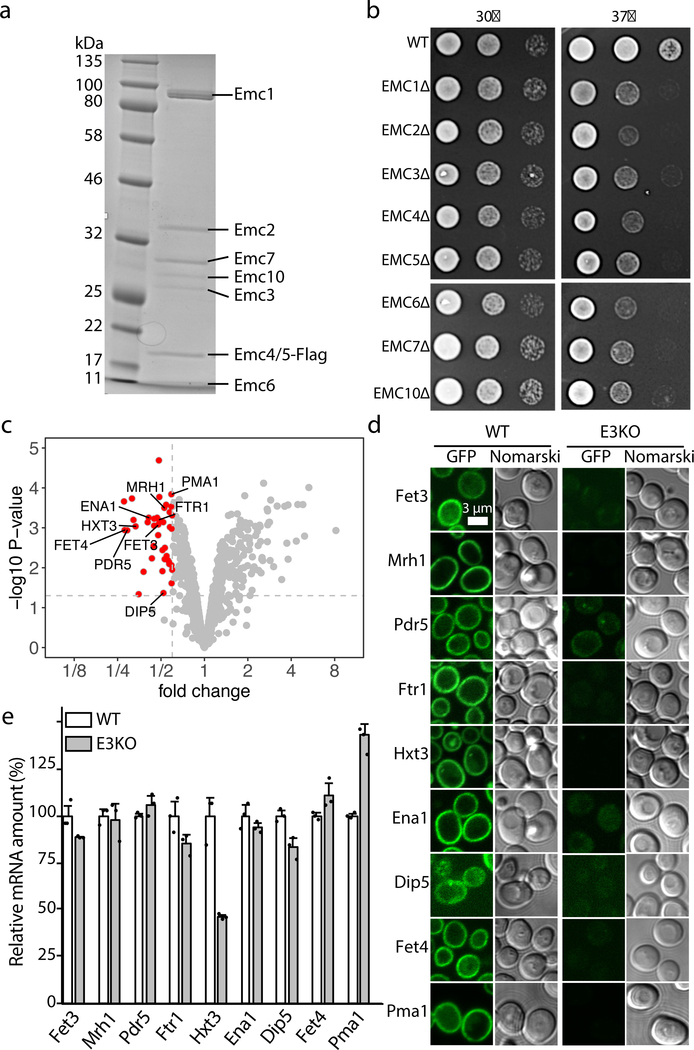
We inserted a 3× FLAG tag onto the carboxyl terminus of the Emc5 gene in a yeast strain and purified the endogenous EMC by anti-FLAG affinity resin and size-exclusion chromatography (Online Methods, Extended Data Fig. 1a, Supplementary Fig. 1). The SDS-PAGE and mass spectrometry indicated that the purified EMC complex was composed of eight subunits: Emc1–7 and Emc10 (Fig. 1a). Because the EMC-knockout yeast (missing Emc1–3 and Emc5–6; 5x-emc) grows normally at 30°C but has a growth defect at the restrictive temperature of 37°C 14, we examined the importance of individual Emc subunits for EMC function. We found that knocking out any one of the eight subunits led to the same growth defect as the EMC knock-out (5x-emc) at 37°C (Fig. 1b), suggesting that all subunits are required.
Fig. 1. Purification of the yeast EMC and identification of EMC client proteins.
a, The Coomassie blue-stained SDS-PAGE gel of the purified EMC complex. For gel source data, see Supplementary Fig. 1. b, Growth of 10-fold serial diluted yeast strains (WT and individual Emc subunit knockouts) on YPD plates at 30°C and 37°C for 2 d. c, Fold change and statistical significance of the membrane protein levels in EMC-KO cells relative to WT cells. Proteins whose abundance was decreased by >40% and whose significance p-value was smaller than 0.05 are highlighted in red. The p-values were calculated by Empirical Bayes t-tests (two-sided) with no adjustment. d-e, Protein abundance (d) and mRNA levels (e) of nine putative EMC clients in WT and EMC3 knockout yeast strains. The EGFP is appended to the C-termini of the genes. The scale bar is 3 µm. The mRNA columns are shown as mean ± SD. Each black dot indicates the value of a single independent experiment. The experiments in panels a-e were repeated three times yielding similar results.
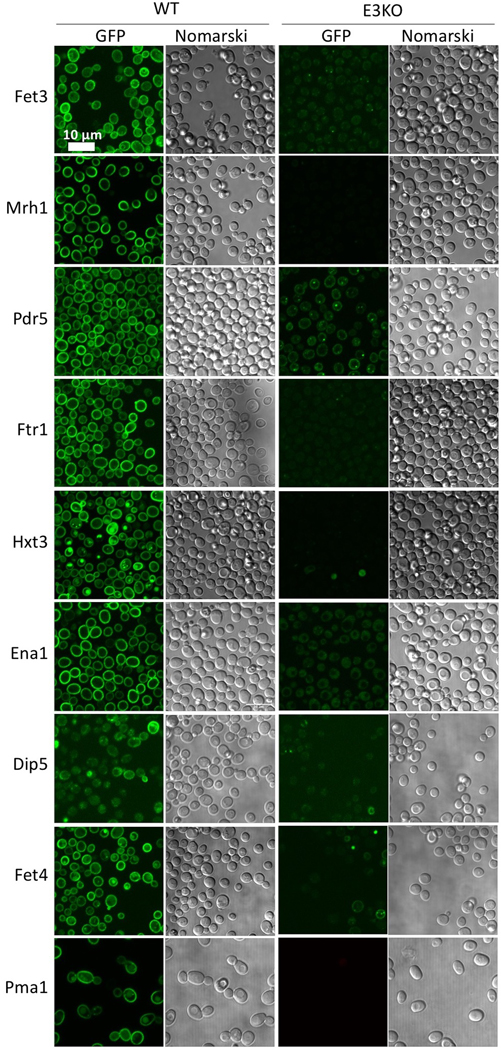
Proteomic analysis of human cells with EMC2, EMC4, or EMC6 knockdown has identified a list of potential EMC client proteins 1,9. To understand the effect of EMC deficiency and the potential EMC client proteins in yeast, we performed a quantitative proteomic comparison of membrane proteins using tandem mass tag (TMT) labeling in the EMC-deficient (Emc3-KO, Emc4-KO, or Emc6-KO) versus WT cells. We identified 38 membrane proteins that were significantly reduced; these proteins were likely the EMC clients (Fig. 1c) (Supplementary Tables 1-2). We GFP-labeled nine selected putative clients and measured their relative membrane abundance in WT versus Emc3-knockout yeast cells by fluorescence microscopy (Fig. 1d, Extended Data Fig. 2). The nine proteins were markedly downregulated in Emc-3 knockout cells. The downregulation is due to the absence of EMC function rather than transcriptional variation, because the levels of mRNAs of these client genes were similar or increased compared to those in the WT cells, except for the 50% reduction of Hxt3 mRNA (Fig. 1e).
Among the 38 putative EMC clients, six (PDR5, PDR12, PHO90, PMA1, PTR2, and SNQ2) were found to be associated with EMC 1, and two (MRH1 and PMA1) were reported to rely on EMC for membrane localization 16,17. Interestingly, 16 of the clients had their N termini facing outside; the others faced the cytosol (Supplementary Table 1), suggesting that EMC does not have a preference for client’s N-terminus location (inside or outside) 1,9.
EMC architecture and subunit structures
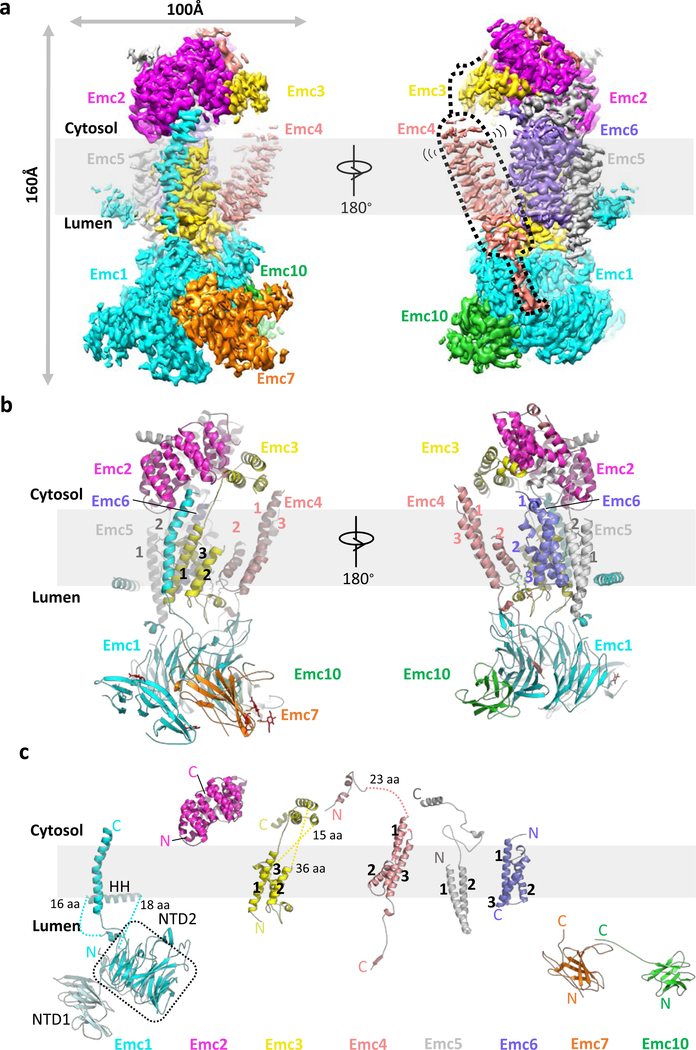
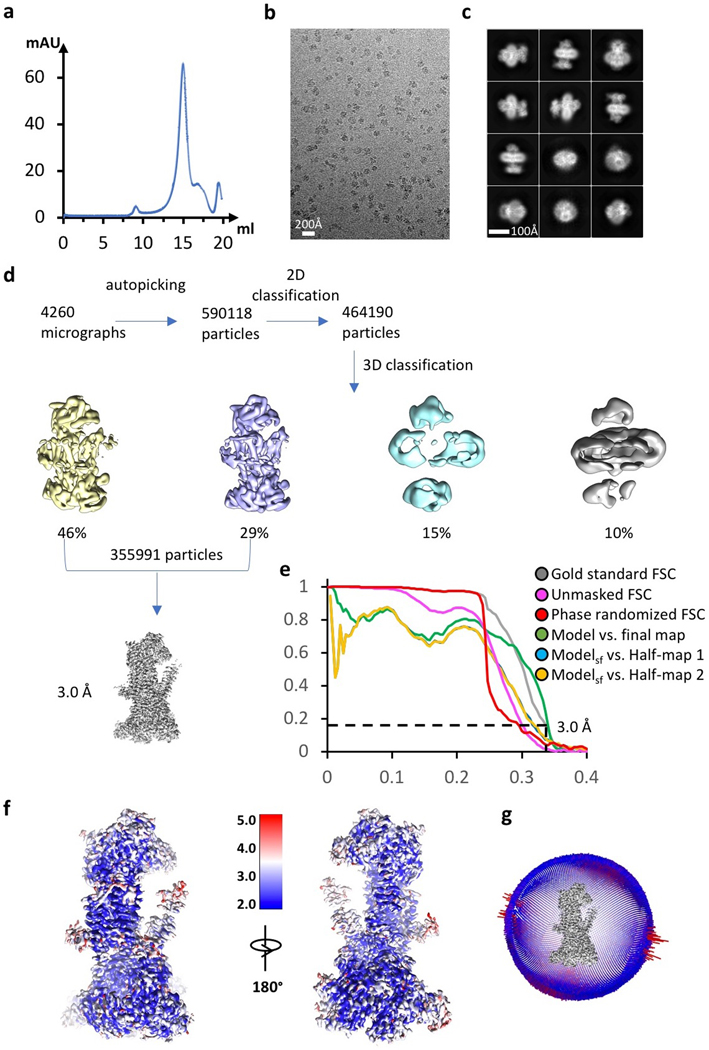
We determined a 3.0-Å average resolution cryo-EM 3D map (Fig. 2a-c, Extended Data Fig. 1b-g,Extended Data Table 1, Supplementary Video 1). The high resolution allowed us to build the atomic model of EMC de novo (Extended Data Figs. 3-4, Supplementary Table 3). The structure contained the previously known subunits Emc1–6 plus Emc7 and Emc10 (Fig. 1a, 2a). The EMC structure is approximately 160 × 100 × 80 Å (Fig. 2a-b). Five subunits (Emc1 and Emc3–6) are transmembrane proteins having a total of 12 TMHs. The remaining three subunits, Emc2, Emc7, and Emc10, are aqueous proteins (Fig. 2c). The complex has a transmembrane region, a large lumenal region, and a smaller cytosolic region. There are two ordered phospholipids in the transmembrane region, one facing the lumen and surrounded by Emc3, 4, and 6, and the other facing cytosol and surrounded by TMHs of Emc3, 5, and 6. We identified six N-glycans, three in the lumenal domain of Emc1 (N73, N106, and N192) and three in Emc7 (N53, N85, and N115) (Fig. 2b). We also observed two disulfide bonds, one between Emc1 C701 and C709 and the other between Emc10 C65 and C78. The patterns of glycosylation and disulfide bonds were consistent with our membrane orientation assignment of the EMC, in which Emc1, Emc7, and Emc10 are on the lumenal side and Emc2 is in the cytosol. The cytosolic location of Emc2 was supported by the Emc2 interaction with the cytosolic chaperone Hsp90 18. The EMC cytosolic region is primarily composed of α-helices, whereas the lumenal region is mostly β-strands.
Fig. 2. Structure of the yeast EMC.
a, Cryo-EM 3D map of the EMC, showing front and back views with individual subunits colored. The dotted black shape outlines the Emc4 density, which is weaker and partially flexible (indicated by the two propagating wave signs). b, An atomic model shown in cartoons and colored in the same scheme as panel a; phospholipids and N-glycans are shown in green and red, respectively. c, Structures of the eight EMC subunits shown separately.
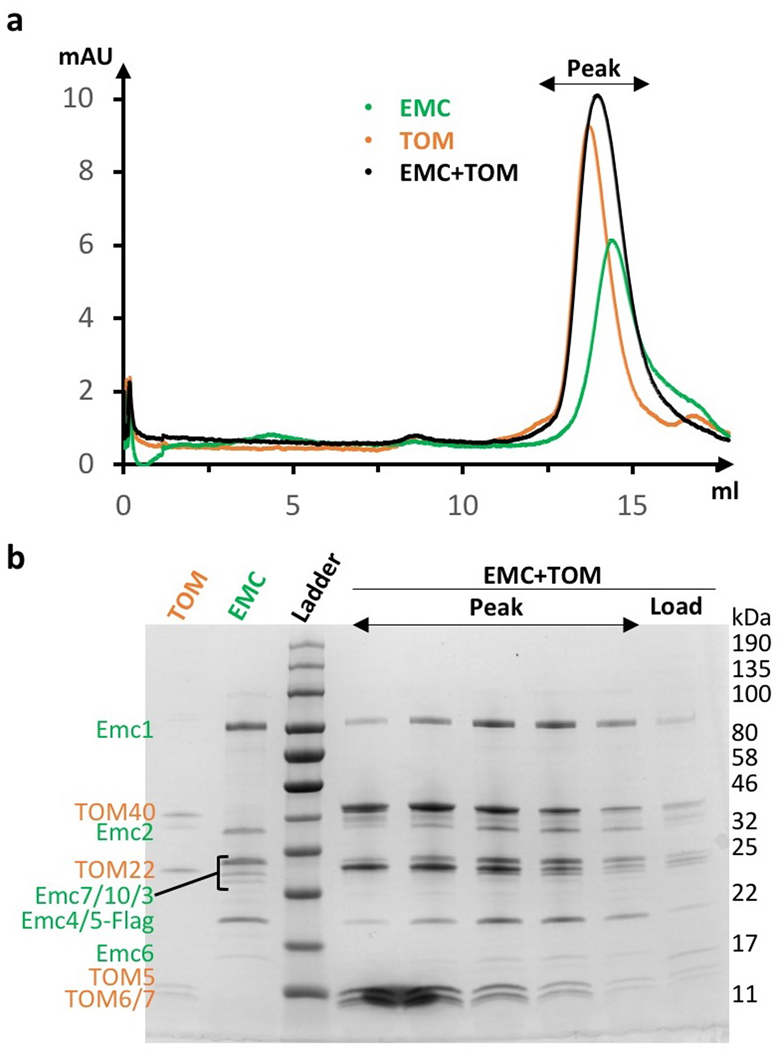
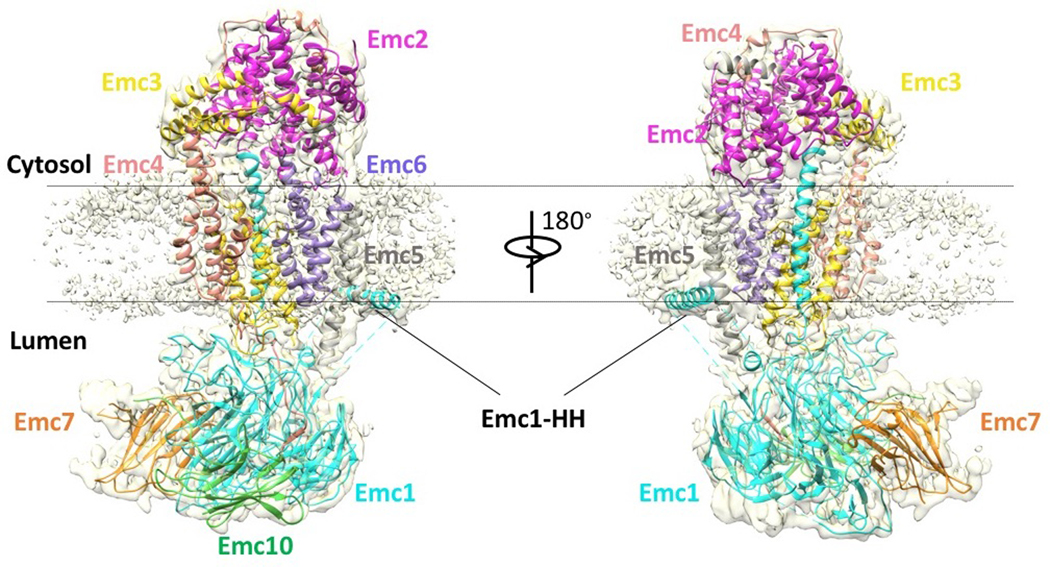
The lumenal region of EMC is formed by Emc1, Emc7, and Emc10 (Fig. 2a-b, Extended Data Fig. 5a-c). The lumenal domain of Emc1 is large and can be further divided into N-terminal domain 1 (NTD1) and NTD2 subdomains (Fig. 2c). The Emc1 NTD2 is an eight-bladed β-propeller, a typical tryptophan–aspartic acid (WD) repeat structure (Extended Data Fig. 5a). A structure-based homology search using the online Dali server suggested many homologues, including the fungal ribosomal protein chaperone Sqt1 19, the ribosome assembly protein Rsa4 20, and the ubiquitin ligase SCF (Extended Data Fig. 5b) 21. Because these proteins are known to function as a hub to mediate protein–protein or protein–substrate interactions, the structural similarity suggests a similar function for the Emc1 β-propeller. The cytosolic region of EMC is formed by Emc2 and the cytosolic domains of Emc3, 4, and 5. Emc2 has 15 α‐helices that form seven tetratricopeptide repeats (TPRs) arranged in a right-handed spiral (Extended Data Fig. 5d). The Emc2 TPR spiral holds onto the cytosolic regions of Emc3, 4, and 5 to form the disc-like cytosolic region of EMC that is tilted about 30° away from the ER membrane. EMC was reported to interact with mitochondrial membrane translocase the TOM complex 14. However, we did not observe direct binding using purified proteins (Extended Data Fig. 6), suggesting that the interaction between EMC and TOM is indirect or too weak to survive the in vitro assay. In the transmembrane region, most TMHs pack tightly against each other except for Emc4 and a horizontal helix of Emc1. The Emc1 horizontal helix is partially embedded in the ER membrane and may stabilize the transmembrane region of EMC (Extended Data Fig. 7). Emc4 has three TMHs that tilt away from Emc3 and Emc6, forming a sizable cavity in the middle of the complex and creating an opening from the membrane region to the cytosol (Figs. 2a-b, 3a). There is a disordered 23-residue loop at the N-terminal region of Emc4 that enables partial flexibility of the Emc4 TMHs; this dynamism of Emc4 may be relevant to EMC function, as discussed below.
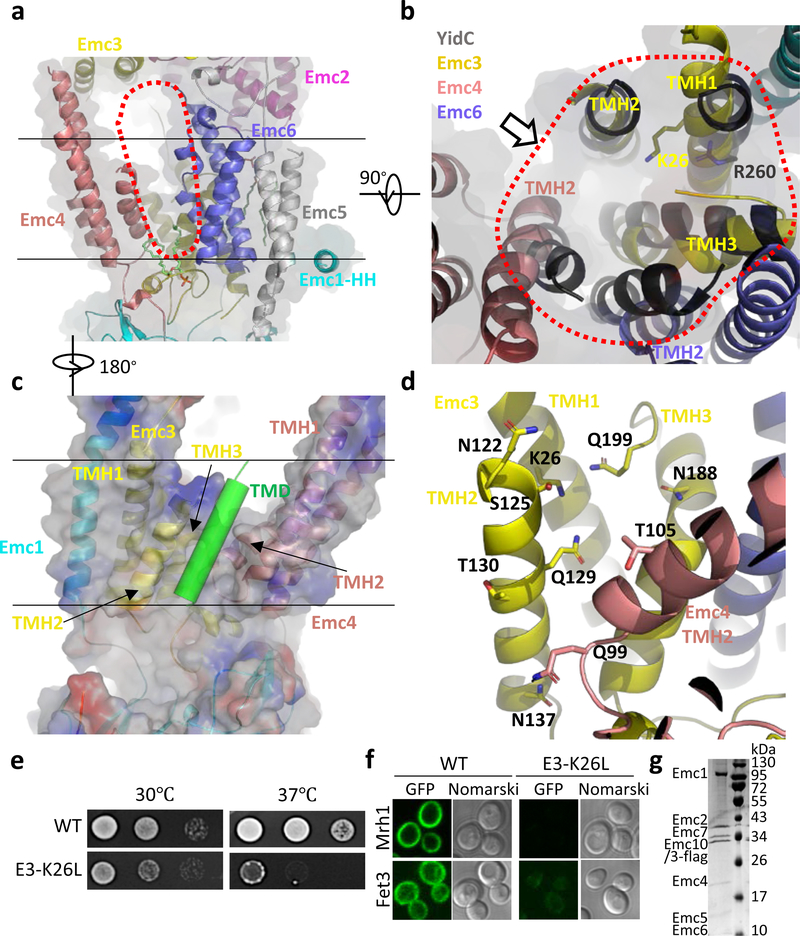
Fig. 3. The transmembrane region of the yeast EMC contains a client-binding pocket.
a, Structure of the transmembrane domain shown as a cartoon in front view. Two parallel black lines mark the lipid bilayer position. The red dots outline the elongated large cavity. Note the horizontal α-helix (HH) in Emc1 at the interface between the lumen and the membrane. b, Superposition of YidC (PDB ID 5Y83) as a black cartoon on the transmembrane domain of EMC in cytosolic view. The red dots encircle the five EMC α-helices aligned with YidC. The putative client TMD position is shown by the arrow, which is suggested by previous YidC-ribosome EM structure 22. c, A front view of the EMC transmembrane region in cartoon and surface potential. The green cylinder represents a client TMD located between TMH2 of Emc3 and TMH2 of Emc4 in the putative client binding pocket. Panels c and d are viewed from the back of panel a. d, The polar environment of the putative client binding pocket of the EMC. e, Two-day growth of 10-fold serially diluted cells (WT and Emc3-K26L mutant) on YPD plates at 30 °C and 37 °C. f, Diminished amount of two EMC clients (Mrh1 and Fet3) in cells containing the Emc3-K26L mutation. EGFP is inserted in the C-termini of these genes. g, The Coomassie blue–stained SDS-PAGE gel of the purified mutant EMC containing a K26L single mutation in Emc3. The experiments in panels e-g were repeated three times yielding similar results. For gel source data, see Supplementary Fig. 1.
The substrate-binding pocket in EMC
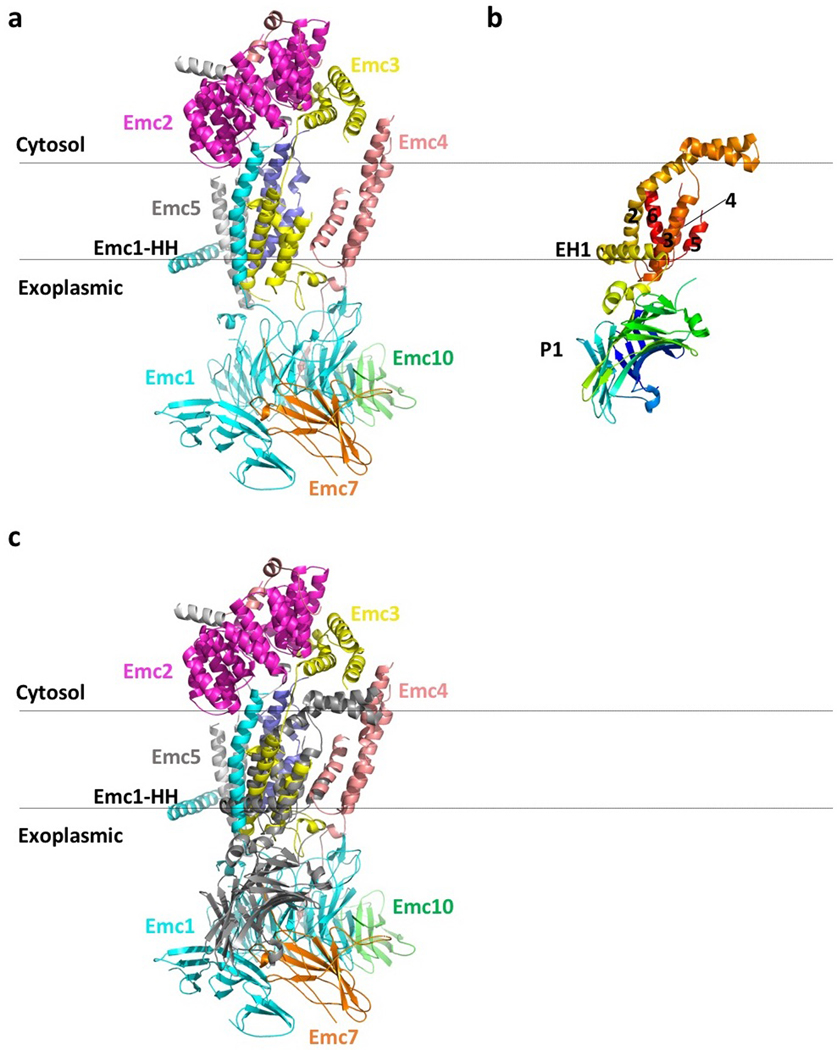
The EMC transmembrane region contains a large cavity surrounded by Emc3, Emc4, and Emc6, and the cavity is accessible from either the front or the left side in the membrane (Fig. 3a-b). EMC is expected to have a TMH-binding pocket to facilitate insertion of a client TMH into the ER membrane. The cavity inside the transmembrane region is the only site with enough size to accommodate a TMH. A previous bioinformatic analysis identified Emc3 as a member of the evolutionarily conserved Oxa1/Alb3/YidC family, which inserts tail-anchored proteins; that family includes the eukaryotic insertase Get1 and the prokaryotic insertase YidC 5. Different from Emc3 and Get1, which each have three TMHs, YidC has five TMHs (TM2–6) and an amphipathic horizontal helix (EH1) (Extended Data Fig. 8a-c) 5.
We found that the three TMHs of Emc3, together with TMH2 of Emc4 and TMH2 of Emc6, form a YidC-like fold (Fig. 3b). These five TMHs of EMC contain a client-binding groove as in the YidC structure. In the EM structures of the YidC–ribosome complexes, the TMH of a nascent peptide emerging from the ribosome is located between TM3 and TM5 in the YidC structure, which corresponds in the EMC to TMH2 of Emc3 and TMH2 of Emc4 22–24. We suggest that this is the EMC’s client binding site, based on the striking structural conservation between the EMC and YidC (Fig. 3c). Intriguingly, this site is located on the Emc3 side in the central cavity. The surface electrostatic potential around the client site is a mix of charges and hydrophobicity. Many polar residues — including K26, N122, S125, T130, N137, N188, Q129, and Q199 of Emc3, and Q99 and T105 of Emc4 — outline the ends of the client site (Fig. 3d). The middle of the client pocket is relatively hydrophobic. It’s uncommon to have so many polar residues exposed to the hydrophobic membrane environment, but this feature is consistent with EMC’s preference for moderately hydrophobic or partially hydrophilic TMH 2.
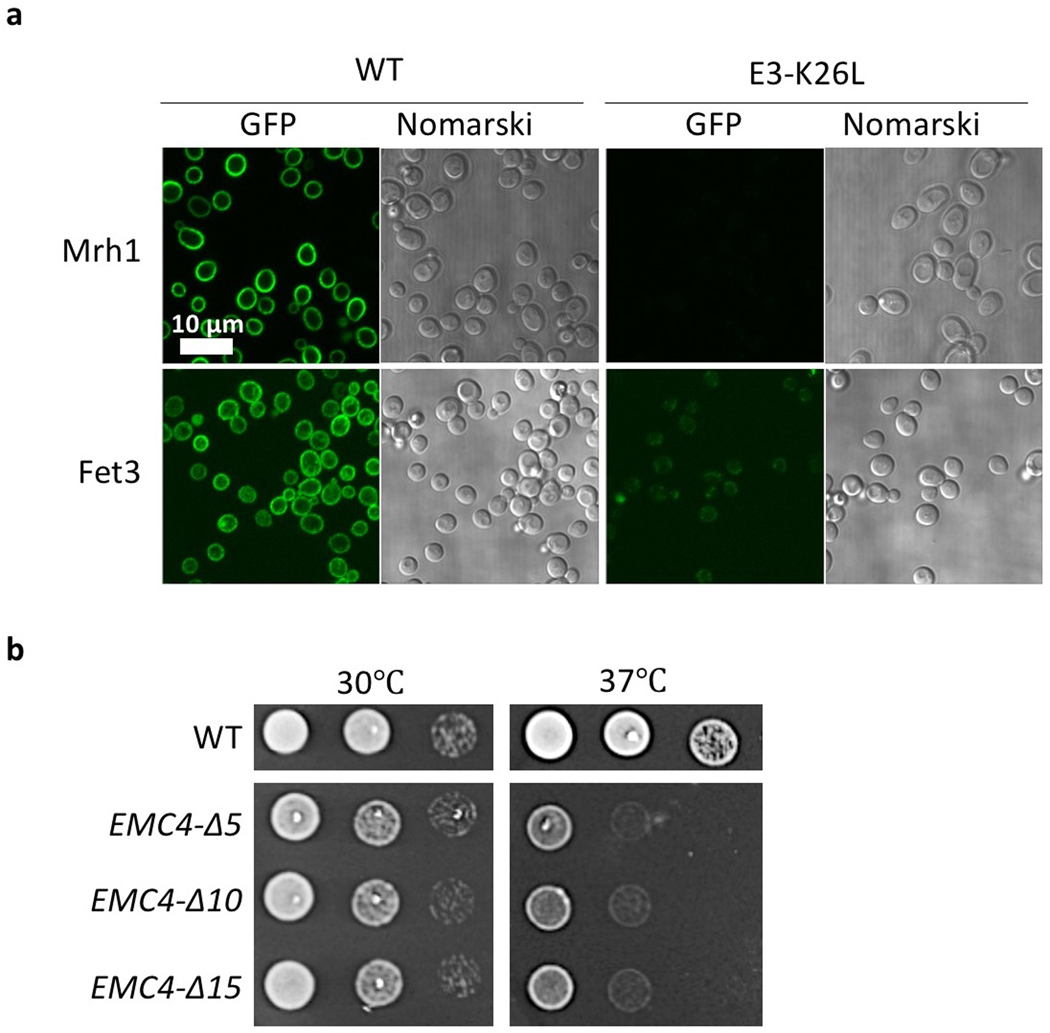
The hydrophilic groove in EMC features a positively charged residue (Emc3-K26), which is structurally equivalent to R72 in the Bacillus halodurans YidC 25, R260 in the Thermotoga maritama YidC (Fig. 3b, 3d) 26, and R366 in the E. coli YidC 24,27. The hydrophilicity of the client grooves of the YidC structures is important for substrate binding 26. This knowledge is consistent with the finding that increasing a client’s hydrophobicity makes the client less dependent on the EMC for membrane insertion, and conversely, that increasing a client’s hydrophilicity makes the client more dependent on the EMC 2,9. We produced an Emc3-K26L yeast strain and found that the cells grew much slower than did WT cells at the elevated temperature of 37°C (Fig. 3e). Furthermore, the putative EMC clients (Mrh1 and Fet3) were unable to properly fold and locate to the membranes of the Emc3-K26L cells (Fig. 3f, Extended Data Fig. 9a). We confirmed that the Emc3-K26L mutation didn’t affect EMC assembly, because the intact mutant complex could be purified (Fig. 3g). These results support our assignment of the partially hydrophilic cavity as the client binding site.
In YidC, TMH2 and TMH3 move away from TMH4–6, widening the central groove between TMH3 and TMH5 to accommodate the client TMH 22–24. The corresponding movement in EMC is between Emc3 TMH2 and Emc4 TMH2. To test whether the flexibility of the TMDs of Emc4 enables a similar conformational change in EMC, we prepared three mutant yeast strains by truncating 5, 10, or 15 residues from the 23-residue loop in Emc4. All strains lost EMC function, as revealed by their growth defect at 37°C (Extended Data Fig. 9b).
EMC resembles YidC in two additional ways: first, both the Emc1 horizontal helix and EH1 of YidC are partially embedded in the exoplasmic side of membrane to support other TMHs, and second, the lumenal region of EMC and the periplasmic P1 domain of YidC are both primarily composed of β-strands (Extended Data Fig. 8a-c). The EMC lumenal region may also interact with the Sec translocon like the YidC P1 domain does 28,29.
A model for client TMH insertion by EMC
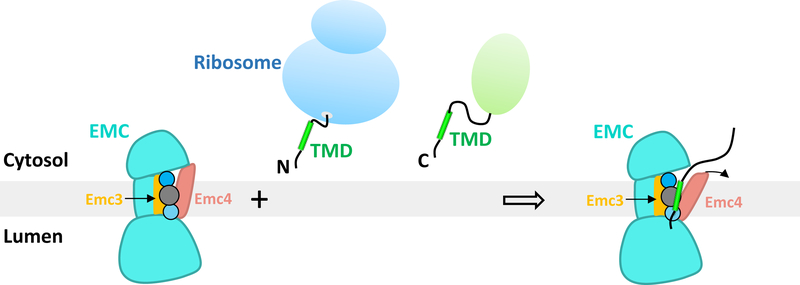
EMC inserts tail-anchored proteins and the first TMH of membrane proteins 2,3, as well as the second or other TMHs for some multi-pass integral transmembrane proteins 8–10. How EMC recognizes such diverse clients is unclear. By combining our studies with the recent elegant biochemical work 1,2, we suggest a client TMH insertion mechanism for the EMC as shown in Fig. 4.
Fig. 4. A model for client TMH insertion by the eukaryotic EMC.
The model highlights the EMC’s ability to chaperone or to facilitate membrane insertion of a diverse set of transmembrane protein clients, with their respective TMH either at the N-terminus (N) or at the C-terminus (C). The TMH insertion can be either co-translational (represented by a client emerging from a ribosome) or post-translational (represented by a client with a folded green domain). The model also shows the presence of a partially hydrophilic pocket formed by the TMDs of Emc3 and Emc4 – the putative client binding pocket – in the transmembrane region of the EMC complex. The pocket is lined by three connected circles which represent the presence of multiple hydrophilic (blue circles) and hydrophobic residues (grey circle). The curved black arrow indicates a potential movement of the Emc4 TMD to accommodate the client TMH.
A key feature of an EMC client is the partial hydrophilicity of the TMH, i.e., it contains multiple polar or charged residues 2,8,9,30. To accommodate such clients, the client binding pocket of EMC is also partially hydrophilic. Emc3 is at the core of the EMC active site, consistent with its evolutionary link with the Oxa1/Alb3/YidC insertase family. Another important feature of EMC is the flexible client binding pocket, made possible by the long linker connecting the TMD of Emc4. Similar flexibility is also observed in the homologue YidC 22–24. Therefore, this study reveals a remarkable structural and mechanistic conservation between the eukaryotic EMC and the prokaryotic insertases.
METHODS
Purification of the endogenous EMC complex.
The C-terminal, triple-FLAG-tagged Emc5 construct was generated by using a PCR-based genomic epitope-tagging method 31 on the yeast strain W303–1a (MATa leu2–3,112 trp1–1 can1–100 ura3–1 ade2–1 his3–11). 18L cells were grown in YPD medium for about 20 h. The harvested cells were resuspended in lysis buffer containing 20 mM Tris-HCl (pH 7.4), 0.2 M sorbitol, 50 mM potassium acetate, 2 mM EDTA, and 1 mM phenylmethylsulfonyl fluoride (PMSF) and then were lysed using a French press at 15,000 psi. Lysate was centrifuged at 10,000 × g for 30 min at 4°C. The supernatant was collected and centrifuged at 100,000 × g for 60 min at 4°C. The membrane pellet was collected and then resuspended in buffer A containing 10% glycerol, 20 mM Tris-HCl (pH 7.4), 1.5% digitonin, 0.5 M NaCl, 1 mM MgCl2, 1 mM MnCl2, 1 mM EDTA, and 1 mM PMSF. After incubation for 30 min at 4°C, the mixture was centrifuged for 30 min at 120,000 × g to remove insolubilized membrane. The supernatant was mixed with pre-washed anti-FLAG (M2) affinity gel at 4°C overnight with shaking. The affinity gel was then collected and washed three times in buffer B containing 0.1% digitonin, 150 mM NaCl, 20 mM Tris-HCl, pH 7.4, 1 mM MgCl2, and 1 mM MnCl2. The EMC was eluted with buffer B containing 0.15 mg/ml 3×FLAG peptide and was further purified in a Superose 6 10/300 gel filtration column in buffer C containing 0.1% digitonin, 150 mM NaCl, 20 mM Tris-HCl, pH 7.4, 1 mM MgCl2, and 1 mM MnCl2. Finally, the purified EMC sample was assessed by SDS-PAGE gel and the subunit composition was identified by trypsin digestion and mass spectrometry.
Colony growth assay.
Yeast WT (BY4741) and Emc knockout strains were purchased from The Yeast Knockout (YKO) Collection of Horizon Discovery. Emc3 mutant and Emc4 truncations (Emc3-K26L, Emc4-∆56–60, Emc4-∆51–60 and Emc4-∆46–60) were prepared using plasmid pFA6a-His3 in the BY4741 strain. The strains were first grown to the same OD in the YPD medium at 30°C. Then 7 μL of 1:10 serial dilutions of the cells were spotted onto YPD plates, incubated at 30°C or 37°C for 2 days and then were examined for growth phenotype.
TMT mass spectrometry.
The membrane pellets were prepared following the above-described method for EMC purification. Then the membrane preparations were resuspended in buffer containing 10% glycerol, 20 mM Tris-HCl (pH 7.4), 1% DDM, 0.5 M NaCl, 1 mM MgCl2, 1 mM MnCl2, 1 mM EDTA, and 1 mM PMSF. After centrifugation at 100,000 × g for 60 min at 4 °C, the supernatants were collected and sent to MS Biowork for TMT-MS. Data analysis followed the protocol using scripts published by Dr. K. Kammers (http://www.biostat.jhsph.edu/~kkammers/software/eupa/R_guide.html) 32. Only proteins that are annotated to be membrane proteins in Gene Ontology annotation were plotted.
Light microscopy and image processing.
Genes were labeled by EGFP in the C-termini using plasmid pFA6a-link-yoEGFP-SpHis5 (Addgene). Microscopy was performed with a Nikon A1plus-RSi laser scanning confocal microscope at 100× oil objective. Image acquisition and analysis were performed with the program NIS-Elements Software and ImageJ. The displayed microscopic images of control and knockout/mutant samples were adjusted equally using the same brightness and contrast values. Yeast cells were briefly washed with water and immediately imaged in water at room temperature.
RNA isolation and quantitative real-time PCR.
Total RNA was extracted from cells with MasterPure Yeast RNA Purification Kit (Lucigen). The SuperScript IV VILO Master Mix Kit (Invitrogen Life Technologies) was used for first-strand complementary DNA synthesis (0.1 μg/μl mRNA in reaction system). Quantitative real-time PCR amplification was carried out using the Step One Plus Thermocycler (Applied Biosystems). Each reaction included 5 μl Power SYBR Green Real-Time PCR Master Mix (Applied Biosystems), 2.5 μl complementary DNA sample and 2.5 μl PCR primer mix (forward and reverse each 0.8 μm). Actin (ACT1) was used as internal control. The relative gene expression was expressed as a percentage of the WT control.
Cryo-electron microscopy.
Aliquots of 3 μL of purified EMC at a concentration of about 5 mg/mL were placed on glow-discharged holey carbon grids (Quantifoil Au R2/1, 300 mesh) and were flash-frozen in liquid ethane using an FEI Vitrobot Mark IV. Cryo-EM data was collected automatically with SerialEM in a 300-kV FEI Titan Krios electron microscope operated at a nominal magnification of 130,000× and a pixel size of 0.5145 Å per pixel with defocus values from −1.0 to −2.0 μm. A K2 direct detector was used for image recording under counting mode. The dose rate was 8.6 electrons per Å2 per second, and the total exposure time was 8 s. The total dose was divided into a 40-frame movie so each frame was exposed for 0.2 s.
Cryo-EM image processing.
We collected 4260 raw movie micrographs. Program MotionCorr 2.0 33 was used for motion correction, and CTFFIND 4.1 was used for calculating contrast transfer function parameters 34. All the remaining steps were performed using RELION 3 35. Templates for automatic particle picking were generated from a 2D classification of about 2,000 manually picked particles. A total of 590,118 particles were picked automatically. 2D classification was then performed, and particles in the classes with features unrecognizable by visual inspection were removed. A total of 464,190 particles remained and were used for 3D classification. Based on the quality of the four 3D classes, 355,991 particles belonging to two good classes were selected for further 3D reconstruction, refinement, and postprocessing, resulting in a 3.0-Å average resolution 3D density map. The resolution of the map was estimated by the gold-standard Fourier shell correlation at a correlation cutoff value of 0.143.
Structural modeling, refinement, and validation.
The initial models of EMC were first automatically built into the 3.0-Å EM map using the map_to_model in the PHENIX program 36. About 1000 residues (approximately 60% of the whole complex) were automatically modeled, and about half of them were Cαs. The initial model was then manually checked and corrected in COOT 5. Based on the initial model, we then manually built the entire complex in the programs COOT 5 and Chimera 37,38. The complete EMC model was refined by real-space refinement in the PHENIX program and subsequently adjusted manually in COOT. Finally, the atomic model was validated using MolProbity in PHENIX 36,39. The real-space correlation coefficients calculated for all amino-acid residues are shown as Supplementary Table 3. To avoid overfitting, we validated the final model following a previous method 40. Three FSC curves, i.e., model vs. final map, FSCwork (modelsf vs. Half1 map) and FSCfree (modelsf vs. Half2 map), were produced. The general agreement of these curves was taken as an indication that the model was not overfit. Structural figures were prepared in Chimera 38 and PyMOL (https://pymol.org/2/).
In vitro binding assay of EMC with the TOM complex.
3× FLAG tag was inserted onto the carboxyl terminus of the Tom22 gene. The endogenous Saccharomyces cerevisiae TOM complex was purified by anti-FLAG affinity resin and size-exclusion chromatography using the same protocol as for the EMC. In the binding assay, two times more of the purified TOM was pre-incubated with EMC for 1 h at 4°C, and then analyzed in a Superose 6 10/300 gel filtration column in buffer containing 0.01% GDN, 150 mM NaCl, 20 mM Tris-HCl, pH 7.4, 1 mM MgCl2, and 1 mM MnCl2. As controls, the purified TOM and EMC proteins were analyzed separately using the same conditions.
Extended Data
Extended Data Figure 1. Data processing and validation of cryo-EM micrographs and 3D reconstruction.
a, Gel filtration profile of the EMC complex. This experiment was repeated >5 times yielding similar results. b-c, Representative electron micrograph and selected reference-free 2D class averages of the EMC. A total of 4260 micrographs were recorded with similar quality. d, Cryo-EM data processing procedure. e, Gold-standard Fourier shell correlations of two independent half maps with or without mask, and with randomized phases, and the validation correlation curves of the atomic model by comparing the model with the final map or with the two half maps. f, Local resolution map of the 3D map. g, Angular distribution of particles used in final reconstruction of the 3D map.
Extended Data Figure 2. Protein abundance and localization of nine putative EMC clients in WT and EMC3 knockout yeast strains.
The EGFP is appended to the C-termini of the genes. The scale bar is 10 μm. This experiment was repeated three times yielding similar results.
Extended Data Figure 3. Cryo-EM 3D density map of the EMC.
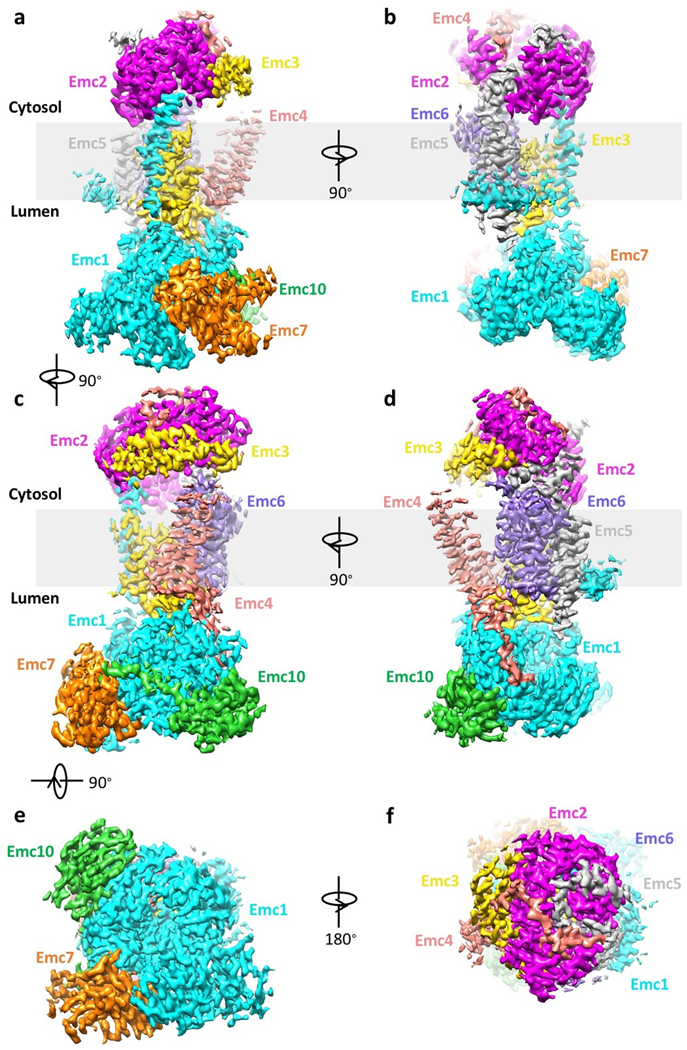
The surface-rendered map is shown in front view (a), left side view (b), right side view (c), back view (d), bottom (lumenal) view (e), and top (cytosolic) view (f). Maps are colored by individual subunits.
Extended Data Figure 4. The fitting of the atomic model and the 3D map in selected regions.
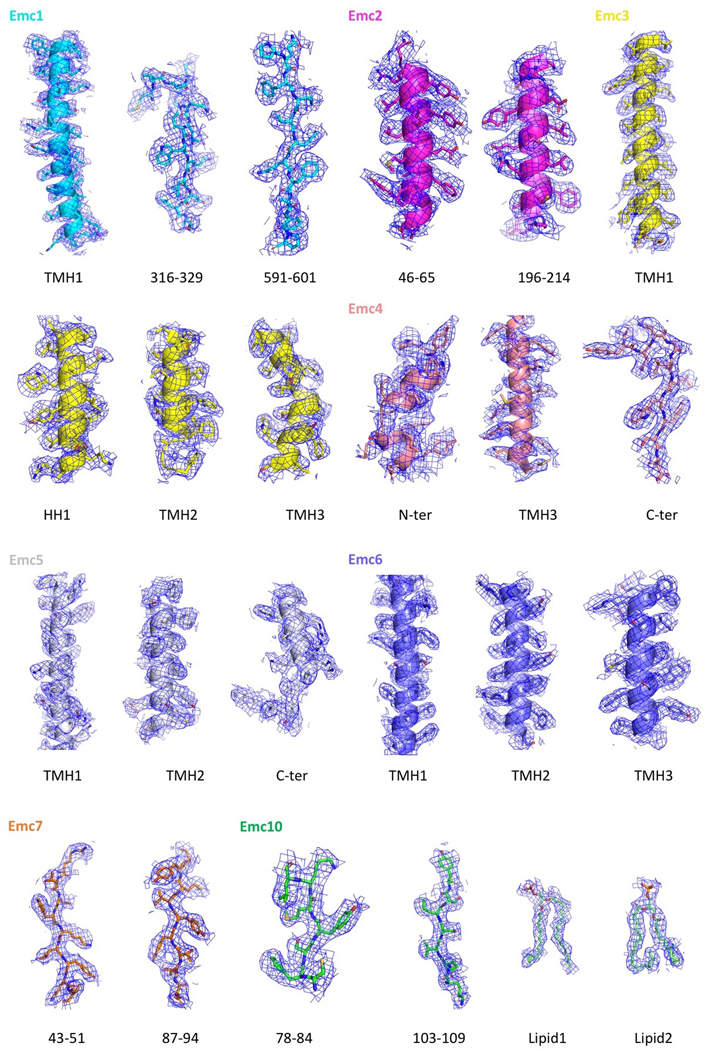
3D density map and atomic model of selected regions in each of the eight EMC subunits, as well as the densities of atomic models of the two phospholipid molecules. NT: N-terminal domain; CT: C-terminal domain; HH: horizontal helix.
Extended Data Figure 5. Structure of the lumenal and cytosolic regions of the yeast EMC.
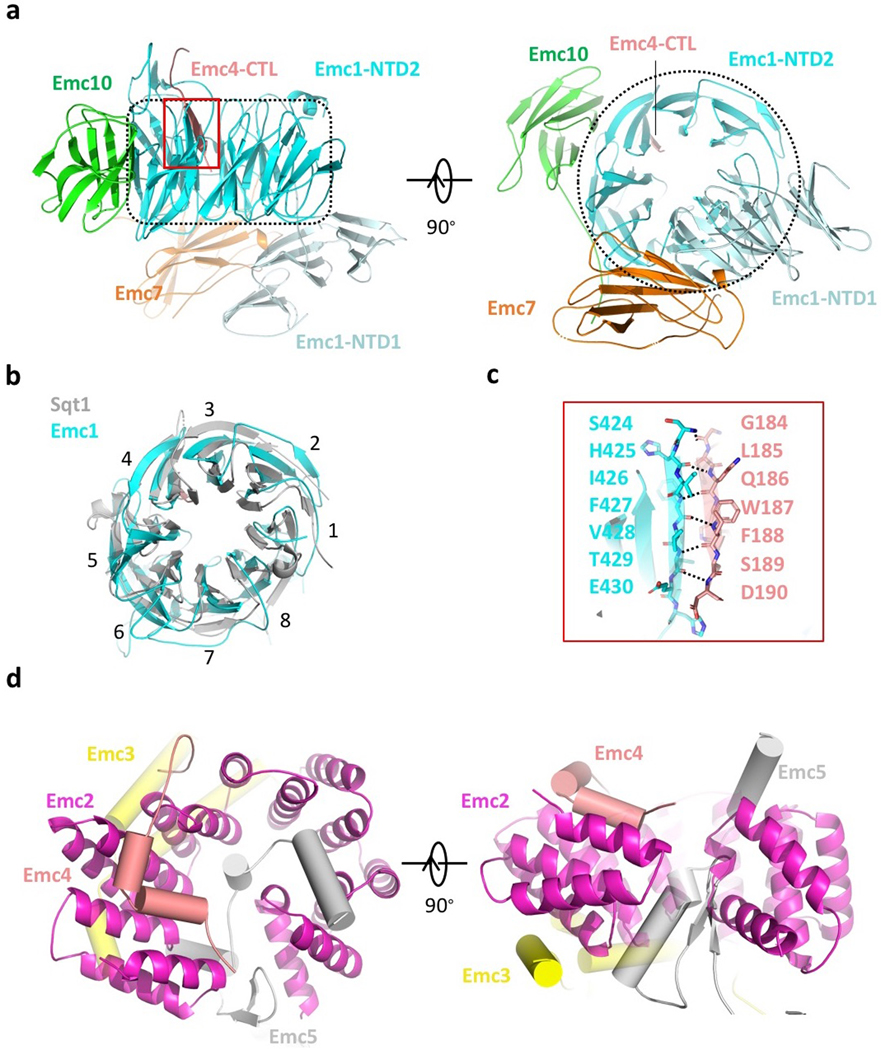
a, Structure of the EMC lumenal region shown in front, side, and bottom (lumenal) views. The interface area between C-terminal loop of Emc4 and the NTD2 of Emc1 is outlined by a red rectangle. The dotted black area marks the NTD2 of Emc1, which is an eight-bladed β-propeller. b, Superposition of the NTD2 β-propeller of Emc1 with the structure of a fungus chaperone protein Sqt1 (PDB ID 4ZN4). c, Enlarged view of the red-outlined region in panel a. d, Structure of the EMC cytosolic region in top (cytosolic) and front side views. Emc2 as the organizing center is shown in cartoon, and the cytosolic domains of Emc3, 4, and 5 are shown as cylinders.
Extended Data Figure 6. In vitro binding assays between the purified EMC and the TOM complex.
a, Gel filtration profiles of the EMC alone, the TOM complex alone, and the mixture of the EMC-TOM complexes. No peak corresponding to the assembly of the EMC-TOM complex was observed. The experiment was repeated three times yielding similar results. b, Peak fractions of the EMC-TOM mixture in panel a were checked by the Coomassie blue-stained SDS-PAGE gel. The band densities suggest that the peak is simply an overlap of the unbound and separate EMC and TOM. For gel source data, see Supplementary Fig. 1.
Extended Data Figure 7. The 3D EM map of the EMC surface rendered at a low display threshold.
The bound lipids/detergents surrounding the transmembrane region of the EMC complex are visible in this low-threshold display. The atomic model in cartoon is superimposed on the 3D map. Note that the horizontal helix (HH) of Emc1 is at the ER lumen–membrane boundary.
Extended Data Figure 8. Structural comparison between yeast EMC and E. coli YidC.
a, Structure of EMC in cartoon. b, Structure of E. coli YidC in cartoon (PDB ID 3WVF). c, Superposed structures of EMC (color) and YidC (dark grey).
Extended Data Figure 9. Comparisons of protein abundance, localization, and growth of the mutant yeast strains with the WT cells.
a, Protein abundance and localization of two putative EMC clients (Mrh1 and Fet3) in WT and EMC3 K26L mutant yeast strains. The EGFP is appended to the C-termini of the genes. b, Growth experiments of yeast strains containing Emc4 linker loop truncations. The three truncations were Emc4-∆56–60, Emc4-∆51–60, and Emc4-∆46–60. Experiments in panels a and b were repeated three times yielding similar results.
Extended Data Table 1.
Cryo-EM data collection, refinement, and validation statistics.
| S. cerevisiae EMC (EMDB-21587) (PDB 6WB9) | |
|---|---|
| Data collection and processing | Titan Krios (FEI) |
| Magnification | 130,000 |
| Voltage (kV) | 300 |
| Electron exposure (e-/Å2) | 69 |
| Defocus range (μm) | 1.0–2.0 |
| Pixel size (Å) | 1.029 |
| Symmetry imposed | C1 |
| Initial particle images (no.) | 590,118 |
| Final particle images (no.) | 355,991 |
| Map resolution (Å) | 3.0 |
| FSC threshold | 0.143 |
| Map resolution range (Å) | 3.0–250 |
| Refinement | |
| Model resolution (Å) | 3.1 |
| FSC threshold | 0.5 |
| Model resolution range (Å) | 3.1–250 |
| Map sharpening B factor (Å2) | 96.5 |
| Model composition | |
| Non-hydrogen atoms | 14,510 |
| Protein residues | 1771 |
| Ligands | 8 |
| B factors (Å2) | |
| Protein | 51.4 |
| Ligand | 65.4 |
| R.m.s. deviations | |
| Bond lengths (Å) | 0.005 |
| Bond angles (°) | 0.748 |
| Validation | |
| MolProbity score | 1.99 |
| Clashscore | 9.85 |
| Poor rotamers (%) | 0.87 |
| Ramachandran plot | |
| Favored (%) | 92.2 |
| Allowed (%) | 7.8 |
| Disallowed (%) | 0 |
Supplementary Material
ACKNOWLEDGEMENTS.
Cryo-EM images were collected in the David Van Andel Advanced Cryo-Electron Microscopy Suite at Van Andel Research Institute. We thank Gongpu Zhao and Xing Meng for assistance with data collection and David Nadziejka for critical reading of the manuscript. This work was supported by the U.S. National Institutes of Health (R01 CA231466 to H.L.) and Van Andel Institute (to H.L.).
Footnotes
Supplementary Information is available in the online version of the paper.
DATA AVAILABILITY. The cryo-EM 3D map of the S. cerevisiae EMC complex has been deposited at the EMDB database with accession code EMD-21587. The corresponding atomic model was deposited at the RCSB PDB with accession code 6WB9. The TMT mass spectrometry data and the real-space correlation coefficients of all residues with experimental densities data are included with the manuscript as Supplementary Tables 1-3. The uncropped SDS-PAGE gels used in Fig. 1a, Fig. 3g, and Extended Data Fig. 6b can be found in Supplementary Fig. 1.
COMPETING INTERESTS. The authors declare no competing interests.
REFERENCES
- 1.Shurtleff MJ et al. The ER membrane protein complex interacts cotranslationally to enable biogenesis of multipass membrane proteins. Elife 7, doi: 10.7554/eLife.37018 (2018). [DOI] [PMC free article] [PubMed] [Google Scholar]
- 2.Chitwood PJ, Juszkiewicz S, Guna A, Shao S & Hegde RS EMC Is Required to Initiate Accurate Membrane Protein Topogenesis. Cell 175, 1507–1519 e1516, doi: 10.1016/j.cell.2018.10.009 (2018). [DOI] [PMC free article] [PubMed] [Google Scholar]
- 3.Guna A, Volkmar N, Christianson JC & Hegde RS The ER membrane protein complex is a transmembrane domain insertase. Science 359, 470–473, doi: 10.1126/science.aao3099 (2018). [DOI] [PMC free article] [PubMed] [Google Scholar]
- 4.Chen Y & Dalbey RE Oxa1 Superfamily: New Members Found in the ER. Trends Biochem Sci 43, 151–153, doi: 10.1016/j.tibs.2017.12.005 (2018). [DOI] [PubMed] [Google Scholar]
- 5.Anghel SA, McGilvray PT, Hegde RS & Keenan RJ Identification of Oxa1 Homologs Operating in the Eukaryotic Endoplasmic Reticulum. Cell Rep 21, 3708–3716, doi: 10.1016/j.celrep.2017.12.006 (2017). [DOI] [PMC free article] [PubMed] [Google Scholar]
- 6.Fry MY & Clemons WM Jr. Complexity in targeting membrane proteins. Science 359, 390–391, doi: 10.1126/science.aar5992 (2018). [DOI] [PubMed] [Google Scholar]
- 7.Richard M, Boulin T, Robert VJ, Richmond JE & Bessereau JL Biosynthesis of ionotropic acetylcholine receptors requires the evolutionarily conserved ER membrane complex. Proc Natl Acad Sci U S A 110, E1055–1063, doi: 10.1073/pnas.1216154110 (2013). [DOI] [PMC free article] [PubMed] [Google Scholar]
- 8.Coelho JPL et al. A network of chaperones prevents and detects failures in membrane protein lipid bilayer integration. Nat Commun 10, 672, doi: 10.1038/s41467-019-08632-0 (2019). [DOI] [PMC free article] [PubMed] [Google Scholar]
- 9.Tian S et al. Proteomic Analysis Identifies Membrane Proteins Dependent on the ER Membrane Protein Complex . Cell Rep 28, 2517–2526 e2515, doi: 10.1016/j.celrep.2019.08.006 (2019). [DOI] [PMC free article] [PubMed] [Google Scholar]
- 10.Hiramatsu N, Tago T, Satoh T & Satoh AK ER membrane protein complex is required for the insertions of late-synthesized transmembrane helices of Rh1 in Drosophila photoreceptors. Mol Biol Cell, mbcE19080434, doi: 10.1091/mbc.E19-08-0434 (2019). [DOI] [PMC free article] [PubMed] [Google Scholar]
- 11.Bagchi P, Inoue T & Tsai B. EMC1-dependent stabilization drives membrane penetration of a partially destabilized non-enveloped virus. Elife 5, doi: 10.7554/eLife.21470 (2016). [DOI] [PMC free article] [PubMed] [Google Scholar]
- 12.Christianson JC et al. Defining human ERAD networks through an integrative mapping strategy. Nat Cell Biol 14, 93–105, doi: 10.1038/ncb2383 (2011). [DOI] [PMC free article] [PubMed] [Google Scholar]
- 13.Jonikas MC et al. Comprehensive characterization of genes required for protein folding in the endoplasmic reticulum. Science 323, 1693–1697, doi: 10.1126/science.1167983 (2009). [DOI] [PMC free article] [PubMed] [Google Scholar]
- 14.Lahiri S et al. A conserved endoplasmic reticulum membrane protein complex (EMC) facilitates phospholipid transfer from the ER to mitochondria. PLoS Biol 12, e1001969, doi: 10.1371/journal.pbio.1001969 (2014). [DOI] [PMC free article] [PubMed] [Google Scholar]
- 15.Wideman JG The ubiquitous and ancient ER membrane protein complex (EMC): tether or not? F1000Res 4, 624, doi: 10.12688/f1000research.6944.2 (2015). [DOI] [PMC free article] [PubMed] [Google Scholar]
- 16.Louie RJ et al. A yeast phenomic model for the gene interaction network modulating CFTR-DeltaF508 protein biogenesis. Genome Med 4, 103, doi: 10.1186/gm404 (2012). [DOI] [PMC free article] [PubMed] [Google Scholar]
- 17.Bircham PW et al. Secretory pathway genes assessed by high-throughput microscopy and synthetic genetic array analysis. Mol Biosyst 7, 2589–2598, doi: 10.1039/c1mb05175j (2011). [DOI] [PubMed] [Google Scholar]
- 18.Kudze T, Mendez-Dorantes C, Jalloh CS & McClellan AJ Evidence for interaction between Hsp90 and the ER membrane complex. Cell Stress Chaperones 23, 1101–1115, doi: 10.1007/s12192-018-0908-z (2018). [DOI] [PMC free article] [PubMed] [Google Scholar]
- 19.Pausch P et al. Co-translational capturing of nascent ribosomal proteins by their dedicated chaperones. Nat Commun 6, 7494, doi: 10.1038/ncomms8494 (2015). [DOI] [PMC free article] [PubMed] [Google Scholar]
- 20.Bassler J et al. A network of assembly factors is involved in remodeling rRNA elements during preribosome maturation. J Cell Biol 210, 169–170, doi: 10.1083/jcb.20140811106112015c (2015). [DOI] [PMC free article] [PubMed] [Google Scholar]
- 21.Tang X et al. Composite low affinity interactions dictate recognition of the cyclin-dependent kinase inhibitor Sic1 by the SCFCdc4 ubiquitin ligase. Proc Natl Acad Sci U S A 109, 3287–3292, doi: 10.1073/pnas.1116455109 (2012). [DOI] [PMC free article] [PubMed] [Google Scholar]
- 22.Kedrov A et al. Structural Dynamics of the YidC:Ribosome Complex during Membrane Protein Biogenesis. Cell Rep 17, 2943–2954, doi: 10.1016/j.celrep.2016.11.059 (2016). [DOI] [PMC free article] [PubMed] [Google Scholar]
- 23.Wickles S et al. A structural model of the active ribosome-bound membrane protein insertase YidC. Elife 3, e03035, doi: 10.7554/eLife.03035 (2014). [DOI] [PMC free article] [PubMed] [Google Scholar]
- 24.Kohler R et al. YidC and Oxa1 form dimeric insertion pores on the translating ribosome. Mol Cell 34, 344–353, doi: 10.1016/j.molcel.2009.04.019 (2009). [DOI] [PubMed] [Google Scholar]
- 25.Kumazaki K et al. Structural basis of Sec-independent membrane protein insertion by YidC. Nature 509, 516–520, doi: 10.1038/nature13167 (2014). [DOI] [PubMed] [Google Scholar]
- 26.Xin Y et al. Structure of YidC from Thermotoga maritima and its implications for YidC-mediated membrane protein insertion. FASEB J 32, 2411–2421, doi: 10.1096/fj.201700893RR (2018). [DOI] [PubMed] [Google Scholar]
- 27.Kumazaki K et al. Crystal structure of Escherichia coli YidC, a membrane protein chaperone and insertase. Sci Rep 4, 7299, doi: 10.1038/srep07299 (2014). [DOI] [PMC free article] [PubMed] [Google Scholar]
- 28.Xie K, Kiefer D, Nagler G, Dalbey RE & Kuhn A. Different regions of the nonconserved large periplasmic domain of Escherichia coli YidC are involved in the SecF interaction and membrane insertase activity. Biochemistry 45, 13401–13408, doi: 10.1021/bi060826z (2006). [DOI] [PubMed] [Google Scholar]
- 29.Sachelaru I et al. YidC occupies the lateral gate of the SecYEG translocon and is sequentially displaced by a nascent membrane protein. J Biol Chem 288, 16295–16307, doi: 10.1074/jbc.M112.446583 (2013). [DOI] [PMC free article] [PubMed] [Google Scholar]
- 30.Lin DL et al. The ER Membrane Protein Complex Promotes Biogenesis of Dengue and Zika Virus Non-structural Multi-pass Transmembrane Proteins to Support Infection. Cell Rep 27, 1666–1674 e1664, doi: 10.1016/j.celrep.2019.04.051 (2019). [DOI] [PMC free article] [PubMed] [Google Scholar]
References in Methods
- 31.Funakoshi M & Hochstrasser M. Small epitope-linker modules for PCR-based C-terminal tagging in Saccharomyces cerevisiae. Yeast 26, 185–192, doi: 10.1002/yea.1658 (2009). [DOI] [PMC free article] [PubMed] [Google Scholar]
- 32.Kammers K, Cole RN, Tiengwe C & Ruczinski I. Detecting Significant Changes in Protein Abundance. EuPA Open Proteom 7, 11–19, doi: 10.1016/j.euprot.2015.02.002 (2015). [DOI] [PMC free article] [PubMed] [Google Scholar]
- 33.Zheng SQ et al. MotionCor2: anisotropic correction of beam-induced motion for improved cryo-electron microscopy. Nat Methods 14, 331–332, doi: 10.1038/nmeth.4193 (2017). [DOI] [PMC free article] [PubMed] [Google Scholar]
- 34.Mindell JA & Grigorieff N. Accurate determination of local defocus and specimen tilt in electron microscopy. J Struct Biol 142, 334–347 (2003). [DOI] [PubMed] [Google Scholar]
- 35.Zivanov J et al. New tools for automated high-resolution cryo-EM structure determination in RELION-3. Elife 7, doi: 10.7554/eLife.42166 (2018). [DOI] [PMC free article] [PubMed] [Google Scholar]
- 36.Adams PD et al. PHENIX: a comprehensive Python-based system for macromolecular structure solution. Acta Crystallogr D Biol Crystallogr 66, 213–221, doi: 10.1107/S0907444909052925 (2010). [DOI] [PMC free article] [PubMed] [Google Scholar]
- 37.Emsley P, Lohkamp B, Scott WG & Cowtan K. Features and development of Coot. Acta Crystallogr D Biol Crystallogr 66, 486–501, doi: 10.1107/S0907444910007493 (2010). [DOI] [PMC free article] [PubMed] [Google Scholar]
- 38.Pettersen EF et al. UCSF Chimera--a visualization system for exploratory research and analysis. J Comput Chem 25, 1605–1612, doi: 10.1002/jcc.20084 (2004). [DOI] [PubMed] [Google Scholar]
- 39.Chen VB et al. MolProbity: all-atom structure validation for macromolecular crystallography. Acta Crystallogr D Biol Crystallogr 66, 12–21, doi: 10.1107/S0907444909042073 (2010). [DOI] [PMC free article] [PubMed] [Google Scholar]
- 40.Amunts A et al. Structure of the yeast mitochondrial large ribosomal subunit. Science 343, 1485–1489, doi: 10.1126/science.1249410 (2014). [DOI] [PMC free article] [PubMed] [Google Scholar]
Associated Data
This section collects any data citations, data availability statements, or supplementary materials included in this article.


