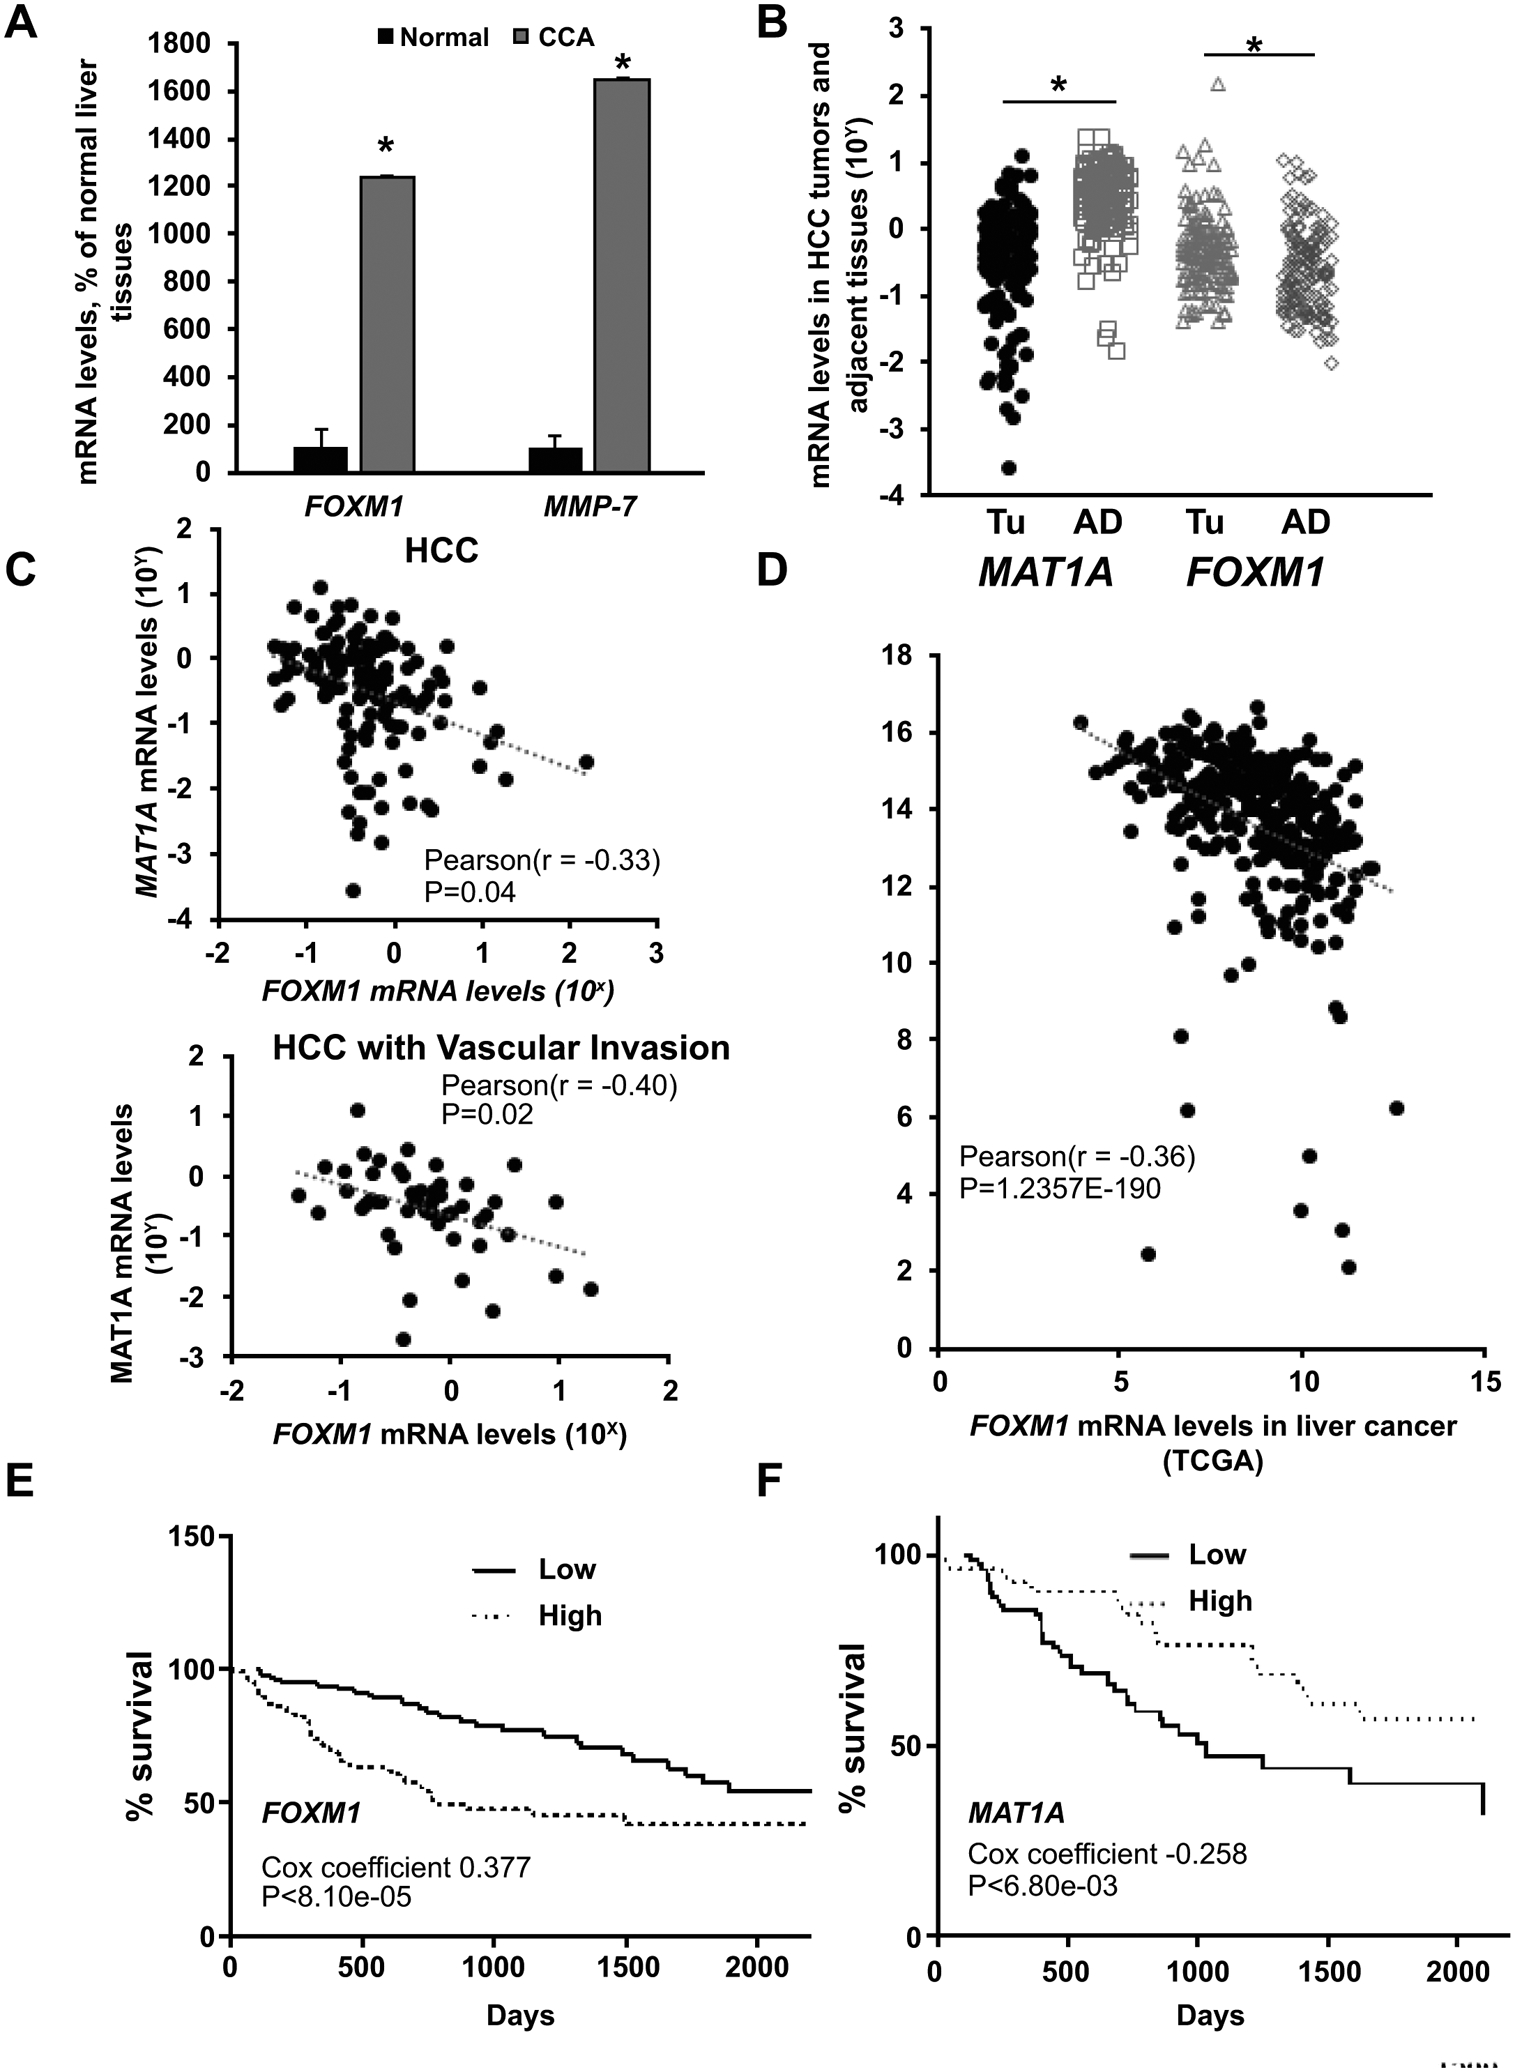
Figure 1. FOXM1 and MAT1A mRNA levels in HCC and CCA, and their influences on survival curves in HCC.

A) Relative FOXM1 and MMP-7 mRNA levels from seven patients with CCA compared to normal liver tissues. *p < 0.05 vs. normal human liver tissues. B) Relative MAT1A and FOXM1 mRNA levels from 143 patients with HCC (TU) compared to adjacent non-tumorous tissues (AD). *p < 0.05 vs. AD. C) Pearson correlation analysis of MAT1A and FOXM1 mRNA levels in 143 HCC specimens and in 52 HCCs with vascular invasion. D) Pearson correlation analysis of FOXM1 and MAT1A mRNA levels in HCC Samples (N=366) from the Cancer Genome Atlas (TCGA) dataset. E and F) Kaplan-Meier survival curves of HCC patients from the TCGA dataset stratified into high (upper 33rd percentile, n=118) or low (lower 33rd percentile, n=118) FOXM1 (E) and MAT1A (F) mRNA levels.
