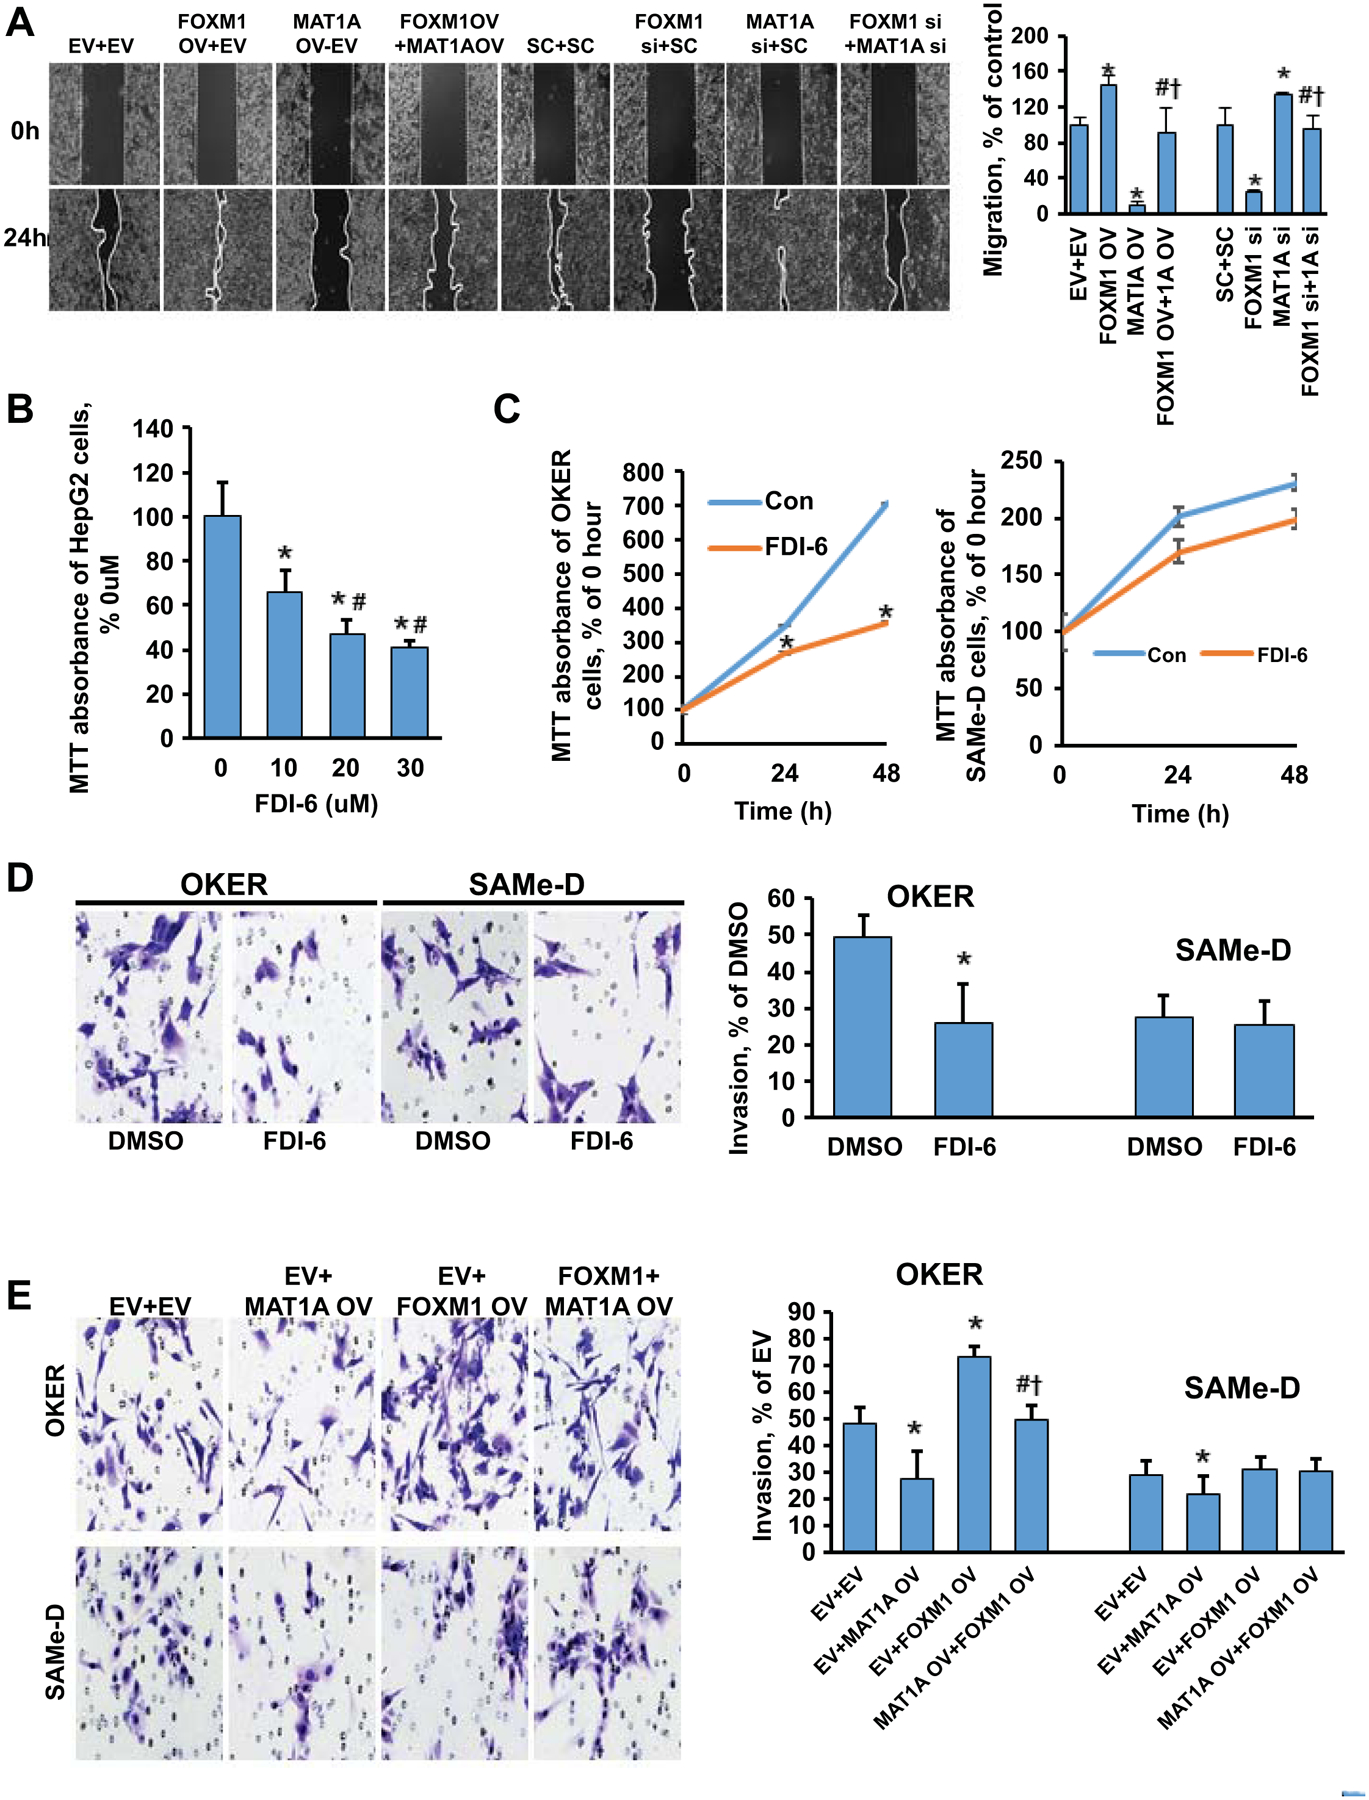
Figure 7. Effects of MAT1A and FOXM1 on cell proliferation, migration and invasion.

A) Effects of varying MAT1A and FOXM1 expressions on HepG2 cell migration. Quantitative values are summarized in the graph to the right. Results are expressed as mean % of respective controls ± SEM from three experiments done in duplicates. *p < 0.05 vs. EV+EV or SC+SC; #p < 0.05 vs. FOXM1 OV or siRNA; †p < 0.05 vs. MAT1A OV or siRNA. B) Dose-response effect of FDI-6 treatment on the MTT assay in HepG2 cells. Results are expressed as mean % of DMSO ± SEM from three experiments done in duplicates. *p < 0.05 vs. DMSO; #p < 0.05 vs FDI-6 (10uM). C) Time-dependent effect of FDI-6 (5uM) treatment on the MTT assay in OKER and SAMe-D cells. Results are expressed as mean % of DMSO ± SEM from three experiments done in duplicates. *p < 0.05 vs. DMSO. D) Representative invasion images of OKER and SAMe-D cells after FDI-6 (5uM) treatment. Quantitative analysis is summarized in the graph to the right. Results are expressed as mean % of DMSO ± SEM from three experiments done in duplicates. *p < 0.05 vs. DMSO. E) Effects of varied MAT1A and FOXM1 expressions on OKER (Top) and SAMe-D (Bottom) cell invasion. Quantitative values are summarized to the right of the invasion images. Results are expressed as mean % of EV ± SEM from three experiments done in duplicates. *p < 0.05 vs. EV+EV; #p < 0.05 vs. EV+MAT1A OV; †p<0.05 vs. EV+FOXM1 OV.
