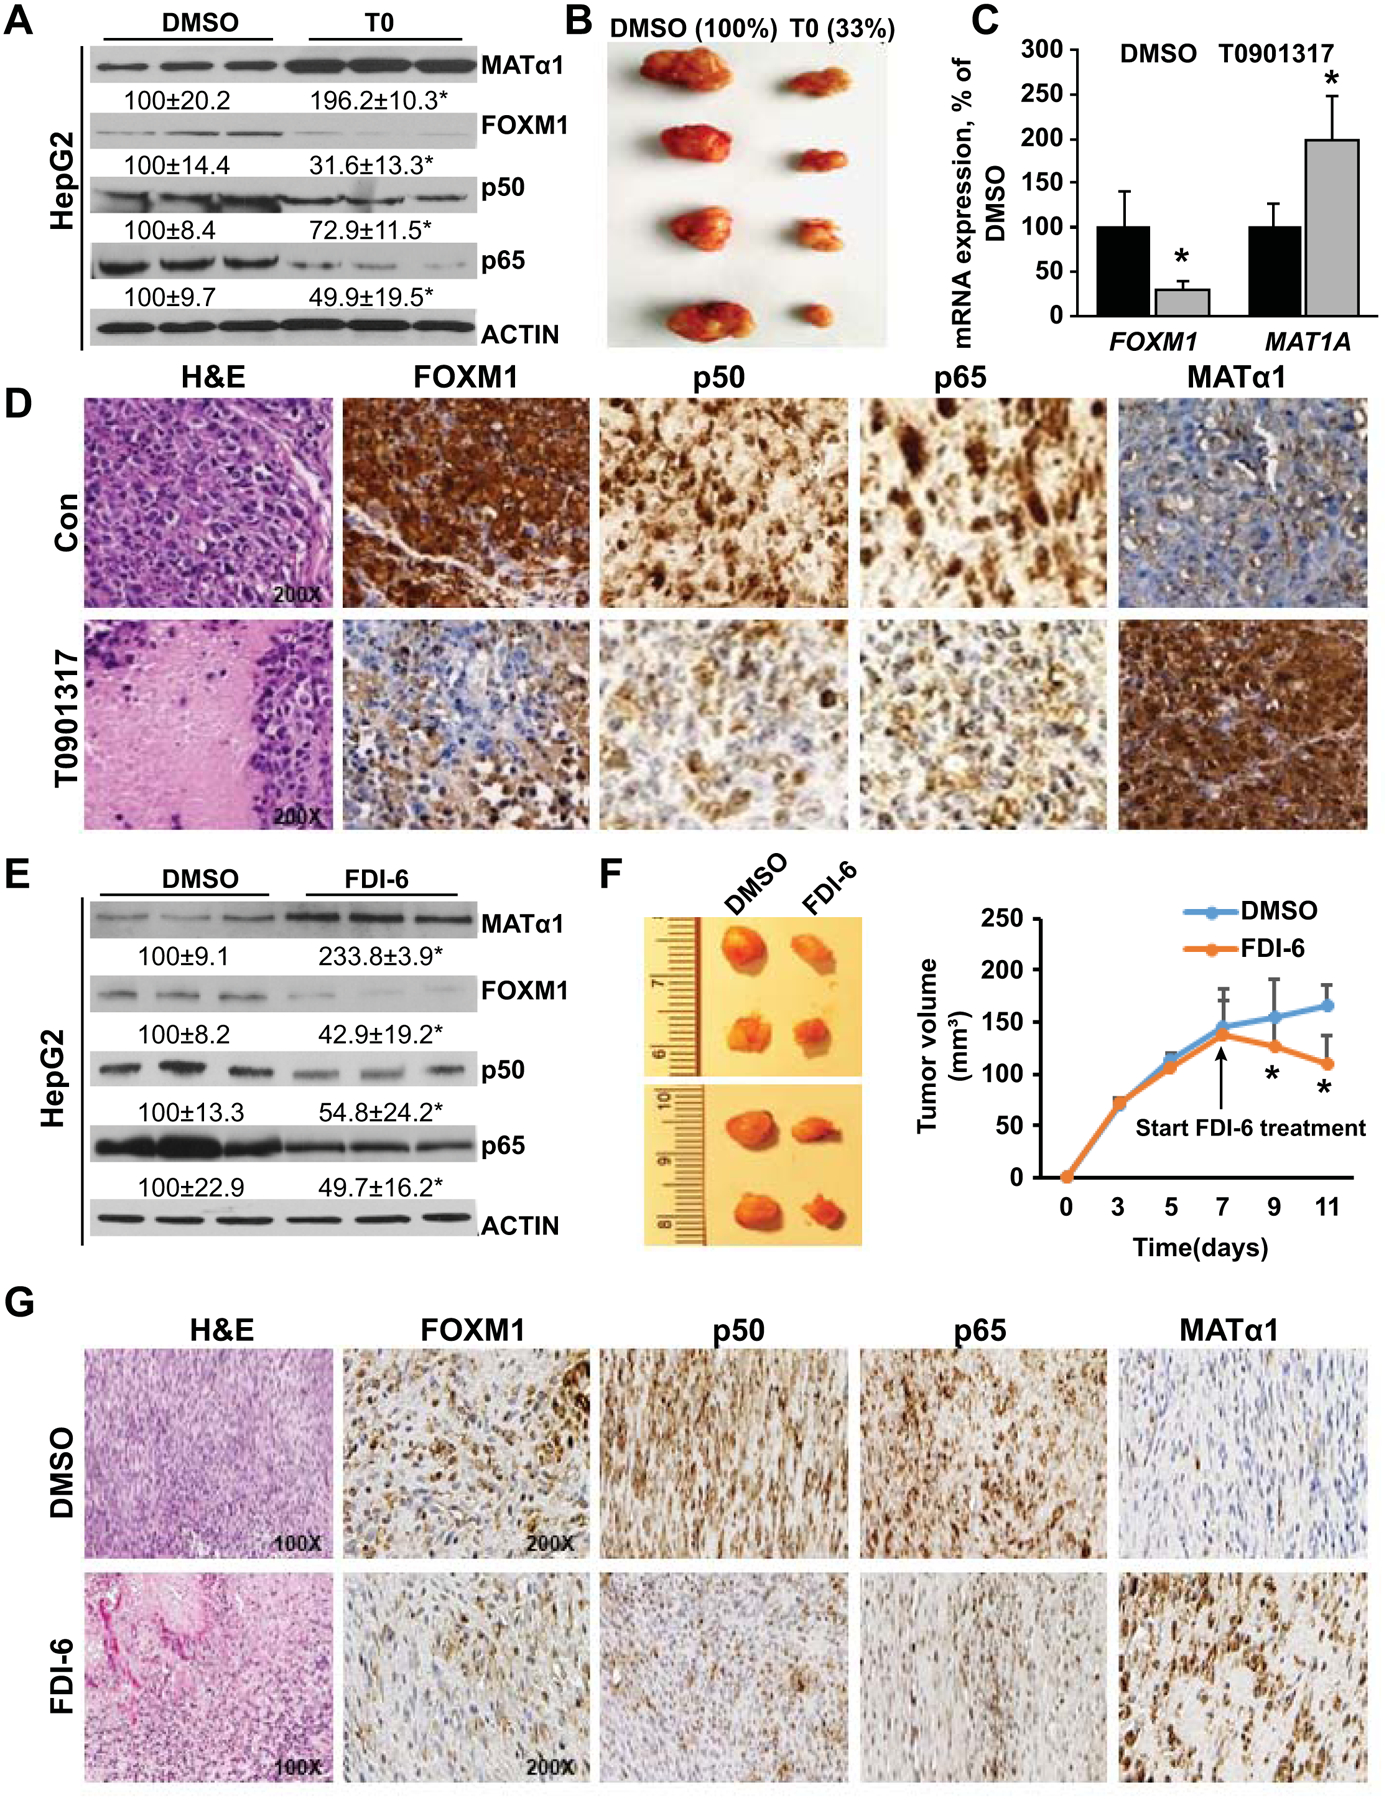
Figure 8. Effects of T0 and FDI-6 on expression of MATα1, FOXM1, p50 and p65, and tumor growth.

A) MATα1, FOXM1, p50, and p65 levels after T0 treatment (5μM) in HepG2 cells. Results are expressed as mean % of DMSO control ± SEM from three experiments done in duplicates. *p<0.05 vs. DMSO. B) Representative pictures of liver xenograft tumors at day 28 after injection of HepG2 cells in DMSO (left) and T0 treatment (right) groups. Results are expressed as mean % of DMSO from n=8 per group. C) FOXM1 and MAT1A mRNA levels from T0 (25 mg/kg/d) or DMSO treated xenograft tumor tissues. Results are expressed as mean % of control ± SEM from eight mice/group. D) Representative H&E and IHC pictures are shown from n = 8 each. Original magnification for H&E and IHCs is X200. E) Protein expression of MATα1, FOXM1, p50, and p65 after FDI-6 treatment in HepG2 cells. Results are expressed as mean % of control ± SEM from three experiments done in triplicates. *p < 0.05 vs. DMSO. F) Representative pictures of liver syngeneic tumors at day 11 after injection of OKER cells in DMSO (left) and FDI-6 treatment (right, 25 mg/kg/d started on day 7) groups. Tumor volumes are summarized in the graph to the right. Results are expressed as mean of control ± SEM from eight mice/group. *p < 0.05 vs. DMSO. G) Representative H&E and IHC of syngeneic tumors treated with DMSO or FDI-6 from day 7 after injection and sacrificed at day 11. Original magnification for H&E is X100, and X200 for all IHC.
