

Abstract
Purpose:
While high T-cell density is a well-established favorable prognostic factor in colorectal cancer, the prognostic significance of tumor-associated plasma cells, neutrophils, and eosinophils is less well-defined.
Experimental Design:
We computationally processed digital images of hematoxylin and eosin (H&E)-stained sections to identify lymphocytes, plasma cells, neutrophils, and eosinophils in tumor intraepithelial and stromal areas of 934 colorectal cancers in two prospective cohort studies. Multivariable Cox proportional hazards regression was used to compute mortality HR according to cell density quartiles. The spatial patterns of immune cell infiltration were studied using the GTumor:Immune cell function, which estimates the likelihood of any tumor cell in a sample having at least one neighboring immune cell of the specified type within a certain radius. Validation studies were performed on an independent cohort of 570 colorectal cancers.
Results:
Immune cell densities measured by the automated classifier demonstrated high correlation with densities both from manual counts and those obtained from an independently trained automated classifier (Spearman’s rho 0.71–0.96). High densities of stromal lymphocytes and eosinophils were associated with better cancer-specific survival [Ptrend<0.001; multivariable HR (4th vs. 1st quartile of eosinophils), 0.49; 95% CI, 0.34–0.71]. High GTumor:Lymphocyte area under the curve (AUC0,20μm) (Ptrend=0.002) and high GTumor:Eosinophil AUC0,20μm (Ptrend<0.001) also showed associations with better cancer-specific survival. High stromal eosinophil density was also associated with better cancer-specific survival in the validation cohort (Ptrend<0.001).
Conclusions:
These findings highlight the potential for machine learning assessment of H&E-stained sections to provide robust, quantitative tumor-immune biomarkers for precision medicine.
Keywords: colorectal cancer, image analysis, immunology, prognosis, tumor microenvironment
Introduction
Colorectal cancer is the third most common malignancy and the second most common cause of cancer deaths worldwide (1). The prognostic classification of colorectal cancer has been mainly based on disease stage (2,3). However, each tumor is unique and driven by complex pathologic processes, many of which are mediated by interactions between the neoplastic cells and the host (4). Additional prognostic parameters that more fully capture these associations may therefore help us classify patients into more homogenous, therapeutically relevant subgroups.
Colorectal carcinoma is composed of a mixture of cell types, including tumor cells, fibroblasts, endothelial cells, and immune cells, that cumulatively comprise the tumor microenvironment (5). Accumulating evidence indicates that tumors may evoke an adaptive anti-tumor immune response (6). Indeed, higher densities of tumor infiltrating T lymphocytes have been associated with improved clinical outcome in colorectal cancer (7). The prognostic value of Immunoscore, generated by measuring CD3+ and CD8+ T cell densities in the tumor center and invasive margin, has been validated in an international multi-institutional study involving several thousand colon cancer patients from 13 countries (8). While innate immune cells, such as neutrophils and eosinophils, also represent a major cell population in colorectal tumors, their potential prognostic significance has not been as well-defined as that of T cells (7,9). Although the potential prognostic value of plasma cells in colorectal cancer has attracted relatively little attention, B cells and tertiary lymphoid structures have been reported to be associated with prognosis in colorectal cancer (7) and immunotherapy response in melanoma (10). We therefore sought to examine plasma cells, which represent the only B cell subset that can be reliably identified in H&E-stained tissue sections. Analyses of different types of immune cells involved in adaptive and innate immunity could help develop improved prognostic biomarkers and may lead to a better understanding of colorectal cancer biology.
In this study, we identified and quantified lymphocytes, plasma cells, neutrophils, and eosinophils in tumor epithelial and stromal areas, using supervised machine learning on digital images of hematoxylin and eosin (H&E)-stained tissue microarrays (TMAs) containing tumor tissue from colorectal cancer patients in two large U.S.-based prospective cohort studies. For our primary aim, we tested the hypothesis that higher densities of these immune cells might be associated with better prognosis. In exploratory analyses, we investigated the relationships of the densities of these cell types with tumor and patient characteristics as well as the prognostic significance of spatial characteristics of the immune cell infiltrates in relation to tumor cells. To validate the findings, we analyzed an independent cohort of 570 colorectal cancers.
Methods
Study population and data collection
We utilized two U.S.-nationwide prospective cohort studies, the Nurses’ Health Study (NHS, 121,701 women followed since 1976) and the Health Professionals Follow-up Study (HPFS, 51,529 men followed since 1986). In these populations, we documented 4,420 incident colorectal carcinoma cases during the follow-up until 2014. We analyzed immune cell densities in 934 adenocarcinomas, based on the availability of follow-up data and adequate tissue specimens in TMAs (Table 1). We included both colon and rectal carcinoma based on the colorectal continuum model (11). We utilized the inverse probability weighting (IPW) method and covariate data from the 4,420 cases to adjust for selection bias due to tumor tissue availability in the 934 cases.
Table 1.
Clinical, pathological, and molecular characteristics of colorectal cancer cases according to tumor stromal immune cell densities
| Stromal immune cell density (cells / mm2) Median (25th - 75th percentile) |
|||||
|---|---|---|---|---|---|
| Characteristic* | Total N | Lymphocyte | Plasma cell | Neutrophil | Eosinophil |
| All cases | 934 | 413 (212–785) | 15 (4.5–41) | 46 (20–93) | 15 (4.8–40) |
| Sex | |||||
| Female (NHS) | 521 (56%) | 446 (234–804) | 17 (5.2–43) | 51 (22–106) | 13 (4.5–37) |
| Male (HPFS) | 413 (44%) | 366 (196–726) | 13 (3.6–39) | 39 (18–78) | 16 (5.2–42) |
| Age (years) | |||||
| < 65 | 289 (31%) | 412 (221–766) | 17 (5.3–39) | 49 (23–93) | 17 (5.2–42) |
| ≥ 65 | 645 (69%) | 414 (210–790) | 15 (4.4–42) | 45 (19–93) | 14 (4.6–38) |
| Year of diagnosis | |||||
| 1995 or before | 308 (33%) | 435 (189–869) | 14 (3.7–41) | 45 (21–99) | 15 (4.8–41) |
| 1996–2000 | 306 (33%) | 398 (206–745) | 15 (5.6–45) | 46 (20–95) | 14 (4.9–34) |
| 2001–2008 | 320 (34%) | 423 (241–763) | 16 (4.6–37) | 46 (19–88) | 15 (4.6–43) |
| Family history of colorectal cancer in first-degree relative(s) | |||||
| Absent | 735 (79%) | 394 (212–765) | 14 (4.1–38) | 45 (20–92) | 14 (4.9–38) |
| Present | 194 (21%) | 499 (234–916) | 19 (6.4–62) | 49 (20–97) | 16 (4.7–44) |
| History of inflammatory bowel disease | |||||
| Absent | 920 (98%) | 413 (212–782) | 15 (4.5–41) | 46 (20–93) | 15 (4.7–40) |
| Present | 13 (1.4%) | 400 (270–982) | 14 (5.0–35) | 38 (22–65) | 18 (10–59) |
| Tumor location | |||||
| Cecum | 163 (18%) | 435 (224–846) | 16 (5.4–43) | 45 (20–99) | 15 (5.6–39) |
| Ascending to transverse colon | 306 (33%) | 443 (212–820) | 17 (4.6–44) | 46 (20–93) | 12 (4.6–35) |
| Splenic flexure to sigmoid colon | 280 (30%) | 395 (198–770) | 15 (4.3–38) | 45 (20–92) | 17 (5.6–43) |
| Rectum | 181 (19%) | 407 (212–726) | 14 (3.6–40) | 46 (20–90) | 15 (3.6–41) |
| Tumor differentiation | |||||
| Well to moderate | 843 (90%) | 407 (212–758) | 15 (4.4–40) | 45 (20–91) | 15 (4.9–42) |
| Poor | 89 (9.6%) | 569 (223–1019) | 20 (7.3–45) | 55 (24–123) | 11 (4.7–33) |
| Extent of signet ring cells (%) | |||||
| 0 | 814 (87%) | 413 (212–785) | 15 (4.5–42) | 46 (20–92) | 15 (4.8–40) |
| 1–50 | 108 (12%) | 456 (224–779) | 16 (4.4–38) | 44 (20–100) | 12 (4.1–34) |
| ≥ 51 | 12 (1.3%) | 281 (162–980) | 13 (4.4–48) | 46 (25–79) | 34 (12–81) |
| Extent of extracellular mucin (%) | |||||
| 0 | 550 (59%) | 413 (215–767) | 15 (5.2–41) | 46 (21–91) | 14 (4.6–38) |
| 1–50 | 274 (29%) | 436 (217–850) | 16 (3.7–43) | 47 (20–91) | 16 (5.4–43) |
| ≥ 51 | 110 (12%) | 364 (192–777) | 14 (3.7–37) | 40 (19–112) | 13 (4.0–41) |
| AJCC disease stage | |||||
| I | 198 (23%) | 558 (306–986) | 23 (8.5–62) | 49 (26–97) | 27 (8.5–65) |
| II | 285 (33%) | 411 (224–798) | 13 (4.1–39) | 51 (23–101) | 13 (4.6–33) |
| III | 249 (29%) | 355 (189–668) | 14 (4.1–33) | 44 (19–83) | 11 (3.4–33) |
| IV | 135 (16%) | 280 (160–590) | 10 (4.1–25) | 32 (12–75) | 10 (3.7–29) |
| MSI status | |||||
| Non-MSI-high | 754 (83%) | 385 (196–732) | 14 (4.3–39) | 44 (19–89) | 15 (4.5–40) |
| MSI-high | 153 (17%) | 596 (311–966) | 21 (7.1–48) | 59 (30–117) | 13 (5.2–31) |
| CIMP status | |||||
| Low/negative | 707 (82%) | 397 (198–736) | 15 (4.3–39) | 44 (19–90) | 15 (4.5–40) |
| High | 157 (18%) | 559 (282–976) | 20 (7.6–48) | 55 (29–127) | 12 (4.8–30) |
| Mean LINE-1 methylation level | |||||
| ≥ 60% | 571 (63%) | 436 (225–814) | 15 (4.3–41) | 46 (21–98) | 15 (4.7–39) |
| < 60% | 335 (37%) | 376 (184–717) | 15 (4.9–41) | 44 (18–84) | 14 (4.6–40) |
| KRAS mutation | |||||
| Wild-type | 538 (59%) | 433 (217–820) | 17 (5.2–43) | 47 (22–94) | 13 (4.8–37) |
| Mutant | 368 (41%) | 381 (206–738) | 14 (3.3–38) | 44 (18–93) | 16 (4.5–43) |
| BRAF mutation | |||||
| Wild-type | 775 (85%) | 406 (208–773) | 15 (4.3–41) | 45 (20–90) | 15 (4.5–41) |
| Mutant | 138 (15%) | 471 (223–882) | 17 (6.0–43) | 52 (23–126) | 11 (5.2–33) |
| PIK3CA mutation | |||||
| Wild-type | 709 (83%) | 394 (202–743) | 14 (4.2–39) | 44 (20–94) | 14 (4.4–38) |
| Mutant | 141 (17%) | 522 (264–945) | 20 (5.6–51) | 54 (23–104) | 15 (6.1–40) |
| Neoantigen load | |||||
| Q1 (lowest) | 105 (25%) | 394 (234–743) | 19 (4.6–48) | 48 (21–78) | 18 (6.2–48) |
| Q2 | 104 (25%) | 335 (186–602) | 15 (4.8–32) | 43 (18–88) | 13 (4.7–42) |
| Q3 | 105 (25%) | 421 (185–783) | 14 (3.3–39) | 45 (20–101) | 14 (6.1–38) |
| Q4 (highest) | 103 (25%) | 463 (278–886) | 18 (7.6–45) | 53 (20–113) | 13 (5.1–34) |
Percentage indicates the proportion of patients with a specific clinical, pathologic, or molecular characteristic among all patients.
Abbreviations: AJCC, American Joint Committee on Cancer; CIMP, CpG island methylator phenotype; HPFS, Health Professionals Follow-up Study; LINE-1, long-interspersed nucleotide element-1; MSI, microsatellite instability; NHS, Nurses’ Health Study; SD, standard deviation.
Study physicians, blinded to exposure data, reviewed the medical records related to colorectal cancer and recorded clinical information including the American Joint Committee on Cancer (AJCC) tumor, node, metastases (TNM) stage (the 5th or 6th edition) and tumor location. The National Death Index was used to ascertain deaths of study participants and identify unreported lethal colorectal cancer cases. Patients were followed until death or end of follow-up (January 1, 2014 for HPFS; May 31, 2014 for NHS), whichever came first. Survival time was defined as the period from the date of colorectal cancer diagnosis to death or the end of follow-up for those who had not died.
Formalin-fixed paraffin-embedded tissue was collected from hospitals where the patients underwent resections of primary tumors. Tissue sections from all colorectal cancer cases were reviewed, and the diagnosis was confirmed by a single study pathologist (S.O.). Histopathologic features including tumor differentiation (well/moderate vs. poor), extent of signet ring cell morphology and extent of extracellular mucin were recorded. DNA was extracted from formalin-fixed paraffin-embedded tumor blocks to evaluate MSI and CpG island methylator phenotype (CIMP) status (12), KRAS (13), BRAF, and PIK3CA mutations (14), LINE-1 methylation level (15), and neoantigen load calculated from whole exome sequencing of tumor and normal DNA pairs (16) (Table S1). TMAs were constructed using tissue cores from formalin-fixed paraffin-embedded tissue of colorectal cancer surgical resection specimens, as previously described (17). The core diameter was 0.6 mm and cores were selected from non-peripheral regions of primary tumors to best represent overall tumor morphology. The study was conducted in accordance with the U.S. Common Rule. Written informed consent was obtained from all participants. The study protocol was approved by the institutional review boards of the Brigham and Women’s Hospital and Harvard T.H. Chan School of Public Health (Boston, MA), and those of participating registries as required.
As an independent validation cohort, we included The Cancer Genome Atlas (TCGA) colorectal adenocarcinoma study (18). We used the clinical elements and survival outcome data included in the integrated TCGA Pan-Cancer Clinical Data Resource (TCGA-CDR) (19). Digitized H&E-stained histologic slides were available for 616 cases in TCGA data portal. We excluded cases with unrepresentative images (image not showing primary colorectal cancer; image obscured by slide markings or out of focus; or image scanned below 20× magnification), or cases with no follow-up data, resulting in 570 patients in the final analyses (Table S2).
Immune cell detection and quantification
Two 4 μm sections, separated by a vertical depth of at least 50 μm, were cut from TMA blocks and H&E-stained in a single batch. The H&E-stained sections were scanned using the Vectra 3.0 Automated Quantitative Pathology Imaging System (Akoya Biosciences, Hopkinton, MA, USA) equipped with a 20× objective. Only cores containing more than >10% tumor across the entire imaged core area were included in the subsequent analyses. In total, there were 1–8 images per tumor (median 3, IQR 2–4).
QuPath v0.1.2, an open source software for digital pathology image analysis (20), was used to detect and count intraepithelial and stromal lymphocytes, plasma cells, eosinophils, and neutrophils. These cell types were chosen for the analysis based on their distinctive morphological characteristics in the H&E-stained sections. The evaluation was performed blinded to the study end points. The method began with two parallel, independent pathologist-supervised algorithmic processing steps: (1) cell detection and classification and (2) tissue category classification (Fig. 1, Table S3). These steps were based on earlier described functions included in QuPath (20).
Figure 1.
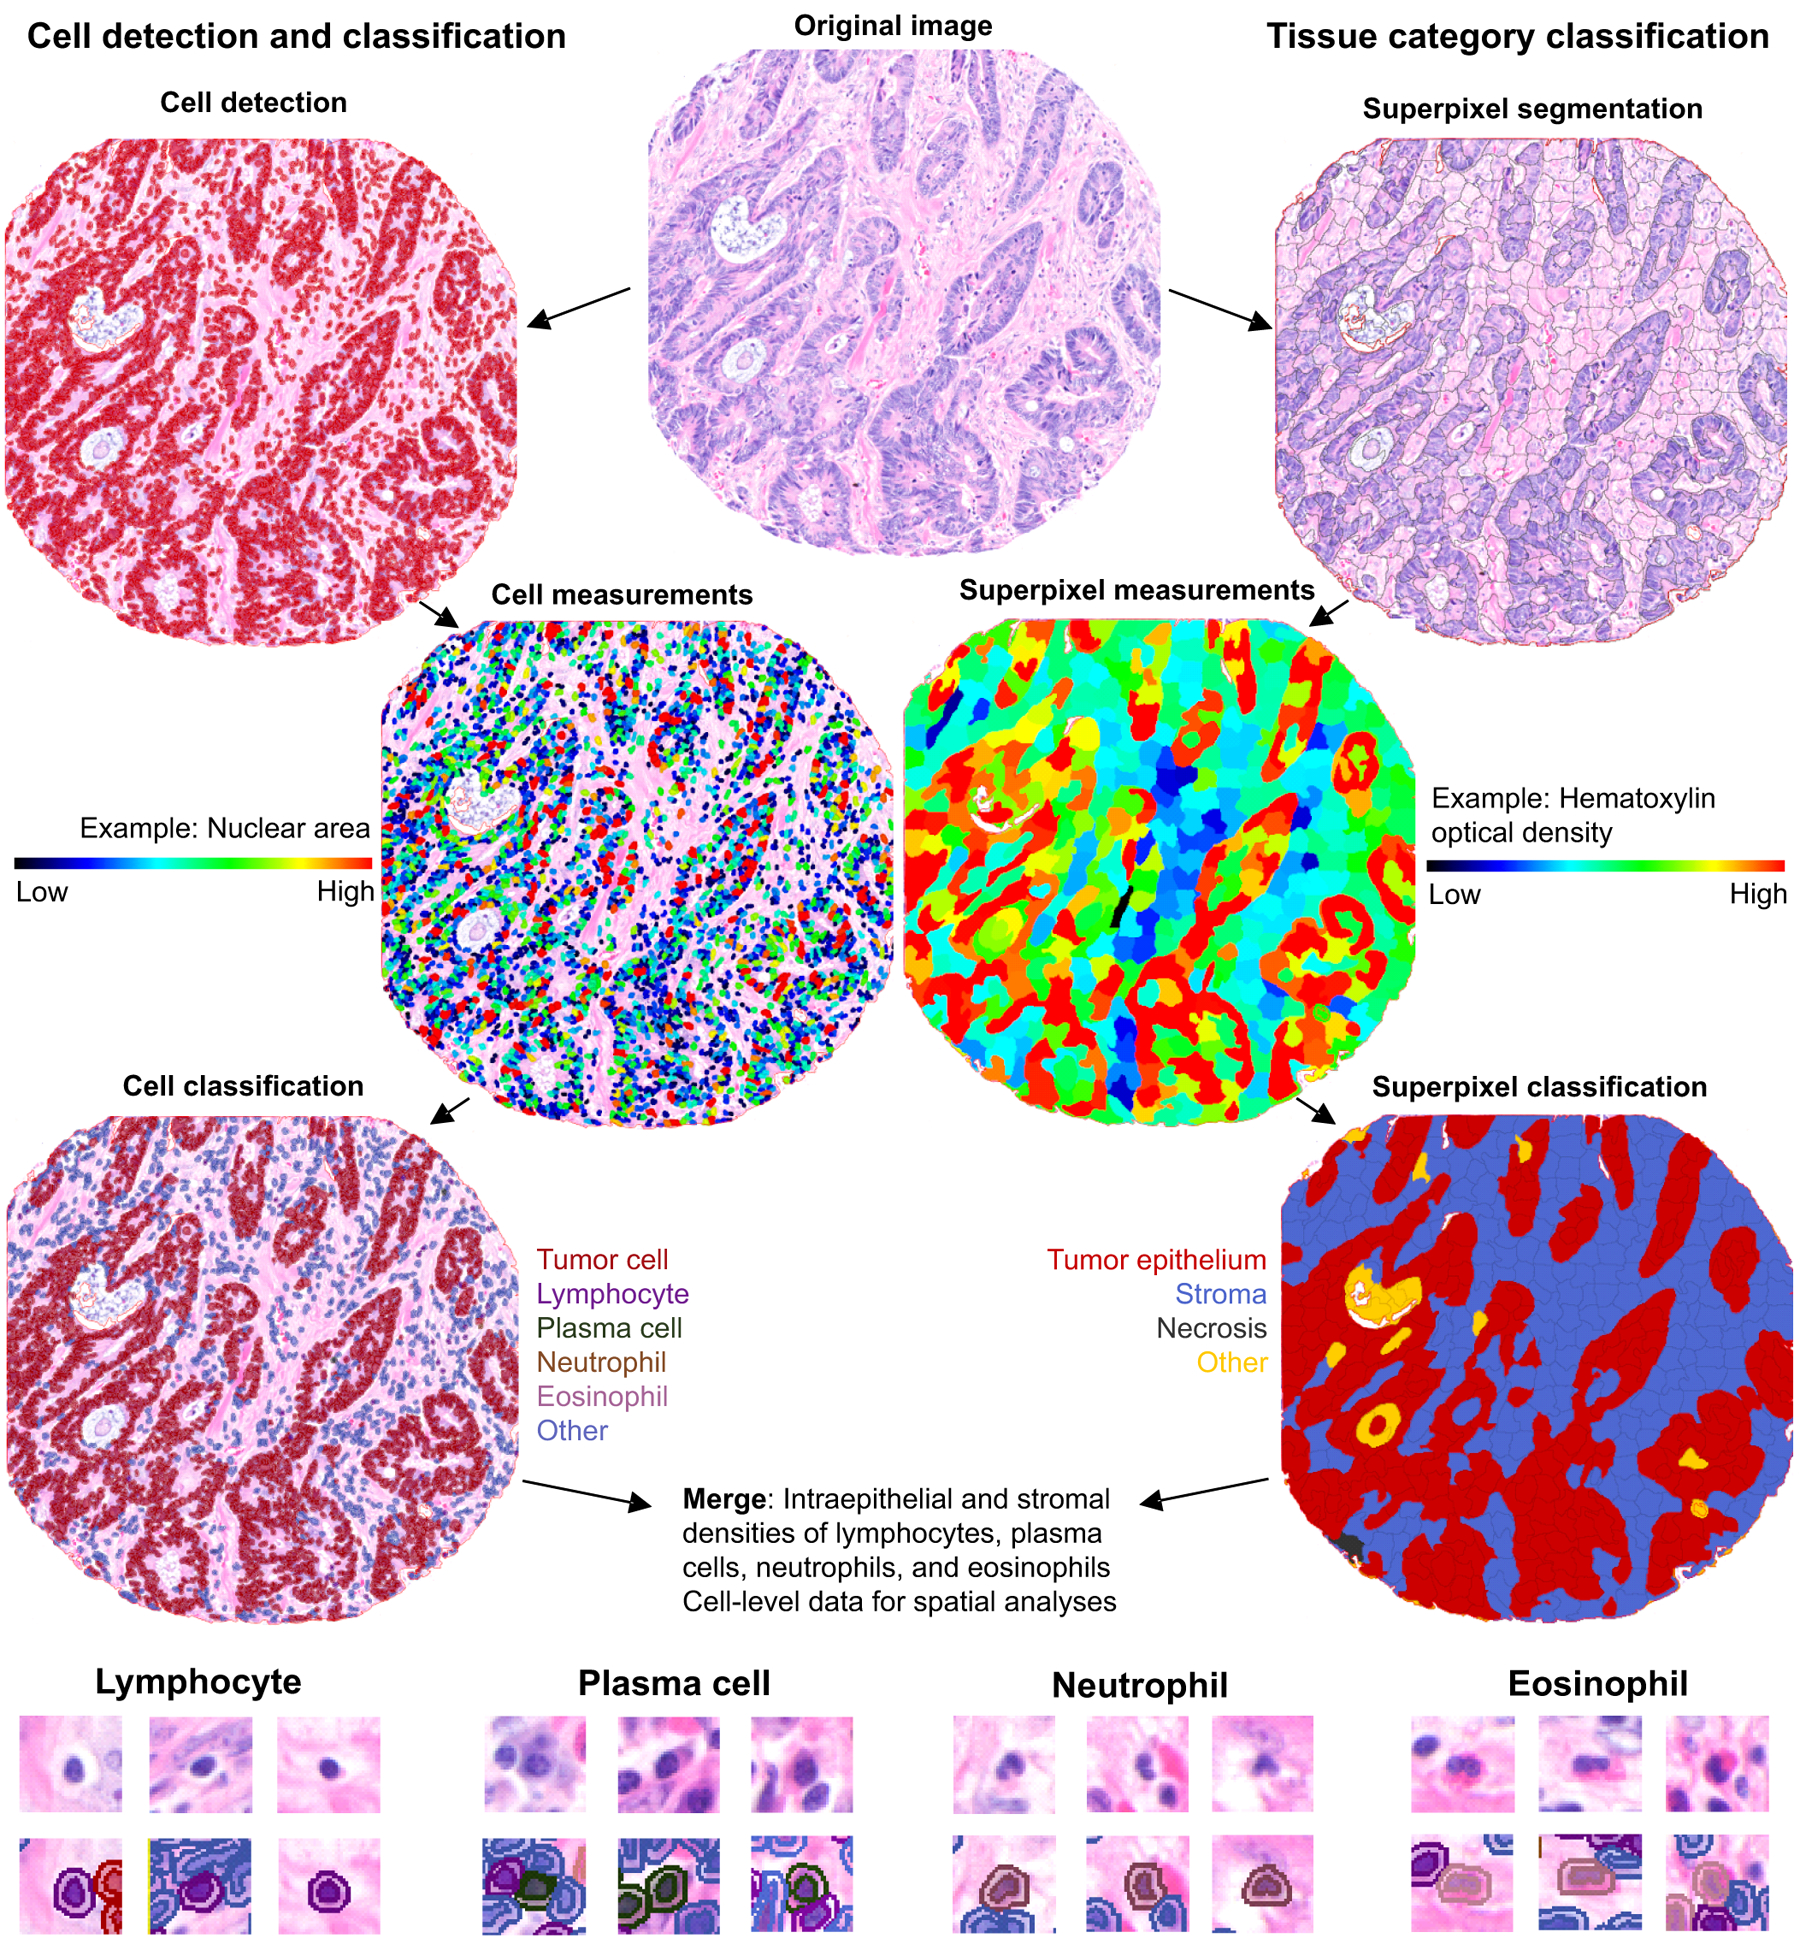
Immune cell detection and quantification and area segmentation in H&E-stained colorectal cancer tissue microarrays using automated image analysis.
Cell identity data were exported from QuPath with cell coordinates, and tissue categories were exported as binary tissue category mask images. Individual cells were assigned to tissue categories through coordinate mapping, wherein the coordinates for each tissue category were identified from the tissue category mask images using the R statistical programming language (version 3.5.3; R Foundation for Statistical Computing, Vienna, Austria) and the imager package. To calculate the immune cell density in each tissue compartment, we first counted the number of cells of immune cell type of interest within that compartment and then divided the counts by the tissue area in mm2. For cases with multiple tumor cores, the average (mean) of densities of all available cores was calculated.
To validate the accuracy of the immune cell quantification method in relation to human assessment, immune cells in 80 tumor core images were manually annotated by a pathologist (J.P.V.), cumulatively yielding 13,713 classified immune cells. To evaluate interobserver reproducibility for automated counting, another study physician (S.A.V.) processed all tumor core images independently with a separately trained cell classifier.
We employed a non-linear dimension reduction algorithm named Uniform Manifold Approximation and Projection (UMAP; using the umap R package) (21), to project the high dimensional data, i.e., the intraepithelial and stromal densities of lymphocytes, plasma cells, neutrophils, and eosinophils, into two-dimensional space for visual inspection, in order to examine potential TMA or year-of-diagnosis related effects on immune cell densities.
Evaluation of tumor-immune spatial relationships
The multi-type G-function “G-cross” is a statistical analysis method based on the theory of point processes (22). Tumor:immune cell G-cross (GTumor:Immune cell) represents a nearest neighbor distance distribution function, which estimates the probability of finding at least one immune cell within a r radius of any tumor cell. We calculated the empiric distribution functions based on observed nearest neighbor distances with the spatstat R package (23). Both intraepithelial and stromal immune cells were included in this analysis. Estimation of the G-cross function is impeded by edge effects due to the unobservable points outside the analysis window. Therefore, we applied edge correction via the Kaplan-Meier (km) method. To quantify the level of immune cell infiltration likely capable of effective cell-to-cell interaction with tumor cells, we computed the area under the curve of G-cross function between 0 and 20 μm (AUC0,20μm). The distance range of 0 to 20 μm was chosen prior to analysis based upon a previously described method (22). For downstream survival analysis, the patients were grouped into ordinal AUC quartile categories (C1 to C4 from low to high AUC values).
Statistical analysis
The statistical analyses were conducted using SAS software (version 9.4, SAS Institute, Cary, NC), and all P values were two-sided. Our primary hypothesis tested associations between the densities of intraepithelial and stromal lymphocytes, plasma cells, neutrophils, and eosinophils and cancer-specific survival using a multivariable adjusted Cox proportional hazards regression model. We used the stringent two-sided α level of 0.005 for null hypothesis testing (24). All other analyses represented secondary analyses, where we interpreted our data cautiously, in addition to using the α level of 0.005.
To assess the relationships between immune cell densities and clinicopathologic features, we used Spearman’s correlation test for continuous or ordinal variables, and the Wilcoxon rank-sum test or Kruskal-Wallis test for categorical variables, as appropriate. We estimated cumulative survival probabilities using the Kaplan-Meier method, and compared the differences between categories using the log-rank test. For our primary analyses of colorectal cancer-specific mortality, deaths resulting from other causes were censored. We analyzed overall mortality (the NHS/HPFS and TCGA) and progression-free interval (TCGA) as secondary outcome measures. Univariable and multivariable Cox proportional hazards regression models were used to calculate the hazard ratio (HR) and 95% confidence interval (CI) for colorectal cancer-specific and overall mortality, and progression-free interval. In the NHS/HPFS cohorts, using 4,420 incident colorectal cancer cases, we applied the IPW method (25–27) to reduce selection bias due to the availability of tumor tissue. Detailed description of the methods used in the survival analyses are presented in Table S4.
Results
Evaluation of immune infiltrate with computational pathology
To classify neutrophils, eosinophils, plasma cells, and other lymphocytes in H&E-stained TMA cores from colorectal carcinomas, we conducted automated slide scanning and digital image analyses. Automated immune cell detection and classification demonstrated high concordance in relation to both a pathologist and an independently trained automated classifier. The Spearman’s rank correlation coefficients (rho) between automated method and manual counting in a subset of 80 tumor cores were 0.95 for lymphocytes, 0.74 for plasma cells, 0.71 for neutrophils, and 0.84 for eosinophils (Fig. S1A), while the Spearman rho values for core-level results between two independently trained classifiers were 0.96 for lymphocytes, 0.74 for plasma cells, 0.71 for neutrophils, and 0.83 for eosinophils (Fig. S1B). These results suggested that these immune cells could be reproducibly identified via pathologist-supervised machine learning algorithms. The Spearman rho values for immune cell densities between two randomly chosen cores of tumors with two or more available cores were 0.56 for lymphocytes, 0.43 for plasma cells, 0.35 for neutrophils, and 0.43 for eosinophils (Fig. S1C), indicating moderate core-to-core correlation.
Characteristics of immune infiltrate in relation to clinicopathologic features
We analyzed immune cell densities in 934 colorectal cancer cases in the NHS/HPFS cohorts (Table 1). Of the four immune cell types under study, lymphocytes had the highest overall density, followed by neutrophils, plasma cells, and eosinophils (Fig. 2A). The cell densities were consistent across TMAs (Fig. S2), and visualization of colorectal cancer cases using UMAP according to immune cell densities showed no clear TMA-related or year-of-diagnosis related effects (Fig. S3). There was predominantly a low to moderate correlation between the densities of different immune cell types; the highest was observed between stromal lymphocytes and stromal plasma cells (Spearman rho=0.73) (Fig. 2B).
Figure 2.
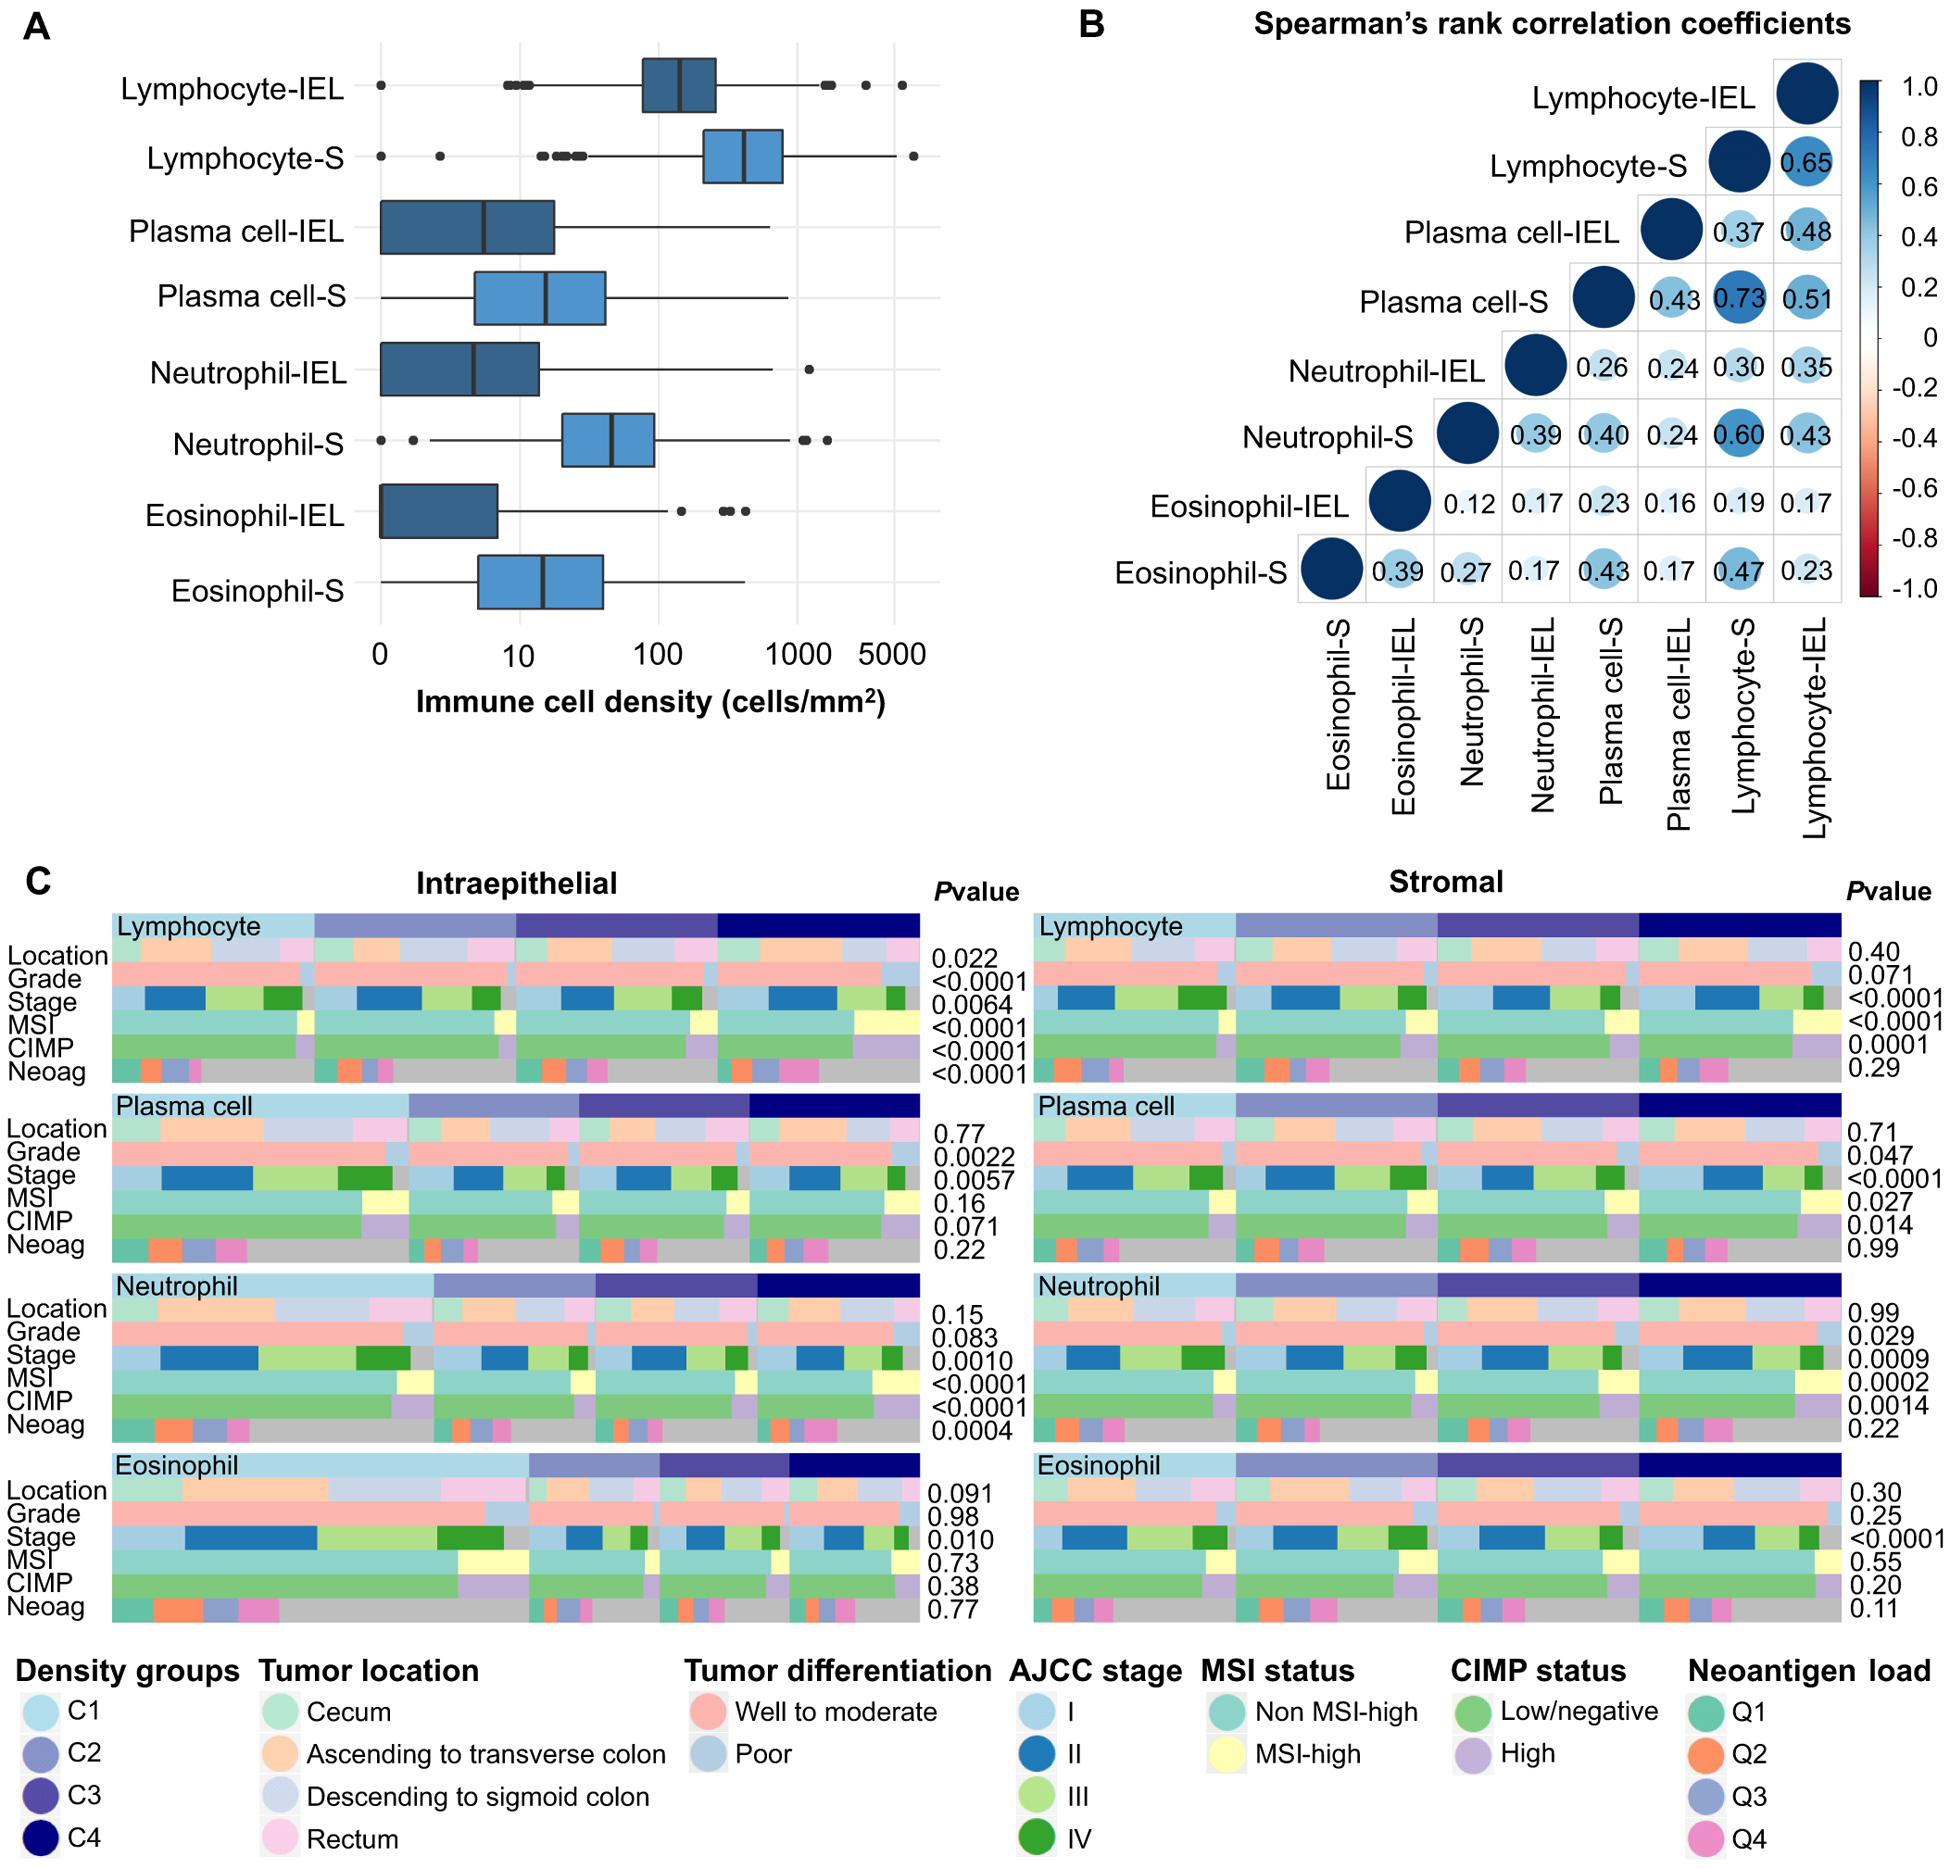
Relationships between densities of intraepithelial and stromal immune cells and clinicopathologic features. (A) Boxplots of the distribution of intraepithelial (IEL) and stromal (S) immune cell densities. (B) Correlation matrix of Spearman correlation coefficients between the densities of intraepithelial and stromal immune cells. (C) Heatmap of the relationships between clinicopathologic features and the densities of lymphocytes, plasma cells, neutrophils, and eosinophils. P values are based on the correlation analysis of immune cell densities and continuous or ordinal variables (AJCC Stage, Neoantigen load) by Spearman rank correlation test or the comparison of immune cell densities across categorical variable categories (Tumor location, Tumor differentiation, MSI status, CIMP status) by the Kruskal-Wallis test or Wilcoxon rank-sum test.
The relationships between immune cell densities and main tumor characteristics are summarized in Fig. 2C. Advanced tumor stage was associated with lower densities of stromal lymphocytes, plasma cells, neutrophils, and eosinophils (P<0.001 for all) and intraepithelial neutrophils (P=0.001), whereas poor differentiation was associated with higher densities of intraepithelial lymphocytes (P<0.001) and plasma cells (P=0.002).
Given that mismatch repair deficiency is common in poorly differentiated tumors (28), we hypothesized that the increased burden of immunogenic neopeptides (29) in these tumors might be associated with higher immune cell densities. Supporting our hypothesis, mismatch repair deficiency, as measured by an MSI-high phenotype, was strongly associated with higher densities of both intraepithelial and stromal lymphocytes (P<0.001). Unexpectedly, intraepithelial and stromal neutrophils were also more frequent in MSI-high tumors (P<0.001), whereas there was no evidence of a strong association between MSI status and eosinophil or plasma cell density. Intraepithelial densities of lymphocytes and neutrophils were positively correlated with estimated neoantigen load (P<0.001). Of other tumor molecular features, LINE-1 hypomethylation was associated with lower intraepithelial lymphocyte density (P<0.001), BRAF mutation was associated with higher intraepithelial lymphocyte density (P<0.001), and PIK3CA mutation was associated with higher stromal lymphocyte density (P=0.009) (Fig. S4).
Survival analyses
Our primary aim was to evaluate the prognostic significance of intraepithelial and stromal immune cells. During the median follow-up time of 12.3 years (IQR 8.7–16.3 years) for censored cases, there were 572 all-cause deaths, including 290 colorectal cancer-specific deaths.
In univariable survival analyses (Fig. 3, Fig. S5, Table 2), stromal lymphocytes, plasma cells, neutrophils, and eosinophils were significantly associated with better cancer-specific survival (all Ptrend<0.001), while intraepithelial lymphocytes (Ptrend=0.002) and neutrophils (Ptrend=0.003) were also significantly associated with cancer-specific survival (Fig. S4).
Figure 3.
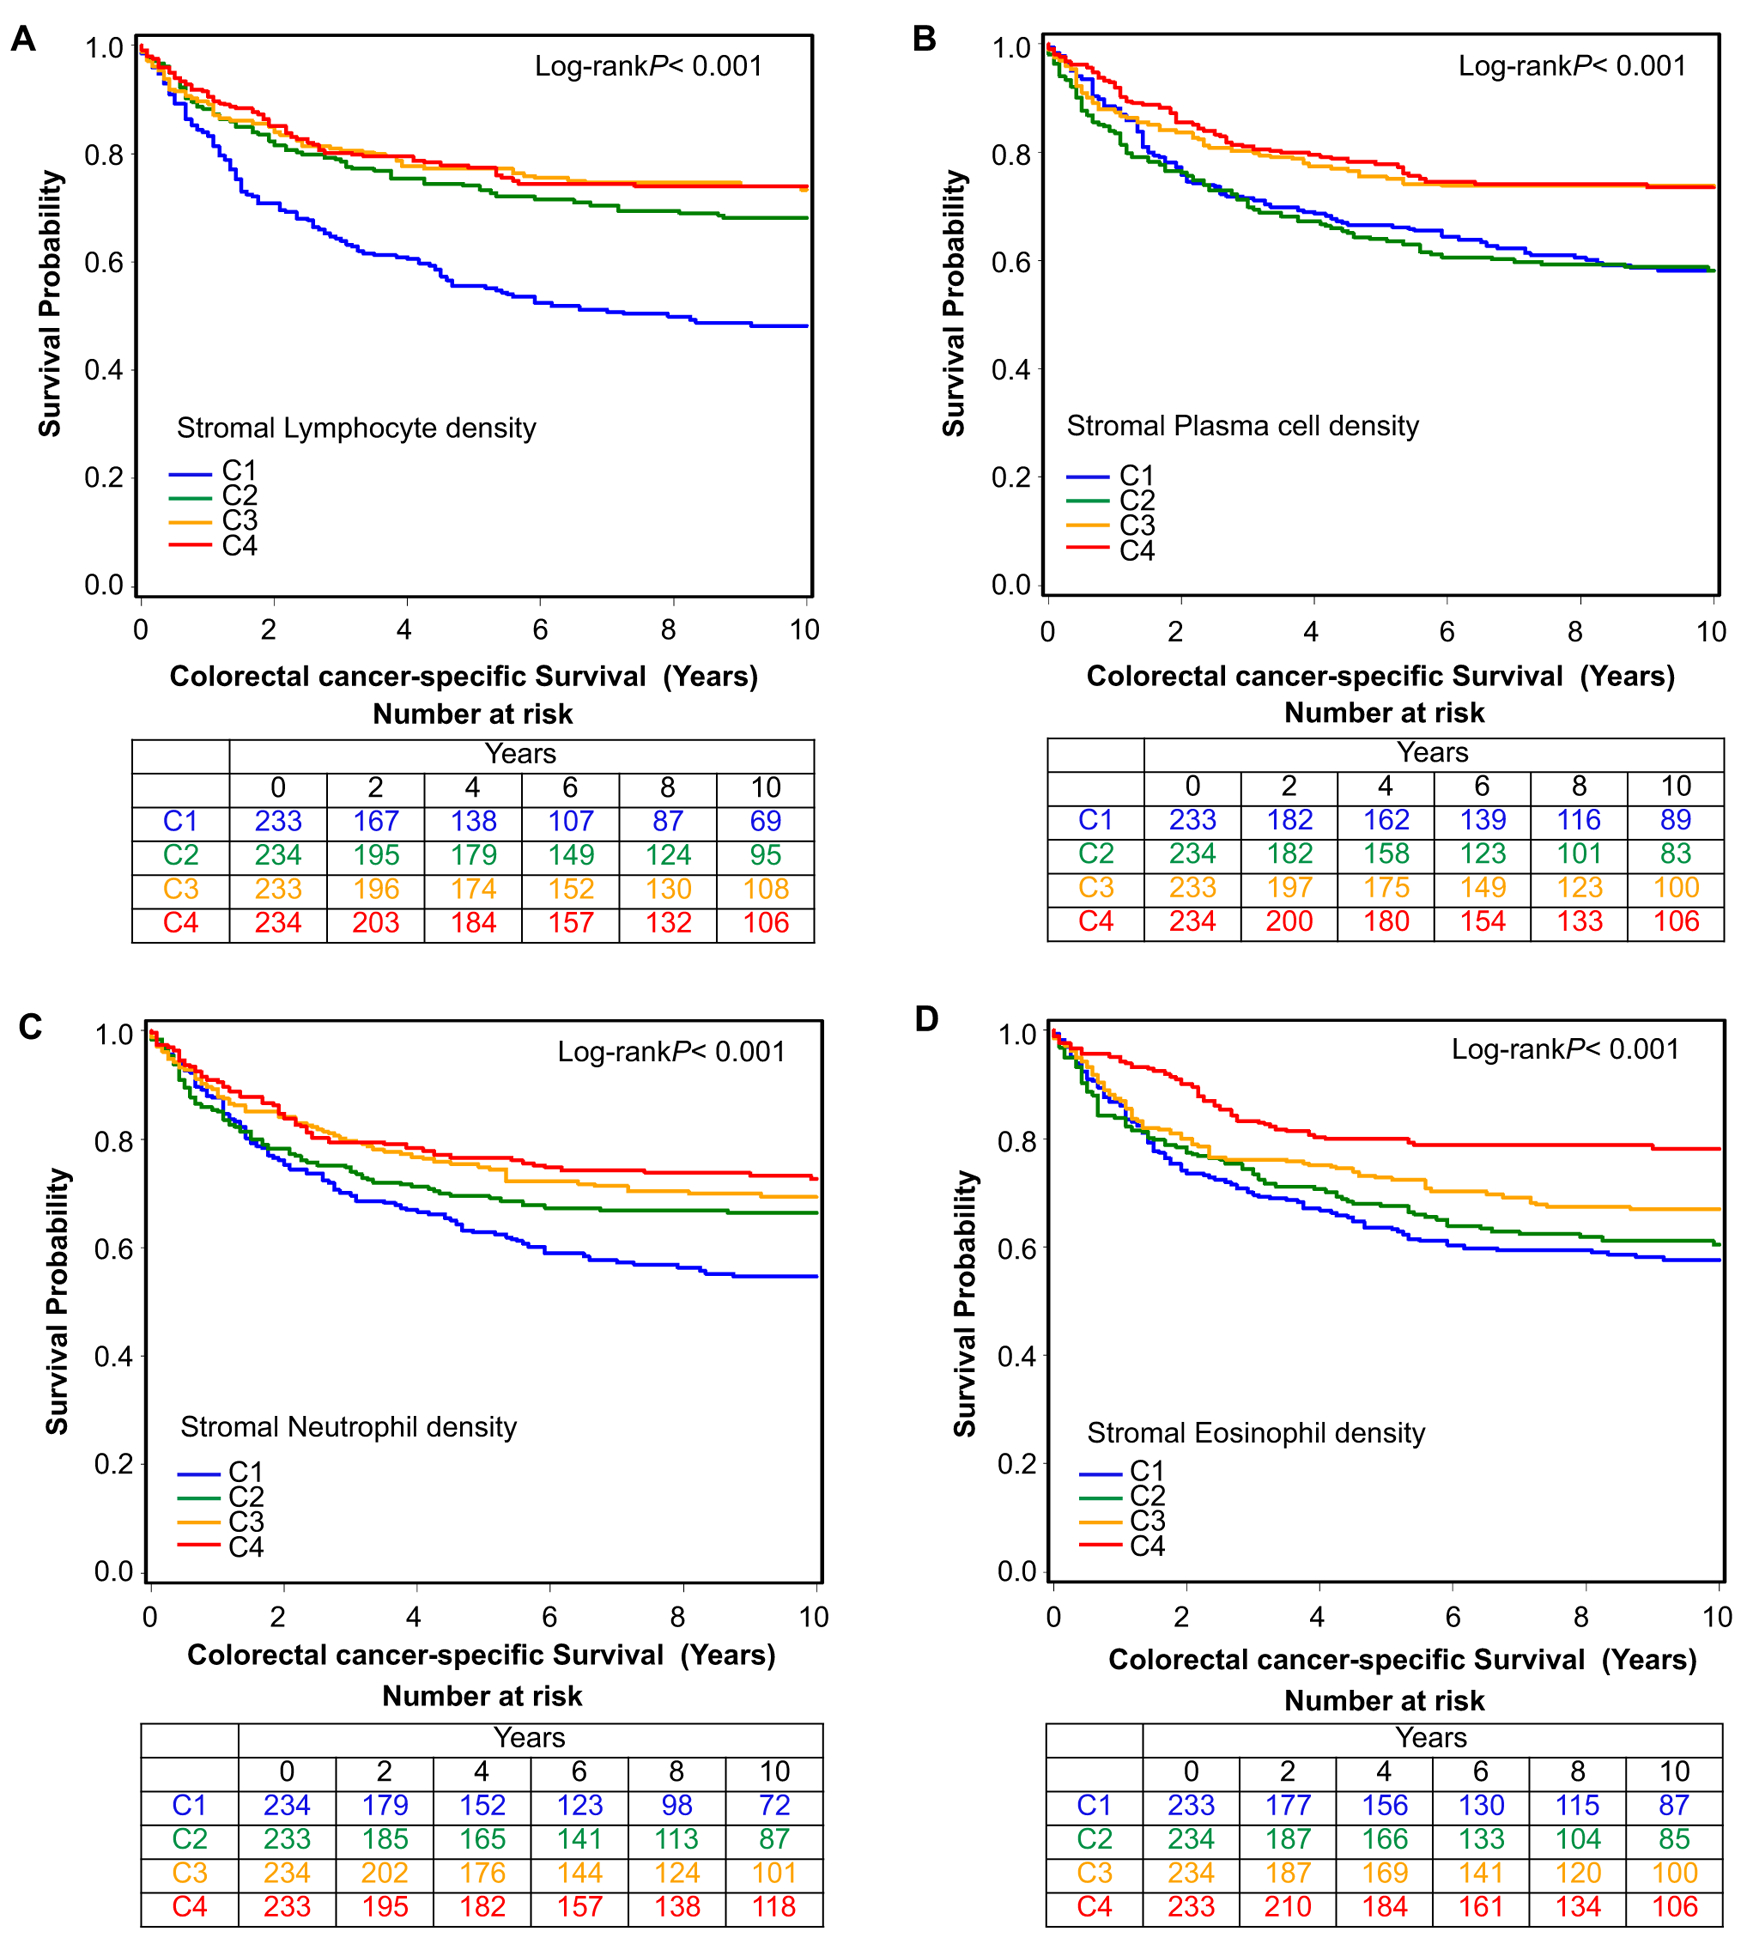
Inverse probability weighting-adjusted Kaplan-Meier curves of colorectal cancer-specific survival according to ordinal quartile categories (C1-C4) of stromal lymphocyte (A), plasma cell (B), neutrophil (C), and eosinophil (D) densities.
Table 2.
Densities of intraepithelial and stromal immune cells and patient survival with inverse probability weighting (IPW)
| Colorectal cancer-specific survival | Overall survival | ||||||
|---|---|---|---|---|---|---|---|
| No. of cases | No. of events | Univariable HR (95% CI)* | Multivariable HR (95% CI)*,† | No. of events | Univariable HR (95% CI)* | Multivariable HR (95% CI)*,† | |
| Tumor intraepithelial region | |||||||
| Lymphocyte density | |||||||
| C1 | 234 | 94 | 1 (referent) | 1 (referent) | 162 | 1 (referent) | 1 (referent) |
| C2 | 233 | 72 | 0.72 (0.52–0.99) | 0.77 (0.56–1.07) | 139 | 0.83 (0.64–1.08) | 0.83 (0.65–1.07) |
| C3 | 234 | 64 | 0.68 (0.49–0.96) | 0.73 (0.52–1.02) | 130 | 0.79 (0.61–1.03) | 0.77 (0.59–1.01) |
| C4 | 233 | 60 | 0.58 (0.41–0.82) | 0.68 (0.48–0.98) | 141 | 0.82 (0.63–1.06) | 0.73 (0.56–0.94) |
| Ptrend‡ | 0.002 | 0.029 | 0.11 | 0.013 | |||
| Plasma cell density | |||||||
| C1 | 343 | 123 | 1 (referent) | 1 (referent) | 227 | 1 (referent) | 1 (referent) |
| C2 | 196 | 42 | 0.54 (0.37–0.77) | 0.53 (0.36–0.76) | 105 | 0.65 (0.50–0.83) | 0.67 (0.52–0.86) |
| C3 | 199 | 64 | 0.92 (0.66–1.26) | 0.96 (0.69–1.33) | 115 | 0.88 (0.69–1.12) | 0.93 (0.73–1.20) |
| C4 | 196 | 61 | 0.82 (0.59–1.14) | 0.77 (0.55–1.08) | 125 | 0.88 (0.68–1.13) | 0.87 (0.68–1.12) |
| Ptrend‡ | 0.44 | 0.36 | 0.44 | 0.48 | |||
| Neutrophil density | |||||||
| C1 | 372 | 137 | 1 (referent) | 1 (referent) | 246 | 1 (referent) | 1 (referent) |
| C2 | 188 | 57 | 0.79 (0.57–1.09) | 1.10 (0.81–1.51) | 111 | 0.77 (0.59–0.99) | 0.96 (0.76–1.21) |
| C3 | 187 | 49 | 0.64 (0.46–0.90) | 0.74 (0.51–1.06) | 107 | 0.67 (0.52–0.87) | 0.70 (0.54–0.91) |
| C4 | 187 | 47 | 0.63 (0.44–0.90) | 0.67 (0.46–0.97) | 108 | 0.73 (0.57–0.93) | 0.67 (0.52–0.87) |
| Ptrend‡ | 0.003 | 0.012 | 0.002 | < 0.001 | |||
| Eosinophil density | |||||||
| C1 | 482 | 171 | 1 (referent) | 1 (referent) | 316 | 1 (referent) | 1 (referent) |
| C2 | 150 | 40 | 0.62 (0.43–0.88) | 0.64 (0.42–0.98) | 84 | 0.72 (0.54–0.95) | 0.80 (0.61–1.07) |
| C3 | 151 | 40 | 0.73 (0.51–1.05) | 0.73 (0.50–1.06) | 87 | 0.87 (0.68–1.11) | 0.80 (0.61–1.04) |
| C4 | 151 | 39 | 0.71 (0.49–1.03) | 0.82 (0.58–1.16) | 85 | 0.75 (0.57–0.99) | 0.81 (0.62–1.06) |
| Ptrend‡ | 0.027 | 0.084 | 0.030 | 0.044 | |||
| Tumor stromal region | |||||||
| Lymphocyte density | |||||||
| C1 | 233 | 110 | 1 (referent) | 1 (referent) | 173 | 1 (referent) | 1 (referent) |
| C2 | 234 | 66 | 0.54 (0.39–0.74) | 0.64 (0.46–0.88) | 132 | 0.64 (0.49–0.83) | 0.64 (0.49–0.83) |
| C3 | 233 | 60 | 0.49 (0.35–0.68) | 0.59 (0.42–0.83) | 134 | 0.64 (0.50–0.83) | 0.66 (0.51–0.85) |
| C4 | 234 | 54 | 0.43 (0.31–0.61) | 0.51 (0.36–0.71) | 133 | 0.59 (0.45–0.77) | 0.56 (0.43–0.72) |
| Ptrend‡ | < 0.001 | < 0.001 | < 0.001 | < 0.001 | |||
| Plasma cell density | |||||||
| C1 | 233 | 88 | 1 (referent) | 1 (referent) | 156 | 1 (referent) | 1 (referent) |
| C2 | 234 | 86 | 1.01 (0.74–1.38) | 0.95 (0.70–1.30) | 150 | 1.03 (0.79–1.34) | 1.01 (0.78–1.31) |
| C3 | 233 | 55 | 0.62 (0.44–0.89) | 0.56 (0.39–0.78) | 127 | 0.79 (0.61–1.03) | 0.72 (0.55–0.93) |
| C4 | 234 | 61 | 0.61 (0.43–0.86) | 0.61 (0.43–0.86) | 139 | 0.78 (0.61–1.01) | 0.73 (0.57–0.93) |
| Ptrend‡ | < 0.001 | < 0.001 | 0.016 | 0.002 | |||
| Neutrophil density | |||||||
| C1 | 234 | 96 | 1 (referent) | 1 (referent) | 169 | 1 (referent) | 1 (referent) |
| C2 | 233 | 68 | 0.71 (0.51–0.99) | 0.88 (0.64–1.23) | 135 | 0.67 (0.52–0.88) | 0.81 (0.62–1.06) |
| C3 | 234 | 67 | 0.66 (0.48–0.91) | 0.88 (0.64–1.22) | 130 | 0.67 (0.52–0.86) | 0.79 (0.61–1.01) |
| C4 | 233 | 59 | 0.55 (0.39–0.78) | 0.67 (0.47–0.96) | 138 | 0.64 (0.51–0.82) | 0.67 (0.51–0.87) |
| Ptrend‡ | < 0.001 | 0.034 | < 0.001 | 0.003 | |||
| Eosinophil density | |||||||
| C1 | 233 | 95 | 1 (referent) | 1 (referent) | 161 | 1 (referent) | 1 (referent) |
| C2 | 234 | 79 | 0.90 (0.66–1.23) | 0.88 (0.65–1.19) | 147 | 0.89 (0.69–1.14) | 0.87 (0.67–1.11) |
| C3 | 234 | 68 | 0.73 (0.52–1.01) | 0.73 (0.52–1.02) | 146 | 0.84 (0.65–1.07) | 0.92 (0.71–1.19) |
| C4 | 233 | 48 | 0.47 (0.32–0.67) | 0.49 (0.34–0.71) | 118 | 0.59 (0.45–0.76) | 0.63 (0.48–0.82) |
| Ptrend‡ | < 0.001 | < 0.001 | < 0.001 | 0.002 | |||
IPW was applied to reduce a bias due to the availability of tumor tissue after cancer diagnosis (see “Statistical Analysis” subsection for details).
The multivariable Cox regression model initially included sex, age, year of diagnosis, family history of colorectal cancer, tumor location, tumor differentiation, disease stage, microsatellite instability, CpG island methylator phenotype, KRAS, BRAF, and PIK3CA mutations, and long-interspersed nucleotide element-1 methylation level. A backward elimination with a threshold P of 0.05 was used to select variables for the final models.
Ptrend value was calculated across the four ordinal categories of the density of each immune cell within tumor epithelial and stromal regions in the IPW-adjusted Cox regression model.
Abbreviations: CI, confidence interval; HR, hazard ratio; IPW, inverse probability weighting.
In multivariable Cox proportional hazards regression models (Table 2, Table S5), higher densities of stromal lymphocytes, plasma cells, and eosinophils were associated with longer cancer-specific survival (all Ptrend<0.001) independent of potential confounders, including MSI, CIMP, BRAF mutation, LINE-1 methylation, tumor stage, and tumor grade. For eosinophil density C4 vs. C1, the HR for colorectal cancer-specific mortality was 0.49 (95% CI 0.34–0.71).
As secondary analyses, we examined the survival association of stromal lymphocytes, plasma cells, and eosinophils with colorectal cancer mortality in strata of tumor MSI status. The trends between higher densities of these cell types and better cancer-specific survival did not significantly differ by MSI status (Pinteraction>0.3, Table S6).
To directly compare the relative prognostic value of stromal lymphocyte, plasma cell, and eosinophil densities, we included these three variables in one Cox regression model, adjusting for each other, and used backward elimination with a threshold P value of 0.05 to select significant variables (Table S4). This analysis resulted in stromal lymphocyte density (P<0.001) and stromal eosinophil density (P=0.011) remaining in the final model. Multivariable-adjusted HRs for colorectal cancer mortality according to the densities of stromal lymphocytes and eosinophils are shown in Table S7.
Spatial analysis
Given our ability to precisely identify each immune cell’s location, we explored whether spatial characteristics of immune infiltrates in relation to tumor cells would be associated with patient survival. We employed the GTumor:Immune cell(r) function (22) to estimate the likelihood of any tumor cell in the sample having at least one immune cell of the specified type within an r μm radius. The AUC of the function within the specified radius r is influenced by both the density of immune cells (higher density results in a higher AUC) and the location of the immune cells (immune cells located closer to tumor cells result in a higher AUC). Examples of different patterns of immune cell infiltration and corresponding GTumor:Immune cell plots are presented in Fig. 4 A–D.
Figure 4.
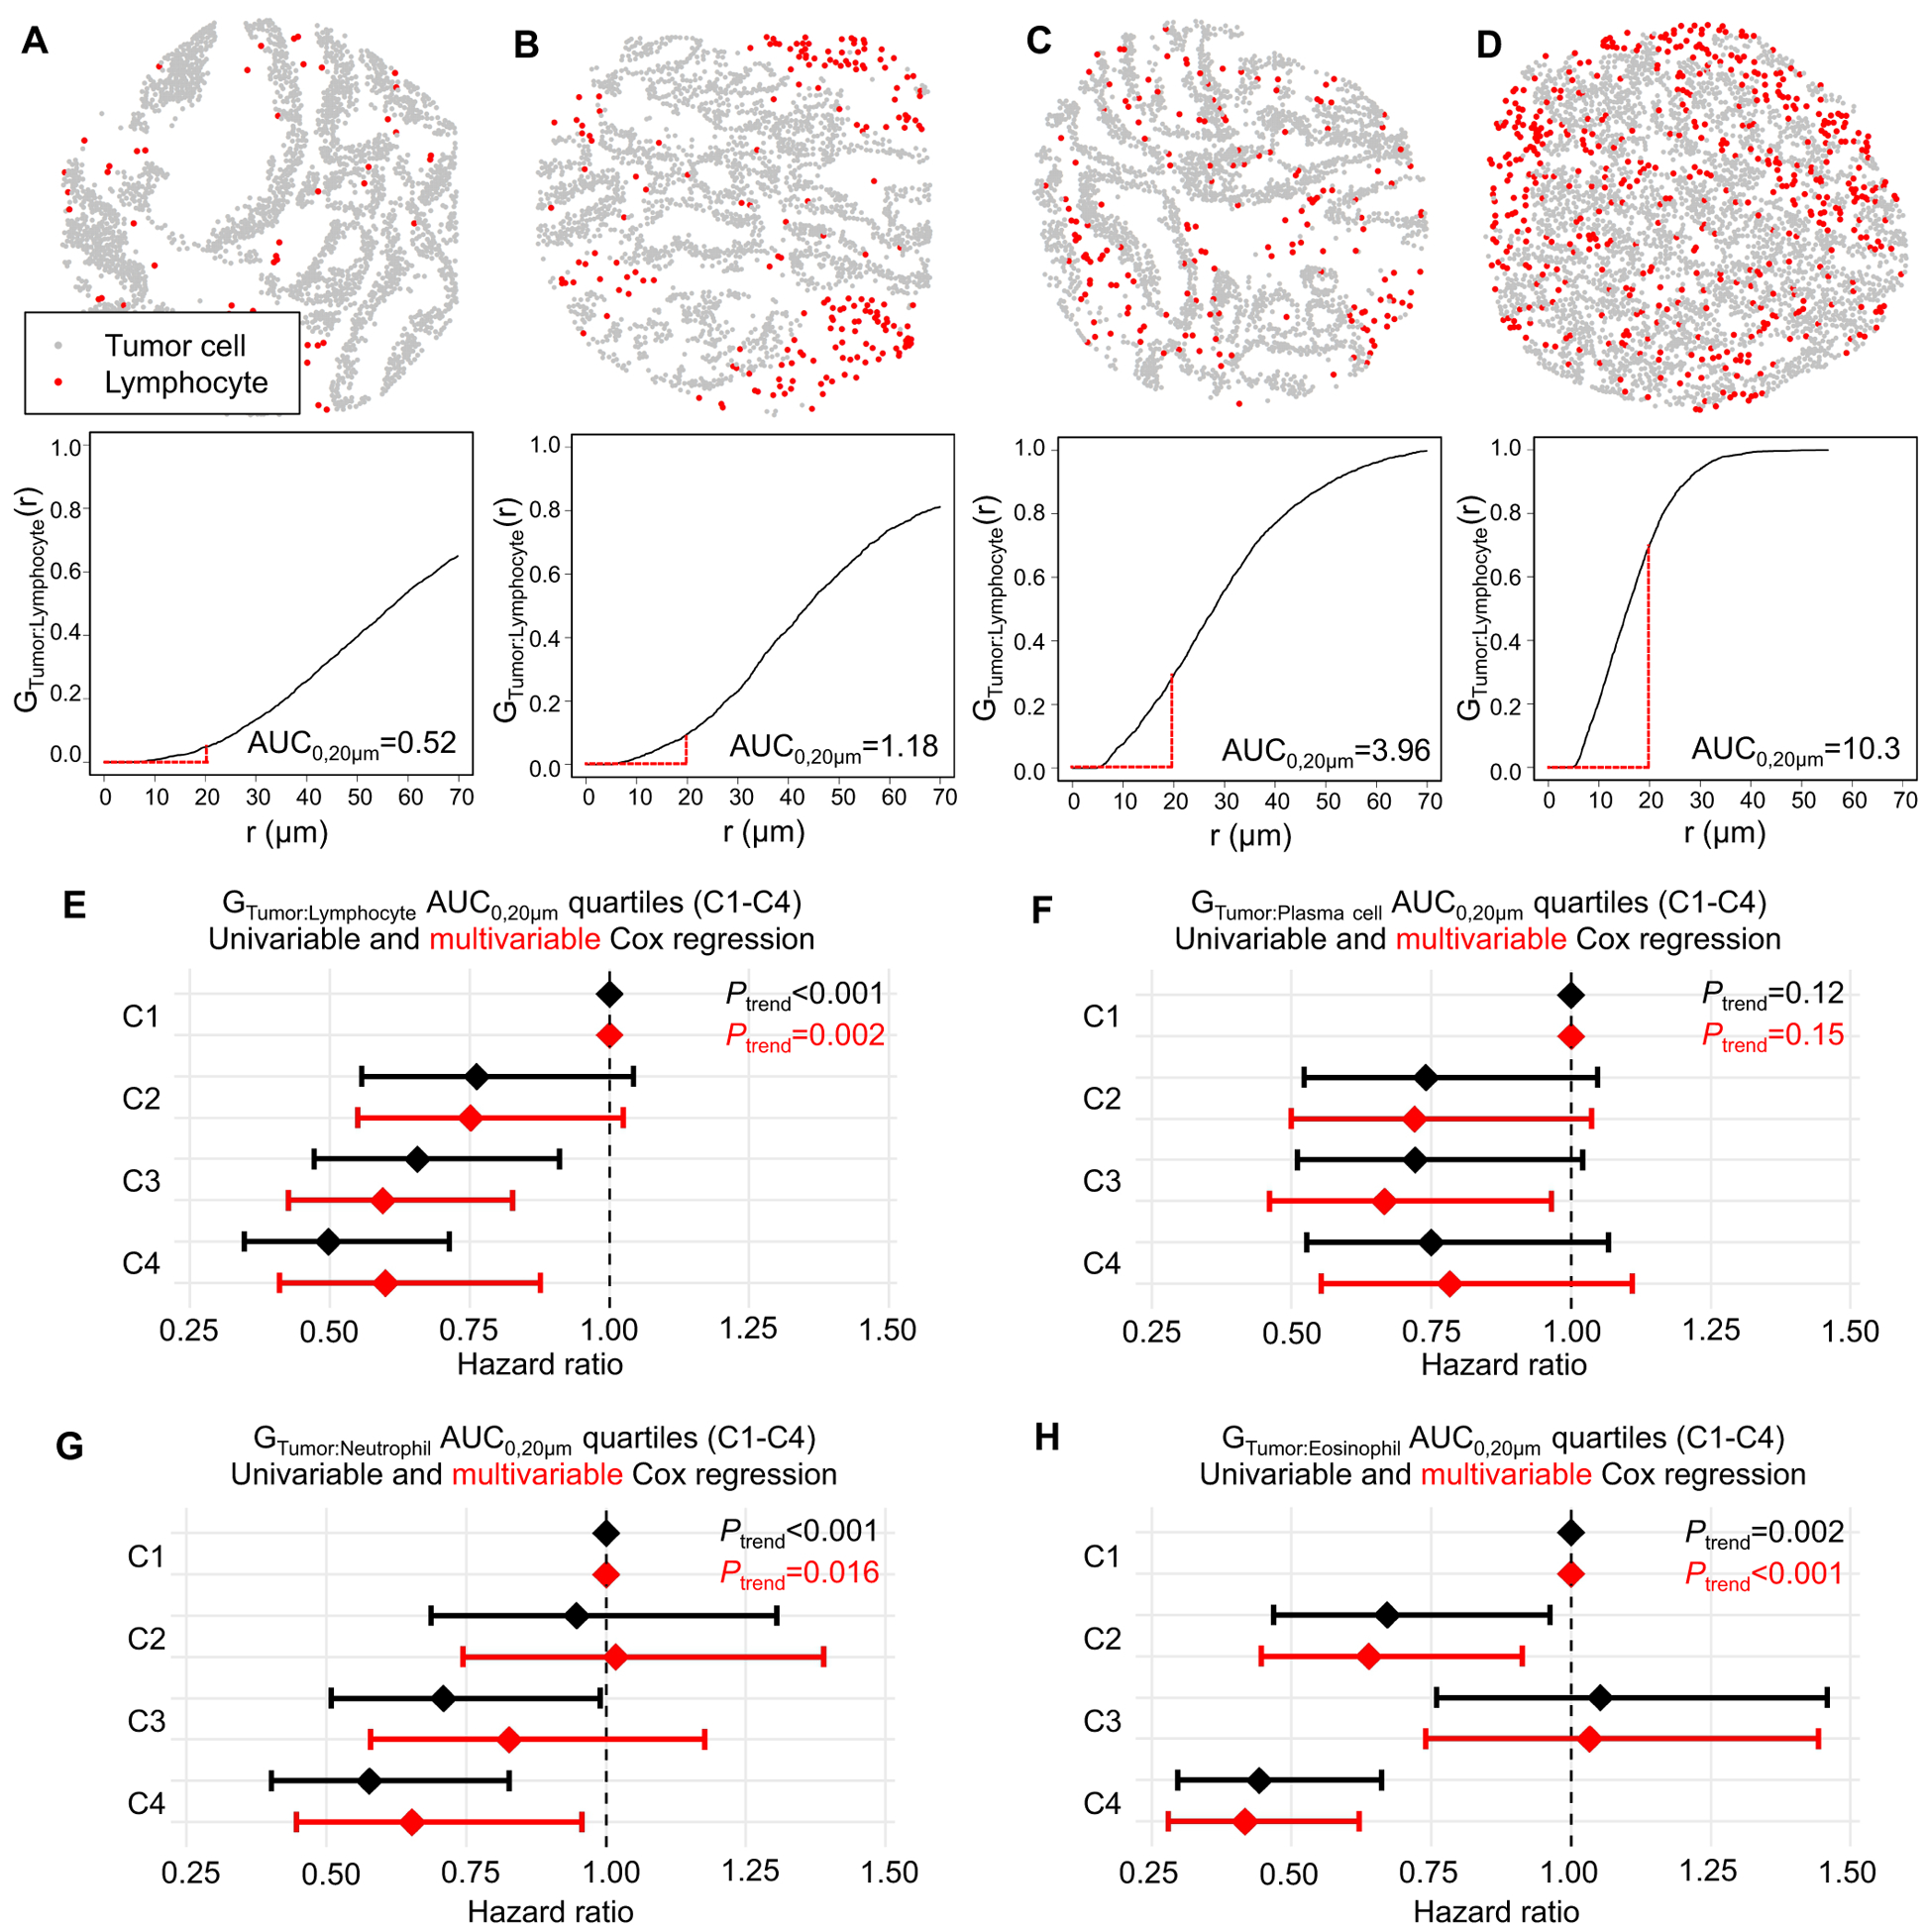
Spatial analysis of tumor immune infiltrates with Tumor:Immune cell G-cross function (GTumor:Immune cell). (A)-(D) Example lymphocyte infiltration patterns and corresponding GTumor:Lymphocyte(r) plots, estimating the probability of any tumor cell having at least one neighboring lymphocyte within an r μm radius. High immune cell infiltrate localizing near tumor cells (D) results in higher area under the curve (AUC) than a low immune cell infiltrate mainly located away from tumor cells (A). The G-cross function was summarized as AUC within a 20 μm radius (AUC0,20μm). (E)-(H) GTumor:Immune cell AUC0,20μm quartiles (C1-C4) in relation to cancer-specific survival. The multivariable Cox regression models initially included sex, age, year of diagnosis, family history of colorectal cancer, tumor location, tumor differentiation, disease stage, microsatellite instability, CpG island methylator phenotype, KRAS, BRAF, and PIK3CA mutations, and long-interspersed nucleotide element-1 methylation level. A backward elimination with a threshold P of 0.05 was used to select variables for the final models.
We hypothesized that higher AUCs of GTumor:Immune cell, reflecting a high density of the specified immune cell type clustering near tumor cells, would be associated with better survival. We conducted univariable and multivariable Cox regression analyses, using quartiles of GTumor:Immune cell AUC0,20μm as the input (Fig. 4 E–H). We restricted the radius to 20 μm to model close and plausibly direct interactions between tumor cells and specified immune cells. The analysis indicated that both high GTumor:Lymphocyte AUC0,20μm (Ptrend=0.002) and high GTumor:Eosinophil AUC0,20μm (Ptrend<0.001) were associated with better cancer-specific survival, whereas high GTumor: Plasma cell and GTumor:Neutrophil AUC0,20μm quartiles were not statistically significant in the multivariable Cox regression models with α=0.005. Cox proportional hazards models with composite variables jointly classifying tumors according to GTumor:immune cell and immune cell density uncovered differential significance for tumor-immune cell proximity and immune cell density for different immune cells (Table S8). For example, both lymphocyte density and proximity to tumor cells contributed to better cancer-specific survival, while, for plasma cells, only density contributed to better cancer-specific survival.”
Validation cohort
We analyzed an independent validation cohort of 570 colorectal cancer cases in TCGA (Table S2). Compared to the NHS/HPFS cohorts, the survival data of this cohort was limited by short follow-up and low numbers of events, particularly for the cancer-specific survival analysis (19). For cancer-specific survival analysis, during the median follow-up time of 1.8 years (IQR 1.1–3.0 years) for censored cases, there were 75 events; for overall survival analysis, during the median follow-up time of 1.8 years (IQR 1.1–2.9 years) for censored cases, there were 120 events; and for progression-free interval analysis, during the median follow-up time of 1.7 years (IQR 1.0–2.8 years) for censored cases, there were 151 events.
In agreement with the finding of the NHS/HPFS cohorts, high stromal eosinophil density was associated with longer cancer-specific survival, overall survival, and progression-free interval (all Ptrend<0.001) in multivariable Cox proportional hazards regression models (Table S9). For stromal eosinophil density C4 vs. C1, the HR for colorectal cancer-specific mortality was 0.21 (95% CI, 0.10–0.47). The point estimates for stromal lymphocyte density C4 vs. C1 were close to those seen in the NHS/HPFS cohorts (cancer-specific survival: HR 0.55, 95% CI 0.28–1.09; overall survival: HR 0.74, 95% CI 0.44–1.25; progression-free interval: HR 0.61, 95%CI 0.37–1.00), although statistical significance was not reached at α=0.005. High intraepithelial eosinophil density was also associated with longer overall survival (Ptrend<0.001) and progression-free interval (Ptrend<0.001), while higher intraepithelial lymphocyte density was associated with longer progression-free interval (Ptrend=0.009). Intraepithelial or stromal densities of plasma cells or neutrophils were not significantly associated with survival with α=0.005.
Consistent with findings in the NHS/HPFS cohorts, high GTumor:Eosinophil AUC0,20μm was associated with longer overall survival (Ptrend<0.001) and progression-free interval (Ptrend<0.001), while high GTumor:Lymphocyte AUC0,20μm was also associated with longer progression-free interval (Ptrend=0.002) (Table S10).
Discussion
In this study, we evaluated the prognostic significance of computationally phenotyped immune cells in the colorectal cancer tumor microenvironment utilizing two large U.S.-based prospective cohort studies, as well as an independent cohort of 570 colorectal cancers from TCGA. Our main findings indicate that high densities of lymphocytes and eosinophils in tumor stroma are associated with better survival independent of potential confounders. These results support the potential of machine learning-based evaluation of the immune cell infiltrate utilizing H&E-stained sections as a prognostic tool for colorectal cancer and identify previously underappreciated immune cell subsets as harboring prognostic relevance in colorectal cancer.
Lymphocytes are a heterogenous group of cells with roles in both adaptive immunity (T cells, B cells) and innate immunity (NK cells) and which contribute to a wide variety of immune regulatory and effector functions, including cytokine production (T cells, B cells, NK cells), antigen presentation (B cells), cytotoxicity (cytotoxic T cells and NK cells), and immunologic memory (memory T and B cells). High densities of CD3+ and CD8+ T cells are considered promising favorable prognostic markers in colorectal cancer (8), and there is some evidence that a high density of MS4A1+ (CD20+) B cells is also associated with longer survival (30). H&E-staining based evaluation is not able to distinguish different types of lymphocytes. However, we found that high stromal lymphocyte density was strongly associated with lower cancer mortality independent of MSI status and other potential confounders in the NHS/HPFS cohorts. In those cohorts, the prognostic significance of intraepithelial lymphocytes appeared weaker than that of stromal lymphocytes. While the reason for this is unclear, it may be related to generally higher lymphocyte densities in tumor stroma, providing for more robust outcomes analysis for stromal rather than intraepithelial regions.
Plasma cells are terminally differentiated B cells specialized in antibody production (31). Using a cohort of 557 stage I-IV colorectal cancer patients, Berntsson et al. found that high SDC1+ (CD138+) plasma cell density was associated with better survival in colorectal cancer in univariable but not multivariable Cox regression models (30). However, there are few other studies assessing their relationship with survival in colorectal cancer (32). In our study, results from the NHS/HPFS cohorts but not the TCGA validation cohort support the association between higher stromal plasma cell infiltration and better cancer-specific survival.
Neutrophils are primary effector cells of innate immunity, representing a first-line defense against microbial infection (33). Emerging evidence suggests that neutrophils, recruited to human tumors, may enhance or inhibit tumor progression by multiple mechanisms including cytotoxicity and the release of inflammatory mediators, growth factors, and proteases (33). In colorectal cancer, several studies, utilizing CEACAM8 (CD66b) (34–36) or MPO (37) to detect neutrophils have reported an association between higher neutrophil density and better survival. Notably, however, these markers are not specific to neutrophils, as CEACAM8 is also expressed by eosinophils (34,38) and MPO is expressed by some macrophages. To overcome this limitation, in a recent study, neutrophils were recognized by morphology and manually counted in H&E-stained sections (39). That study could not demonstrate a statistically significant association between neutrophil density and overall survival, although the study power was limited by sample size (221 stage I-IV colorectal cancer patients). In our study, neutrophils were also identified by their morphology in H&E-stained images. The analyses of the NHS/HPFS cohorts support the association between high intraepithelial and stromal neutrophil density and better overall survival (Ptrend<0.001 and Ptrend=0.003, respectively), although statistical significance was not achieved with cancer-specific analysis at the α level of 0.005 (Intraepithelial, Ptrend=0.012; stromal, Ptrend=0.034), or in the TCGA validation cohort.
Eosinophils are innate immune cells that play a central role in defense against parasitic infection and are also involved in the pathogenesis of allergy and asthma (40). Like neutrophils, eosinophils can be reliably identified by their morphology in H&E-stained sections, as was done in our study. Several earlier studies found an association between higher eosinophil densities in colorectal cancer and better survival (41,42). Our study, utilizing a large sample of two U.S. prospective cohort studies, as well as TCGA, supports the association between higher density of stromal eosinophils and better cancer-specific survival and overall survival. This finding is consistent with recent experimental evidence for an antitumorigenic role for eosinophils in a mouse colorectal cancer model (43). In that model, the tumor-inhibiting role of eosinophils was independent of CD8+ T cells (43). In our study, there was only moderate or weak correlation between eosinophil density and lymphocyte density (stromal: Spearman rho=0.47; intraepithelial: Spearman rho=0.17), suggesting that the factors modulating the density of these immune cells may be at least partially independent. Indeed, our study did not support an association between the density of stromal eosinophils and MSI or neoantigen load and, to our knowledge, such relationships have not been previously reported.
We utilized machine learning based image analysis in the detection of four immune cell types with distinctive morphology in H&E-stained sections. During the past few years, such methods have been increasingly applied for the analysis of histopathology images (44). Many widely used deep learning methods use pixel patches (such as 100×100 pixels) as an input (44,45), while the method we used included separate explicit steps for cell detection (based on high hematoxylin optical density in nuclei) and classification (based on morphologic features). We used QuPath, an open source software, which has been widely adapted and validated for digital pathology image analysis (20,46,47). Our method achieved good to excellent accuracy in relation to laborious manual counting (Spearman rho=0.71–0.95), and good to excellent reproducibility between two independently trained classifiers (Spearman rho=0.71–0.96), dependent on cell type. Better performance in detecting lymphocytes and eosinophils compared to plasma cells and neutrophils may be related to higher variability of morphology among plasma cells relative to other cell types and issues related to distinguishing neutrophils with nuclear lobules that are only partially visible, as well as differentiating neutrophils from apoptotic nuclear fragments and mitoses. A particular benefit of machine learning-based quantification is that all the images have been evaluated with the same criteria, improving data consistency.
The format of our data also enabled analysis of spatial features of immune cell infiltration in relation to tumor cells. We utilized the GTumor:Immune cell(r) function to approximate the likelihood of tumor cells having an immune cell neighbor of the specified type within an r μm radius. We hypothesized that high GTumor:Immune cell AUC0,20μm, correlating with a high density of immune cells clustering near tumor cells, would be associated with better outcome, and that this association would be more pronounced in analyses involving cell types that may show cytotoxicity towards tumor cells, including lymphocytes, neutrophils, and eosinophils, although such an association may not hold for the GTumor:Plasma cell analysis, as potential anti-tumor antibody production would not require close contact to tumor cells. Supporting our hypothesis, we observed that high AUC0,20μm for lymphocytes and eosinophils had a statistically significant multivariable adjusted association with longer survival. This association was also observed for eosinophils in the TCGA validation cohort. However, in the NHS/HPFS cohorts, the GTumor:Eosinophil C3 category did not follow the trend towards better prognosis, the reasons for which are not clear. There are many potential approaches to characterizing tumor-immune spatial interactions (48,49), and optimal methods to improve prognostic classification require further investigation.
Several limitations need to be considered in the interpretation of our results. First, information on cancer treatment was lacking. Nevertheless, treatments had been based mainly on disease stage rather than tumor immune infiltrate, and we adjusted the survival analyses for disease stage. Second, the study evaluated multiple hypotheses. However, we used a stringent α level of 0.005 to improve the reproducibility and decrease false positive findings (24). Third, the NHS/HPFS cohort analysis was performed using TMAs, and the immune cell infiltrates present in the small area of each tumor in TMA format may not fully represent immune cell infiltrates in the whole tumor area. However, numerous studies have generated reproducible results using tissue microarrays (50). In addition, multiple TMA core images were examined for most tumors (mean of 3.2 cores per tumor). Since tumor regions for TMA coring were selected without specific regard to immune cell infiltrates, any measurement errors due to the use of the TMA format would likely drive our results towards the null hypotheses. Moreover, TMAs enabled us to investigate more than 900 tumors with uniform staining quality, improving the accuracy of the immune cell detection. Fourth, the TMAs only included cores from the tumor center, precluding examination of the immune cell infiltrate at the invasive margin and tertiary lymphoid structures, both of which have been reported to harbor prognostic significance (7,8,10).
Use of TCGA as a validation cohort imposed some additional limitations. The follow-up period in this cohort was short, and cancer-specific survival data had to be approximated based on “tumor_status” and “vital_status” variables, as described before (19). The event rate was low, resulting in poor statistical power, particularly for cancer-specific survival analysis. The H&E staining and image quality were highly variable, thereby hindering optimal recognition of immune cell types using nuclear morphology in a subset of images and resulting in lower lymphocyte, plasma cell, and neutrophil densities as compared to the NHS/HPFS cohorts. Most notably, identification of plasma cells, based predominantly finely-detailed nuclear morphology, was difficult in a large subset of cases. This may account for differences between the cohorts regarding the significance of this cell type. Conversely, eosinophil densities were similar in both cohorts, and stromal eosinophil density consistently had strong prognostic value.
The advantages of the study include the availability of a comprehensive data set of potential confounding factors in the NHS/HPFS cohorts, such as family history of colorectal cancer, MSI status, CIMP, LINE-1 methylation, and BRAF mutation status, which were included in the survival analyses. Nevertheless, several clinically relevant data elements were unavailable, such as tumor budding, NRAS status, and history of Lynch syndrome. Additionally, the study population was based on a large number of hospitals across the U.S., facilitating the generalizability of our results. Moreover, examination of multiple immune cell types at the same time enabled a more granular view of the colorectal cancer tissue microenvironment than analyses based on a single cell type.
In conclusion, our results support the potential of machine learning-based evaluation of the immune cell infiltrates utilizing H&E-stained sections as a prognostic parameter in colorectal cancer. In particular, high density of eosinophils in tumor stroma was associated with favorable outcome. The results also suggest that the spatial patterns of immune cell infiltrate in relation to tumor cells harbor biologically and prognostically relevant information.
Supplementary Material
Translational Relevance.
Drawing from a large database of two prospective U.S. cohort studies, we identified lymphocytes, plasma cells, neutrophils, and eosinophils in digital images of hematoxylin and eosin (H&E)-stained sections from more than 930 colorectal cancers using pathologist-supervised machine learning algorithms and studied their associations with cancer-specific mortality, while extensively adjusting for potential confounders, including microsatellite instability (MSI) status, CpG island methylator phenotype (CIMP), LINE-1 methylation, and KRAS, BRAF, and PIK3CA mutation status. We found that high densities not only of stromal lymphocytes but also eosinophils were associated with better cancer-specific survival, and greater proximity of lymphocytes and eosinophils to tumor cells was also associated with better cancer-specific survival. These findings highlight the potential for machine learning assessment of H&E-stained sections to provide robust, quantitative tumor-immune biomarkers for precision medicine and identify previously underappreciated immune cell subsets as harboring prognostic relevance.
Acknowledgements
We would like to thank the participants and staff of the Nurses’ Health Study and the Health Professionals Follow-up Study for their valuable contributions as well as the following state cancer registries for their help: AL, AZ, AR, CA, CO, CT, DE, FL, GA, ID, IL, IN, IA, KY, LA, ME, MD, MA, MI, NE, NH, NJ, NY, NC, ND, OH, OK, OR, PA, RI, SC, TN, TX, VA, WA, WY. The authors assume full responsibility for analyses and interpretation of these data. Portions of this research were conducted on the O2 High Performance Compute Cluster, supported by the Research Computing Group, at Harvard Medical School. See http://rc.hms.harvard.edu for more information. The results shown here are in part based upon data generated by the TCGA Research Network: https://www.canger.goc/tcga. This work was supported by U.S. National Institutes of Health (NIH) grants (P01 CA87969 to M.J. Stampfer; UM1 CA186107 to M.J. Stampfer; P01 CA55075 to W.C. Willett; UM1 CA167552 to W.C. Willett; U01 CA167552 to W.C. Willett and L.A. Mucci; P50 CA127003 to C.S.F.; R01 CA118553 to C.S.F.; R01 CA169141 to C.S.F.; R01 CA137178 to A.T.C.; K24 DK098311 to A.T.C.; R35 CA197735 to S.O.; R01 CA151993 to S.O.; K07 CA190673 to R.N.; R03 CA197879 to K.W.; R21 CA222940 to K.W. and M.G.; and R21 CA230873 to K.W. and S.O.); by Cancer Research UK Grand Challenge Award (OPTIMISTICC, UK C10674/A27140 to M.G. and S.O.); by Nodal Award (2016-02) from the Dana-Farber Harvard Cancer Center (to S.O.); by the Stand Up to Cancer Colorectal Cancer Dream Team Translational Research Grant (SU2C-AACR-DT22-17 to C.S.F. and M.G.), administered by the American Association for Cancer Research, a scientific partner of SU2C; and by grants from the Project P Fund, The Friends of the Dana-Farber Cancer Institute, Bennett Family Fund, and the Entertainment Industry Foundation through National Colorectal Cancer Research Alliance. K.H. was supported by fellowship grants from the Uehara Memorial Foundation and the Mitsukoshi Health and Welfare Foundation. S.A.V. was supported by grants from the Finnish Cultural Foundation and Orion Research Foundation sr. J.B. was supported by a grant from the Australia Awards-Endeavour Scholarships and Fellowships Program. K.F. was supported by a fellowship grant from the Uehara Memorial Foundation. K.A. was supported by grants from Overseas Research Fellowship from Japan Society for the Promotion of Science (JP201860083). K.W. was supported by an Investigator Initiated Grant from the American Institute for Cancer Research (AICR). M.G. was supported by a Conquer Cancer Foundation of ASCO Career Development Award. A.T.C. is a Stuart and Suzanne Steele MGH Research Scholar. The content is solely the responsibility of the authors and does not necessarily represent the official views of NIH. The funders had no role in study design, data collection and analysis, decision to publish, or preparation of the manuscript.
Abbreviations:
- AJCC
American Joint Committee on Cancer
- AUC
area under the curve
- CI
confidence interval
- CIMP
CpG island methylator phenotype
- FFPE
formalin-fixed paraffin-embedded
- H&E
hematoxylin & eosin
- HPFS
Health Professionals Follow-up Study
- HR
hazard ratio
- IPW
inverse probability weighting
- IQR
interquartile range
- LINE-1
long-interspersed nucleotide element-1
- MSI
microsatellite instability
- NHS
Nurses’ Health Study
- PCR
polymerase chain reaction
- SD
standard deviation
- TCGA
The Cancer Genome Atlas
- TMA
tissue microarray
- TNM
tumor, node, metastasis
- UMAP
Uniform Manifold Approximation and Projection
Footnotes
Disclosure of Potential Conflicts of Interest:
A.T.C. previously served as a consultant for Bayer Healthcare and Pfizer Inc. C.S.F. previously served as a consultant for Agios, Bain Capital, Bayer, Celgene, Dicerna, Five Prime Therapeutics, Gilead Sciences, Eli Lilly, Entrinsic Health, Genentech, KEW, Merck, Merrimack Pharmaceuticals, Pfizer Inc, Sanofi, Taiho, and Unum Therapeutics; C.S.F. also serves as a Director for CytomX Therapeutics and owns unexercised stock options for CytomX and Entrinsic Health. J.A.M. received institutional research funding from Boston Biomedical. J.A.M. has also served as an advisor/consultant to Ignyta, Array Pharmaceutical, and Cota. M.G. receives research funding from Bristol-Myers Squibb and Merck. R.N. is currently employed by Pfizer Inc. She contributed to this study before she was employed by Pfizer Inc. This study was not funded by any of these commercial entities. No other conflicts of interest exist. The other authors declare that they have no conflicts of interest.
Use of Standardized Official Symbols:
We use HUGO (Human Genome Organisation)-approved official symbols (or root symbols) for genes and gene products, including BRAF, CACNA1G, CD3, CD8, CDKN2A, CEACAM8, CRABP1, IGF2, MLH1, MPO, MS4A1, NEUROG1, PIK3CA, RUNX3, SDC1, SOCS1; all of which are described at www.genenames.org. Gene symbols are italicized whereas symbols for gene products are not italicized.
References
- 1.Bray F, Ferlay J, Soerjomataram I, Siegel RL, Torre LA, Jemal A. Global cancer statistics 2018: GLOBOCAN estimates of incidence and mortality worldwide for 36 cancers in 185 countries. CA Cancer J Clin. 2018;68:394–424. [DOI] [PubMed] [Google Scholar]
- 2.Benson AB, Venook AP, Al-Hawary MM, Cederquist L, Chen Y-J, Ciombor KK, et al. NCCN Guidelines Insights: Colon Cancer, Version 2.2018. J Natl Compr Canc Netw. 2018;16:359–69. [DOI] [PMC free article] [PubMed] [Google Scholar]
- 3.Benson AB, Venook AP, Al-Hawary MM, Cederquist L, Chen Y-J, Ciombor KK, et al. Rectal Cancer, Version 2.2018, NCCN Clinical Practice Guidelines in Oncology. J Natl Compr Canc Netw. 2018;16:874–901. [DOI] [PMC free article] [PubMed] [Google Scholar]
- 4.Ogino S, Nowak JA, Hamada T, Milner DA, Nishihara R. Insights into Pathogenic Interactions Among Environment, Host, and Tumor at the Crossroads of Molecular Pathology and Epidemiology. Annu Rev Pathol. 2019;14:83–103. [DOI] [PMC free article] [PubMed] [Google Scholar]
- 5.Hanahan D, Weinberg RA. Hallmarks of cancer: the next generation. Cell. 2011;144:646–74. [DOI] [PubMed] [Google Scholar]
- 6.O’Donnell JS, Teng MWL, Smyth MJ. Cancer immunoediting and resistance to T cell-based immunotherapy. Nat Rev Clin Oncol. 2019;16:151–67. [DOI] [PubMed] [Google Scholar]
- 7.Alexander PG, McMillan DC, Park JH. The local inflammatory response in colorectal cancer - Type, location or density? A systematic review and meta-analysis. Cancer Treat Rev. 2020;83:101949. [DOI] [PubMed] [Google Scholar]
- 8.Pagès F, Mlecnik B, Marliot F, Bindea G, Ou F, Bifulco C, et al. International validation of the consensus Immunoscore for the classification of colon cancer: a prognostic and accuracy study. Lancet (London, England). 2018;391:2128–39. [DOI] [PubMed] [Google Scholar]
- 9.Kather JN, Halama N. Harnessing the innate immune system and local immunological microenvironment to treat colorectal cancer. Br J Cancer. 2019;120:871–82. [DOI] [PMC free article] [PubMed] [Google Scholar]
- 10.Helmink BA, Reddy SM, Gao J, Zhang S, Basar R, Thakur R, et al. B cells and tertiary lymphoid structures promote immunotherapy response. Nature. 2020;577:549–55. [DOI] [PMC free article] [PubMed] [Google Scholar]
- 11.Yamauchi M, Lochhead P, Morikawa T, Huttenhower C, Chan AT, Giovannucci E, et al. Colorectal cancer: a tale of two sides or a continuum? Gut. 2012;61:794–7. [DOI] [PMC free article] [PubMed] [Google Scholar]
- 12.Ogino S, Kawasaki T, Kirkner GJ, Kraft P, Loda M, Fuchs CS. Evaluation of markers for CpG island methylator phenotype (CIMP) in colorectal cancer by a large population-based sample. J Mol Diagn. 2007;9:305–14. [DOI] [PMC free article] [PubMed] [Google Scholar]
- 13.Ogino S, Kawasaki T, Brahmandam M, Yan L, Cantor M, Namgyal C, et al. Sensitive sequencing method for KRAS mutation detection by Pyrosequencing. J Mol Diagn. 2005;7:413–21. [DOI] [PMC free article] [PubMed] [Google Scholar]
- 14.Liao X, Lochhead P, Nishihara R, Morikawa T, Kuchiba A, Yamauchi M, et al. Aspirin use, tumor PIK3CA mutation, and colorectal-cancer survival. N Engl J Med. 2012;367:1596–606. [DOI] [PMC free article] [PubMed] [Google Scholar]
- 15.Irahara N, Nosho K, Baba Y, Shima K, Lindeman NI, Hazra A, et al. Precision of pyrosequencing assay to measure LINE-1 methylation in colon cancer, normal colonic mucosa, and peripheral blood cells. J Mol Diagn. 2010;12:177–83. [DOI] [PMC free article] [PubMed] [Google Scholar]
- 16.Giannakis M, Mu XJ, Shukla SA, Qian ZR, Cohen O, Nishihara R, et al. Genomic Correlates of Immune-Cell Infiltrates in Colorectal Carcinoma. Cell Rep. 2016;15:857–65. [DOI] [PMC free article] [PubMed] [Google Scholar]
- 17.Chan AT, Ogino S, Fuchs CS. Aspirin and the risk of colorectal cancer in relation to the expression of COX-2. N Engl J Med. 2007;356:2131–42. [DOI] [PubMed] [Google Scholar]
- 18.The Cancer Genome Atlas Network. Comprehensive molecular characterization of human colon and rectal cancer. Nature. 2012;487:330–7. [DOI] [PMC free article] [PubMed] [Google Scholar]
- 19.Liu J, Lichtenberg T, Hoadley KA, Poisson LM, Lazar AJ, Cherniack AD, et al. An Integrated TCGA Pan-Cancer Clinical Data Resource to Drive High-Quality Survival Outcome Analytics. Cell. 2018;173:400–416.e11. [DOI] [PMC free article] [PubMed] [Google Scholar]
- 20.Bankhead P, Loughrey MB, Fernández JA, Dombrowski Y, McArt DG, Dunne PD, et al. QuPath: Open source software for digital pathology image analysis. Sci Rep. 2017;7:16878. [DOI] [PMC free article] [PubMed] [Google Scholar]
- 21.McInnes L, Healy J, Melville J. UMAP: Uniform Manifold Approximation and Projection for Dimension Reduction. bioRxiv. 2018;arXiv:1802. [Google Scholar]
- 22.Barua S, Fang P, Sharma A, Fujimoto J, Wistuba I, Rao AUK, et al. Spatial interaction of tumor cells and regulatory T cells correlates with survival in non-small cell lung cancer. Lung Cancer. 2018;117:73–9. [DOI] [PMC free article] [PubMed] [Google Scholar]
- 23.Baddeley A, Turner R. spatstat : An R Package for Analyzing Spatial Point Patterns. J Stat Softw. 2005;12:282–90. [Google Scholar]
- 24.Benjamin DJ, Berger JO, Johannesson M, Nosek BA, Wagenmakers E-J, Berk R, et al. Redefine statistical significance. Nat Hum Behav. 2018;2:6–10. [DOI] [PubMed] [Google Scholar]
- 25.Liu L, Nevo D, Nishihara R, Cao Y, Song M, Twombly TS, et al. Utility of inverse probability weighting in molecular pathological epidemiology. Eur J Epidemiol. 2018;33:381–92. [DOI] [PMC free article] [PubMed] [Google Scholar]
- 26.Seaman SR, White IR. Review of inverse probability weighting for dealing with missing data. Stat Methods Med Res. 2013;22:278–95. [DOI] [PubMed] [Google Scholar]
- 27.Hamada T, Cao Y, Qian ZR, Masugi Y, Nowak JA, Yang J, et al. Aspirin Use and Colorectal Cancer Survival According to Tumor CD274 (Programmed Cell Death 1 Ligand 1) Expression Status. J Clin Oncol. 2017;35:1836–44. [DOI] [PMC free article] [PubMed] [Google Scholar]
- 28.Ogino S, Nosho K, Kirkner GJ, Kawasaki T, Meyerhardt JA, Loda M, et al. CpG island methylator phenotype, microsatellite instability, BRAF mutation and clinical outcome in colon cancer. Gut. 2009;58:90–6. [DOI] [PMC free article] [PubMed] [Google Scholar]
- 29.Grasso CS, Giannakis M, Wells DK, Hamada T, Mu XJ, Quist M, et al. Genetic Mechanisms of Immune Evasion in Colorectal Cancer. Cancer Discov. 2018;8:730–49. [DOI] [PMC free article] [PubMed] [Google Scholar]
- 30.Berntsson J, Nodin B, Eberhard J, Micke P, Jirström K. Prognostic impact of tumour-infiltrating B cells and plasma cells in colorectal cancer. Int J cancer. 2016;139:1129–39. [DOI] [PubMed] [Google Scholar]
- 31.Nutt SL, Hodgkin PD, Tarlinton DM, Corcoran LM. The generation of antibody-secreting plasma cells. Nat Rev Immunol. 2015;15:160–71. [DOI] [PubMed] [Google Scholar]
- 32.Wouters MCA, Nelson BH. Prognostic Significance of Tumor-Infiltrating B Cells and Plasma Cells in Human Cancer. Clin Cancer Res. 2018;24:6125–35. [DOI] [PubMed] [Google Scholar]
- 33.Coffelt SB, Wellenstein MD, de Visser KE. Neutrophils in cancer: neutral no more. Nat Rev Cancer. 2016;16:431–46. [DOI] [PubMed] [Google Scholar]
- 34.Governa V, Trella E, Mele V, Tornillo L, Amicarella F, Cremonesi E, et al. The Interplay Between Neutrophils and CD8+T Cells Improves Survival in Human Colorectal Cancer. Clin Cancer Res. 2017;23:3847–58. [DOI] [PubMed] [Google Scholar]
- 35.Wikberg ML, Ling A, Li X, Öberg Å, Edin S, Palmqvist R. Neutrophil infiltration is a favorable prognostic factor in early stages of colon cancer. Hum Pathol. 2017;68:193–202. [DOI] [PubMed] [Google Scholar]
- 36.Galdiero MR, Bianchi P, Grizzi F, Di Caro G, Basso G, Ponzetta A, et al. Occurrence and significance of tumor-associated neutrophils in patients with colorectal cancer. Int J cancer. 2016;139:446–56. [DOI] [PubMed] [Google Scholar]
- 37.Droeser RA, Hirt C, Eppenberger-Castori S, Zlobec I, Viehl CT, Frey DM, et al. High myeloperoxidase positive cell infiltration in colorectal cancer is an independent favorable prognostic factor. PLoS One. 2013;8:e64814. [DOI] [PMC free article] [PubMed] [Google Scholar]
- 38.Yoon J, Terada A, Kita H. CD66b regulates adhesion and activation of human eosinophils. J Immunol. 2007;179:8454–62. [DOI] [PubMed] [Google Scholar]
- 39.Berry RS, Xiong M-J, Greenbaum A, Mortaji P, Nofchissey RA, Schultz F, et al. High levels of tumor-associated neutrophils are associated with improved overall survival in patients with stage II colorectal cancer. PLoS One. 2017;12:e0188799. [DOI] [PMC free article] [PubMed] [Google Scholar]
- 40.Ramirez GA, Yacoub M-R, Ripa M, Mannina D, Cariddi A, Saporiti N, et al. Eosinophils from Physiology to Disease: A Comprehensive Review. Biomed Res Int. 2018;2018:9095275. [DOI] [PMC free article] [PubMed] [Google Scholar]
- 41.Prizment AE, Vierkant RA, Smyrk TC, Tillmans LS, Lee JJ, Sriramarao P, et al. Tumor eosinophil infiltration and improved survival of colorectal cancer patients: Iowa Women’s Health Study. Mod Pathol. 2016;29:516–27. [DOI] [PMC free article] [PubMed] [Google Scholar]
- 42.Nielsen HJ, Hansen U, Christensen IJ, Reimert CM, Brünner N, Moesgaard F. Independent prognostic value of eosinophil and mast cell infiltration in colorectal cancer tissue. J Pathol. 1999;189:487–95. [DOI] [PubMed] [Google Scholar]
- 43.Reichman H, Itan M, Rozenberg P, Yarmolovski T, Brazowski E, Varol C, et al. Activated Eosinophils Exert Antitumorigenic Activities in Colorectal Cancer. Cancer Immunol Res. 2019;7:388–400. [DOI] [PubMed] [Google Scholar]
- 44.Komura D, Ishikawa S. Machine Learning Methods for Histopathological Image Analysis. Comput Struct Biotechnol J. 2018;16:34–42. [DOI] [PMC free article] [PubMed] [Google Scholar]
- 45.Saltz J, Gupta R, Hou L, Kurc T, Singh P, Nguyen V, et al. Spatial Organization and Molecular Correlation of Tumor-Infiltrating Lymphocytes Using Deep Learning on Pathology Images. Cell Rep. 2018;23:181–193.e7. [DOI] [PMC free article] [PubMed] [Google Scholar]
- 46.Loughrey MB, Bankhead P, Coleman HG, Hagan RS, Craig S, McCorry AMB, et al. Validation of the systematic scoring of immunohistochemically stained tumour tissue microarrays using QuPath digital image analysis. Histopathology. 2018;73:327–38. [DOI] [PubMed] [Google Scholar]
- 47.Bankhead P, Fernández JA, McArt DG, Boyle DP, Li G, Loughrey MB, et al. Integrated tumor identification and automated scoring minimizes pathologist involvement and provides new insights to key biomarkers in breast cancer. Lab Invest. 2018;98:15–26. [DOI] [PubMed] [Google Scholar]
- 48.Maley CC, Koelble K, Natrajan R, Aktipis A, Yuan Y. An ecological measure of immune-cancer colocalization as a prognostic factor for breast cancer. Breast Cancer Res. 2015;17:131. [DOI] [PMC free article] [PubMed] [Google Scholar]
- 49.Setiadi AF, Ray NC, Kohrt HE, Kapelner A, Carcamo-Cavazos V, Levic EB, et al. Quantitative, architectural analysis of immune cell subsets in tumor-draining lymph nodes from breast cancer patients and healthy lymph nodes. PLoS One. 2010;5:e12420. [DOI] [PMC free article] [PubMed] [Google Scholar]
- 50.Camp RL, Neumeister V, Rimm DL. A decade of tissue microarrays: progress in the discovery and validation of cancer biomarkers. J Clin Oncol. 2008;26:5630–7. [DOI] [PubMed] [Google Scholar]
Associated Data
This section collects any data citations, data availability statements, or supplementary materials included in this article.