

Abstract
Diverse RNAs and RNA-binding proteins form phase-separated, membraneless granules in cells under stress conditions. However, the role of the prevalent mRNA methylation, m6A, and its binding proteins in stress granule (SG) assembly remain unclear. Here, we show that m6A-modified mRNAs are enriched in SGs, and that m6A-binding YTHDF proteins are critical for SG formation. Depletion of YTHDF1/3 inhibits SG formation and recruitment of mRNAs to SGs. Both the N-terminal intrinsically disordered region and the C-terminal m6A-binding YTH domain of YTHDF proteins are important for SG formation. Super-resolution imaging further reveals that YTHDF proteins appear to be in a super-saturated state, forming clusters that often reside in the periphery of and at the junctions between SG core clusters, and potentially promote SG formation by reducing the activation energy barrier and critical size for SG condensate formation. Our results suggest a new function of the m6A-binding YTHDF proteins in regulating SG formation.
Main
RNA-protein (RNP) granules are membraneless organelles that play important roles in epigenetic and post-transcriptional regulations1–6. Stress granules (SGs) are RNP granules that assemble under various cellular stress conditions, such as oxidative, osmotic, or heat-shock stress, and regulate messenger RNA (mRNA) translation and degradation1,4,5. Defects in SG dynamics are associated with various diseases such as neurodegenerative disorders, cancers, viral infections, and autoimmune diseases7,8.
RNAs and RNA-interacting proteins are crucial components of SGs9–12. N6-methyladenosine (m6A) is the most abundant internal mRNA modification13–16, and three of the major m6A-binding proteins, YTHDF1-3 (ref. 15), are implicated in the SG proteome and can interact with SG components12,17–20. However, some key components of SGs, including the SG core proteins, G3BP1/2 (ref. 21), and their binding partners22, preferentially bind to unmodified RNA instead of m6A-modified RNAs in specific sequence contexts23. These binding behaviors of SG proteins to m6A-modified RNAs and m6A-binding proteins raise the important question of whether m6A-modified RNAs and m6A-binding proteins play a role in SG formation.
Here, we studied the localization of m6A-modified mRNAs and m6A-binding YTHDF proteins in mammalian cells, and identified the m6A-binding YTHDF proteins as key regulators for SG formation. We observed an enrichment of m6A-modified mRNAs in SGs. Depletion of YTHDF1/3 proteins substantially inhibited SG formation and prevented enrichment of both methylated and unmethylated mRNA signals in SGs. Both the N-terminal intrinsically-disordered region (IDR) and C-terminal m6A-binding YTH domain of YTHDF proteins were important for SG formation. Super-resolution imaging further showed that YTHDF1 appeared to be in a super-saturated state under unstressed conditions. Upon oxidative stress, YTHDF1 tended to reside in the periphery of and at the junctions between SG core clusters and appeared to lower the activation energy barrier and reduce the critical size for SG condensate formation.
Results
Imaging m6A-modified mRNA in mammalian cells.
To examine the subcellular distribution of m6A-modified mRNAs in mammalian (U-2 OS) cells, we developed an immunofluorescence protocol that specifically labels m6A-modified mRNAs (Methods and Supplementary Fig. 1) and validated the labeling specificity for m6A using gene-edited U-2 OS cells in which a key m6A methyltransferase component METTL3 is knocked out24. The amount of m6A in mRNAs was reduced by about 40% in METTL3 knockout cells, as measured by ultra-high performance liquid chromatography-tandem mass spectrometry (UHPLC-MS/MS) (Supplementary Fig. 2a), and our immunofluorescence signal for mRNA m6A was reduced by 25% - 30% in these knockout cells, as measured by two different polyclonal anti-m6A antibodies (Supplementary Fig. 2b–e).
Using this imaging approach, we observed several notable features for the distribution of mRNA m6A in unstressed cells: First, the normalized intensity of the mRNA m6A signal (normalized by polyA signal) was substantially higher in the cytoplasm than in the nucleus (Supplementary Fig. 3a,b), which is consistent with the known effect of m6A on promoting nuclear export of mRNAs25. Second, in the cytoplasm, in addition to the diffusively distributed signals, we observed an enrichment of m6A in processing bodies (P-bodies) (Supplementary Fig. 3c).
Enrichment of m6A-modified mRNA in SGs.
To study the localization of mRNA m6A under stressed conditions, we imaged mRNA m6A and polyA signals simultaneously in U-2 OS cells under oxidative stress induced by NaAsO2 treatment. NaAsO2 treatment induced the formation of numerous SGs in the cytoplasm, marked by an SG core protein G3BP1 (Fig. 1a and Supplementary Fig. 3d)22. We observed strong signals of both mRNA m6A and polyA in SGs (Fig. 1a and Supplementary Fig. 3d). Quantitatively, polyA showed ~3-fold enrichment in SGs as compared to elsewhere in the cytoplasm whereas m6A showed 4- to 5-fold enrichment in SGs (Fig. 1a and Supplementary Fig. 3d), suggesting that m6A-modified mRNAs have a higher tendency to associate with SGs than unmethylated mRNAs. We also observed strong m6A signals but not polyA signals in P-bodies (Fig. 1a and Supplementary Fig. 3d), which is consistent with previous observations that the m6A-binding protein YTHDF2 localizes in P-bodies26 and that deadenylation of mRNAs is a prerequisite for P-body formation27.
Fig. 1 |. m6A-modified mRNAs are enriched in stress granules (SGs) in U-2 OS cells under oxidative stress.
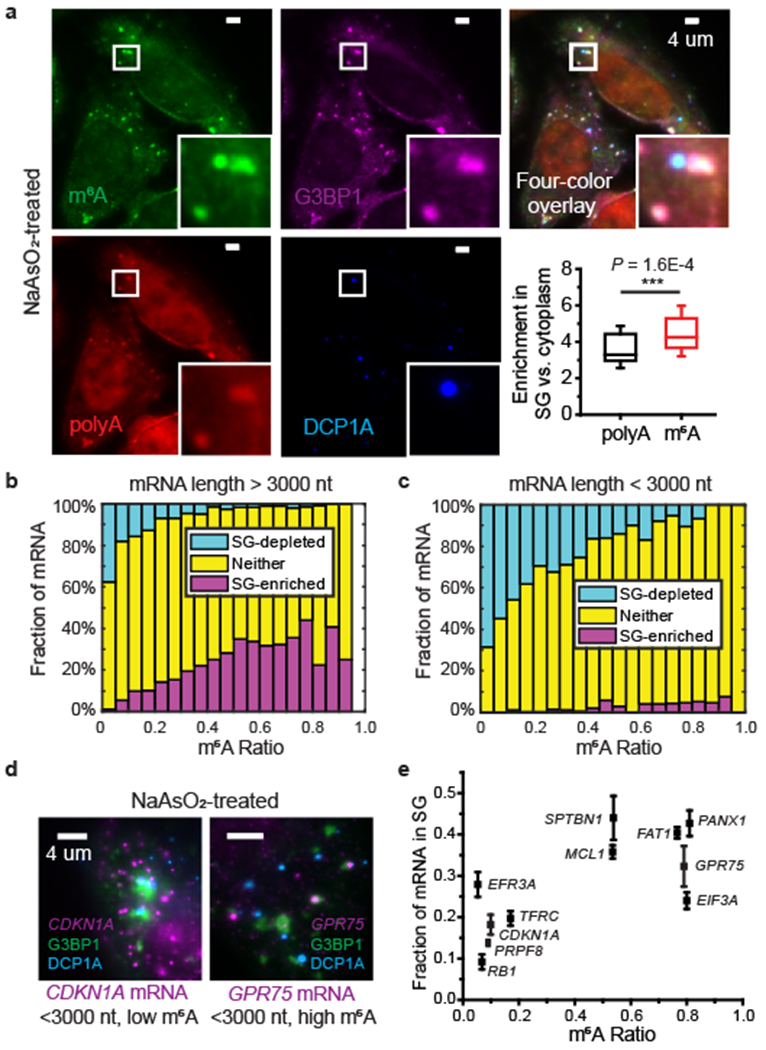
a, Immunofluorescence staining of mRNA m6A (with polyclonal anti-m6A antibody from Abcam) in U-2 OS cells treated with 0.5 mM NaAsO2 for 30 min shows enrichment of m6A signal in SGs and P-bodies. SG marker G3BP1 and P-body marker DCP1A are detected using immunofluorescence and polyA signal is detected using FISH. Images are representative examples from three independent experiments. The bottom right panel shows box plots of the enrichment of m6A signal and polyA signal in SGs. The box plots show the median (middle lines), 25%-75% quartiles (boxes), and standard deviation (error bars). n =55 cells, from 3 independent experiments. P value was determined using unpaired Mann–Whitney U test, two-sided. b, c, Transcriptome-wide analysis of the fractions of mRNAs that are enriched in SGs (magenta), depleted in SGs (cyan), and neither enriched nor depleted in SGs (yellow), as a function of the m6A ratio for individual mRNAs that are longer than 3000 nt (b), or shorter than 3000 nt (c). The m6A ratio is defined as the percentage of transcripts that contain m6A. n = 9049 genes in total. d, Examples of smFISH images showing that the mRNA with a higher m6A ratio tends to have a higher degree of enrichment in SGs. smFISH signals (magenta) were overlaid with SG-marker G3BP1 (green) and P-body-marker DCP1A (blue). CDKN1A, which has a low m6A ratio, shows a relatively low degree of colocalization with G3BP1, whereas GPR75, which has a higher m6A ratio, shows a higher degree of colocalization with G3BP1. Cells treated with 0.5 mM NaAsO2 for 30 min to induce oxidative stress. Images are representative examples from three independent experiments. e, The fraction of mRNA localized in SG measured using smFISH versus the m6A ratio for individual mRNAs. Error bars represent mean ± SEM. n = 32 cells (RB1), 60 cells (PRPF8), 50 cells (CDKN1A), 70 cells (TFRC), 24 cells (EIF3A), 32 cells (EFR3A), 13 cells (SPTBN1), 87 cells (MCL1), 159 cells (FAT1), 43 cells (PANX1), 51 cells (GPR75), from 3 independent experiments each.
We then analyzed the relationship between the SG-enrichment of mRNAs determined by SG RNA sequencing28 and the m6A methylation ratio of mRNAs (defined as the fraction of transcripts that harbor m6A)29 for individual genes. We observed a positive correlation between m6A ratio and SG-enrichment and negative correlation between m6A ratio and SG-depletion for relatively long (>3000 nt) mRNAs (Fig. 1b). For relatively short (<3000 nt) mRNAs, few of them showed enrichment in SGs but the strong negative correlation between m6A ratio and SG-depletion maintained (Fig. 1c). We further validated the localization of various mRNAs of different m6A ratios in SGs using single-molecule fluorescent in-situ hybridization (smFISH)30,31, which also showed a higher tendency of SG-enrichment for mRNAs that are more heavily modified with m6A (Fig. 1d,e). We observed a similar trend for mRNA enrichment in other types of RNP granules, including heat-shock induced SGs32, ER-stress induced SGs32, and P-bodies33 (Supplementary Fig. 4). Taken together, our results indicate that a broad range of m6A-modified mRNAs are enriched in SGs.
m6A-binding YTHDF proteins are critical for SG formation.
We next examined the roles of m6A-binding YTHDF proteins in SG assembly. We observed strong colocalization of endogenous YTHDF1/3 proteins with SGs (Supplementary Fig. 5), but not with P-bodies, which are frequently found adjacent to SGs (Supplementary Fig. 6a–c). YTHDF2, instead, showed colocalization with both SGs (Supplementary Fig. 5) and P-bodies (Supplementary Fig. 6d). Notably, knockdown of either YTHDF1 or YTHDF3, but not YTHDF2, substantially reduced SG formation, as indicated by the fraction of G3BP1 signals in SGs and the number of SGs per cell in NaAsO2-treated cells (Fig. 2a,b and Supplementary Fig. 7). Double knockdown of YTHDF1 and YTHDF3 largely abolished the formation of SGs (Fig. 2a,b and Supplementary Fig. 7). The reduction in SG formation upon YTHDF1/3 knockdown was accompanied by a substantial reduction of both polyA and m6A signals in SGs (Fig. 2c).
Fig. 2 |. YTHDF proteins promote SG formation.
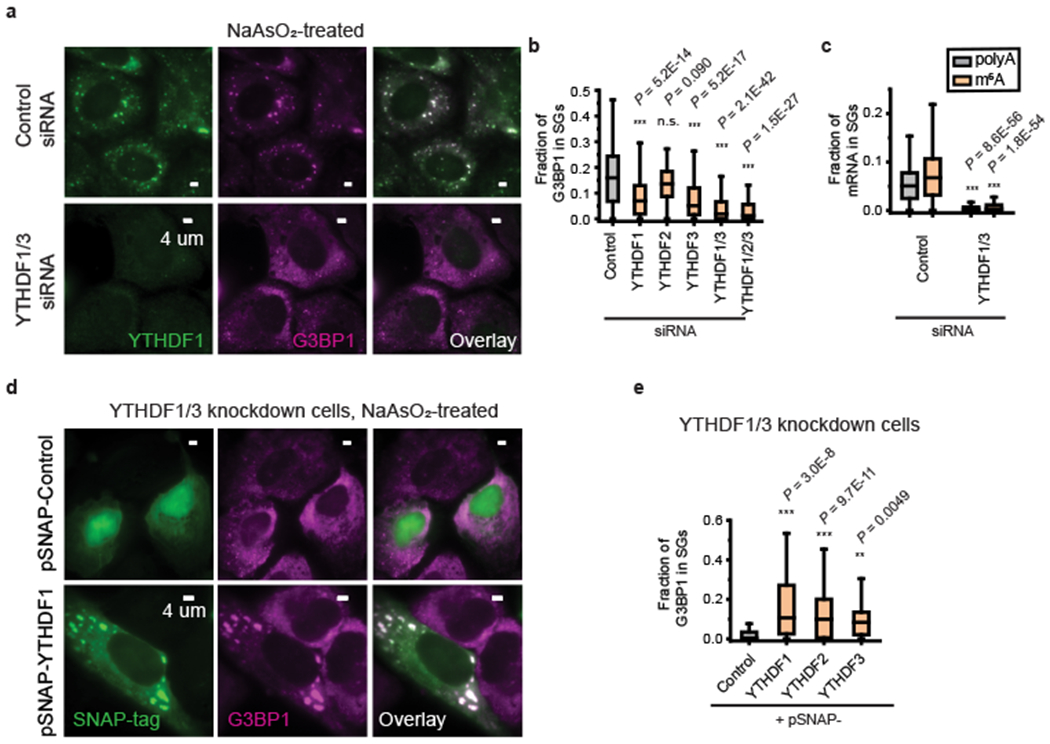
a, Two-color immunofluorescence images of YTHDF1 and G3BP1 show the disappearance of large SGs upon YTHDF1 and YTHDF3 double siRNA knockdown. The upper panels show the images for cells treated with control (scrambled) siRNA and the lower panels show the images of the YTHDF1/3 double knockdown cells. Images are representative examples from three independent experiments. b, Quantification of the fraction of G3BP1 in SGs for U-2 OS cells treated by control siRNA, single knockdown cells treated with YTHDF1, YTHDF2 or YTHDF3 siRNA, YTHDF1/3 double knockdown cells, and YTHDF1/2/3 triple knockdown cells. Oxidative stress in these cells was induced by 0.5 mM NaAsO2 treatment for 30 min. n = 234 cells (control siRNA), n = 242 cells (YTHDF1 siRNA), n = 111 cells (YTHDF2 siRNA), n = 204 cells (YTHDF3 siRNA), n = 357 cells (YTHDF1/3 siRNA), n = 118 (YTHDF1/2/3 siRNA), from 3 independent experiments each. c, Fraction of polyA (black) and m6A (orange) signals in SGs in cells treated with control siRNA as well as in YTHDF1/3 double knockdown cells. n = 256 cells (control siRNA), n = 203 cells (YTHDF1/3 siRNA), from 3 independent experiments each. d,e, Overexpression of full-length YTHDF1, YTHDF2, and YTHDF3 proteins rescues the SG formation in YTHDF1/3 knockdown cells. All constructs are tagged with SNAP at the C-terminal end. Overexpressed proteins were imaged using a fluorescent dye that labels the SNAP-tag. d, Two-color images of SNAP-tag, detected by dye molecules conjugated to SNAP, and G3BP1, detected by immunofluorescence, for cells expressing a control SNAP-tag plasmid that does not contain YTHDF (upper panels) and for cells expressing SNAP-YTHDF1 (lower panels). Cells were treated by 0.5 mM NaAsO2 for 25 min to induce oxidative stress. Images are representative examples from three independent experiments. e, Quantification of the fraction of G3BP1 in SGs for YTHDF1/3 double knockdown cells overexpressing the control SNAP-tag, and for YTHDF1/3 double knockdown cells overexpressing SNAP-YTHDF1, SNAP-YTHDF2 or SNAP-YTHDF3. n = 125 cells (Control), n = 46 cells (YTHDF1), n = 156 cells (YTHDF2), n = 12 cells (YTHDF3), from 3 independent experiments each. For b,c,e, the boxplots show the median (middle lines), 25%-75% quartiles (boxes), and Tukey-style whiskers extend to the most extreme datapoint within 1.5 × interquartile ranges (IQR) beyond the box. P values were determined by comparing with controls; Unpaired Mann–Whitney U test, two-sided.
To further confirm the effect of YTHDF proteins in SG formation, we overexpressed individual YTHDF proteins to compensate for the effect of YTHDF1/3 knockdown. Overexpression of YTHDF1/3 indeed restored SG formation (Fig. 2d,e and Supplementary Figs. 8, 9), and a higher YTHDF1 expression level correlates with a stronger SG formation (Supplementary Fig. 9e). Interestingly, although knocking down endogenous YTHDF2 did not show a substantial effect on SG formation (Fig. 2b and Supplementary Fig. 7d), overexpression of this protein also restored SG formation in YTHDF1/3 knockdown cells (Fig. 2e and Supplementary Fig. 9d), potentially because the effect of YTHDF2 is weak at the physiological concentration but substantial at elevated concentrations.
Both N-IDR and YTH domains are important for SG formation.
Many RNA-binding proteins in SGs possess intrinsically disordered regions (IDRs) and/or prion-like domains (PLDs), which can promote liquid-liquid phase separation or condensate formation34. We analyzed the amino acid sequences and secondary structures of YTHDF proteins (Fig. 3a and Supplementary Figs. 10, 11) using three algorithms (NetSurfP-2.0 for secondary structure prediction35, PLAAC (Prion-Like Amino Acid Composition) for PLD detection36, and PONDR-VSL2, Predictor of Natural Disordered Regions based on Various training data for Short and Long disordered sequences37). Secondary structure and disordered region predictions showed that while the C-terminal RNA-binding YTH domain contains defined structures, the remaining parts of YTHDF proteins are largely disordered (Fig. 3a and Supplementary Fig. 11). PLD analysis further identified a sub-region in the disordered region that has consistently high PLD scores and is Pro(P)/Gln(Q)-rich (Fig. 3a and Supplementary Fig. 11) – we referred to this region as the P/Q-PLD and the remaining (N-terminal) part of the disordered region as the N-IDR (Fig. 3a and Supplementary Fig. 11).
Fig. 3 |. Both the N-terminal intrinsically disordered region (N-IDR) and the C-terminal YTH domain are important for YTHDF’s role in promoting SG formation.
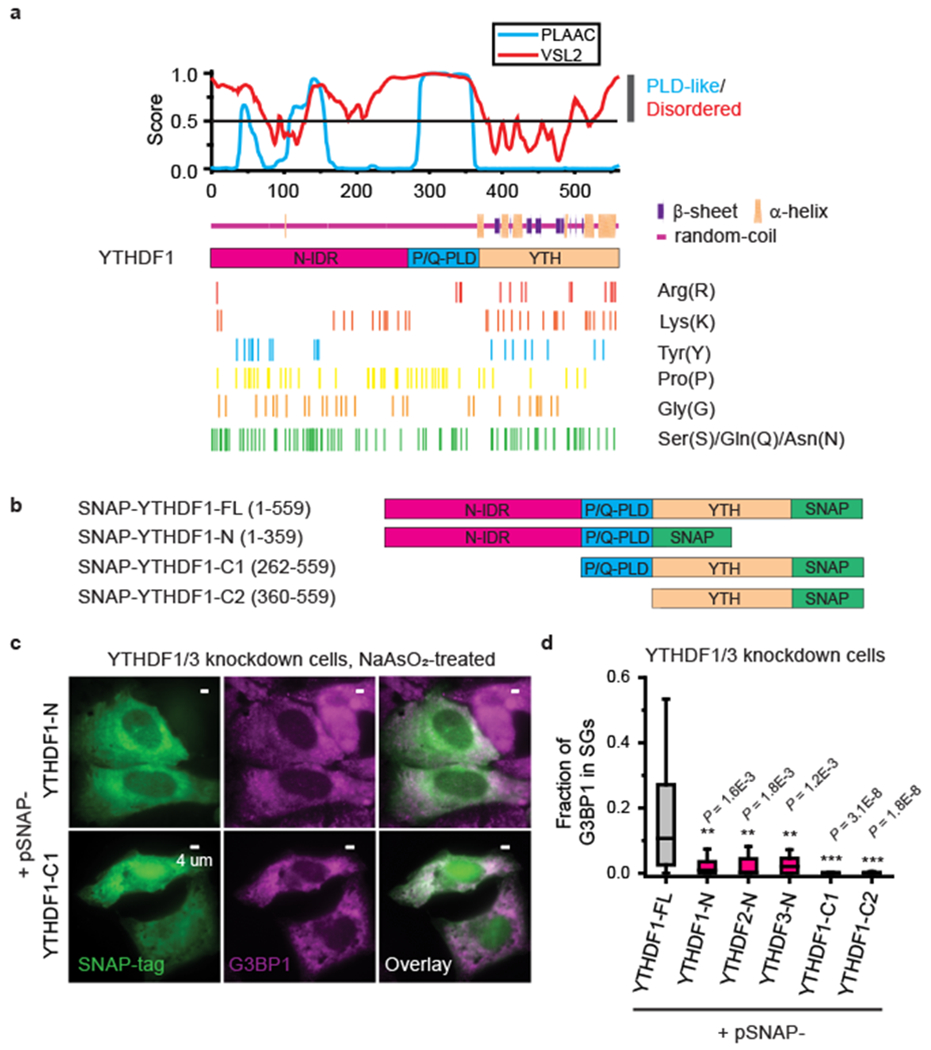
a, Amino acid composition and predictions of IDRs, prion-like domains (PLDs), and secondary structures in YTHDF1 protein. The likelihood scores for being disordered predicted by PONDR-VSL2 (red) and being PLD-like predicted by PLAAC (cyan) for each amino acid are plotted in the upper panel. The secondary structure prediction by NetSurfP-2.0 is shown immediately below the disordered and PLD-like likelihood scores. Locations for several conserved amino acids in all three YTHDF proteins that are important for IDR/PLD properties are marked. b, Differently truncated YTHDF1 constructs tagged with SNAP at the C-terminal end. c,d, Overexpression of different YTHDF protein fragments in YTHDF1/3 knockdown cells showing that truncated YTHDF constructs lacking the N-IDR or YTH domain cannot rescue SG-formation. c, Two-color images of SNAP-tag, detected by dye molecules conjugated to SNAP, and G3BP1, detected by immunofluorescence, for cells expressing a YTHDF1 fragment lacking the YTH domain (upper panels) or the N-IDR (lower panels). The cells are treated with 0.5 mM NaAsO2 for 25 min to induce oxidative stress. Images are representative examples from three independent experiments. d, Quantification of the fraction of G3BP1 in SGs for YTHDF1/3 double knockdown cells overexpressing the full-length YTHDF1 (black), or YTHDF1/3 double knockdown cells overexpressing YTHDF1/2/3 fragments lacking the C-terminal YTH domain (magenta), YTHDF1 fragment lacking the N-IDR, or YTHDF1 fragment lacking both N-IDR and P/Q-PLD (orange). The boxplots show the median (middle lines), 25%-75% quartiles (boxes), and Tukey-style whiskers extend to the most extreme datapoint within 1.5 × IQR beyond the box. P values were determined by comparing with full-length YTHDF1; Unpaired Mann–Whitney U test, two-sided. n = 46 cells (YTHDF1-FL), n = 14 cells (YTHDF1-N), n = 21 cells (YTHDF2-N), n = 19 cells (YTHDF3-N), n = 33 (YTHDF1-C1), n = 33 cells (YTHDF1-C2), from 3 independent experiments each.
Notably, whereas overexpressing full-length YTHDF proteins rescued SG formation in YTHDF1/3 knockdown cells (Fig. 2d,e and Supplementary Fig. 9d), overexpressing YTHDF fragments that miss either the N-IDR or the YTH domain did not rescue SG formation in YTHDF1/3 knockdown cells (Fig. 3b–d and Supplementary Fig. 12), indicating that both domains are important for the YTHDF’s role in promoting SG formation. Surprisingly, although some PLDs could promote protein aggregation34, only overexpressing a fragment that contained both the P/Q-PLD and the YTH domain also did not rescue SG formation in YTHDF1/3 knockdown cells (Fig. 3d and Supplementary Fig. 12d).
m6A-binding of YTHDF partially facilitate SG formation.
To test whether the interactions between YTHDF proteins and the m6A modification in RNAs are important for SG formation, we constructed a dominant-negative mutant of YTHDF1 that harbors a D401N mutation in the YTH domain (Fig. 4a). This mutation is known to increase the m6A binding affinity of YTH domain by 10-fold38 and therefore we expect overexpression of this mutant in cells to inhibit the m6A-binding of the endogenous YTHDF proteins. We further replaced the N-IDR in the mutant by a CRY2olig domain that can undergo blue-light-induced oligomerization39. Overexpression of this dominant-negative mutant in U-2 OS cells partially impaired the formation of SGs in NaAsO2-treated cells, when compared with overexpression of the control construct harboring only the CRY2olig region (Fig. 4b–d). These results suggest that the interactions between YTHDF proteins and m6A facilitate SG formation.
Fig. 4 |. Inhibiting m6A-binding of YTHDF proteins partially impairs SG formation.
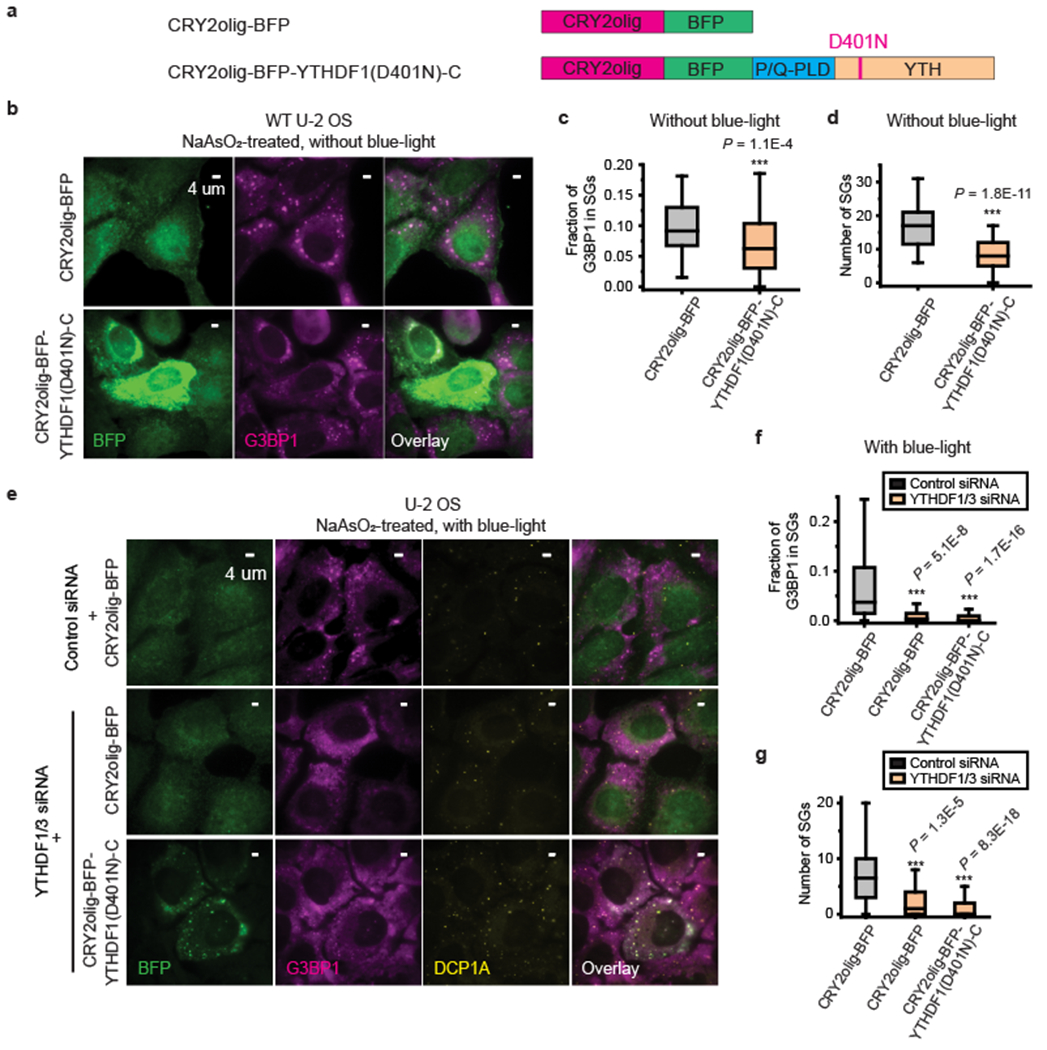
a, A construct that contains CRY2olig, a blue-light inducible oligomerization domain, and BFP (upper), and a construct that contains CRY2olig, BFP, and a mutated YTHDF1 fragment (YTHDF1(D401N)-C), which harbors a single amino acid mutation D401N in the RNA-binding YTH domains and lacks the N-IDR (lower). This mutation increases the m6A binding affinity of the YTH domain by 10-fold38. b, c, d, Formation of SGs is reduced in cells overexpressing construct containing the YTHDF1(D401N)-C mutant. b, Two-color images of BFP and G3BP1 for cells expressing a control plasmid that contains CRY2olig-BFP but does not contain the YTHDF1(D401N)-C mutant (upper panels) and for cells expressing CRY2olig-BFP-YTHDF1(D401N)-C (lower panels). Cells are treated with 0.5 mM NaAsO2 for 25 min to induce oxidative stress. Images are representative examples from three independent experiments. c, d, Quantification of the fraction of G3BP1 in SGs (c) and number of SGs per cell (d) for U-2 OS cells overexpressing CRY2olig-BFP and U-2 OS cells overexpressing CRY2olig-BFP-YTHDF1(D401N)-C. The cells were treated with 0.5 mM NaAsO2 for 25 min. n = 72 cells (CRY2olig-BFP), n = 62 cells (CRY2olig-BFP-YTHDF1(D401N)-C), from 3 independent experiments each. e, Light-induced oligomerization of YTHDF1(D401N)-C construct could not rescue SG formation in YTHDF1/3 double knockdown cells. Three-color images of BFP-tag, detected by immunofluorescence, G3BP1, detected by immunofluorescence, and DCP1A, detected by immunofluorescence, for U-2 OS cells treated by control siRNA with overexpression of CRY2olig-BFP (upper panels), by YTHDF1/3 siRNA with overexpression of CRY2olig-BFP (middle panels) and by YTHDF1/3 siRNA with overexpression of CRY2olig-BFP-YTHDF1(D401N)-C (lower panels). Although we observed slightly enriched G3BP1 signal colocalizing with BFP signals in cells treated with YTHDF1/3 siRNA and CRY2olig-BFP-YTHDF1(D401N)-C, they largely represent DCP1A-positive P-bodies. Images are representative examples from three independent experiments. f, g, Quantification of the fraction of G3BP1 in SGs (f) and number of SGs per cell (g) for YTHDF1/3 double knockdown U-2 OS cells overexpressing CRY2olig-BFP or CRY2olig-BFP-YTHDF1(D401N)-C construct (orange) shown in comparison with cells treated by control siRNA with overexpression of CRY2olig-BFP (black). The small fractions of G3BP1 that colocalize with DCP1A were included in the SG quantifications in f and g. The cells were treated with 0.5 mM NaAsO2 for 30 min and with three repeating cycles of 5 min blue-light-on and 5 min blue-light-off. n = 62 cells (control siRNA + CRY2olig-BFP), n = 37 cells (YTHDF1/3 siRNA + CRY2olig-BFP), n = 170 cells (YTHDF1/3 siRNA + CRY2olig-BFP-YTHDF1(D401N)-C), from 3 independent experiments each. For c,d,f,g, the boxplots show the median (middle lines), 25%-75% quartiles (boxes), and Tukey-style whiskers extend to the most extreme datapoint within 1.5 × IQR beyond the box. P values were determined by comparing with control siRNA + CRY2olig-BFP; Unpaired Mann-Whitney U test, two-sided.
We then induced the oligomerization of the CRY2olig-BFP-YTHDF1(D401N)-C construct using blue-light in unstressed cells (Supplementary Fig. 13) or NaAsO2-treated YTHDF1/3 knockdown cells (Fig. 4e–g). Although blue-light illumination caused clustering of this mutant protein, which colocalized with P-bodies marked by DCP1A, this clustering of CRY2olig-BFP-YTHDF1(D401N)-C construct did not induce SG formation in unstressed cells (Supplementary Fig. 13) nor did it rescue NaAsO2-induced SG formation in YTHDF1/3 knockdown cells (Fig. 4e–g), presumably because self-interaction of the N-terminal region of the m6A-bound YTHDF proteins is not sufficient for SG formation. This result is consistent with our observation that expression of the construct containing the P/Q-PLD and YTH domains, but missing the N-IDR, did not enhance SG formation in YTHDF1/3 knockdown cells. These results suggest the possibility that specific properties of the N-IDR, which may facilitate interactions of this region with other proteins or other regions of the YTHDF proteins, are important for SG formation.
Effects of YTHDF proteins on G3BP1 cluster formation.
To further understand how YTHDF proteins promote SG formation, we performed super-resolution STORM imaging40 of the endogenous G3BP1 protein in U-2 OS cells in the presence and absence of YTHDF1/3. The high-resolution of our images (~20 nm resolution) revealed that G3BP1 formed small clusters with size up to 200 nm in unstressed cells (Fig. 5a,b). Because of their small sizes and high density in cells, these G3BP1 clusters were not visible using diffraction-limited imaging. Upon the addition of NaAsO2 to induce oxidative stress, the sizes of G3BP1 clusters increased substantially, with some clusters reaching 600 nm in size (Fig. 5a,b). Knocking down of YTHDF1/3 substantially reduced the sizes of the G3BP1 clusters in NaAsO2-treated cells (Fig. 5a,b).
Fig. 5 |. YTHDF protein reduces the critical size and activation energy barrier for SG condensate formation.
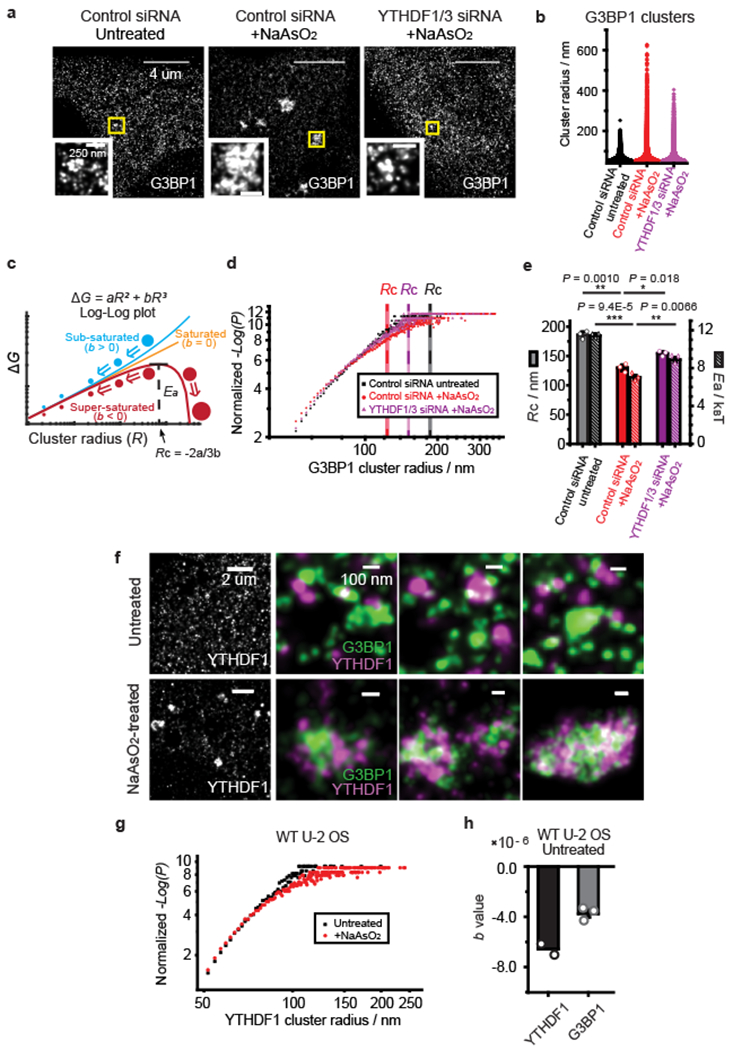
a, STORM imaging of G3BP1 protein in U-2 OS cells treated with control siRNA or YTHDF1/3 siRNA. The left panel shows an image of an unstressed cell treated by control siRNA, the middle panel shows an image of a NaAsO2-treated cell treated with control siRNA, and the right panel shows the image of a NaAsO2-treated, YTHDF1/3 knockdown cell. Insets are zoom-in images of regions in yellow boxes. Images are representative examples from three independent experiments. b, Distribution of cluster radius for G3BP1 protein under the three different conditions described in (a). More than 160000 clusters from ~60-80 cells from three independent experiments were pooled and analyzed for each condition. Counts of clusters with a radius larger than 50 nm are displayed. c, Diagram of Gibbs free energy change (ΔG) for cluster formation as a function of the cluster radius (R) for sub-saturated (b > 0), saturated (b = 0), and super-saturated (b < 0) states in the classical nucleation theory. ΔG contains two terms - a surface energy term and a bulk energy term: ΔG = aR2 + bR3. When molecules are in the super-saturated state, a critical radius (Rc = −2a/3b) exists, beyond which the cluster continues to grow in size irreversibly. Ea, the value of ΔG at Rc, represents the activation energy barrier for super-critical cluster (condensate) formation. d, Log-log plots of normalized −Log(P) vs. R calculated from the size distribution of G3BP1 clusters in unstressed cells (black), NaAsO2-treated cells (red) and NaAsO2-treated, YTHDF1/3 knockdown cells (magenta). P is the probability density of the clusters with radius R. In a steady-state system, P of sub-critical clusters (R < Rc) follow Boltzmann distribution: . Thus, B, where . By fitting the data of −Log(P) versus R to the equation of , we obtained the values of a, b, from which we calculated the corresponding Rc and Ea. The normalized values of −Log(P), which equal to −Log(P) − c and are equivalent to ΔG for sub-critical clusters, are plotted here. Data for clusters with radii between 50 nm and 350 nm are shown. The plot from one of the three independent experiments is shown here, and all three independent experiments show similar plots. Mean values of calculated critical radius Rc are shown as dashed lines with the shaded areas representing SEM for the 3 independent experiments. e, Rc and Ea for super-critical cluster formation of G3BP1 derived from the measured cluster size distributions for the three conditions. Mean ± SEM are shown (n = 3 independent experiments for each condition). P values were determined by unpaired two-tailed Student’s T-Test. f, Single-color STORM imaging of YTHDF1 and two-color STORM imaging of YTHDF1 and G3BP1 in unstressed (upper panel) and NaAsO2-treated cells (lower panels). YTHDF1 forms clusters, which often reside on the periphery of G3BP1 clusters or in between G3BP1 clusters in SGs. Images are representative examples from three independent experiments. g, Log-log plots of normalized −Log(P) vs. R calculated from the size distribution of YTHDF1 clusters in unstressed (black) and NaAsO2-treated cells (red). The plot from one of the two independent experiments is shown here, and all independent experiments show similar plots. h, The b values in ΔG for YTHDF1 (Mean, n = 2 independent experiments) and G3BP1 (Mean ± SEM, n = 3 independent experiments) clusters in unstressed U-2 OS cells. Dot plots of individual data points are overlaid on bar graphs. For all data in this figure, cells were treated with 0.5 mM NaAsO2 for 30 min to induce oxidative stress.
We then investigated the effect of YTHDF proteins on the formation of G3BP1 clusters in the framework of the classical nucleation theory for first-order phase transitions41,42. In this model, the Gibbs free energy change (ΔG) for the formation of clusters with a specific radius (R) contains two terms - a surface energy term and a bulk energy term: ΔG = aR2 + bR3 (Methods and Fig. 5c). Three states can be discriminated using this model (Fig. 5c): sub-saturated state (b > 0), saturated state (b = 0), and super-saturated state (b < 0). In the super-saturated state, clusters that fluctuate to a critical size Rc (i.e., clusters that reached the activation energy barrier height Ea) will continue to grow irreversibly and form super-critical clusters (Fig. 5c). Based on the distribution of G3BP1 cluster sizes measured by super-resolution imaging (Fig. 5d and Supplementary Fig. 14a–c), we obtained the ΔG values for different cluster sizes (R), which allowed us to derive the values of a and b, as well as the values of Ea, and Rc for the observed G3BP1 clusters. Interestingly, G3BP1 appeared to be in a super-saturated state with a negative value of b even in unstressed cells (Fig. 5d and Supplementary Fig. 14a), and NaAsO2-induced stress pushed G3BP1 into a deeper super-saturated state with a more negative b value (i.e. smaller Ea and Rc, Fig. 5e and Supplementary Fig. 14b). Notably, knockdown of YTHDF1/3 increased Rc and Ea (Fig. 5e and Supplementary Fig. 14c), which in turn manifested in a decrease in the cluster sizes of G3BP1.
Spatial relationship between YTHDF and G3BP1 in SGs.
Next, we performed STORM imaging on the endogenous YTHDF1 protein in U-2 OS cells. We observed that YTHDF1 also formed clusters in the unstressed condition (Fig. 5f,g) and two-color STORM imaging of YTHDF1 and G3BP1 showed that the YTHDF1 and G3BP1 clusters did not substantially colocalize in unstressed cells (Fig. 5f, upper panels). Notably, analysis of the size distribution of the YTHDF1 clusters showed that YTHDF1 protein also appeared to be in a super-saturated state with a negative b value in unstressed cells (Fig. 5g,h and Supplementary Fig. 14d).
Upon NaAsO2 treatment, the sizes of YTHDF1 clusters increased significantly (Fig. 5f,g) and many YTHDF1 clusters coalesced with G3BP1 clusters (Fig. 5f). Interestingly, YTHDF and G3BP1 proteins did not mix completely in SGs; instead, the YTHDF1 clusters often resided on the periphery of individual G3BP1 clusters and at the junction between neighboring G3BP1 clusters. YTHDF3 showed a similar distribution to YTHDF1, whereas YTHDF2 appeared to have a higher degree of colocalization with G3BP1 in SGs (Supplementary Fig. 15).
Previous studies showed that YTHDF1/3 interact with translation initiation factors and promote translation17, 20 and that small ribosome subunits are also enriched in SGs12. We observed that RPS10 (40S ribosomal protein S10) colocalized with SGs and were often found in the periphery of G3BP1 cores in SGs (Supplementary Fig. 16a, upper panels). YTHDF1 signals appeared to overlap with RPS10 at a moderately higher degree than that observed between G3BP1 and RPS10 in SGs (Supplementary Fig. 16). Our observations suggest the possibility that YTHDF1 may still associate with part of the translational machinery on the periphery of SG during stress, which can potentially poise the bound mRNA for translation re-initiation and help accelerate the translation recovery of m6A methylated mRNA after stress recovery, though future experiments are needed to further test this notion.
Discussion
In this study, we observed that m6A-modified mRNAs were enriched in SGs (Fig. 1), and the m6A-binding YTHDF proteins played an important role in SG formation (Fig. 2).
We showed that endogenous YTHDF1 and YTHDF3 were enriched in SGs but not P-bodies, while endogenous YTHDF2 was enriched in both SGs and P-bodies under oxidative stress (Supplementary Figs. 5 and 6). Knockdown of YTHDF1/3 strongly inhibited SG formation and localization of mRNAs to SGs, and re-introducing YTHDF proteins into the knockdown cells rescued SG formation (Fig. 2). Our results contrast a recent report that SG formation is not affected by YTHDF3 knockdown43. However, in this previous work, YTHDF1 knockdown or double-knockdown of YTHDF1/3 has not been performed, and SGs were imaged through the expression of GFP-labeled G3BP1 in cells43. Because overexpression of this SG core protein could artificially promote SG formation44, it is difficult to precisely evaluate the effect of YTHDF knockdown in this previously reported system given the varying degree of GFP-G3BP1 expression levels observed in the cell population43.
Notably, we found both the N-terminal IDR and C-terminal m6A-binding YTH domains to be important for promoting SG formation (Fig. 3). Although a recent study showed that P/Q-PLD in YTHDF proteins can phase-separation in vitro45, we found it was not sufficient for the function of YTHDF proteins in SG formation. Our observation that light-induced clustering of YTH domain did not rescue SG formation in YTHDF1/3 knockdown cells suggests that specific properties of the N-terminal IDR of YTHDF proteins may be important for promoting SG formation. The N-terminal IDR of the YTHDF proteins are Tyr(Y)-rich, and Arg(R)-deficient. These Tyr(Y) residues could potentially interact with the Arg(R) residues in the YTH domain through π-cation interaction46 to promote the clustering of YTHDF proteins. The Tyr(Y) residues in the N-terminal IDR of YTHDF proteins may also mediate interactions with other SG-components that are Arg(R)-rich, such as eIF3A, ribosome components, or other RNA-binding proteins17. Interestingly, the center PLDs of the YTHDF proteins are Pro(P)/Gln(Q)-rich, but Gly(G)-poor, which makes this region relatively rigid46. This rigid linker between the N-terminal IDR and C-terminal YTH domain could potentially serve to prevent intramolecular π-cation interactions, and thus promote intermolecular interactions among YTHDF proteins, as well as between YTHDF and other SG proteins, thereby promoting the formation of protein condensates. The m6A-binding activity of YTHDF proteins also appeared to be helpful for SG formation (Fig. 4), which is supported by the recent biochemical evidence that m6A-YTHDF interaction enhances the phase-separation of RNA and YTHDF proteins45,47,48.
Furthermore, using super-resolution imaging, we found that both YTHDF1 and G3BP1 appeared to be in the super-saturated state in cells even in unstressed conditions (Fig. 5). The super-saturated state of G3BP1 and YTHDF1 makes them ready to form super-critical clusters, which could help facilitate a sensitive response to environmental changes. However, according to the Szilard model of non-equilibrium steady-state super-saturation42, super-critical clusters need to be constantly removed to maintain a steady-state in unstressed conditions, which could be mediated through autophagy49 or protein-RNA disaggregases12. Notably, YTHDF1/3 appeared to reduce the activation energy barrier for super-critical cluster formation of the G3BP1 (Fig. 5). Interestingly, YTHDF clusters tended to reside on the periphery of G3BP1 clusters and at the junctions between G3BP1 clusters (Fig. 5), which could potentially promote SG formation by connecting small G3BP1 core clusters into larger granules. It has been proposed that SGs adopt a heterogeneous structure formed by initial nucleation of the G3BP-rich cores followed by juxtaposition of the nucleated cores, potentially through a more dynamic shell12,50, but the identity of the SG shell protein(s) remains elusive. Our results suggest the possibility that YTHDF proteins may function as SG-shell proteins that promote SG formation by bringing together multiple SG-core clusters to form large granules.
Methods
Cell lines
U-2 OS cells (ATCC, HTB-96™), U-2 OS-METTL3 knockout cells (gift from Yang Shi Lab, Harvard Medical School) were grown at 37 °C and 5% CO2 in EMEM medium supplemented with 100 U/mL streptomycin, 100 ug/mL penicillin and 10% fetal bovine serum. Cell medium was changed 24 hr before NaAsO2 treatment. All imaging experiments were performed on cells plated on 20 mm coverslips in 12-well tissue culture plates, with density ranging from 8 × 10⁴ cells/well to 1.6 × 10⁴ cells/well depending on different treatment procedures.
Antibodies
All fluorescent-dye-conjugated primary antibodies were labeled using Succinimidyl (NHS) esters following manufacture’s protocols and stored in PBS with 40% glycerol at −80 °C. For two-color STORM imaging, primary antibodies were labeled using CF®680 Succinimidyl esters (Biotium, 92139) or AlexaFluor 647-NHS esters (ThermoFisher, A37573). Mouse monoclonal anti-Digoxigenin antibody (Abcam, Ab420) was labeled using CF®750 Dye Succinimidyl Ester (Biotium, 92142). The following antibodies were used in this study: Rabbit polyclonal anti-m6A antibody (Abcam, ab151230); Rabbit polyclonal anti-m6A antibody, Alexa Fluor® 647-conjugated (labeled using ab151230, 1:4 labeling ratio); Rabbit polyclonal anti-m6A antibody (BioVision, 6653-100); Rabbit polyclonal anti-m6A antibody, Alexa Fluor® 647-conjugated (labeled using 6653-100, 1:2.5 labeling ratio); Rabbit monoclonal anti-G3BP antibody, Alexa Fluor® 647 conjugated (Abcam, ab215944); Rabbit monoclonal anti-G3BP antibody, Alexa Fluor® 555 conjugated (Abcam, ab217729); Rabbit monoclonal anti-G3BP antibody, Alexa Fluor® 488 conjugated (Abcam, ab214946); Mouse monoclonal anti-G3BP Antibody (Abcam, ab56574); Mouse monoclonal anti-G3BP Antibody, CF®680 conjugated (labeled using ab56574, 1:5 labeling ratio); Rabbit monoclonal anti-DCP1A antibody, Alexa Fluor® 488 conjugated (Abcam, ab208275); Mouse monoclonal rRNA Antibody (Y10b), Alexa Fluor® 488 conjugated (Novus Biologicals, NB100-662AF488); Mouse monoclonal anti-Digoxigenin antibody CF750 conjugated (labeled using Abcam, Ab420, 1:5 labeling ratio); Rabbit polyclonal anti Tag-RFP (Tag-BFP) Antibody (ThermoFisher, R10367); Rabbit polyclonal anti- Tag-RFP (Tag-BFP) Antibody, CF®750 conjugated (labeled using R10367, 1:2 labeling ratio); Rabbit Polyclonal anti-YTHDF1 Antibody (Proteintech, 17479-1-AP); Rabbit polyclonal anti-YTHDF1 Antibody CF®680 conjugated (labeled using 17479-1-AP, 1:5 labeling ratio); Rabbit monoclonal anti-YTHDF2 antibody (Abcam, ab245129); Rabbit monoclonal Anti-YTHDF2 antibody CF®680 conjugated (labeled using ab245129, 1:6 labeling ratio); Rabbit polyclonal anti-YTHDF3 Antibody (Proteintech, 25537-1-AP); Rabbit polyclonal anti-YTHDF3 Antibody CF®680 conjugated (labeled using 25537-1-AP, 1:5 labeling ratio); Rabbit polyclonal anti-YTHDF3 Antibody CF®750 conjugated (labeled using 25537-1-AP, 1:3 labeling ratio); Recombinant Anti-RPS10 antibody [EPR8545] (Alexa Fluor® 647) (Abcam, ab225202); Alexa Fluor® 647 conjugated Goat anti-Rabbit IgG (H+L) secondary antibodies (ThermoFisher, A-21245); Rabbit polyclonal anti-SNAP-tag® antibody (NEB, P9310S); Recombinant anti-Vinculin antibody [EPR8185] (Abcam, ab129002); Recombinant Anti-GAPDH antibody [EPR16891] (Abcam, ab181602).
Cloning and LentiVirus production
YTHDF protein constructs were cloned into pSNAPf vectors (New England BioLabs, N9183S) between AscI and EcoRI restriction enzyme cutting sites using the standard cloning method. SNAP-tag was at the C-terminus of the construct. Plasmid constructs name and sequences are as following: pSNAPf-YTHDF1 (CCDS ID: CCDS13511.1), pSNAPf-YTHDF2 (CCDS41296.1), pSNAPf-YTHDF3 (CCDS75747.1), pSNAPf-YTHDF1-N (1-359 from CCDS13511.1), pSNAPf-YTHDF2-N (1-381 from CCDS41296.1), pSNAPf-YTHDF3-N (1-385 from CCDS75747.1), pSNAPf-YTHDF1-C1 (262-559 from CCDS13511.1), pSNAPf-YTHDF1-C2 (360-559 from CCDS13511.1).
For the CRY2olig-BFP plasmid, CRY2olig sequence from plasmid CRY2olig-mCherry (Addgene, 60032) was cloned into pFUGW together with a TagBFP sequence using Gibson assembly. A YTHDF1 fragment (264-559 from CCDS13511.1) with D401N mutation was then cloned into the CRY2olig-BFP plasmid to yield CRY2olig-BFP-YTHDF1(D401N)-C. The plasmids were then packed into lentivirus using the Lenti-X™ Packaging Single Shots (VSV-G) transfection kit (Clontech, 631276) in a Lenti293T cell line.
Knockdown and overexpression of YTHDF proteins
Transfection of siRNA, and co-transfection of siRNA and plasmids containing YTHDF proteins were performed using Lipofectamine 3000 (ThermoFisher, L3000008) according to the manufacturer’s protocol. The siRNAs we used here for YTHDF1/3 target 5’- or 3’-UTR regions of mRNAs and do not target the mRNA transcripts from transfected plasmids. siRNA used here are: YTHDF1 siRNA (Qiagen, SI00764715), YTHDF2 siRNA (Qiagen, SI04174534), YTHDF3 siRNA (Qiagen, SI00764778), AllStars Negative Control siRNA (Qiagen, SI03650318). SNAP-tagged YTHDF proteins were labeled using SNAP-Cell® TMR-Star (New England BioLabs, S9105) after cell fixation and permeabilization according to the manufacturer’s procedure, followed by immunofluorescence staining using dye-conjugated primary antibodies, including anti-tagBFP, anti-G3BP, anti-DCP1A, anti-YTHDF1, anti-YTHDF2, and anti-YTHDF3 antibodies.
Induction of oligomerization of CRY2olig constructs in cells
After cells were infected by Lenti-virus containing CRY2olig-BFP-YTHDF1(D401N)-C construct for 48 hours, oligomerization of CRY2olig in cells was induced by exposing cells to a Maestrogen 470 nm UltraBright LED Transilluminator for 2 min at room temperature. Cells were subsequently fixed to perform immunofluorescence staining. For induction of oligomerization of Cry2Olig constructs in YTHDF1/3 knockdown cells, siRNA knockdown was performed, and cells were infected by Lenti-virus simultaneously. After 48 hours, cells were treated with 0.5 mM of NaAsO2, for 30 minutes and exposed to the 470 nm UltraBright LED transilluminator for 5 min on and 5 min off cycle for three times during this 30-minute NaAsO2,treatment time, before cells were fixed to perform immunofluorescence staining using dye-conjugated anti-G3BP1, anti-DCP1A, and anti-TagRFP/TagBFP antibodies.
Simultaneous polyA FISH and m6A immunofluorescence staining
We used methanol (MeOH) fixation to retain large RNAs, including mRNAs and rRNAs, but not small RNAs like tRNA and snRNA, which require strong covalent (such as aldehyde-based) fixation to be preserved in cells51. 3D structures of ribosomes showed that m6A in both 18S and 28S rRNA reside inside well-folded rRNA structures52,53. Although MeOH denatures rRNA and exposes the m6A site in rRNA, we included a refolding step to refold rRNAs and prevent the binding of rRNA m6A by the anti-m6A antibodies. Meanwhile, although anti-m6A antibody can also recognize m6A in long non-coding RNA (lncRNA) and N6-2-O-dimethyladenosine (m6Am) in the 5’ of mRNA, the amount of m6A in lncRNA and the amount of m6Am are less than 5% of total m6A in mRNA29. Thus, our m6A-immunostaining protocol primarily detects mRNA m6A in mammalian cells.
Cells were grown on 20 mm coverslips in 12-well tissue culture plates. The cells were washed once with 1 mL of PBS and fixed and permeabilized with 1 mL of MeOH at −20 °C for 8-10 min. After withdrawing MeOH, cells were dried completely under air for 5-10 min and equilibrated in 1 mL of Stellaris® RNA FISH Wash Buffer A (LGC Biosearch Technologies, SMF-WA1-60) containing 10% formamide for 5 min. RNA FISH hybridization solution was prepared using 1 uM of DIG-polydT-LNA probe (Sequence: /5DigN/T+TT+TT+TT+TT+TT+TT+TT form IDT, +T represents LNA form of T) in Stellaris® RNA FISH Hybridization Buffer (LGC Biosearch Technologies, SMF-HB1-10) containing 10% formamide. The coverslips were flipped to cover 30 uL of RNA FISH hybridization solution on a parafilm placed in a clean 15 cm cell culture dish with a cover, and then incubated in a humidified 37 °C incubator overnight. The next day, coverslips were washed in a 12-well plate with 1 mL of Stellaris® RNA FISH Wash Buffer A containing 10% formamide twice for 30 min each at 37 °C. The prepared Wash Buffer was stored at 4 °C and added to the coverslips directly before incubation at 37 °C, this step helps to eliminate the staining of rRNA. Coverslips were then washed and equilibrated three times with 1 mL of PBS at room temperature for 5 min each. Blocking solution was prepared as the following: 1× PBS, 2% UltrapureBSA (ThermoFisher, AM2616), 0.05% Triton-X100 (Sigma-Aldrich, T9284), 1:100 RNasin® plus (Promega, N2611) in RNase-free H2O. The coverslip was blocked for 1 hr at room temperature with 15 uL of blocking solution on parafilm in a plate with wet Kimwipes on the side to prevent solution evaporation. Meanwhile, antibody solution was prepared by adding the following antibodies to 20 uL of block solution: CF750 conjugated anti-Digoxigenin antibody (1:50 dilution from 0.5 mg/mL stock), Alexa Fluor® 647 conjugated anti-m6A antibody (1:30 dilution from 0.4 mg/mL stock), Alexa Fluor® 555 conjugated anti-G3BP antibody (1:200 dilution from 0.5 mg/mL stock), Alexa Fluor® 488 conjugated anti-DCP1A antibody (1:200 dilution from 0.5 mg/mL stock) and/or Alexa Fluor® 488 conjugated anti-rRNA antibody (1:100 from 0.5 mg/mL stock). The coverslips were lifted from parafilm after the 1 hr blocking, and 20 uL of the antibody solution was added before the coverslips were put back to cover the solution. The incubation was performed overnight at 4 °C in the dark. The next day, coverslips were washed in a 12-well plate with 0.05% Triton-X100 in PBS for 4 times with 4 min each. Finally, coverslips were fixed with a 3% Glyoxal fixation solution54 for 30 min at room temperature and washed for 3 times using PBS. The ~4 ml glyoxal fixation solution contained 2.835 ml ddH2O, 0.789 ml ethanol (absolute, for analysis), 0.313 ml glyoxal (40% stock solution), 0.03 ml acetic acid, and adjust to pH 5 with 5M NaOH.
Simultaneous mRNA smFISH and immunofluorescence staining
For simultaneous mRNA smFISH and immunofluorescence staining, cells were first fixed with 4% Paraformaldehyde in PBS for 5 min, and then permeabilized with MeOH at −20 °C for 8-10 min, dried and equilibrated with Stellaris® RNA FISH Wash Buffer A containing 30% formamide. 0.5 uM of RNA smFISH probes with 30 nt hybridization region and a 20 nt readout sequence were used in the Stellaris® RNA FISH Hybridization Buffer with 30% formamide. After wash, coverslips were further hybridized to fluorophore-labeled readout probes (/5Alexa750N/ACACTACCACCATTTCCTAT or /5ATTO565N/ACCACAACCCATTCCTTTCA, IDT), complementary to the readout sequences on the smFISH probes, and washed twice with Stellaris® RNA FISH Wash Buffer A containing 10% formamide for 30 min at 37 °C. Coverslips were then washed and equilibrated three times with 1 mL of PBS at room temperature for 5 min each. Blocking solution was prepared as the following: 1× PBS, 2% UltrapureBSA (ThermoFisher, AM2616), 0.05% Triton-X100 (Sigma-Aldrich, T9284), 1:100 RNasin® plus (Promega, N2611) in RNase-free H2O. Cells were blocked for 1 hr at room temperature with 15 uL of blocking solution on parafilm in a plate with wet Kimwipes on the side to prevent solution evaporation. Meanwhile, antibody solution was prepared by adding the following antibodies to 20 uL of block solution: Alexa Fluor® 555 conjugated anti-G3BP antibody (1:200 dilution from 0.5 mg/mL stock), and Alexa Fluor® 488 conjugated anti-DCP1A antibody (1:200 dilution from 0.5 mg/mL stock). The incubation was performed overnight at 4 °C in the dark. The next day, coverslips were washed with 0.05% Triton-X100 in PBS for 4 times with 10-15 min each. Finally, coverslips were fixed with 4% Paraformaldehyde in PBS for 30 min at room temperature and washed for 3 times using PBS.
Western blot assay
For immunoblotting of YTHDF1, YTHDF2, YTHDF3, GAPDH, VINCULIN, and SNAP-tagged YTHDF constructs, cells were lysed in RIPA buffer containing 25mM Tris-HCl (pH 7.6), 150mM NaCl, 1% NP-40, 1% sodium deoxycholate, 0.1% SDS buffer (Thermo Fisher Scientific, 89900) complemented with 1× protease and phosphatase inhibitor cocktail (Thermo Fisher Scientific, 78440). Following centrifugation, the supernatants were collected and denatured at 95 °C for 5 min. The cell lysates were run on 4-15% gradient SDS-PAGE gels (Bio-rad, 4561086) at 120 V for 60 min, transferred to polyvinylidene difluoride (PVDF) membranes (Thermo Fisher Scientific, LC2005) at 55 V for 45 min, immunoblotted using Pierce™ Fast Western Kit, SuperSignal™ West Pico, Rabbit (Thermo Fisher Scientific, 35066) according to the manufacturer’s instructions, and visualized using Sapphire Biomolecular Imager (Azure Biosystems, Model: SapphireRGBNIR). The blots were cut into two separate parts to probe the protein of interest and loading control from the same gel: cut at 50 kD to probe for YTHDF proteins and GAPDH (loading control), and cut at 100 kD to probe for SNAP-tagged YTHDF constructs and VINCULIN (loading control). All western blots were performed with two biologically independent replicates which showed similar results. All uncropped Western blots were included in Supplementary Fig. 17.
Two-color immunofluorescence staining for STORM imaging
Cells on 20 mm coverslip were fixed with 3% Glyoxal fixation solution54 for 15 min at 4 °C and 15 min at room temperature. Cells were then quenched with 50 mM of NH4Cl for 20 min at room temperature, and permeabilized with 0.5% (v/v) Triton X-100 in PBS for 4 min. Cells were then blocked with 3% BSA in PBS, and inverted on a parafilm with solutions containing with Alexa Fluor® 647 conjugated anti-G3BP1 antibody (1:30 dilution from 0.5 mg/mL solution) and CF680-conjugated anti-YTHDF1 antibody (1:30 dilution from 0.5 mg/mL solution) in 30 uL of 3% BSA in PBS at 4 °C overnight. The cells were then washed 4 times with 0.05% Triton-X100 in PBS for 10 min each. Cells were post-fixed with 4% Parafomaldehyde + 0.1% Glutaraldehyde in PBS for 30 min at room temperature, washed 3 times with PBS, and stored in PBS at 4 °C before STORM analysis.
STORM imaging procedure
For STORM imaging, we used a custom-built microscope with an Olympus IX-71 inverted microscope body, a UPlanSApo 100× N.A. 1.40, oil-immersion objective (Olympus), and an active auto-focusing system consisting of an infrared 830 nm laser (LPS-830-FC, Thorlabs) and a quadrant photodiode as described previously55. A 640-nm laser (Coherent) was used to excite and image Alexa Fluor® 647 (AF647) and CF680 on the antibodies. And a 405 nm laser (CUBE 405-50C, Coherent) was used to activate the fluorophores. The lasers were directed to the sample using a dichroic mirror (ZET405/488/561/640mv2, chroma) on the excitation path. For two-color imaging of AF647 and CF680, on the emission path, we used a Dual-View setup (DV-CC, Dual-view, Photometrics) with a 685-nm long-pass dichroic mirror (Chroma, T685lpxr) to separate the emission wavelengths and projected the emission photons to two separated regions on EMCCD camera. The two Dual-View channels were aligned by taking calibration images of 100-nm Tetraspeck beads (Invitrogen) attached to a coverslip surface. Illumination was adjusted to near-total internal reflection fluorescence configurations.
Cells on a 12 mm coverslip were assembled on a cover-slide and sealed in imaging buffer. The imaging buffer contains 200 mM cysteamine (Sigma), 5% glucose (Sigma), 0.8 mg/mL glucose oxidase (Sigma), and 40 μg/mL catalase (Roche Applied Science). During imaging, 640-nm laser (∼2 kW/cm2) was used to excite AF647 and CF680 to switch them into the dark state. A 405-nm laser was used to reactivate the fluorophores to the emitting state. The power of the 405-nm lasers (0 – 1 W/cm2) was adjusted during image acquisition so that at any given instant, only a small, optically resolvable fraction of the fluorophores in the sample was in the emitting state.
Analysis of correlation between SG enrichment and m6A ratio
For individual mRNA species, m6A ratios only change slightly between cell types (most changes are less than 20%)29, and NaAsO2 treatment does not affect the methylation of mRNA that are methylated in CDS or 3’-UTR in U-2 OS cells43. We also found that NaAsO2-treatment does not change the overall m6A level in mRNA as measured by UHPLC-QQQ-MS/MS. Thus, we performed the correlation analysis using the available mRNA m6A ratio data from two human cell lines29, and combined them with the available datasets for mRNA enrichment in NaAsO2-induced SGs28, mRNA enrichments in other types of SGs32 and mRNA enrichment in P-bodies in U-2 OS cells33. All mRNA with available m6A ratios and with FPKM (Fragments Per Kilobase of transcript per Million mapped reads) > 50 from U-2 OS mRNA sequencing data were analyzed here. To mitigate the effect of mRNA length, which can influence SG enrichment, we separated mRNAs into two categories: long mRNA (longer than 3000 nucleotides (nt) in total mRNA length), and short mRNA (shorter than 3000 nt). We then quantified the fractions of mRNA that are enriched in (> 2-fold enrichment in SGs or P-bodies), depleted from (< 0.5-fold enrichment), or neither enriched in nor depleted from (between 0.5- and 2-fold or statistically insignificant) SGs (or P-bodies) within different ranges of m6A ratios.
Quantification of SG numbers per cell and fraction of G3BP1 in SGs
G3BP1 immunofluorescence images were analyzed using a custom MATLab script. Cells were manually segmented. After background subtraction, edges in SG images were identified by MATLab’s edge detection algorithm. A universal edge detection threshold was used for a group of SG images collected under the same laser intensity. Areas within any closed edges were then filled to yield binarized images. Particles with an area larger than 10 pixels were then identified as SGs. The fraction of G3BP1 in SGs was calculated by dividing the sum of G3BP1 immunofluorescence intensity within identified SGs by the sum of G3BP1 immunofluorescence intensity within the specific cell.
Quantification of m6A and polyA immunofluorescence signal in SG
Fluorescence images were analyzed using a custom MATLab script. After background subtraction, SG analysis was performed on G3BP1 image as described in the previous section to create the mask for the SG/non-SG region. Segmentation of individual cells and nucleus was then performed manually based on the polyA RNA staining signals. After subtracting the background, images of polyA and m6A were quantified using the masks for SG/non-SG regions in the cytoplasm region of individual cells. Enrichment ratios of polyA and m6A signals in SG were determined based on the average intensities of polyA and m6A in the SG and non-SG regions in the cytoplasm.
Data analysis for STORM imaging
For single-color STORM, STORM movie was analyzed using a custom Insight3 software as previously described56. Briefly, fluorescence peaks of individual molecules were identified and fit to a 2D Gaussian to determine each peak’s centroid position (x, y) and intensity. Sample drift during acquisition was subtracted. The resulting localizations were collected in a single molecule list file for further analysis.
For two-color STORM of AF647 and CF680, STORM movies were collected in two separate areas of the camera (256 × 256 pixels each) corresponding to two-color channels (>685 nm and <685 nm in wavelength), and analyzed using the above-described procedure to give a list of single-molecule localizations for each channel. AF647 signals appear in both channels, and CF680 signals only appear in the > 685 nm channel. The signals from > 685 nm channel were assigned to AF647 or CF680 using the following procedure: The localization positions from two channels were first aligned based on the Tetraspeck bead signals using MATLab’s cp2tform function with the ‘projection’ parameter. We then identified corresponding localizations from both channels within 1 pixel in the middle 5000 frames, and use them to further align the entire molecule list using MATLab’s cp2tform function using ‘polynomial’ parameter. After the alignment, for each localization in > 685 nm channel, we search whether there is a corresponding localization in the <685 nm channel within 1 pixel, if so, the localization is assigned to be correspondent to AF647. Otherwise, it is assigned to CF680. To further correct for any misassignment of CF680 molecules, which happens when a single-molecule signal on the <685 nm channel was not identified correctly mostly due to the overlap with an adjacent single-molecule signal, we also read the intensity of the corresponding pixels in the original movie and calculate the intensity ratios from two channels. Localizations with (I1-I2)/(I1+I2) < 0.5 were discarded, and only those with this value > 0.5 are kept as CF680 signals (I1: intensity in > 685 nm channel, I2: intensity in < 685 nm channel). Localizations from < 685 nm channel were automatically assigned to AF647 and analyzed together with the localizations that were assigned to AF647 from > 685 nm channel. Any misalignment can be identified from pattern mismatch of AF647 in these two categories of molecules.
Imaging resolutions are 22 nm for AF647 and 26 nm for CF680, as determined by the full-width-at-half-maximum of the localization distributions from all clusters in unstressed cells. Crosstalk ratios between two channels were determined to be less than 0.2% from AF647 to CF680, and 0.002% (20 ppm) from CF680 to AF647, which were determined by imaging samples labeled with AF647- or CF680- labeled antibodies separately.
Cluster analysis from single-molecule localization data
A custom MATLAB script was developed to analyze the area of individual clusters. The localizations calculated from STORM movie were rendered into 2D-images by calculating the histogram with a 2D-bin of 15 nm by 15 nm. Particle analysis was performed to determine the area of individual clusters using a MATLab thresholding function ‘graythresh’57, followed by functions of ‘imbinarize’, ‘bwlabel’, and ‘regionprops’. Areas of all clusters were calculated. Typically 3000 clusters can be identified from each cell.
Classical nucleation model
Gibbs free energy change for cluster formation of clusters at a certain size (diameter R) is described by the equation: . In this equation, γ is the surface tension of clusters, ρ is the density of molecules inside clusters, is the chemical-potential difference between molecules in the solution phase and in the cluster phase, in which csol is the solution concentration of molecules, and csat is the saturation concentration of molecules 42,58–60. We abbreviate the equation as . In a steady-state system, the distribution probabilities of sub-critical clusters follow Boltzmann distribution: , thus, in the unit of kBT, and , where 42. When molecules are in the super-saturated state, a critical radius () exists at . The activation free energy barrier Ea was calculated from at Rc: Ea = aRc2 + bRc3 + c.
Data fitting for classical nucleation theory model
A group of 10-25 cells were pooled for analysis from a single experiment. Cluster volumes were calculated from the cluster area values by assuming sphere shape for individual clusters. Clusters volumes were binned with a bin size of 1 × 10⁵ nm3 from 523,099 nm3 to 179,594,380 nm3, corresponding to cluster radii from 50 nm to 350 nm. The frequency of cluster on each bin was calculated as P. −LogP (natural log of P) was plotted against the median radius R for the corresponding bin, which was calculated using the median volume of the corresponding bin. Parameters a, b, and c were determined by fitting a function −LogP = aR2 + bR3 + c to the data points using MATLab’s cftool function to ‘poly3’ with the parameter limit of R1 set to 0. To avoid hitting the noise floor, we first found the 10th empty bin in the histogram (one bin is equivalent to around 0.4 nm difference in R at around 140 nm), and excluded all data points with cluster sizes larger than that. Furthermore, if there are three consecutive empty bins within the first 10 empty bins, we excluded all data points larger than those as well. Rc was calculated by Rc = 2a/3b, since only data points with a value less than Rc should be used for the fitting, the fitting was iterated with subsets of data that eliminate data points with R larger than 0.8 × Rc, until Rc converges between two iterative rounds of fitting (i.e. the calculated Rc is larger than 1.25× the largest R in the data used for fitting). Fitted values of a, b, c, 95% confidence intervals, and p-values for a, b, c to be different from zero were reported. The values of Rc = 2a/3b and Ea = aRc2 + bRc3 + c were also reported. Their mean value and S.E.M. were calculated based on data fitting from three independent experiments. An overall adjusted R2 and p-value for the reduced χ2 statistic between data and fit curve were also calculated. The reported p-value here represents the very small probability that the fitted curve is different from the data.
Calculating the overlapping ratio between two molecules for two-color STORM imaging
Regions of individual SGs were first automatically segmented and identified based on the rendered STORM images of G3BP1 or YTHDF1. The single-molecule lists for individual SGs were saved as individual molecule list files. The single molecules from each color channel were rendered, background-subtracted and binarized using MATLab’s “graythresh” function. The overlapping ratios between two color channels were calculated by dividing the area of overlap regions by the total area of the individual protein of interest.
Supplementary Material
Acknowledgments
We thank members of Zhuang Lab for the kind help, especially R. Zhou and B. Han for help with two-color STORM setup and data analysis, G. Wang and M. Thanawala for help with data analysis. We thank K. Xu for help with the script for two-color STORM data analysis. We thank P. Anderson and N. Kedersha for helpful discussions, and Y. Shi (Harvard Medical School) for providing U-2 OS-METTL3-KO cell line. This work is in part supported by NIH (to X.Z.). X.Z. is an HHMI investigator.
Footnotes
Competing interests The authors declare no competing interests.
Reporting Summary
Further information on research design is available in the Nature Research Reporting Summary linked to this article.
Data availability
The data that support the findings of this study are available from the corresponding author upon reasonable request.
Code availability
Custom Python and MATLab codes for image acquisition and STORM analysis are available at https://github.com/ZhuangLab. Custom MATLab codes for the two-color STORM data analysis, data fitting for classical nucleation model, and SG identification are available at https://github.com/yefu01/ythdf.
References:
- 1.Protter DS & Parker R Principles and Properties of Stress Granules. Trends Cell Biol 26, 668–79 (2016). [DOI] [PMC free article] [PubMed] [Google Scholar]
- 2.Shin Y & Brangwynne CP Liquid phase condensation in cell physiology and disease. Science 357, eaaf4382 (2017). [DOI] [PubMed] [Google Scholar]
- 3.Banani SF, Lee HO, Hyman AA & Rosen MK Biomolecular condensates: organizers of cellular biochemistry. Nat Rev Mol Cell Biol 18, 285–298 (2017). [DOI] [PMC free article] [PubMed] [Google Scholar]
- 4.Kato M & McKnight SL A Solid-State Conceptualization of Information Transfer from Gene to Message to Protein. Annu Rev Biochem 87, 351–390 (2018). [DOI] [PubMed] [Google Scholar]
- 5.Ivanov P, Kedersha N & Anderson P Stress Granules and Processing Bodies in Translational Control. Cold Spring Harb Perspect Biol, a032813 (2018). [DOI] [PMC free article] [PubMed] [Google Scholar]
- 6.Eliscovich C & Singer RH RNP transport in cell biology: the long and winding road. Curr Opin Cell Biol 45, 38–46 (2017). [DOI] [PMC free article] [PubMed] [Google Scholar]
- 7.Shukla S & Parker R Hypo- and Hyper-Assembly Diseases of RNA-Protein Complexes. Trends Mol Med 22, 615–628 (2016). [DOI] [PMC free article] [PubMed] [Google Scholar]
- 8.Nedelsky NB & Taylor JP Bridging biophysics and neurology: aberrant phase transitions in neurodegenerative disease. Nat Rev Neurol 15, 272–286 (2019). [DOI] [PubMed] [Google Scholar]
- 9.Kato M et al. Cell-free formation of RNA granules: low complexity sequence domains form dynamic fibers within hydrogels. Cell 149, 753–67 (2012). [DOI] [PMC free article] [PubMed] [Google Scholar]
- 10.Han TW et al. Cell-free formation of RNA granules: bound RNAs identify features and components of cellular assemblies. Cell 149, 768–79 (2012). [DOI] [PubMed] [Google Scholar]
- 11.Van Treeck B & Parker R Emerging Roles for Intermolecular RNA-RNA Interactions in RNP Assemblies. Cell 174, 791–802 (2018). [DOI] [PMC free article] [PubMed] [Google Scholar]
- 12.Jain S et al. ATPase-Modulated Stress Granules Contain a Diverse Proteome and Substructure. Cell 164, 487–98 (2016). [DOI] [PMC free article] [PubMed] [Google Scholar]
- 13.Dominissini D et al. Topology of the human and mouse m6A RNA methylomes revealed by m6A-seq. Nature 485, 201–6 (2012). [DOI] [PubMed] [Google Scholar]
- 14.Meyer KD et al. Comprehensive analysis of mRNA methylation reveals enrichment in 3’ UTRs and near stop codons. Cell 149, 1635–46 (2012). [DOI] [PMC free article] [PubMed] [Google Scholar]
- 15.Fu Y, Dominissini D, Rechavi G & He C Gene expression regulation mediated through reversible m(6)A RNA methylation. Nat Rev Genet 15, 293–306 (2014). [DOI] [PubMed] [Google Scholar]
- 16.Delaunay S & Frye M RNA modifications regulating cell fate in cancer. Nat Cell Biol 21, 552–559 (2019). [DOI] [PubMed] [Google Scholar]
- 17.Wang X et al. N(6)-methyladenosine Modulates Messenger RNA Translation Efficiency. Cell 161, 1388–99 (2015). [DOI] [PMC free article] [PubMed] [Google Scholar]
- 18.Markmiller S et al. Context-Dependent and Disease-Specific Diversity in Protein Interactions within Stress Granules. Cell 172, 590–604 (2018). [DOI] [PMC free article] [PubMed] [Google Scholar]
- 19.Li A et al. Cytoplasmic m(6)A reader YTHDF3 promotes mRNA translation. Cell Res 27, 444–447 (2017). [DOI] [PMC free article] [PubMed] [Google Scholar]
- 20.Shi H et al. YTHDF3 facilitates translation and decay of N(6)-methyladenosine-modified RNA. Cell Res 27, 315–328 (2017). [DOI] [PMC free article] [PubMed] [Google Scholar]
- 21.Tourriere H et al. The RasGAP-associated endoribonuclease G3BP assembles stress granules. J Cell Biol 160, 823–31 (2003). [DOI] [PMC free article] [PubMed] [Google Scholar] [Retracted]
- 22.Kedersha N et al. G3BP-Caprin1-USP10 complexes mediate stress granule condensation and associate with 40S subunits. J Cell Biol 212, 845–60 (2016). [DOI] [PMC free article] [PubMed] [Google Scholar]
- 23.Edupuganti RR et al. N(6)-methyladenosine (m(6)A) recruits and repels proteins to regulate mRNA homeostasis. Nat Struct Mol Biol 24, 870–878 (2017). [DOI] [PMC free article] [PubMed] [Google Scholar]
- 24.Xiang Y et al. RNA m(6)A methylation regulates the ultraviolet-induced DNA damage response. Nature 543, 573–576 (2017). [DOI] [PMC free article] [PubMed] [Google Scholar]
- 25.Roundtree IA et al. YTHDC1 mediates nuclear export of N(6)-methyladenosine methylated mRNAs. Elife 6, e31311 (2017). [DOI] [PMC free article] [PubMed] [Google Scholar]
- 26.Wang X et al. N6-methyladenosine-dependent regulation of messenger RNA stability. Nature 505, 117–20 (2014). [DOI] [PMC free article] [PubMed] [Google Scholar]
- 27.Zheng D et al. Deadenylation is prerequisite for P-body formation and mRNA decay in mammalian cells. J Cell Biol 182, 89–101 (2008). [DOI] [PMC free article] [PubMed] [Google Scholar]
- 28.Khong A et al. The Stress Granule Transcriptome Reveals Principles of mRNA Accumulation in Stress Granules. Mol Cell 68, 808–820 (2017). [DOI] [PMC free article] [PubMed] [Google Scholar]
- 29.Molinie B et al. m(6)A-LAIC-seq reveals the census and complexity of the m(6)A epitranscriptome. Nat Methods 13, 692–8 (2016). [DOI] [PMC free article] [PubMed] [Google Scholar]
- 30.Femino AM, Fay FS, Fogarty K & Singer RH Visualization of single RNA transcripts in situ. Science 280, 585–90 (1998). [DOI] [PubMed] [Google Scholar]
- 31.Raj A, van den Bogaard P, Rifkin SA, van Oudenaarden A & Tyagi S Imaging individual mRNA molecules using multiple singly labeled probes. Nat Methods 5, 877–9 (2008). [DOI] [PMC free article] [PubMed] [Google Scholar]
- 32.Namkoong S, Ho A, Woo YM, Kwak H & Lee JH Systematic Characterization of Stress-Induced RNA Granulation. Mol Cell 70, 175–187 (2018). [DOI] [PMC free article] [PubMed] [Google Scholar]
- 33.Hubstenberger A et al. P-Body Purification Reveals the Condensation of Repressed mRNA Regulons. Mol Cell 68, 144–157 (2017). [DOI] [PubMed] [Google Scholar]
- 34.Alberti S, Gladfelter A & Mittag T Considerations and Challenges in Studying Liquid-Liquid Phase Separation and Biomolecular Condensates. Cell 176, 419–434 (2019). [DOI] [PMC free article] [PubMed] [Google Scholar]
- 35.Klausen MS et al. NetSurfP-2.0: Improved prediction of protein structural features by integrated deep learning. Proteins 87, 520–527 (2019). [DOI] [PubMed] [Google Scholar]
- 36.Lancaster AK, Nutter-Upham A, Lindquist S & King OD PLAAC: a web and command-line application to identify proteins with prion-like amino acid composition. Bioinformatics 30, 2501–2 (2014). [DOI] [PMC free article] [PubMed] [Google Scholar]
- 37.Peng K, Radivojac P, Vucetic S, Dunker AK & Obradovic Z Length-dependent prediction of protein intrinsic disorder. BMC Bioinformatics 7, 208 (2006). [DOI] [PMC free article] [PubMed] [Google Scholar]
- 38.Xu C et al. Structural Basis for the Discriminative Recognition of N6-Methyladenosine RNA by the Human YT521-B Homology Domain Family of Proteins. J Biol Chem 290, 24902–13 (2015). [DOI] [PMC free article] [PubMed] [Google Scholar]
- 39.Taslimi A et al. An optimized optogenetic clustering tool for probing protein interaction and function. Nat Commun 5, 4925 (2014). [DOI] [PMC free article] [PubMed] [Google Scholar]
- 40.Rust MJ, Bates M & Zhuang X Sub-diffraction-limit imaging by stochastic optical reconstruction microscopy (STORM). Nat Methods 3, 793–5 (2006). [DOI] [PMC free article] [PubMed] [Google Scholar]
- 41.Brangwynne CP et al. Germline P granules are liquid droplets that localize by controlled dissolution/condensation. Science 324, 1729–32 (2009). [DOI] [PubMed] [Google Scholar]
- 42.Narayanan A et al. A first order phase transition mechanism underlies protein aggregation in mammalian cells. Elife 8, e39695 (2019). [DOI] [PMC free article] [PubMed] [Google Scholar]
- 43.Anders M et al. Dynamic m(6)A methylation facilitates mRNA triaging to stress granules. Life Sci Alliance 1, e201800113 (2018). [DOI] [PMC free article] [PubMed] [Google Scholar]
- 44.Kedersha N & Anderson P Mammalian stress granules and processing bodies. Methods Enzymol 431, 61–81 (2007). [DOI] [PubMed] [Google Scholar]
- 45.Wang J et al. Binding to m(6)A RNA promotes YTHDF2-mediated phase separation. Protein Cell 11, 304–307 (2020). [DOI] [PMC free article] [PubMed] [Google Scholar]
- 46.Wang J et al. A Molecular Grammar Governing the Driving Forces for Phase Separation of Prion-like RNA Binding Proteins. Cell 174, 688–699 (2018). [DOI] [PMC free article] [PubMed] [Google Scholar]
- 47.Gao Y et al. Multivalent m(6)A motifs promote phase separation of YTHDF proteins. Cell Res 29, 767–769 (2019). [DOI] [PMC free article] [PubMed] [Google Scholar]
- 48.Ries RJ et al. m(6)A enhances the phase separation potential of mRNA. Nature 571, 424–428 (2019). [DOI] [PMC free article] [PubMed] [Google Scholar]
- 49.Buchan JR, Kolaitis RM, Taylor JP & Parker R Eukaryotic stress granules are cleared by autophagy and Cdc48/VCP function. Cell 153, 1461–74 (2013). [DOI] [PMC free article] [PubMed] [Google Scholar]
- 50.Wheeler JR, Matheny T, Jain S, Abrisch R & Parker R Distinct stages in stress granule assembly and disassembly. Elife 5, e18413 (2016). [DOI] [PMC free article] [PubMed] [Google Scholar]
- 51.Sarkar S & Hopper AK tRNA nuclear export in saccharomyces cerevisiae: in situ hybridization analysis. Mol Biol Cell 9, 3041–55 (1998). [DOI] [PMC free article] [PubMed] [Google Scholar]
- 52.Khatter H, Myasnikov AG, Natchiar SK & Klaholz BP Structure of the human 80S ribosome. Nature 520, 640–5 (2015). [DOI] [PubMed] [Google Scholar]
- 53.Natchiar SK, Myasnikov AG, Kratzat H, Hazemann I & Klaholz BP Visualization of chemical modifications in the human 80S ribosome structure. Nature 551, 472–477 (2017). [DOI] [PubMed] [Google Scholar]
- 54.Richter KN et al. Glyoxal as an alternative fixative to formaldehyde in immunostaining and super-resolution microscopy. EMBO J 37, 139–159 (2018). [DOI] [PMC free article] [PubMed] [Google Scholar]
- 55.Wang W, Li GW, Chen C, Xie XS & Zhuang X Chromosome organization by a nucleoid-associated protein in live bacteria. Science 333, 1445–9 (2011). [DOI] [PMC free article] [PubMed] [Google Scholar]
- 56.Huang B, Wang W, Bates M & Zhuang X Three-dimensional super-resolution imaging by stochastic optical reconstruction microscopy. Science 319, 810–3 (2008). [DOI] [PMC free article] [PubMed] [Google Scholar]
- 57.Otsu N Threshold Selection Method from Gray-Level Histograms. Ieee Transactions on Systems Man and Cybernetics 9, 62–66 (1979). [Google Scholar]
- 58.Slezov VV Kinetics of First-Order Phase Transitions, (Wiley-VCH., 2009). [Google Scholar]
- 59.Karthika S, Radhakrishnan TK & Kalaichelvi P A Review of Classical and Nonclassical Nucleation Theories. Crystal Growth & Design 16, 6663–6681 (2016). [Google Scholar]
- 60.Shin Y et al. Liquid Nuclear Condensates Mechanically Sense and Restructure the Genome. Cell 175, 1481–1491 (2018). [DOI] [PMC free article] [PubMed] [Google Scholar]
Associated Data
This section collects any data citations, data availability statements, or supplementary materials included in this article.