

Abstract
The purpose of this study was to evaluate adipose tissue distribution and hepatic and pancreatic fat content using a 6-point Dixon MRI technique in type 2 diabetes mellitus (T2DM), and to assess associations between fat distributions and biochemical markers of insulin resistance. Intra-abdominal MRI was investigated in 14 T2DM patients, 13 age- and sex-matched healthy controls (HC) and 11 young HC using a 3T Prisma MRI scanner. All T2DM subjects completed a fasting comprehensive metabolic panel, and demographic measurements were taken according to standardized methodologies. We observed excellent correlation (R2 = 0.94) between hepatic fat fraction quantified using 6-point Dixon MRI and gold standard MRS, establishing the accuracy and reliability of the Dixon technique. Significantly increased visceral adipose tissue (VAT) volumes were found in T2DM patients compared to age-matched HC (1569.81 ± 670.62 cm3 vs. 1106.60 ± 566.85 cm3, p=0.04). We also observed a trend of increasing subcutaneous adipose tissues (SAT), and total abdominal fat (TAT) volumes in T2DM compared to age-matched HC. Hepatic fat fraction percentage (HFF%) was 44.6% higher in T2DM compared to age-matched HC and 64.4% higher compared to young HC. Pancreatic fat fractions in the head and body/tail were higher in T2DM patients compared to both healthy cohorts. We also observed correlations between fat contents of the liver and pancreas in T2DM patients, and association between biochemical markers of T2DM with HFF, indicating a risk for non-alcoholic fatty liver disease among T2DM. In summary, this study provides evidence of T2DM patients having increased liver and pancreatic fat, as well as increased adipose tissues.
Keywords: T2DM, abdominal fat, Dixon, MRI, adipose tissue, hepatic fat fraction
Introduction:
Type 2 diabetes mellitus (T2DM) is evolving globally at an alarming rate and is a chronic and heterogeneous metabolic disorder in which almost every aspect of the body’s metabolism is altered [1]. It has reached epidemic proportions in many populations. It is estimated that approximately 366 million people will have diabetes by 2030 and more than 90% of them T2DM [2]. In obese adults, the prevalence of T2DM is three to seven times higher than in normal-weight adults [3]. Two distinctive features of T2DM are insulin resistance (IR) and compromised function of the pancreatic β-cell such that insulin secretion is insufficient to match the degree of IR [4]. The molecular mechanisms causing IR have yet to be elucidated explicitly, but there is growing evidence that glucose and fatty acid metabolism are closely linked and that IR is associated with disturbances in this relationship [5]. In addition to hyperglycemia, T2DM individuals almost invariably manifest a serious breakdown in lipid dynamics, often reflected by higher levels of circulating free fatty acids (FFAs) and triglycerides (TG), and there is reduced esterification and re-esterification of fatty acids in adipose tissues (AT) in IR subjects, which promotes ectopic accumulation of lipids in non-adipocyte tissues such as muscle and liver [6]. Hence, investigation of alterations in lipid metabolism can improve our understanding of the molecular mechanisms and development of metabolic disorders like IR, obesity and diabetes.
Quantitative evaluation of distributions of adipose tissues in various compartments within the body is important for the study of patients with diabetes and metabolic syndrome. Imaging techniques such as Dual energy X-ray Absorptiometry (DXA), Computed Tomography (CT) and Magnetic Resonance (MR) methods (MR Imaging (MRI) and MR Spectroscopy (MRS)) have been used to assess body fat composition [7]. DXA can only differentiate bone, fat, and lean soft tissues; CT allows the determination of subcutaneous and visceral adipose tissues, and the amount of fat deposition in the liver and skeletal muscle [7]. MR offers the possibility to perform these adipose tissue measurements without ionizing radiation [7] and allows for a more accurate quantification of pancreatic and hepatic fat fractions [4].
Several studies [8, 9] have indicated that individuals with T2DM have more visceral adipose tissues (VAT), intermuscular adipose tissues and less subcutaneous adipose tissues (SAT) than non-diabetic healthy control subjects. VAT have a greater capability to generate free fatty acids and have higher insulin-stimulated glucose uptake compared with SAT [10]. Most studies have found that VAT is closely associated with IR in T2DM, and this association continues to be observed in non-diabetes [11].
A clinical spectrum of liver abnormalities collectively known as non-alcoholic fatty liver disease (NAFLD) is often associated with T2DM [12]. The prevalence of NAFLD is found to be as high as 75% in patients with T2DM.12 Excess intra-abdominal fat found in T2DM patients is associated with excess liver fat and ectopic fat deposition [9, 13, 14].
Compared to the liver, the pancreas appears more susceptible to fat accumulation [15]. Some cross-sectional studies using MRS or MRI have shown that subjects with T2DM have altered pancreatic fat content compared to non-diabetic healthy subjects [16]. Evidence that non-alcoholic fatty pancreas disease (NAFPD) is associated with T2DM [17] is also emerging. Because of increasing IR, pancreatic beta cells produce more insulin to meet the demand, resulting in beta cell apoptosis and consequent increase of adipose tissues [17]. Moreover, hyperglycemia via malonyl coenzyme A (malonyl-CoA) inhibits functional carnitine palmitoyltransferase-1 activity and shunts fatty acid oxidation in the cell mitochondria, promoting intracellular triglyceride accumulation and development of NAFPD, which further decreases beta cell function in T2DM patients [18].
The objectives of the present study were to: 1) quantify subcutaneous adipose tissue (SAT), visceral adipose tissue (VAT), hepatic fat fraction (HFF) and pancreatic fat fraction (PFF), and to compare fat contents between T2DM, age-matched healthy controls, and young healthy controls using the 6-point Dixon MRI technique [19] ; 2) compare Dixon-MRI with gold-standard MRS in HFF to evaluate its ability to accurately quantify abdominal fat; 3) assess associations between adipose fat distributions and lipid parameters and IR markers in T2DM.
Materials and Methods:
Participants/Subjects
This study received approval from the Institutional Review Board. Of 46 enrolled subjects, 38 subjects were included in the present analysis with complete image acquisition and sufficient image quality in terms of SNR and artifacts. Among them, 14 were classified as T2DM patients (age = 57.5 ± 7.2 years, range 43–66), 13 as age-matched healthy controls (HC) (age = 58.8 ± 7.7 years, range 44–67), and 11 as young HC (age = 27.7 ± 2.2 years, range 24–31). Detailed demographics are provided in Table 1. We also added the young HC to study the reliability of 6-point Dixon compared with the other two groups.
Table 1:
Characteristics of the Study Population. TG: Triglycerides; TC: Total cholesterol; LDL: Low-density lipoprotein cholesterol; HDL: High density cholesterol; Crn: Creatinine; Glc: Glucose; AST: Aspartate aminotransferase; ALT: Alanine aminotransferase; TB: Total bilirubin.
| Variables | T2DM (n = 14) | Controls | p-value | ||
|---|---|---|---|---|---|
| Age-matched HC (n = 13) | Young HC (n = 11) | T2DM vs Age-matched HC | T2DM vs Young HC | ||
| BMI (kg/m2) | 26.3 ± 3.7 | 25.7 ± 1.8 | 25.1 ± 3.5 | 0.60 | 0.39 |
| Age (years) | 57.5 ± 7.2 | 58.8 ± 7.7 | 27.7 ± 2.2 | 0.66 | <0.0001 |
| Gender (Male:Female) | 6 : 8 | 6 : 7 | 8 : 3 | 0.87 | 0.14 |
| Comprehensive metabolic panel results for T2DM patients | |||||
| HbA1c (%), N=13 | 8.2 ± 2.1 | - | - | - | - |
| TG (mg/dL), N=12 | 146.8 ± 63.6 | - | - | - | - |
| TC (mg/dL), N=9 | 183.8 ± 70.1 | - | - | - | - |
| LDL (mg/dL), N=11 | 104.8 ± 56.5 | - | - | - | - |
| HDL (mg/dL), N=9 | 57.7 ± 24.2 | - | - | - | - |
| Crn (mg/dL), N=10 | 0.8 ± 0.2 | - | - | - | - |
| Glc (mg/dL), N=10 | 160.4 ± 64.3 | - | - | - | - |
| AST (IU/L), N=8 | 21.3 ± 18.7 | - | - | - | - |
| ALT (IU/L), N=8 | 23.9 ± 19.7 | - | - | - | - |
| TB, N=8 | 0.6 ± 0.1 | - | - | - | - |
Study criteria
All subjects had no history of cardiovascular or neuromuscular disease. The medical history of T2DM participants was reviewed and screened. We excluded participants if they had: 1) any acute infections; 2) presence of definite diabetic micro- and macro-angiopathy; 3) treatment with any medications that alter insulin sensitivity; 4) severe renal disease, severe hepatic disease, malignancy, chronic inflammatory disease; 5) poor control of T2DM indicated by a Hemoglobin A1C (HbA1c) of more than 9.0%. Study inclusion criteria for healthy controls were the following: 1) good health with sedentary lifestyles; 2) without a family history of diabetes; 3) with regular menstrual cycles in women. Patients with claustrophobia were excluded. Subjects with any metallic material in the body such as pacemakers, defibrillators and aneurysm clips and certain prostheses contraindicated for MRI were also excluded.
Clinical and biochemical data
All T2DM subjects completed a fasting comprehensive metabolic panel (serum creatinine (Crn), aspartate aminotransferase (AST), alanine aminotransferase (ALT), total bilirubin (TB), fasting glucose (Glc), HbA1c, total cholesterol (TC), triglyceride (TG), high-density lipoprotein (HDL), and low-density lipoprotein (LDL) levels), and measurements of demographics (age, gender, and BMI) by standardized methodologies.
MRI and Single Voxel 1H MRS
All MRI studies were performed on a 3T Prisma MRI scanner (Siemens Medical Solution, Erlangen, Germany) in a head-first supine position using a matrix array coil and a spinal phased-array coil in the scanner bed. After initial localizer scans, abdominal MRI was performed using a 3D GRE VIBE 6-point Dixon sequence. The acquisition parameters were: matrix size = 320×240, FOV~ 360×270 mm2, slice thickness = 3 mm, TR=8.85 ms, bandwidth = 1080 Hz/px, flip angle = 50, shortest possible TE’s (equidistant with TE1 = 1.23 ms and an echo time shift of 1.23 ms), average = 1, and a GRAPPA (GeneRalized Autocalibrating Partially Parallel Acquisitions) acceleration factor of 2 with an acquisition duration of 18 – 21 seconds. Thirty-eight or fifty-two axial slices were acquired between vertebral levels T12 and L5, depending on the subject’s height. To avert local and global water/fat swaps, the standard 6-point Dixon sequence used an enhanced water-fat partition and a denoising algorithm based on linear principal component analysis [19]. Furthermore, it used a multi-peak fat model with a complex-based water-fat separation algorithm. Using the water-only and fat-only images extracted from the multi-point Dixon data, fat fractions and water fractions were calculated by the in-line MR image reconstruction software as parametric maps. The 6-point Dixon sequence incorporates T2* into the signal model as a degree of freedom to calculate the fat fraction thereby incorporating correction for T2* decay as part of the signal fitting.
For single-voxel 1H MRS of the liver, a 15-second breath-hold, T2-corrected multi-echo spectroscopic sequence (HISTO, High speed multiple echo acquisition) [20] was performed using stimulated echo acquisition mode [21]. A 30×30×30 mm3 voxel was placed in the right lobe (Figure 1(A)) and care was taken to avoid any vascular and biliary structures. Other acquisition parameters included: TR = 3000 ms, TE = 12, 24, 36, 48, and 72 ms, 1024 acquired spectral data points, bandwidth = 1200 Hz, and average = 1. The long TR minimizes the effects of T1 weighting.
Figure 1:

The yellow box in (A) indicates the location of the MRS voxel in the liver. (B) SliceOmatic segmentation to delineate the subcutaneous (green) and visceral (blue) adipose tissues in a 27 year-old young healthy control; segmented (C) liver, (D) pancreas head and (E) pancreas body/tail respectively (brown area: body, green area: tail). (F) 1H MRS spectrum (CH2 peak at 1.3 ppm is main signal of lipids) obtained from a 40 year-old male subject from the VOI in the liver (A) using the HISTO sequence.
Data Processing and Analysis
We used an image analysis software, namely SliceOmatic (Ver. 5.0, Tomovision, Canada), to quantify abdominal fat (Figure 1(B)). A single trained observer guided by an experienced radiologist performed the image analysis. The VAT and SAT areas (cm2) were computed automatically from the respective tissue regions in each slice by summing the pixels from the given tissue and multiplying by the pixel surface area. Finally, tissue volume (cm3) for each slice was calculated by multiplying the tissue area (cm2) by slice thickness. To quantify hepatic fat fraction (HFF) and pancreatic fat fraction (PFF) percentage (%), the liver and the pancreas were segmented using the region growing algorithm in SliceOmatic. A discussion about the SliceOmatic segmentation procedure can be found in [4]. Pancreatic regions were segmented into three parts: head, body and tail. An overall average fat fraction across the liver and the head and body/tail of the pancreas was computed. To avoid segmentation error, we did not calculate PFF separately in the body and tail. Figure 1(C), 1(D) and 1(E) illustrate examples of SliceOmatic image segmentations of liver, and the pancreas head, body and tail in a 27 year-old young healthy control. The mean pixel value obtained through the software was scaled down by a factor of 1000 to counteract scaling performed during image acquisition on the MRI scanner.
For HISTO, after completion of each scan, the system automatically performed post-processing using the vendor-provided software package and generated MRS maps and a report with fat fraction values. It calculated the fat fraction based on the ratio of areas under fat peaks to the sum of areas under water and fat peaks. An exponential least-squares fitting algorithm was used to estimate peak amplitudes (~area) of water and fat at each TE. We obtained the HISTO HFF values from the system-generated reports. A representative MR spectrum at TE = 12 ms is shown in Figure 1(E).
Statistical Analyses
All statistical analyses were performed with SPSS (V25.0, IBM, Chicago, IL) software. A p value <0.05 was considered statistically significant. The independent samples t-tests were performed to assess differences between T2DM and healthy control groups for demographic and clinical parameters (Table 1). The Student’s t-test was used to determine differences in continuous variables. General linear models were used to determine whether there were statistically significant differences in the mean value of regional abdominal adiposity measurements (i.e., visceral fat area and subcutaneous fat) between the groups after adjustment for covariates, including sex, age, and BMI. Pearson correlation coefficients were used to assess the simple correlation between the regional abdominal adiposity measurements and the clinical, metabolic parameters. This was followed by partial correlation analysis controlling for covariates, such as age, gender, BMI, and HbA1c.
To determine the agreement between the HFF measurements obtained from the single voxel MRS and those obtained using FF maps, linear correlation, Pearson’s product–moment correlation coefficient (r), and the Bland–Altman method [22] were used. For Bland–Altman analyses, differences between HFF for the two measurements were plotted against their means with the repeatability coefficient (RC), which allows calculation of the 95% limits of agreement. The repeatability coefficient was defined as 1.96 times the standard deviation of the difference between two measurements.
Results:
No significant age difference was observed between T2DM and age-matched HC. There were no statistically significant differences in BMI across the T2DM, age-matched HC, and young HC groups (Table 1).
Abdominal fat distribution
Figure 2 shows volumes of VAT, SAT and total abdominal fat (TAT) for the three groups. Significantly increased VAT volumes were found in T2DM patients compared to age-matched HC (1569.81 ± 670.62 cm3 vs. 1106.60 ± 566.85 cm3, p=0.04). We also observed a trend of increasing SAT and TAT volumes in T2DM compared to age-matched HC (1959.87 ± 858.17 cm3 vs. 1662.96 ± 940.86 cm3, p=0.50 and 3529.69 ± 1362.14 cm3 vs. 2769.56 ± 1344.22 cm3, p=0.18, respectively). Compared to young HC, when age, BMI and gender were used as covariates in MANCOVA, T2DM showed a trend of higher VAT (1569.81 ± 670.62 cm3 vs. 905.13 ± 456.76 cm3), SAT (1959.87 ± 858.17 cm3 vs. 1787.01± 1248.34 cm3), and TAT (3529.69 ± 1362.14 cm3 vs. 2692.14 ± 1558.29 cm3).
Figure 2:

Absolute volumes of visceral fat (VAT), subcutaneous fat (SAT) and total abdominal fat (TAT) for the three groups: type-2 diabetes (T2DM), age-matched healthy controls (HC) and young HC. * Significant at the p = 0.05 level.
MRS vs MRI
Figure 3 summarizes comparison results for HFF% obtained from the abdominal MRI data and the single voxel MRS sequence HISTO from all 38 subjects. As shown in Figure 3(A), HFF from 6-point Dixon MRI (HFFDixon) showed a strong agreement and correlation with HFF from HISTO (HFFHISTO) (slope = 0.77, intercept = 1.40%, R2 = 0.94) and was statistically significant (p < 0.0001). Figure 3(B) illustrates the associated Bland–Altman plot, where the solid line represents the mean measurement bias and the dashed lines represent the 95% confidence interval. The mean measurement bias between HFFDixon and HFFHISTO was 0.38% (range: −4.3% to 2.9%). This was not significantly different from zero (95% confidence interval: −2.8 to 3.6).
Figure 3:
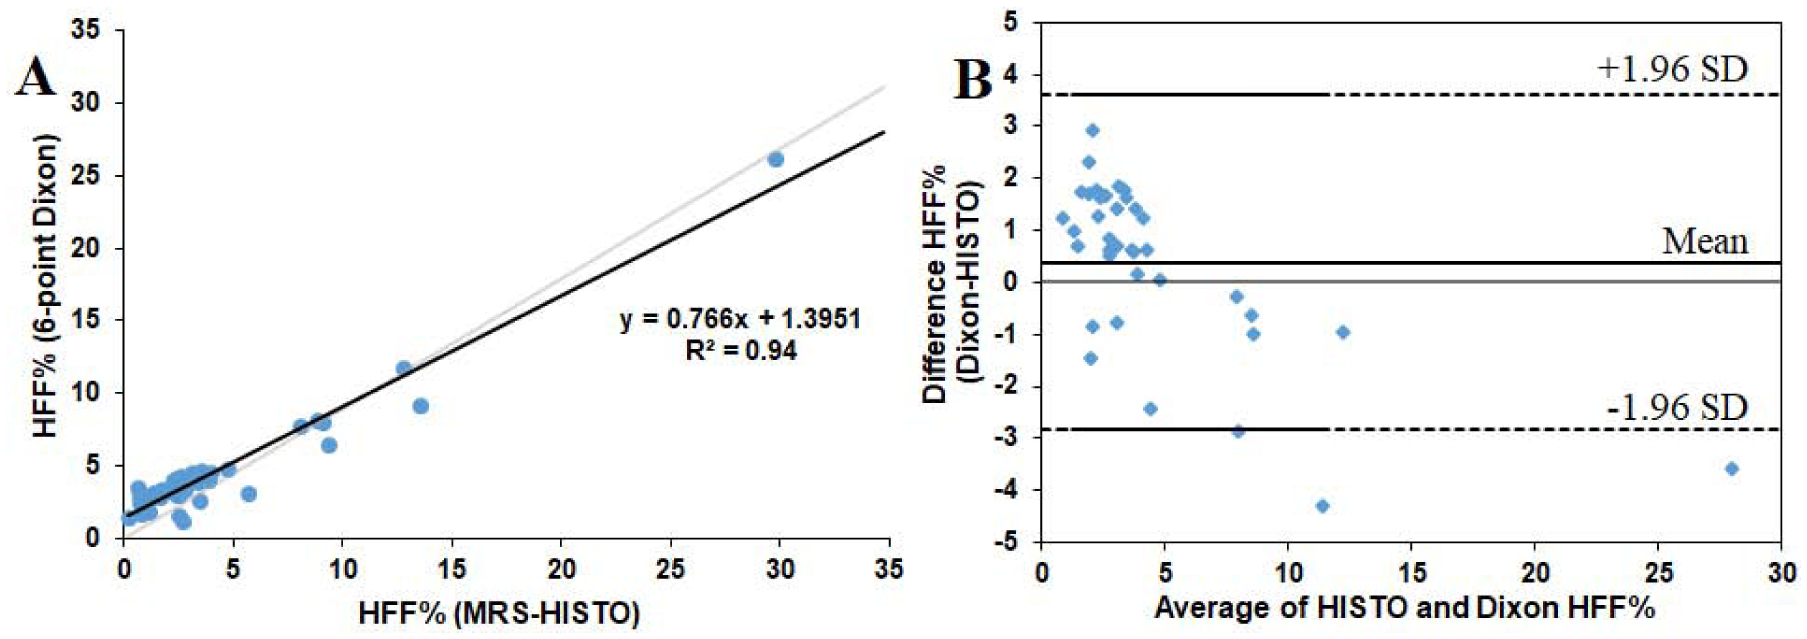
(A) Correlation of HFF% between T2*-corrected 6-point Dixon sequence and MRS measurement with HISTO sequence in 38 subjects. (B) Bland–Altman plot for assessment of agreement of HFF% between the HISTO and Dixon data with dashed lines representing the 95% confidence interval and solid line-representing mean.
Liver fat content
Figure 4(A) shows HFF% differences between the three groups with a median HFF% of 4.7% [IQR: 4.08–8.00], 3.4% [IQR: 3.06–3.99] and 2.7% [IQR: 1.71–3.18] in T2DM, age-matched HC and young HC, respectively. Group-wise comparison with BMI and gender as covariates further revealed a trend of elevated HFF% in T2DM compared to age-matched HC (7.12±6.05 vs. 3.95±1.64, p=0.086) and significantly increased HFF% in T2DM compared to young HC (7.12±6.05 vs. 2.53±0.99, p=0.019). When age was further added as a covariate, we did not observe any significant difference between T2DM and young HC (p=0.678).
Figure 4:

Comparison of (A) HFF%, (B) PFF% in the head of the pancreas, (C) PFF% in the body and tail of the pancreas, and (D) average PFF% between type-2 diabetes (T2DM), age-matched healthy controls (HC) and young HC.
Pancreas fat content
Figure 4(B–D) shows differences of PFF% in the pancreatic head (PFFHead%), the pancreatic body plus pancreatic tail (PFFBody+Tail%) and the mean (mPFF%) between the three groups. PFFHead%, PFFBody+Tail% and mPFF% were higher in T2DM patients (PFFHead%: 5.1% [IQR: 3.6–7.5]; PFFBody+Tail%: 6.0% [5.1–9.12]; mPFF%: 5.7% [4.8–8.8]) compared to both age-matched HC (PFFHead%: 4.1% [IQR: 3.7–5.1]; PFFBody+Tail%: 5.5% [4.7–6.8]; mPFF%: 4.9% [4.0–5.8]) and young HC (PFFHead%: 3.9% [IQR: 2.5–4.2]; PFFBody+Tail%: 4.1% [3.8–4.7]; mPFF%: 4.1% [3.1–4.3]). These differences for T2DM were also observed in a group-wise comparison with BMI and gender as covariates (T2DM vs. age-matched HC: p = 0.09, p = 0.08 and p = 0.06 for PFFHead, PFFBody+Tail%, and mPFF respectively; T2DM vs. young HC: p = 0.007, p = 0.006 and p = 0.004 for PFFHead, PFFBody+Tail and mPFF respectively). After adjusting for age along with gender and BMI, observed significant differences for PFFHead, PFFBody+Tail%, and mPFF between T2DM patients and young HC were attenuated (p = 0.57, p = 0.87 and p = 0.71 for PFFHead, PFFBody+Tail and mPFF, respectively).
Correlation Analysis in T2DM
Table 2 shows the Pearson correlation analysis for the association of the regional abdominal adipose tissue distribution with serum creatinine, hepatic and lipid parameters and the association between different fat measures in T2DM patients. BMI was positively correlated with SAT, VAT, TAT, and HFF% (p<0.05). We further examined the association through partial correlation analysis adjusted for age, gender, and HbA1c. BMI was significantly and positively associated with SAT (r = 0.64, p = 0.04), TAT (r = 0.66, p = 0.03), and HFF% (r = 0.59, p = 0.05), whereas BMI was marginally associated with VAT (r = 0.56, p = 0.07). No correlation was found between BMI and pancreatic fat content.
Table 2:
Pearson correlation between the clinical variables and fat content in T2DM patients.
| Clinical Parameter ↓ | Fat Measurements ↓ | Correlation Coefficients (r) | p-value |
|---|---|---|---|
| BMI | SAT | 0.59 | 0.03* |
| VAT | 0.56 | 0.04* | |
| TAT | 0.65 | 0.01** | |
| HFF% | 0.58 | 0.03* | |
| HFF% | SAT | 0.56 | 0.04* |
| VAT | 0.58 | 0.03* | |
| TAT | 0.64 | 0.01** | |
| PFFHead% | 0.69 | 0.01** | |
| PFFBody+Tail% | 0.77 | <0.01** | |
| mPFF% | 0.78 | <0.01** | |
| Creatinine | SAT | −0.65* | 0.04* |
| VAT | −0.46 | 0.18 | |
| TAT | −0.66 | 0.04* | |
| HFF% | −0.74 | 0.01* | |
| AST | HFF% | 0.82 | 0.01* |
| ALT | HFF% | 0.84 | 0.01** |
Significant at 0.05 level;
Significant at 0.01 level.
A higher level of HFF% was associated with higher amounts of SAT, VAT, TAT, PFF% in pancreatic head and body/tail, and mean PFF%. However, after adjusting for gender, age, BMI, and HbA1c, only pancreatic fat fraction in body/tail and mean pancreatic fat fraction remained significantly correlated with HFF%.
The serum creatinine level demonstrated a negative correlation with SAT, TAT, and HFF%. We also observed a positive correlation between hepatic fat fraction percentage and serum ALT and AST levels. After controlling for gender, age, BMI, and HbA1c, these correlations were sustained.
We did not observe a correlation between serum triglycerides, total cholesterol, LDL, HDL, total bilirubin and adipose tissue distribution quantified by MRI in the T2DM patients.
Discussion:
The purpose of the current study was to use abdominal MRI to obtain measurements of various adipose tissue distributions including SAT, VAT, HFF and PFF in a cohort of adults with T2DM, and to compare these findings with those in non-diabetic age-matched and young healthy subjects. This is the first study to use the six-point Dixon method to compare body fat composition between subjects with T2DM and matched non-diabetic control subjects.
MRS has long been considered as the clinical, non-invasive gold-standard technique for in vivo fat quantification [20]. We observed excellent correlation between hepatic fat fraction estimated by 6-point Dixon MRI and HISTO-MRS. This proves the accuracy and reliability for estimating various fat fractions using 6-point Dixon MRI. Compared to MRS, Dixon MRI offers greater spatial resolution and anatomical detail, is less susceptible to respiratory motion and is better suited for quantifying fat in smaller organs such as the pancreas. Although scan time is limited to a single breath-hold, all subjects in this study were able to undergo 6-point Dixon MRI due to its relatively short duration. In some cases, B0 inhomogeneity and sensitivity of the body coil-array to abdominal organs, which is subject-dependent, can make the water-fat separation more susceptible to error, such as water-fat swaps. However, only a small fraction of subjects exhibited severe artifacts and were excluded from the study, as mentioned above.
Accumulation of abdominal fat can increase IR, leading to a greater risk of cardiovascular disease and mortality. There have been conflicting reports about the role of VAT in T2DM. Our preliminary results of increased SAT and VAT reaffirm that central obesity is connected with the evolution of T2DM following IR. VAT was greater in the T2DM group than the older and young healthy subjects, but the difference between groups was larger for the young control group. Growing evidence suggests that VAT accumulation may play an important role in the etiology of T2DM.
SAT was higher in the T2DM group compared to both age-matched controls and young healthy subjects. The decrease of SAT in older controls compared to the young control group may be due to the effect of aging. Cell proliferation was found to decrease with aging in subcutaneous tissue [8]. Gallagher et al. [8] observed that aging was associated with less SAT and more VAT in both the T2DM and control groups. The presence of less VAT and more SAT would be expected to reduce the risk of IR in young subjects. In addition, we observed SAT and VAT in almost equal percentages in T2DM (Figure 2).
In the current study, T2DM patients had significantly greater hepatic fat content than both age-matched older healthy controls and young healthy individuals, indicating that T2DM is associated with increased fat accumulation in the liver. We observed that HFF percentage was 44.6% higher in individuals with T2DM compared to age-matched healthy controls and 64.4% higher compared to young healthy controls. In fact, we observed almost the same trend for HFF percentage from MRS-HISTO data – 55.2% higher in individuals with T2DM compared to age-matched healthy controls and 66.4% higher compared to young healthy controls. These results are consistent with the findings by Bozzetto et al. [9], which determined liver fat content by proton magnetic resonance spectroscopy (1H-MRS) in 13 diabetic obese, 10 non-diabetic obese, and nine normal-weight controls. Similar results were also obtained by Kelley et al. [13] using computerized tomography and by Kotronen et al. [14] using 1H-MRS. The increased HFF% observed here reflects the high occurrence of NAFLD in T2DM patients. The liver is the central organ for lipid and glucose metabolism, both of which are additionally regulated by insulin [23]. Elevated circulating free fatty acid levels in T2DM, in part related to diminished suppression of adipose tissue lipolysis by insulin, result in increased uptake of free fatty acids in the liver [24]. The synthesis of excess triglycerides in the liver is driven by this supply of fatty acids and the accumulation of excess liver fat is further exacerbated by impaired hepatic fatty acid oxidation secondary to insulin resistance. Additionally, impaired very low-density lipoprotein (VLDL) secretion, which commonly occurs with insulin resistance, further contributes to hepatic fat accumulation.
1H MRS and computerized tomography (CT) have been used for non-invasive measurements of pancreatic fat content in humans [17]. 1H MRS relies upon accurate respiratory triggering to acquire data solely from pancreatic tissue. On the other hand, CT provides less accurate data. Given its non-ionizing nature and high soft tissue contrast, MRI is particularly suited to gain insights into the role of pancreatic fat content. We observed that T2DM patients had 24.4% and 24.0% higher pancreatic fat fraction in the head and body/tail, respectively, than age-matched healthy controls. Compared to young healthy controls, T2DM patients had 42.5% and 42.7% higher PFF in the head and body/tail, respectively. Increased PFF in T2DM is important because of its effect on insulin sensitivity. In most affected individuals, T2DM is characterized by the co-occurrence of insulin resistance in target tissues and inadequate insulin production from the pancreatic islets. This impaired insulin secretory capacity of beta cells might be the underlying mechanism for increased PFF observed in our study. Though pancreatic fat fraction in the body/tail was higher than in head in all the three groups, we observe a significant difference between the two in the healthy groups only.
BMI, a measure of total body mass, has been found to be an efficient predictor of T2DM according to multiple epidemiologic studies [25]. We observed VAT and SAT were positively correlated to BMI in T2DM patients. Using ultrasonography, Roopakala et al. [26] showed better correlation of BMI to SAT than VAT in normal subjects. This was evident in our T2DM population as correlation of BMI with VAT was less significant when adjusting for age, gender, and HbA1c.
NAFLD has been regarded as one of the physiological abnormalities of the metabolic syndrome associated with T2DM [27]. Previous studies reported that BMI is independently associated with liver fat content in T2DM patients, which leads to a higher risk of NAFLD [28]. Consistent with this, we found that BMI had a positive association with HFF% in T2DM which seems to confirm that weight gain and obesity are sensitive biomarkers of high hepatic fat.
In our pilot analysis, we observed positive correlations of the hepatic fat fraction percentage with SAT, VAT, TAT, pancreatic fat fraction in head, body/tail, and mean pancreatic fat fraction. However, the pancreatic fat fraction in body/tail and the mean pancreatic fat fraction only remained significantly associated with the hepatic fat fraction percentage when adjusted for gender, age, BMI, and HbA1c. This coupling of fat content of the liver and pancreas in T2DM patients was observed by Sijens et al. [29] in healthy volunteers. Patel et al. [30] showed correlation between pancreas MRI-proton-density-fat-fraction (PDFF), liver MRI-PDFF, and histological steatosis in patients with biopsy-proven NAFLD. This correlation seems to confirm the pathophysiological changes that occur in the liver and pancreas due to increased fat deposition.
Even though both transaminase enzymes such as aspartate aminotransferase (AST) and alanine aminotransferase (ALT) are widely distributed in other tissues of the body, activities of ALT outside the liver are low and, therefore, ALT is considered the best specific marker of hepatocellular injury [31]. Our results indicate a positive correlation between hepatic fat fraction percentage and serum ALT and AST levels. Our findings are in concordance with results obtained from many other studies. A report by Pinhas-Hamiel et al. [32] found that ALT was elevated in about 20% of children and adolescents with T2DM, which may be due to NAFLD. Close association of ALT and liver fat was reported by Westerbacka J et al. [33] Other reports are also in agreement regarding an association between elevated ALT activity and fatty liver [34] in obesity, insulin resistance, and T2DM [35]. Higher activity of ALT and AST was reported in T2DM patients by Mathur et al. [36].
Our pilot results also indicate a negative correlation of creatinine levels with SAT, TAT, and percentage of hepatic fat fraction. It has been shown that serum creatinine is the only substance metabolized by skeletal muscle which is closely associated with total skeletal muscle mass [37]. A negative correlation of serum creatinine levels with percentage of body fat in body composition analysis was reported by Moon et al. [38], and a negative correlation of serum creatinine with increased risk of T2DM was reported in the Kansai Healthcare Study [39]. Also, Hjelmesæth et al. [40] reported that low serum creatinine is a predictor of T2DM in Caucasian morbidly obese patients, and that there is an inverse association between serum creatinine and T2DM.
A limitation of the present study is that it was cross sectional only. While we noted significant differences in VAT, HFF and PFF of T2DM patients compared to healthy subjects, longitudinal studies will be required to determine whether the observed changes are of primary importance in the development of insulin resistance, impaired glucose tolerance, and prediabetes progression to T2DM. Another limitation of our study is due to small sample size. However, despite this limitation, it is important to state that most of the differences between T2DM and healthy subjects had statistical significance, and the statistical power of the analysis was acceptable. Also, for Dixon MRI HFF was calculated as the average of the fat fraction over the whole liver and for MRS it was determined over the ROI in the right lobe. Despite this we got excellent correlation between the two methods.
Conclusions:
In conclusion, type-2 diabetes is associated with increased amounts of adipose tissues and visceral fat deposits in the liver and pancreas, which might be a contributing factor to insulin resistance in T2DM. Higher liver and pancreas fat contents are likely due to the expression of a more generalized alteration of fat distribution, as it involves key target sites for insulin action such as muscle, liver and beta cells. With its ability to measure fat from different compartments of the abdomen in a single scan, 6-point Dixon can be a reliable substitute for gold standard MRS.
Acknowledgement:
This research was supported by research grant from the National Institute of Biomedical Imaging and Bioengineering (NIBIB) R21EB02088302. We also acknowledge the scientific support of Dr. Theodore Hahn and Dr. Cathy Lee.
Abbreviations:
- T2DM
type 2 diabetes mellitus
- TG
triglycerides
- HFF
hepatic fat fraction
- PFF
pancreatic fat fraction
- HC
healthy controls
- Crn
serum creatinine
- TB
total bilirubin
- TC
total cholesterol
- HISTO
high speed multiple echo acquisition
- RC
repeatability coefficient
- TAT
total abdominal fat
- HFFDixon
hepatic fat fraction from 6-point Dixon MRI
- HFFHISTO
hepatic fat fraction from HISTO
- PFFHead%
pancreatic fat fraction percentage in the pancreatic head
- PFFBody+Tail%
pancreatic fat fraction percentage in the pancreatic body plus pancreatic tail
- mPFF%
mean pancreatic fat fraction percentage
Footnotes
Publisher's Disclaimer: This is a PDF file of an unedited manuscript that has been accepted for publication. As a service to our customers we are providing this early version of the manuscript. The manuscript will undergo copyediting, typesetting, and review of the resulting proof before it is published in its final form. Please note that during the production process errors may be discovered which could affect the content, and all legal disclaimers that apply to the journal pertain.
References:
- 1.NCD Risk Factor Collaboration (NCD-RisC). Worldwide trends in diabetes since 1980: a pooled analysis of 751 population-based studies with 4.4 million participants. Lancet 2016;387:1513–30. 10.1016/S0140-6736(16)00618-8. [DOI] [PMC free article] [PubMed] [Google Scholar]
- 2.Wild S, Roglic G, Green A, Sicree R, King H. Global prevalence of diabetes - Estimates for the year 2000 and projections for 2030. Diabetes Care 2004;27:1047–53. 10.2337/diacare.27.5.1047. [DOI] [PubMed] [Google Scholar]
- 3.Papaetis GS, Papakyriakou P, Panagiotou TN. Central obesity, type 2 diabetes and insulin: exploring a pathway full of thorns. Arch Med Sci 2015;11:463–82. 10.5114/aoms.2015.52350. [DOI] [PMC free article] [PubMed] [Google Scholar]
- 4.Hu HH, Nayak KS, Goran MI. Assessment of abdominal adipose tissue and organ fat content by magnetic resonance imaging. Obes Rev 2011;12:e504–e15. 10.1111/j.1467-789X.2010.00824. [DOI] [PMC free article] [PubMed] [Google Scholar]
- 5.McGarry JD. Dysregulation of fatty acid metabolism in the etiology of type 2 diabetes. Diabetes 2002;51:7–18. 10.2337/diabetes.51.1.7. [DOI] [PubMed] [Google Scholar]
- 6.Mantatzis M, Milousis T, Katergari S, Delistamatis A, Papachristou DN, Prassopoulos P. Abdominal Adipose Tissue Distribution on MRI and Diabetes. Acad Radiol 2014;21:667–74. 10.1016/j.acra.2014.01.009. [DOI] [PubMed] [Google Scholar]
- 7.Wang H, Chen YE, Eitzman DT. Imaging Body Fat Techniques and Cardiometabolic Implications. Arterioscl Throm Vas 2014;34:2217–23. 10.1161/Atvbaha.114.303036. [DOI] [PMC free article] [PubMed] [Google Scholar]
- 8.Gallagher D, Kelley DE, Yim JE, Spence N, Albu J, Boxt L, et al. Adipose tissue distribution is different in type 2 diabetes. Am J Clin Nutr 2009;89:807–14. 10.3945/ajcn.2008.26955. [DOI] [PMC free article] [PubMed] [Google Scholar]
- 9.Bozzetto L, Prinster A, Mancini M, Giacco R, De Natale C, Salvatore M, et al. Liver fat in obesity: role of type 2 diabetes mellitus and adipose tissue distribution. Eur J Clin Invest. 2011;41(1):39–44. 10.1111/j.1365-2362.2010.02372. [DOI] [PubMed] [Google Scholar]
- 10.Ibrahim MM. Subcutaneous and visceral adipose tissue: structural and functional differences. Obes Rev 2010;11:11–18. 10.1111/j.1467-789X.2009.00623. [DOI] [PubMed] [Google Scholar]
- 11.Kelley DE, Goodpaster BH. Skeletal Muscle Triglyceride - An aspect of regional adiposity and insulin resistance. Diabetes Care 2001;24:933–41. 10.2337/diacare.24.5.933. [DOI] [PubMed] [Google Scholar]
- 12.Angulo P Medical progress - Nonalcoholic fatty liver disease. New Engl J Med 2002;346:1221–31. 10.1056/NEJMra011775. [DOI] [PubMed] [Google Scholar]
- 13.Kelley DE, McKolanis TM, Hegazi RAF, Kuller LH, Kalhan SC. Fatty liver in type 2 diabetes mellitus: relation to regional adiposity, fatty acids, and insulin resistance. Am J Physiol-Endoc M 2003;285:E906–E16. 10.1152/ajpendo.00117.2003. [DOI] [PubMed] [Google Scholar]
- 14.Kotronen A, Juurinen L, Hakkarainen A, Westerbacka J, Corner A, Bergholm R, et al. Liver eat is increased in type 2 diabetic patients and underestimated by serum alanine aminotransferase compared with equally obese nondiabetic subjects. Diabetes Care 2008;31:165–9. 10.2337/dc07-1463. [DOI] [PubMed] [Google Scholar]
- 15.Guglielmi V, Sbraccia P. Type 2 diabetes: Does pancreatic fat really matter? Diabetes-Metab Res 2018; 34(2). 10.1002/dmrr.2955 [DOI] [PubMed] [Google Scholar]
- 16.Al-Mrabeh A, Hollingsworth KG, Steven S, Tiniakos D, Taylor R. Quantification of intrapancreatic fat in type 2 diabetes by MRI. Plos One 2017; 12(4). 10.1371/journal.pone.0174660. [DOI] [PMC free article] [PubMed] [Google Scholar]
- 17.Tushuizen ME, Bunck MC, Pouwels PJ, Bontemps S, van Waesberghe JHT, Schindhelm RK, et al. Pancreatic fat content and beta-cell function in men with and without type 2 diabetes. Diabetes Care 2007;30:2916–21. 10.2337/dc07-0326. [DOI] [PubMed] [Google Scholar]
- 18.Robertson RP, Harmon J, Tran POT, Poitout V. beta-cell glucose toxicity, lipotoxicity, and chronic oxidative stress in type 2 diabetes. Diabetes 2004;53:S119–S24. 10.2337/diabetes.53.2007.S119. [DOI] [PubMed] [Google Scholar]
- 19.Grimm A, Meyer H, Nickel MD, Nittka M, Raithel E, Chaudry O, et al. Evaluation of 2-point, 3-point, and 6-point Dixon magnetic resonance imaging with flexible echo timing for muscle fat quantification. Eur J Radiol 2018;103:57–64. 10.1016/j.ejrad.2018.04.011. [DOI] [PubMed] [Google Scholar]
- 20.Pineda-Alonso N, Martin D, Xu Q, Sharma P, Vos M, Hu X. High speed multiple echo acquisition (HISTO): A rapid and simultaneous assessment of fat and iron content in liver by (HMRS)-H-1, validation on phantoms and patients. In: 5th IEEE International Symposium on Biomedical Imaging: From Nano to Macro, Paris, 2008:1533–6. 10.1109/Isbi.2008.4541301. [DOI] [Google Scholar]
- 21.Frahm J, Merboldt KD, Hanicke W, Haase A. Stimulated Echo Imaging. J Magn Reson 1985;64:81–93. 10.1016/0022-2364(85)90033-2. [DOI] [Google Scholar]
- 22.Bland JM, Altman DG. Statistical Methods for Assessing Agreement between Two Methods of Clinical Measurement. Lancet 1986;1:307–10. [PubMed] [Google Scholar]
- 23.Postic C, Dentin R, Girard J. Role of the liver in the control of carbohydrate and lipid homeostasis. Diabetes Metab 2004;30:398–408. 10.1016/S1262-3636(07)70133-7. [DOI] [PubMed] [Google Scholar]
- 24.Bhatt HB, Smith RJ. Fatty liver disease in diabetes mellitus. Hepatol Surg Nutr 2015;4:101–8. 10.3978/j.issn.2304-3881.2015.01.03. [DOI] [PMC free article] [PubMed] [Google Scholar]
- 25.Hu FB, Manson JE, Stampfer MJ, Colditz G, Liu S, Solomon CG, et al. Diet, lifestyle, and the risk of type 2 diabetes mellitus in women. New Engl J Med 2001;345:790–7. 10.1056/NEJMoa010492. [DOI] [PubMed] [Google Scholar]
- 26.Roopakala MS, Suresh A, Ashtalakshmi, Srinath, Ashok, Giridhar, et al. Anthropometric measurements as predictors of intraabdominal fat thickness. Indian J Physiol Pharmacol 2009;53:259–64. [PubMed] [Google Scholar]
- 27.Anstee QM, McPherson S, Day CP. How big a problem is non-alcoholic fatty liver disease? BMJ 2011;343:d3897 10.1136/bmj.d3897. [DOI] [PubMed] [Google Scholar]
- 28.Ishii M, Yoshioka Y, Ishida W, Kaneko Y, Fujiwara F, Taneichi H, et al. Liver fat content measured by magnetic resonance spectroscopy at 3.0 Tesla independently correlates with plasminogen activator inhibitor-1 and body mass index in type 2 diabetic subjects. Tohoku J Exp Med 2005;206:23–30. 10.1620/tjem.206.23. [DOI] [PubMed] [Google Scholar]
- 29.Sijens PE, Edens MA, Bakker SJL, Stolk RP. MRI-determined fat content of human liver, pancreas and kidney. World J Gastroentero 2010;16:1993–8. 10.3748/wjg.v16.i16.1993. [DOI] [PMC free article] [PubMed] [Google Scholar]
- 30.Patel NS, Peterson MR, Brenner DA, Heba E, Sirlin C, Loomba R. Association between novel MRI-estimated pancreatic fat and liver histology-determined steatosis and fibrosis in non-alcoholic fatty liver disease. Aliment Pharm Ther 2013;37:630–9. 10.1111/apt.12237. [DOI] [PMC free article] [PubMed] [Google Scholar]
- 31.Lee DH, Ha MH, Kim JH, Christiani DC, Gross MD, Steffes M, et al. Gamma-glutamyltransferase and diabetes - a 4 year follow-up study. Diabetologia 2003;46:359–64. 10.1007/s00125-003-1036-5. [DOI] [PubMed] [Google Scholar]
- 32.Pinhas-Hamiel O, Zeitler P. Acute and chronic complications of type 2 diabetes mellitus in children and adolescents. Lancet 2007;369:1823–31. 10.1016/S0140-6736(07)60821-6. [DOI] [PubMed] [Google Scholar]
- 33.Westerbacka J, Corner A, Tiikkainen M, Tamminen M, Vehkavaara S, Hakkinen AM, et al. Women and men have similar amounts of liver and intra-abdominal fat, despite more subcutaneous fat in women: implications for sex differences in markers of cardiovascular risk. Diabetologia 2004;47:1360–9. 10.1007/s00125-004-1460-1. [DOI] [PubMed] [Google Scholar]
- 34.Marchesini G, Avagnina S, Barantani EG, Ciccarone AM, Corica F, Dall’Aglio E, et al. Aminotransferase and gamma-glutamyltranspeptidase levels in obesity are associated with insulin resistance and the metabolic syndrome. J Endocrinol Invest 2005;28:333–9. 10.1007/Bf03347199. [DOI] [PubMed] [Google Scholar]
- 35.Sattar N, Scherbakova O, Ford I, O’Reilly DSJ, Stanley A, Forrest E, et al. Elevated alanine aminotransferase predicts new-onset type 2 diabetes independently of classical risk factors, metabolic syndrome, and C-reactive protein in the West of Scotland Coronary Prevention Study. Diabetes 2004;53:2855–60. 10.2337/diabetes.53.11.2855. [DOI] [PubMed] [Google Scholar]
- 36.Mathur S, Mehta DK, Kapoor S, Yadav S. Liver Function in Type-2 Diabetes Mellitus Patients. Int J Sci Study 2016;3:43–7. 10.17354/ijss/2016/09. [DOI] [Google Scholar]
- 37.Baxmann AC, Ahmed MS, Marques NC, Menon VB, Pereira AB, Kirsztajn GM, et al. Influence of muscle mass and physical activity on serum and urinary creatinine and serum cystatin C. Clin J Am Soc Nephro 2008;3:348–54. 10.2215/Cjn.02870707. [DOI] [PMC free article] [PubMed] [Google Scholar]
- 38.Moon JS, Lee JE, Yoon JS. Variation in Serum Creatinine Level Is Correlated to Risk of Type 2 Diabetes. Endocrinol Metab-Enm 2013;28:207–13. 10.3803/EnM.2013.28.3.207. [DOI] [PMC free article] [PubMed] [Google Scholar]
- 39.Harita N, Hayashi T, Sato KK, Nakamura Y, Yoneda T, Endo G, et al. Lower Serum Creatinine Is a New Risk Factor of Type 2 Diabetes The Kansai Healthcare Study. Diabetes Care 2009;32:424–6. 10.2337/dc08-1265. [DOI] [PMC free article] [PubMed] [Google Scholar]
- 40.Hjelmesaeth J, Roislien J, Nordstrand N, Hofso D, Hager H, Hartmann A. Low serum creatinine is associated with type 2 diabetes in morbidly obese women and men: a cross-sectional study. Bmc Endocr Disord 2010;10:6 10.1186/1472-6823-10-6. [DOI] [PMC free article] [PubMed] [Google Scholar]