

Abstract
Patients with Systemic Lupus Erythematosus (SLE) display a complex blood transcriptome whose cellular origin is poorly resolved. Using single-cell RNA-seq, we profiled ~276,000 PBMCs from 33 children with SLE (cSLE) with different degrees of disease activity (DA) and 11 matched controls. Increased expression of interferon-stimulated genes (ISGs) distinguished cSLE from healthy control cells. The high-ISG expression signature (ISGhi) derived from a small number of transcriptionally defined subpopulations within major cell types, including monocytes, CD4+ and CD8+ T cells, natural killer cells, conventional dendritic cells (cDCs), plasmacytoid DCs (pDCs), B cells and especially plasma cells. Expansion of unique subpopulations enriched in ISGs and/or in monogenic lupus-associated genes classified patients with the highest DA. Profiling of ~82,000 single peripheral blood mononuclear cells (PBMCs) from adult SLE patients confirmed the expansion of similar subpopulations in patients with the highest DA. This study lays the groundwork for resolving the origin of the SLE transcriptional signatures and the disease heterogeneity towards precision medicine applications.
INTRODUCTION
SLE is a heterogeneous autoimmune disease whose immunologic hallmark is the breakdown of tolerance against nucleic acids1,2. Disease course is unpredictable, with remissions and flares that lead to cumulative organ damage. The disease is notably aggressive in children, who suffer from a high incidence of nephritis. SLE’s diverse manifestations challenge clinicians3 and hamper the design of clinical trials. Thus only one new treatment has been approved to treat SLE in more than 60 years4.
Distinctive blood-transcriptional signatures have been identified in SLE, including those associated with type I interferon (IFN), myeloid inflammation and B cell-related pathways5–7. A number of studies indicate a correlation between these signatures and disease activity (DA)7–10. In addition, GWAS highlighted a genetic association with loci related to these pathways11, including type I IFN dysregulation12.
Not all ISGs correlate equally with DA7. Furthermore, longitudinal blood transcriptional profiling of children with SLE (cSLE) stratified them into seven groups according to five DA molecular correlates, one involving ISGs8. Insights into additional upstream pathways contributing to SLE pathogenesis have emerged from rare mutations in early onset Lupus-related Monogenic Disorders (LRMDs). Genes associated with these conditions encode early complement components; nucleic acid-degrading or -modifying enzymes, including those involved in the spectrum of Aicardi-Goutières syndromes or monogenic interferonopathies; and molecules involved in B and/or T cell activation and cell death (Reviewed in13).
Single-cell RNA-seq (scRNA-seq) provides an unbiased approach to define cell types and states based on their individual transcriptome in health14–16 and disease17,18. Herein we report our findings using ~276k PBMCs from 33 cSLE patients with different degrees of DA and 11 healthy controls (cHD). These data were validated in an independent cohort of eight adult SLE patients (aSLE) and six healthy controls (aHD; ~82k PBMCs). Our results provide a framework for SLE stratification and point towards specific cell subpopulations as potential therapeutic targets.
RESULTS
scRNA-seq reveals altered PBMC composition in SLE patients.
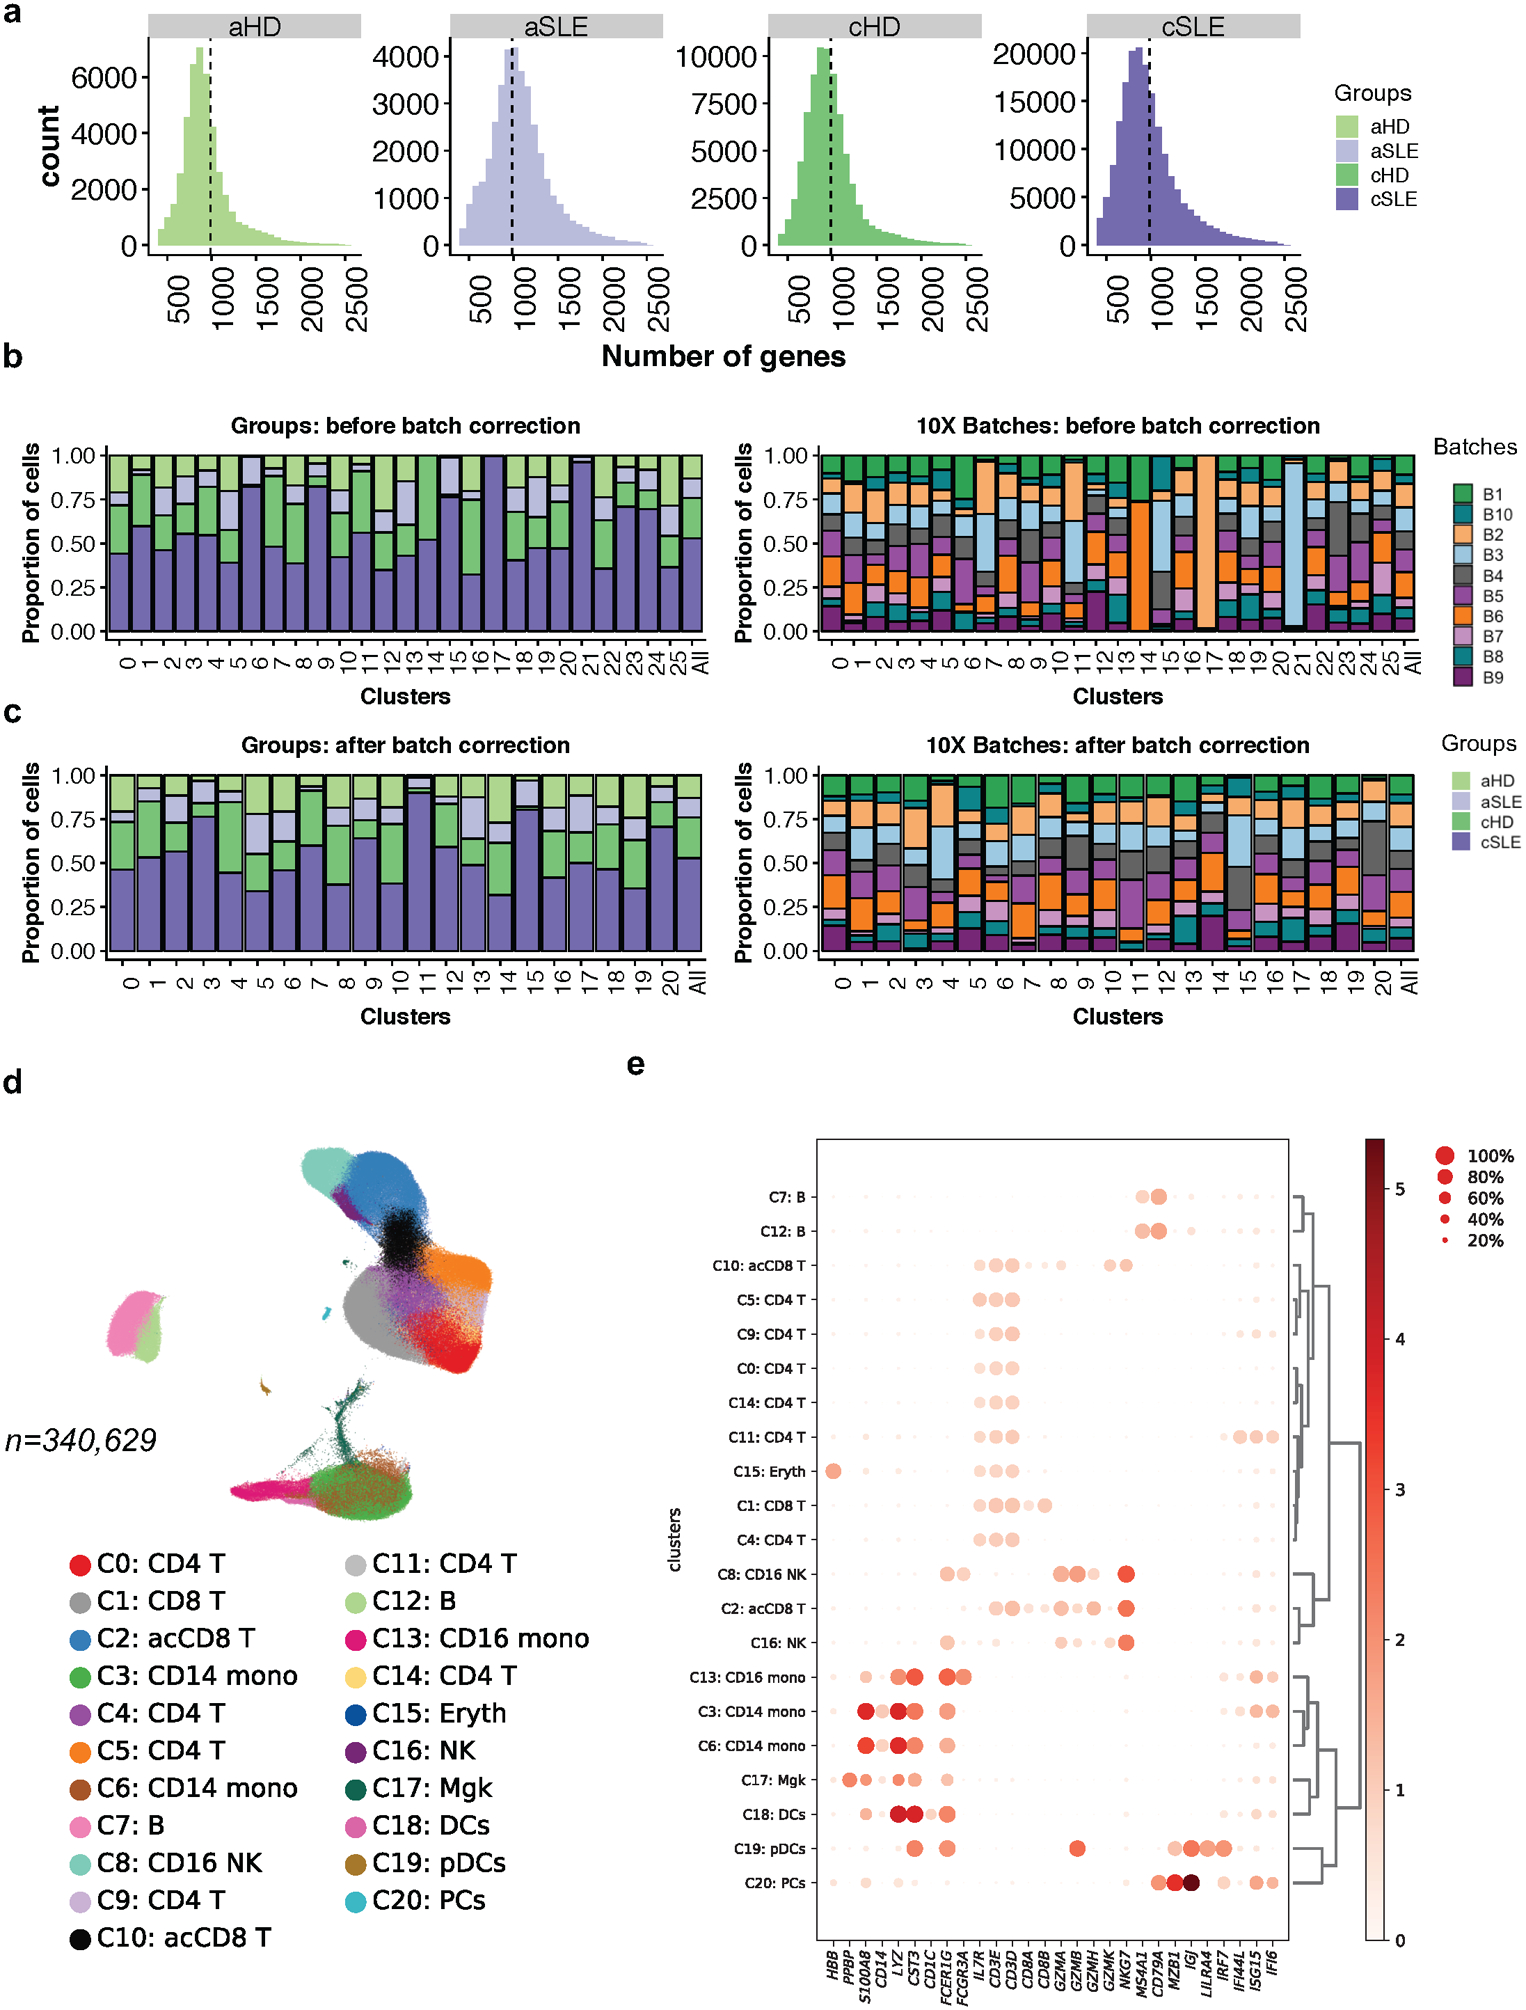
We analyzed the transcriptomes of ~276k single PBMCs from 33 cSLE and 11 matched cHD (Fig. 1a). 30/33 patients were 10–18-year females (mean 15.84 ±2.1). Disease activity (DA) was measured using the SLE Disease Activity Index (SLEDAI), a weighted metric combining 24 components1. Patients were categorized as low DA (SLEDAI <=4; n=18) and high DA (SLEDAI >4; n=13). SLEDAI could not be determined for two patients due to lack of urinary analysis on the day of sample collection (ND). Patient demographics, clinical/laboratory data and treatment are summarized in Supplementary Table 1a,b. The sequencing information of each sample is shown in Supplementary Table 1c. cHD and cSLE samples yielded an average of 7,706 cells (sd± 2,148) and 5,782 cells (sd± 2,392) per donor (average 989 and 1,000 genes per cell, respectively) (Extended Data Fig. 1a,b). After removing hybrid transcriptomes (multiplets) using Scrublet19, raw data from 78,693 cHD PBMCs (31% of the pool) and 180,175 cSLE PBMCs (69% of the pool) were combined. scRNA-seq profiles passing the quality control (Extended Data Fig. 1c, Methods) were corrected for technical 10X runs batch effect using BBKNN20 or Harmony21. Based on the BBKNN corrected data, unsupervised clustering followed by a two-dimensional uniform manifold approximation and projection (UMAP)22 revealed 20 molecularly distinct clusters (Fig. 1b, 27 clusters before batch correction; Extended Data Fig. 1d,e). Similar results were obtained using Harmony21, which yielded 21 clusters (Extended Data Fig. 1f). Cell numbers in clusters varied from 42,353 to 624 (Extended Data Fig. 2a). Clusters were defined based on gene expression values compared to all other cells (Fig.1c; Supplementary Table 2a). This analysis identified single clusters of dendritic cells (DCs), megakaryocytes (Mgk), erythroid cells (Eryth), NK cells, plasma blasts/cells (PB/PC) and plasmacytoid dendritic cells (pDCs), two clusters of B cells and monocytes (CD14+ and CD16+), five CD4+ T cell and five CD8+ T cell clusters. Cluster assignments were independent of 10X runs (Extended Data Fig. 1e) and donor (Fig. 1d, Extended Data Fig. 2b).
Figure 1. scRNA-seq reveals altered PBMCs composition in SLE patients.

(a). Overview of the pipeline. Raw data (n=275,588 cells) from 33 cSLE and 11 cHD were first cleaned from the multiplets, using Scrublet19, then merged together, resulting in a dataset containing ~258k cells. After batch correction using BBKNN20, the Scanpy55-based pipeline was ran (see Methods section).
(b). UMAP plot representing the 20 clusters across 258,868 PBMCs from 44 individual (33 cSLE and 11 cHD). The putative identity of each cluster was specified on the basis of Fig. 1c and Supplementary Table 2a. The cluster labels were added manually.
(c). Cluster annotation. Dot plot represents expression values of selected genes (x-axis) across each cluster (y-axis). Dot size represents the percentage of cells expressing the marker of interest. Color intensity indicates the mean expression within expressing cells.
(d). Barplot representing the cell abundance of each cluster (n=20) across the 44 individuals (33 cSLE and 11 aHD).
(e). Violin plot comparing the proportion of each cluster (n=20) across the individual (n=44). cSLE are shown in purple, and cHD in green. P values were calculated using Wilcoxon test comparing the mean(cSLE) with mean(cHD). *, P<0.05; **, P<0.01; ***, P<0.001: ****, P<0.0001.
(f). Heat map representing the mean expression of IFN-related genes (n=100 unique genes, from Gene ontology and modules9) across the clusters (n=20) and groups (cSLE in purple and cHD in green). Color indicates the mean expression within each cluster. Column-side color key represents annotations of IFN genes. IFN, interferon.
Many clusters were differentially represented in cHD individuals and cSLE patients (Fig. 1e). Subsets overrepresented in cSLE patients included: C0_CD14 monocytes, C11_CD4+ T and C19_ISGhi_GzK+_acCD8+ T cells (p<0.05). Subsets underrepresented in cSLE included: C1_CD4+ T, C5_CD8+ T, C7_CD16_NK cells, C9_GzK+_activated(ac)CD8+ T, C10_CD4+ T cells and C18_pDCs (p<0.05). The remaining (12/21) subsets were present in similar proportions across the two groups (e.g. C2_CD4+ T, C3_GzH+_acCD4+ T, C4_B, C6_CD4+ T, C8_CD8+ T, C12_B cells, C13_CD16 monocytes, C16_DCs). Three clusters (C14_Erythrocytes, C15_Mgk and C17_PCs) were expanded in some cSLE patients without reaching statistical significance. Three distinct patterns emerged from this analysis: 10 cSLE samples mingled with those of cHD (Extended Data Fig. 2c), 17 cSLE samples clustered independently of cHD, while six cSLE and one cHD samples displayed diverse profiles. According to DA, cSLE samples with SLEDAI 4–6 and SLEDAI >6 correlated and were separated from HD (Extended Data Fig. 2d). Thus, scRNA-seq analysis reveals cell cluster heterogeneity in cSLE PBMCs.
Cellular origin of SLE IFN signature.
Given the importance of the IFN pathway in SLE, we analyzed the cellular distribution of IFN-related genes (IRGs) across the 20 clusters. Within every cluster (C0–19; Fig. 1f) we calculated the average expression of genes composing three previously identified IFN-stimulated gene (ISG) modules (M1.2, M3.4 and M5.12) that correlate with SLE DA7,9,8, in addition to ISGs and IRGs annotated by Gene Ontology (GO). In cSLE, 8/20 clusters mostly contributed to the IFN signature (Fig. 1f). These included the major monocyte cluster C0 and seven smaller clusters, namely C11 (a minor CD4+ T cell cluster); C13 (CD16+ Monocytes); C15 (Mgk); C16 (cDCs); C17 (PCs); C18 (pDCs); and C19 (ISGhi GzK+acCD8+ T cells). Notably, C11_CD4+ T (n=7,858 cells), which expressed high levels of ISGs, was mostly composed of cSLE cells (n=7,722) but included a small fraction of cells from every cHD (2–28 cells/cHD; n=136 cells).
Unbiased clustering based on ISG and IRG expression enabled the generation of nine groups (G1 to G9, Fig. 1f). The most upregulated cSLE-specific ISGs were observed in groups G1 (ISG15, IFI27), G3 (IFI44L, PARP9), mostly from modules M1.2 and M3.4, and G2 (IFI35, ADAR) from M3.4 and M5.12. G4, defined by TMEM140, was preferentially up-regulated in MgK. G5 genes (IFNGR1, CASP1, FCGR1A) were preferentially expressed in monocytes, DCs and Mgk. The four smallest groups, G6 to G9, included IFNγ pathway-related genes. G6 genes (CCL4, CCL5, IFNG) were up-regulated in NK cells, C3_GzH_acCD8+ T and C19_ISGhi_GzK+_acCD8+ T cells, while most other genes in these clusters were similarly expressed in cHD and cSLE samples. Genes in G7, such as SOCS1, were up-regulated in cSLE pDCs but also expressed in C5, C10, C2, C9, and C19 T cells from both cSLE and cHD cells. G8 included IRF7 and IFNLR1, which were highly expressed in both cHD and cSLE pDCs and upregulated in cSLE PCs. All G9 genes, including the type I IFN receptor-encoding genes (IFNAR1/2), were highly expressed in cHD and cSLE PCs. An ISG score based on the average expression of ISGs from M1.2, M3.4 and M5.12 in each individual cell confirmed this ISG distribution (Extended Data Fig. 2e).
A second round of clustering yielded 37 subclusters (SCs), which were then used to calculate ISG scores. cSLE-specific ISGhi SCs were found within each cell lineage except for the erythrocyte SC (Extended Data Fig. 2f). scRNA-seq therefore highlighted the disproportionate contribution of a few cell clusters and of discrete SCs within each lineage, except erythroid cells, to the SLE IFN signature.
An SLE-restricted ISGhi monocyte subcluster co-expresses IL1B.
Alterations in the monocyte compartment have been associated with SLE pathogenesis23,24. scRNA-seq analysis yielded two major monocyte clusters (C0 and C13) (Fig. 1b–e) including 47,968 cells from 44 subjects. A second round of clustering produced eight Mono-SCs (Mono-SC0 to Mono-SC7), three of which were expanded in cSLE patients (Mono-SC0, n= 9,595; 99% cSLE, Mono-SC3, n= 5,957; 91% cSLE and Mono-SC6, n= 4,703; 94% cSLE; Fig. 2a). Differential gene expression analysis revealed an ISG enrichment in the three cSLE-expanded Mono-SCs (Fig. 2b and Supplementary Table 2b). Expression of selected genes positioned in a UMAP plot confirmed an expansion of ISGhi CD14 monocytes in cSLE. In contrast, monocytes expressing pro-inflammatory cytokine genes (IL1B, IL8) were present in both cSLE and cHD (Fig. 2c). Individual UMAP plots revealed remarkable cHD sample homogeneity across the age range, contrasting with the cSLE heterogeneity. Absent from cHD, ISGhi Mono-SC0 was present in 22/33 cSLE patients (11/18 and 11/13 of cSLE patients with SLEDAI <=4 and >4, respectively; Fig. 2d and Extended Data Fig. 3a).
Figure 2. Monocyte clusters display altered transcriptional profiles in cSLE.
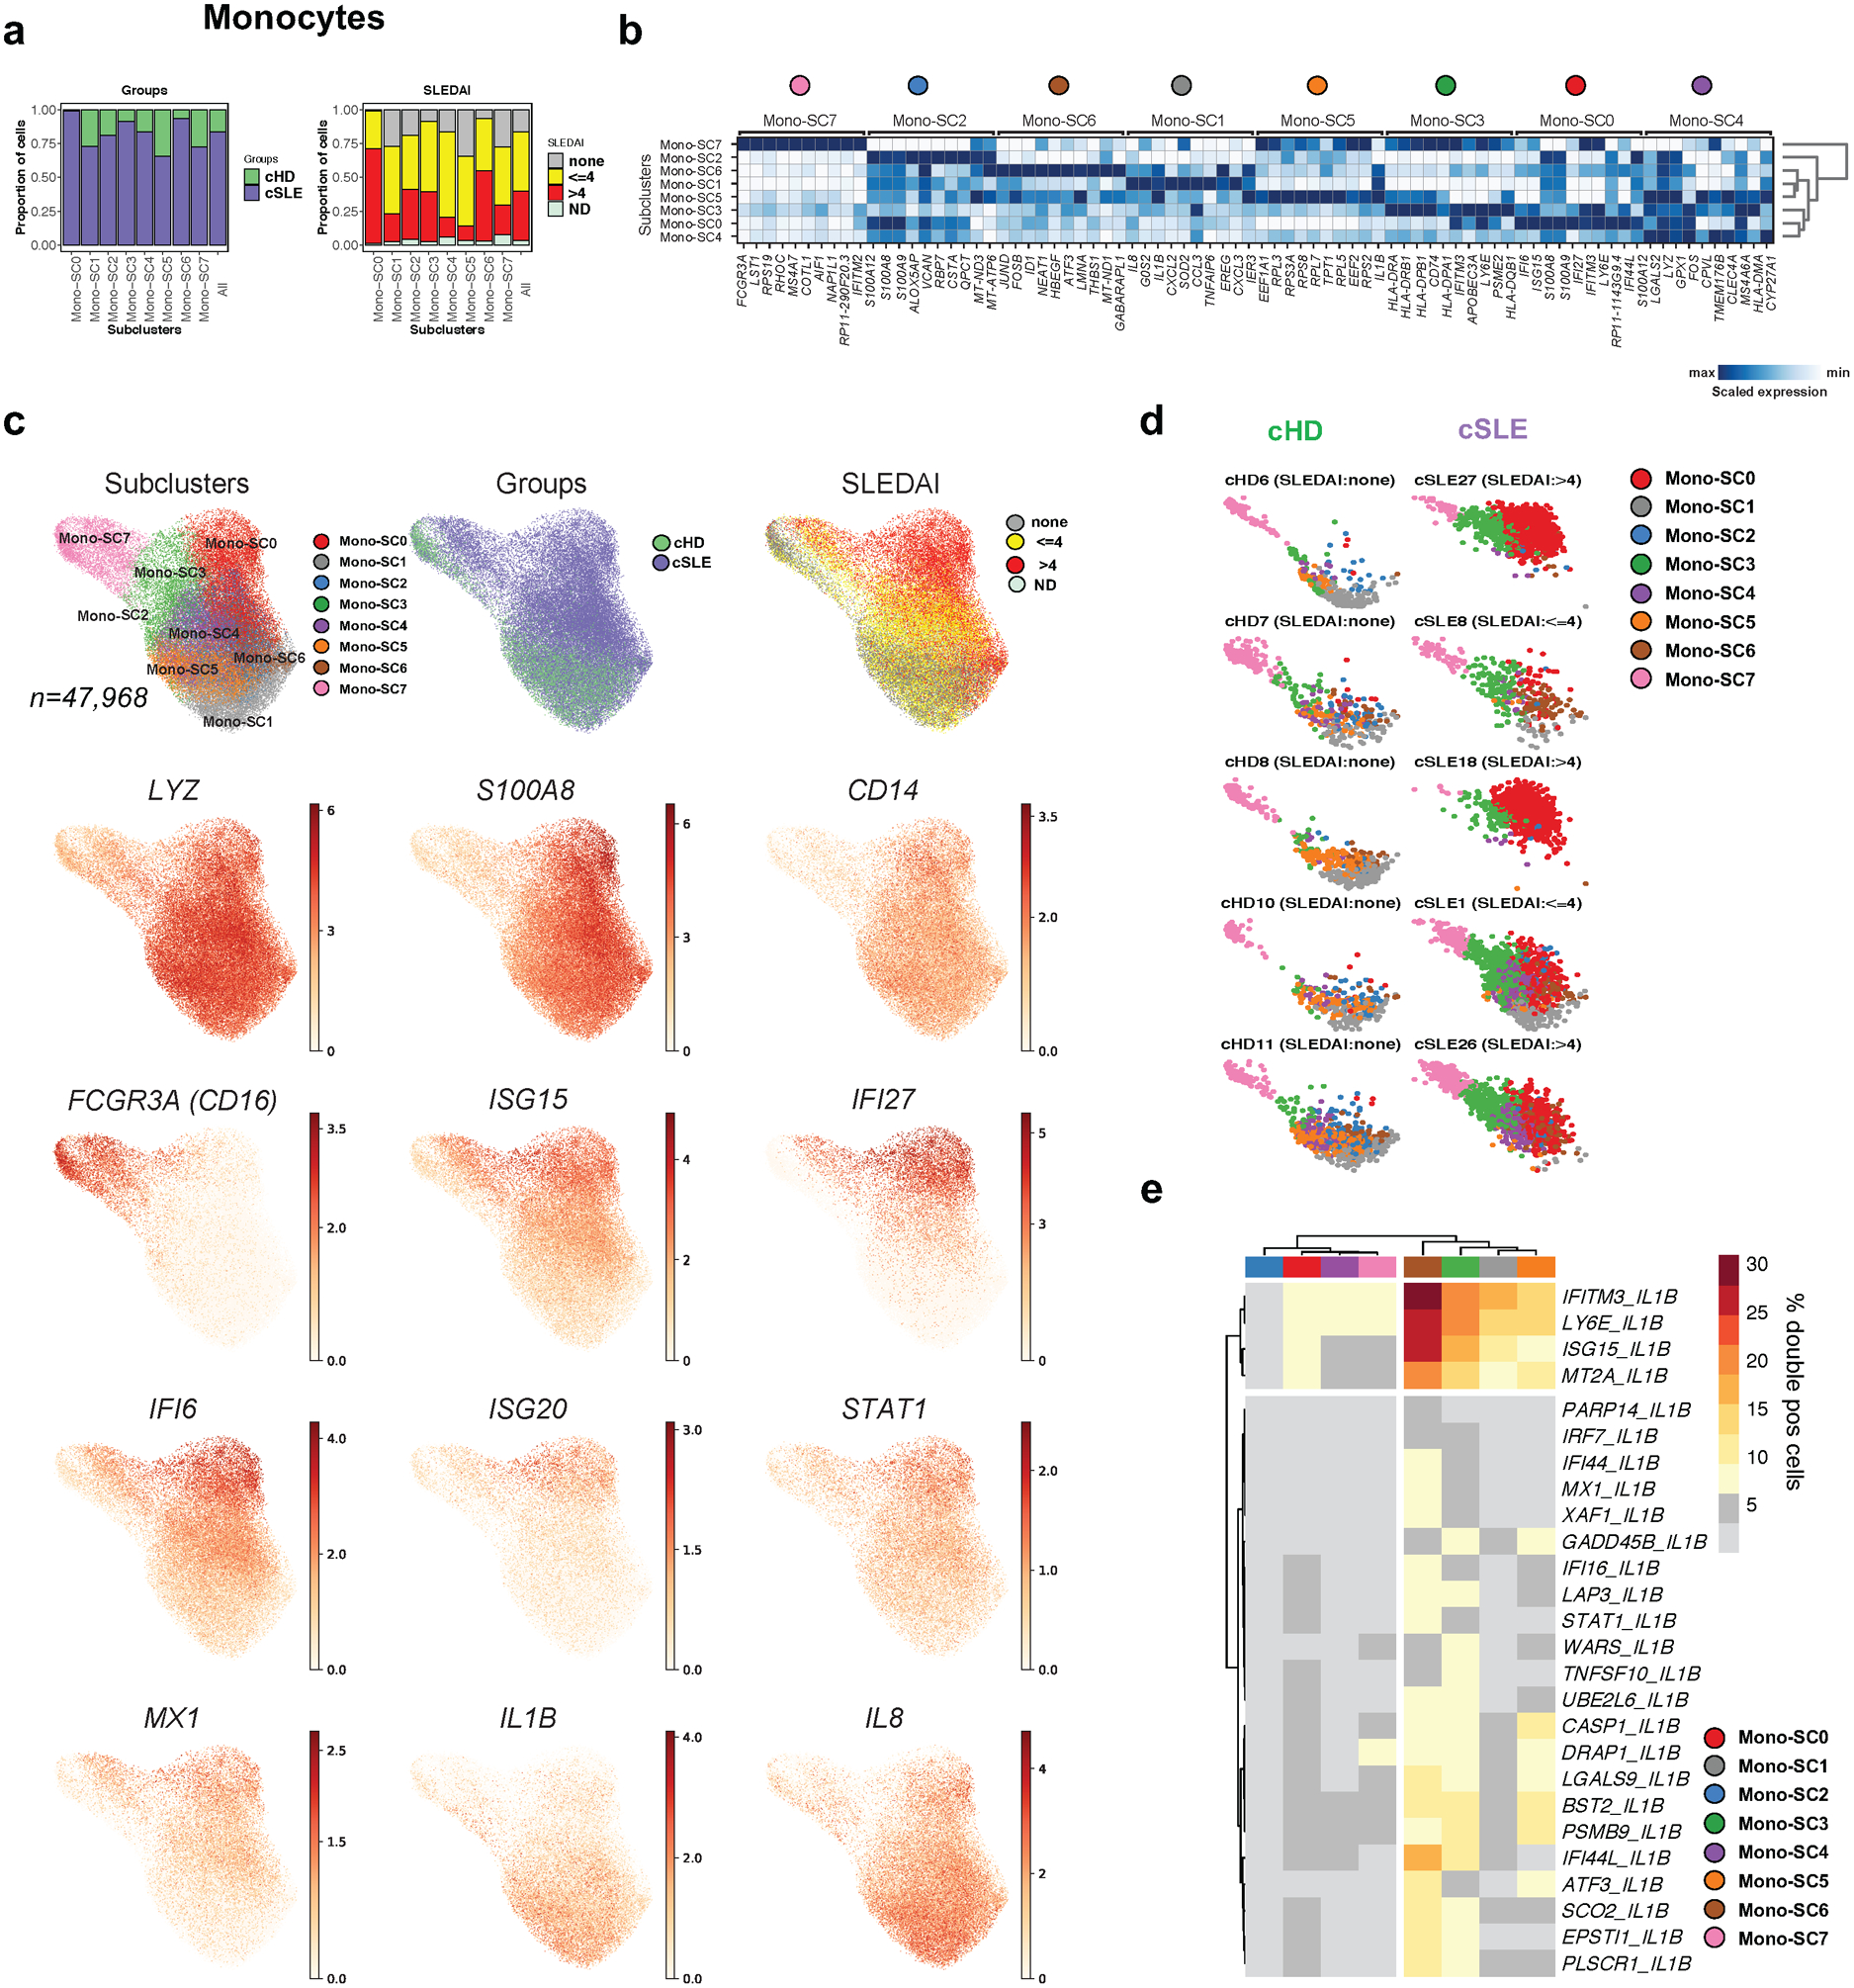
(a). Bar plot highlighting cell abundances across monocyte subclusters (Mono-SCs; n=8) for the cSLE and cHD groups (left panel) and SLEDAI categories (right panel).
(b). Heatmap representing scaled expression values of the top 10 genes defining each of the Mono-SC (n=8).
(c). UMAP plots representing Mono-SCs (n=8), groups (cSLE or cHD), SLEDAI categories and expression values of selected genes.
(d). Individual UMAP plots from five representative cHD (left) and cSLE (right, entire figure provided in Extended Data Fig. 3a) based on Mono-SCs (n=8). Each color represents a distinct SC.
(e). Heatmap showing the percentage of double positive cells (i.e. co-expressing “IL1B” and ISGs genes) across SCs (n=8, columns). For visualization purposes, only the clusters showing more than 5% of double positive cells have been considered.
Interleukin IL-1β (IL-1β) and Type I IFN mediate distinct inflammatory responses and cross-regulate each other within myeloid cells25. We quantified cells co-expressing IL1B and ISGs (n=155) across the eight Mono-SCs. Within Mono-SC6, an cSLE-expanded SCs, 30% cells co-expressed IFITM3 and IL1B, 26 % co-expressed ISG15 and IL1B, while only 10% of cells in the remaining Mono-SCs co-expressed both signatures (Fig. 2e).
ISG15, a negative regulator of type I interferon, was over-expressed within CD14+ monocytes from cSLE patients with high DA (Fig. 2c). Flow cytometry analysis of 17 cSLE and 14 cHD PBMCs confirmed higher ISG15 protein expression in CD14+ cells from cSLE patients (Extended Data Fig. 3b,c). Thus, together with an expansion of an ISGhi monocyte SC in patients with high DA, this analysis identifies a cSLE monocyte subset co-expressing ISGs and IL-1β.
SLE-restricted ISGhi pDC and cDC subclusters.
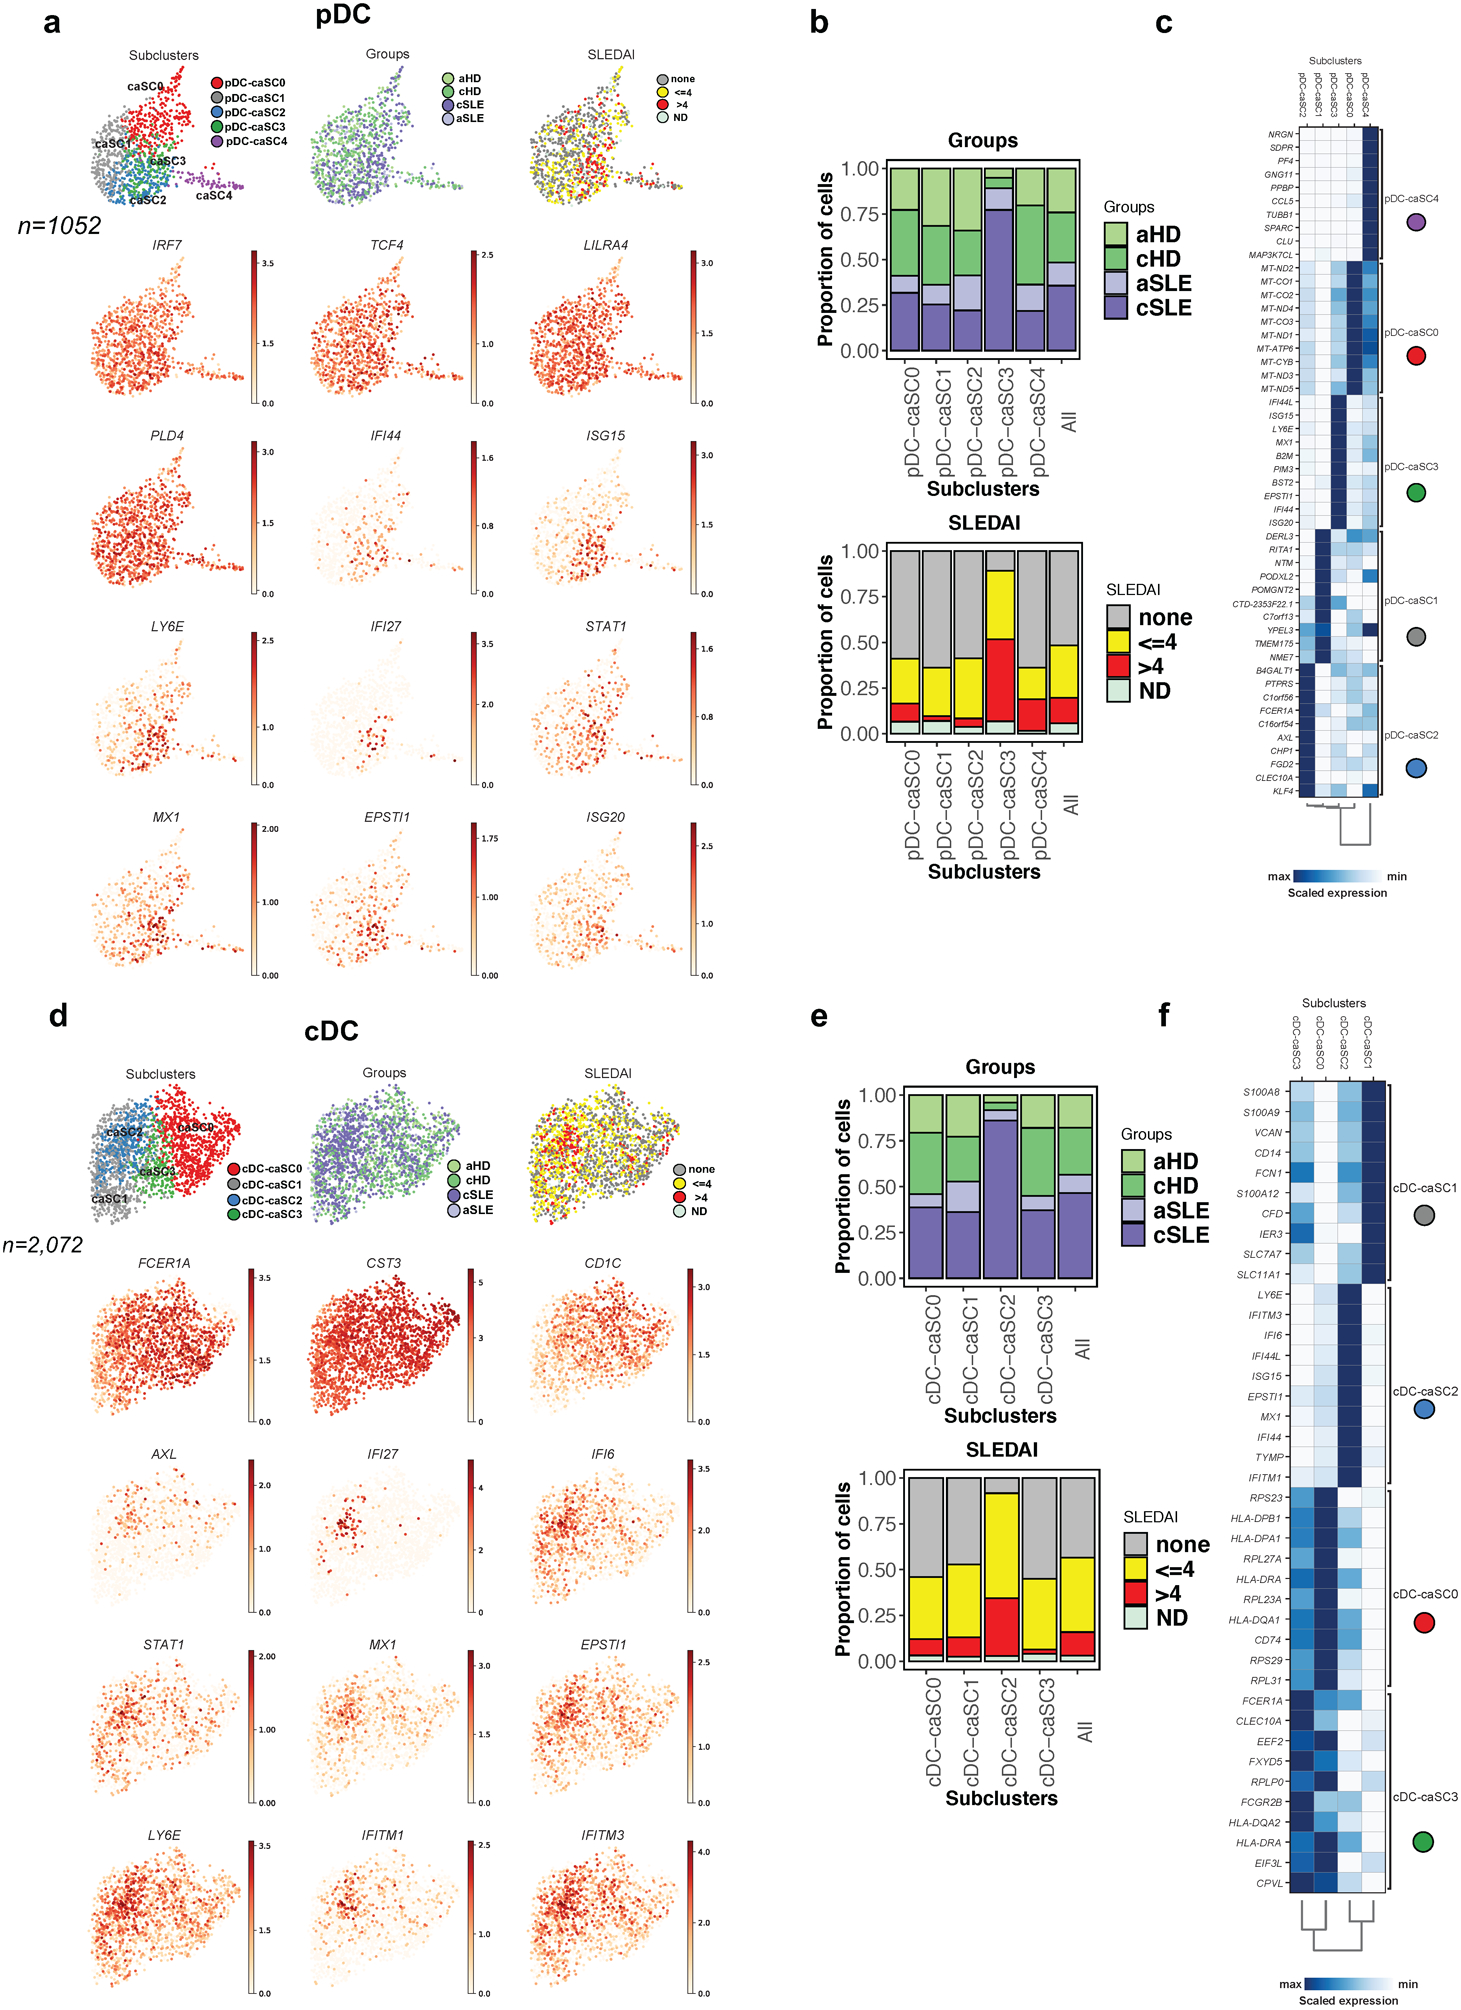
Perturbation of DC frequency and/or phenotype is a feature of SLE26–28. Thus, pDCs are underrepresented in SLE blood27,29,30 and this was confirmed by scRNAseq (n=372 in 33 SLE samples, n=283 in 11 HD samples; Fig. 1d, p<0.05). Subclustering identified four pDC-SCs (pDC-SC0 to pDC-SC3), one of which was expanded in cSLE (pDC-SC1; Fig. 3a). Differential expression analysis revealed the up-regulation of ISGs in pDC-SC1 (Fig. 3b,c, Supplementary Table 2c). Thus, pDC-SC1, which represents 179 out of 655 cells, contributes to the SLE IFN signature.
Figure 3. Characterization of pDC and cDCs single cell landscape in cSLE.
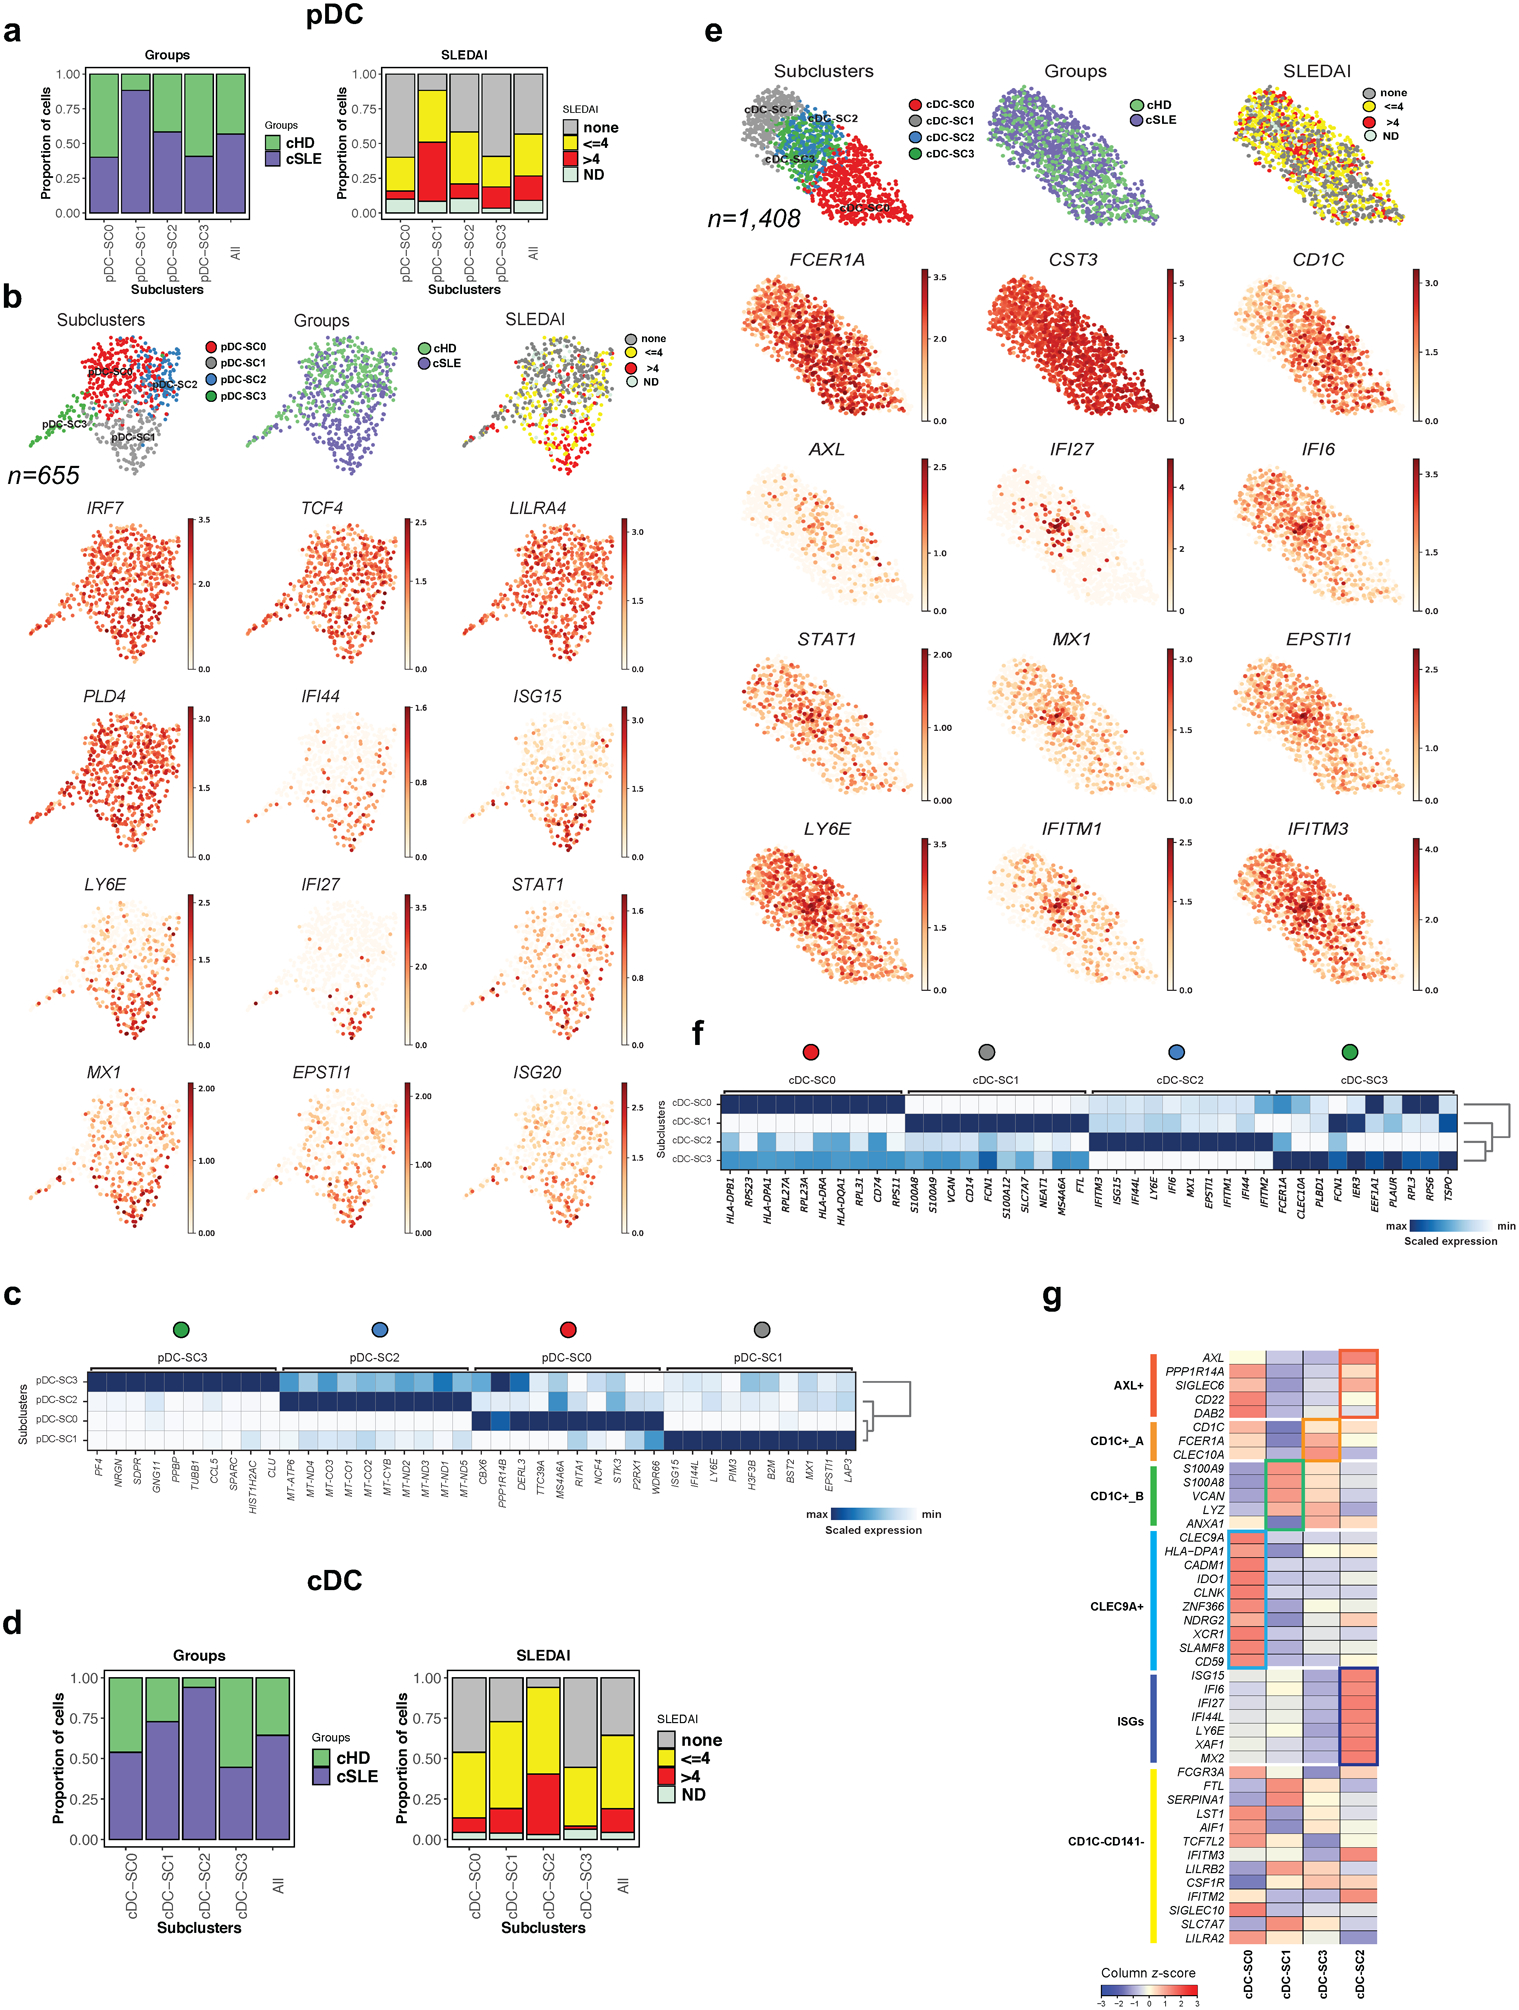
(a). Bar plot highlighting cell abundances across pDC-SCs (n=4) for the cSLE and cHD groups (left panel) and SLEDAI categories (right panel).
(b). UMAP plots representing pDC-SCs (n=4), groups (cSLE or cHD), SLEDAI categories and expression values of selected genes.
(c). Heatmap representing scaled expression values of the top 10 genes defining each of the pDC-SC (n=4, see methods).
(d). Bar plot highlighting cell abundances across cDC-SCs (n=4) for the cSLE and cHD groups (left panel) and SLEDAI categories (right panel).
(e). UMAP plots representing cDC-SCs (n=4), groups (cSLE or cHD), SLEDAI categories and expression values of selected genes.
(f). Heatmap representing scaled expression values of the top 10 genes defining each of the cDC-SC (n=4, see methods).
(g). Heat map representing the scaled average expression of DC markers based on previous study32 and of ISGs across the four cDC-SCs. ISG, Interferon Stimulated-Genes.
cDCs were represented in both cSLE (n= 907) and cHD (n=501). Subclustering generated four cDC-SCs (cDC-SC0 to cDC-SC3), of which only cDC-SC2 (n=270) was expanded in cSLE patients from all SLEDAI categories (Fig. 3d). Genes defining unique DC subpopulations mapped to the cDC-SCs (Fig. 3e–f)31. Thus, cDC-SC0 corresponded to CLEC9A+ DC (DC1), cDC-SC1 to CD1C+ B (DC3), cDC-SC3 to CD1C+ A (DC2) and cDC-SC2 to AXL+SIGLEC6+ DC (DC5), the main ISG-expressing subset (Fig. 3g, Supplementary Table 2d). CD1C−CD14−(DC4) cells32 were not clearly defined . Increased expression of ISGs is therefore not a universal feature of cSLE DCs but of discrete subclusters within both pDCs and cDCs.
An SLE-restricted B cell subcluster exhibits a DN2 phenotype.
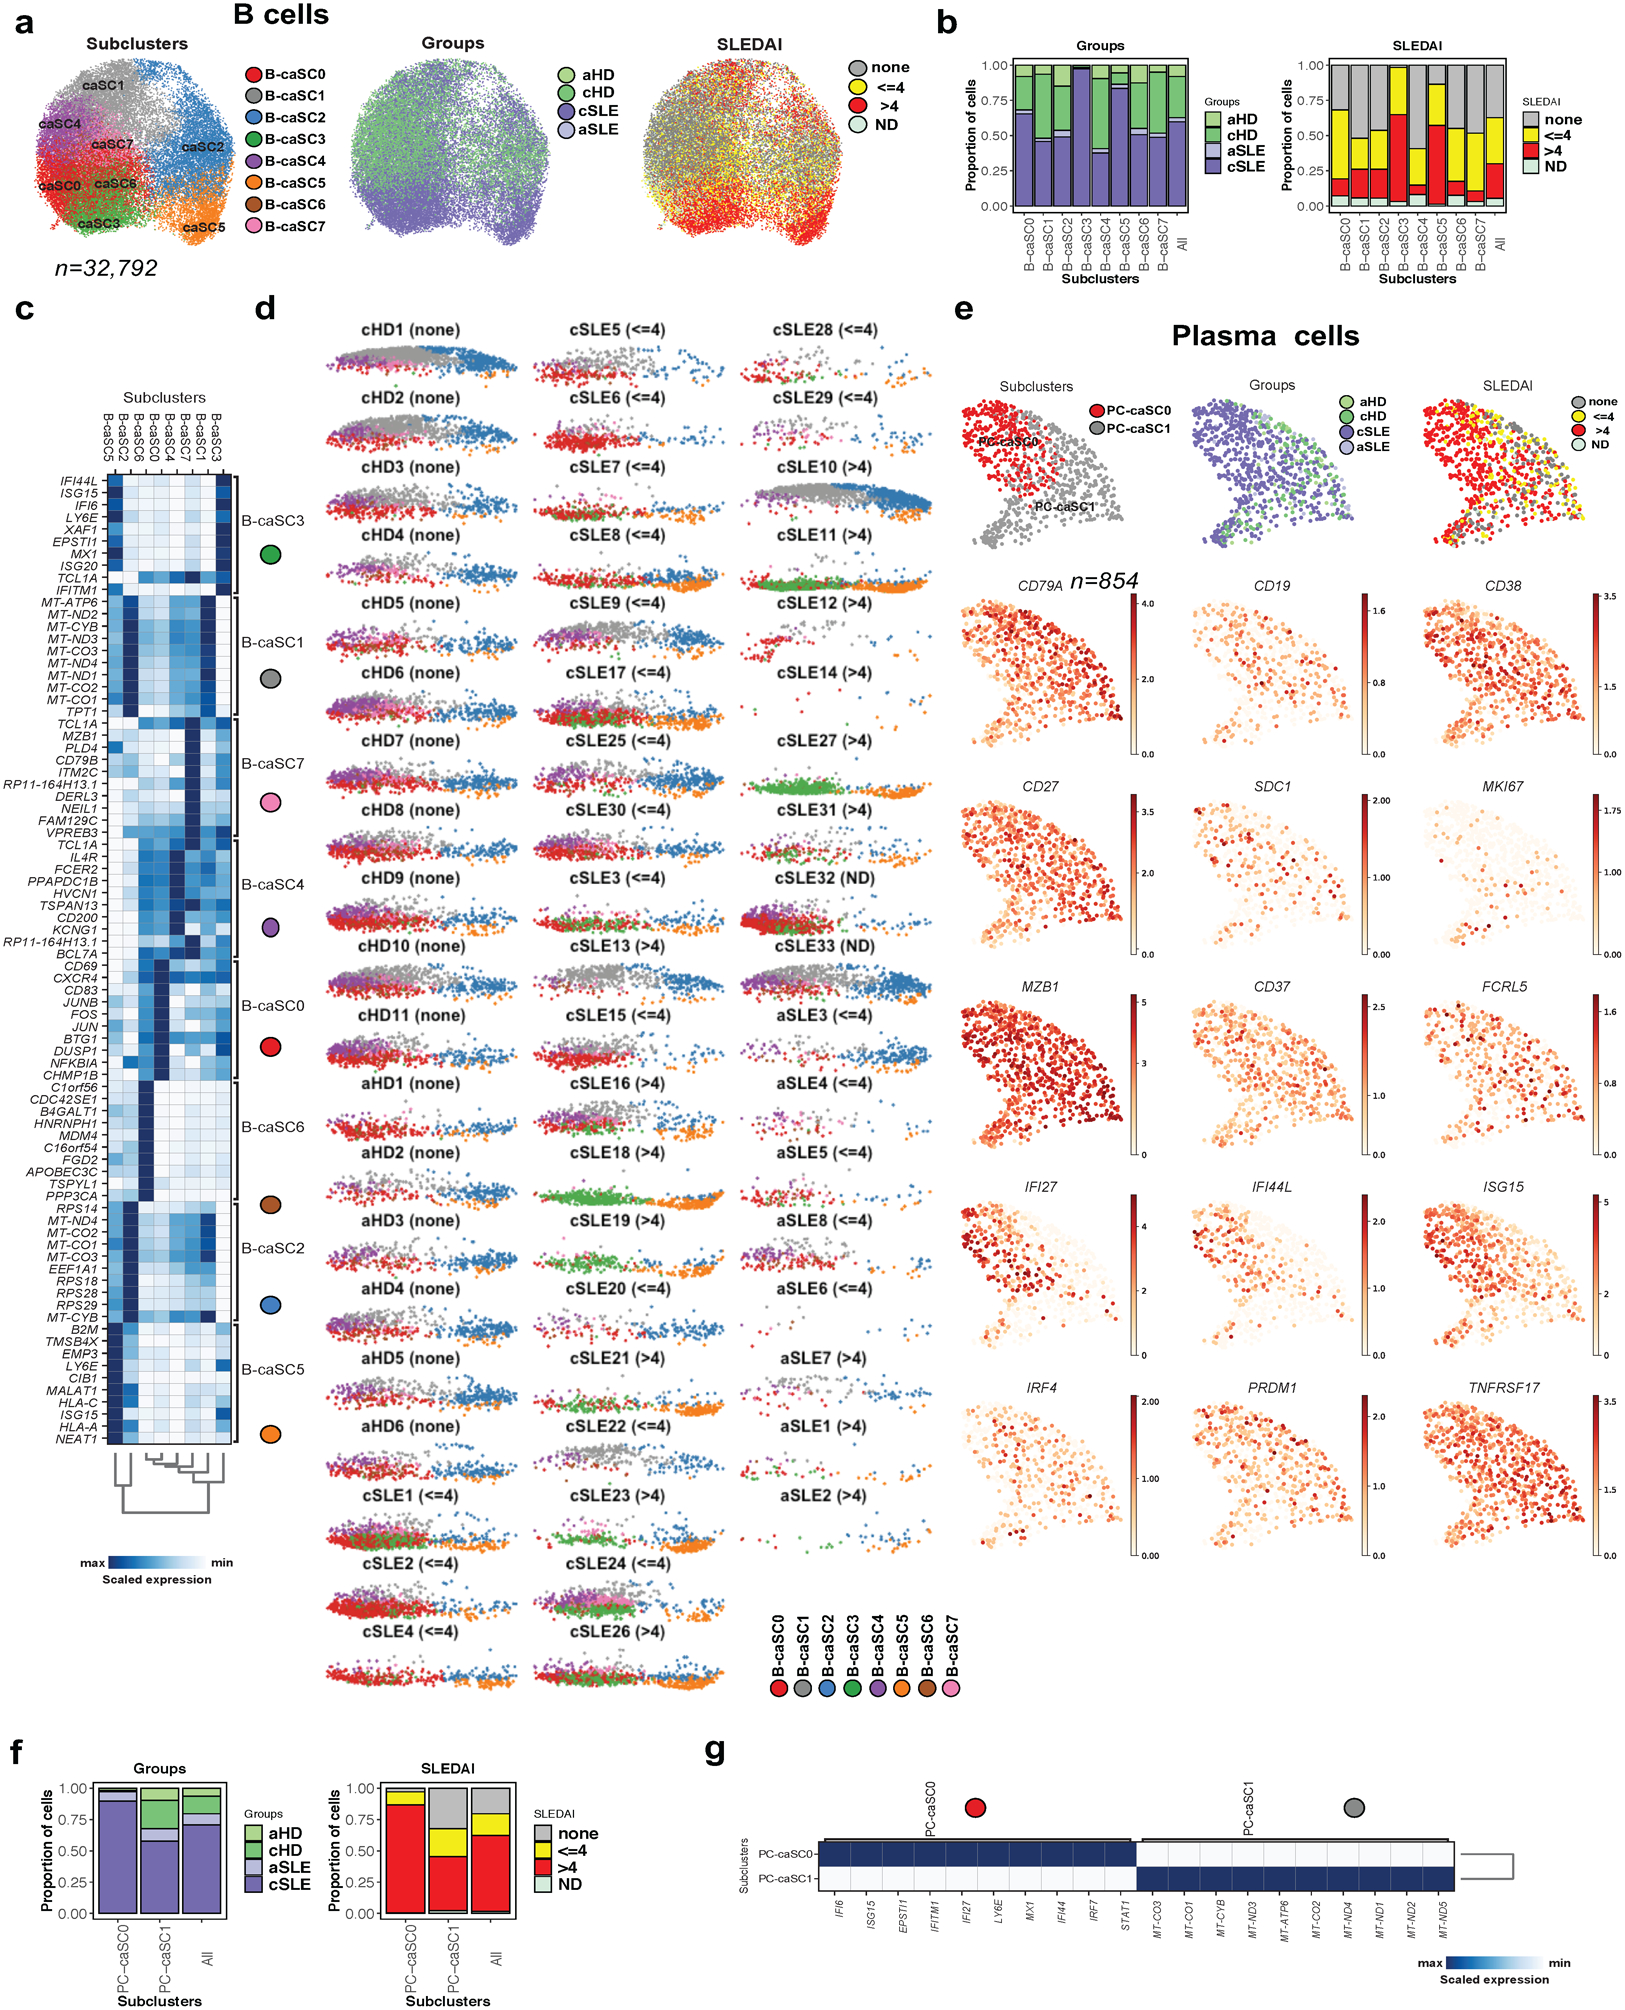
SLE patients carry major blood B cell alterations, including expansion of PCs, naïve B cells with an activated phenotype32–34 and extrafollicular, double-negative switched memory cells (DN2)35, a distinct subset within age-associated B cells (ABCs)36. Our analysis identified two B cell clusters displaying similar frequencies in cSLE and cHD. Subclustering (n=29,240) led to seven SCs (SC0 to SC6), three of which were expanded in cSLE (B-SC1, n= 5,989; 87% cSLE, B-SC4, n= 3,202; 80% cSLE and B-SC5, n= 2,101; 93% cSLE; Fig. 4a). Differential analysis revealed that B-SC0 and B-SC3 expressed the memory marker CD27, while B-SC1 co-expressed the activation marker CD69 (Supplementary Table 2e). ISG expression was restricted to B-SC5, B-SC4 and to a lesser extent B-SC1, the three cSLE-expanded SCs (Fig. 4b & Supplementary Table 2e). B-SC5 also exhibited antigen presenting-associated genes and upregulated CD19 and MS4A1 (CD20), while lacking expression of CR2 (CD21). B-SC5 exclusively expressed TBX21 (T-bet), ITGAX (CD11c), FGR, TFEC, FCRL2, FCRL3 and FCRL5, as well as IL10RA, supporting its extrafollicular, potentially autoreactive, DN2 phenotype35 (Fig. 4c).
Figure 4. B cells reveals the presence of double-negative (CD19+ IgD− CD27− and CXCR5−) B cells in cSLE.
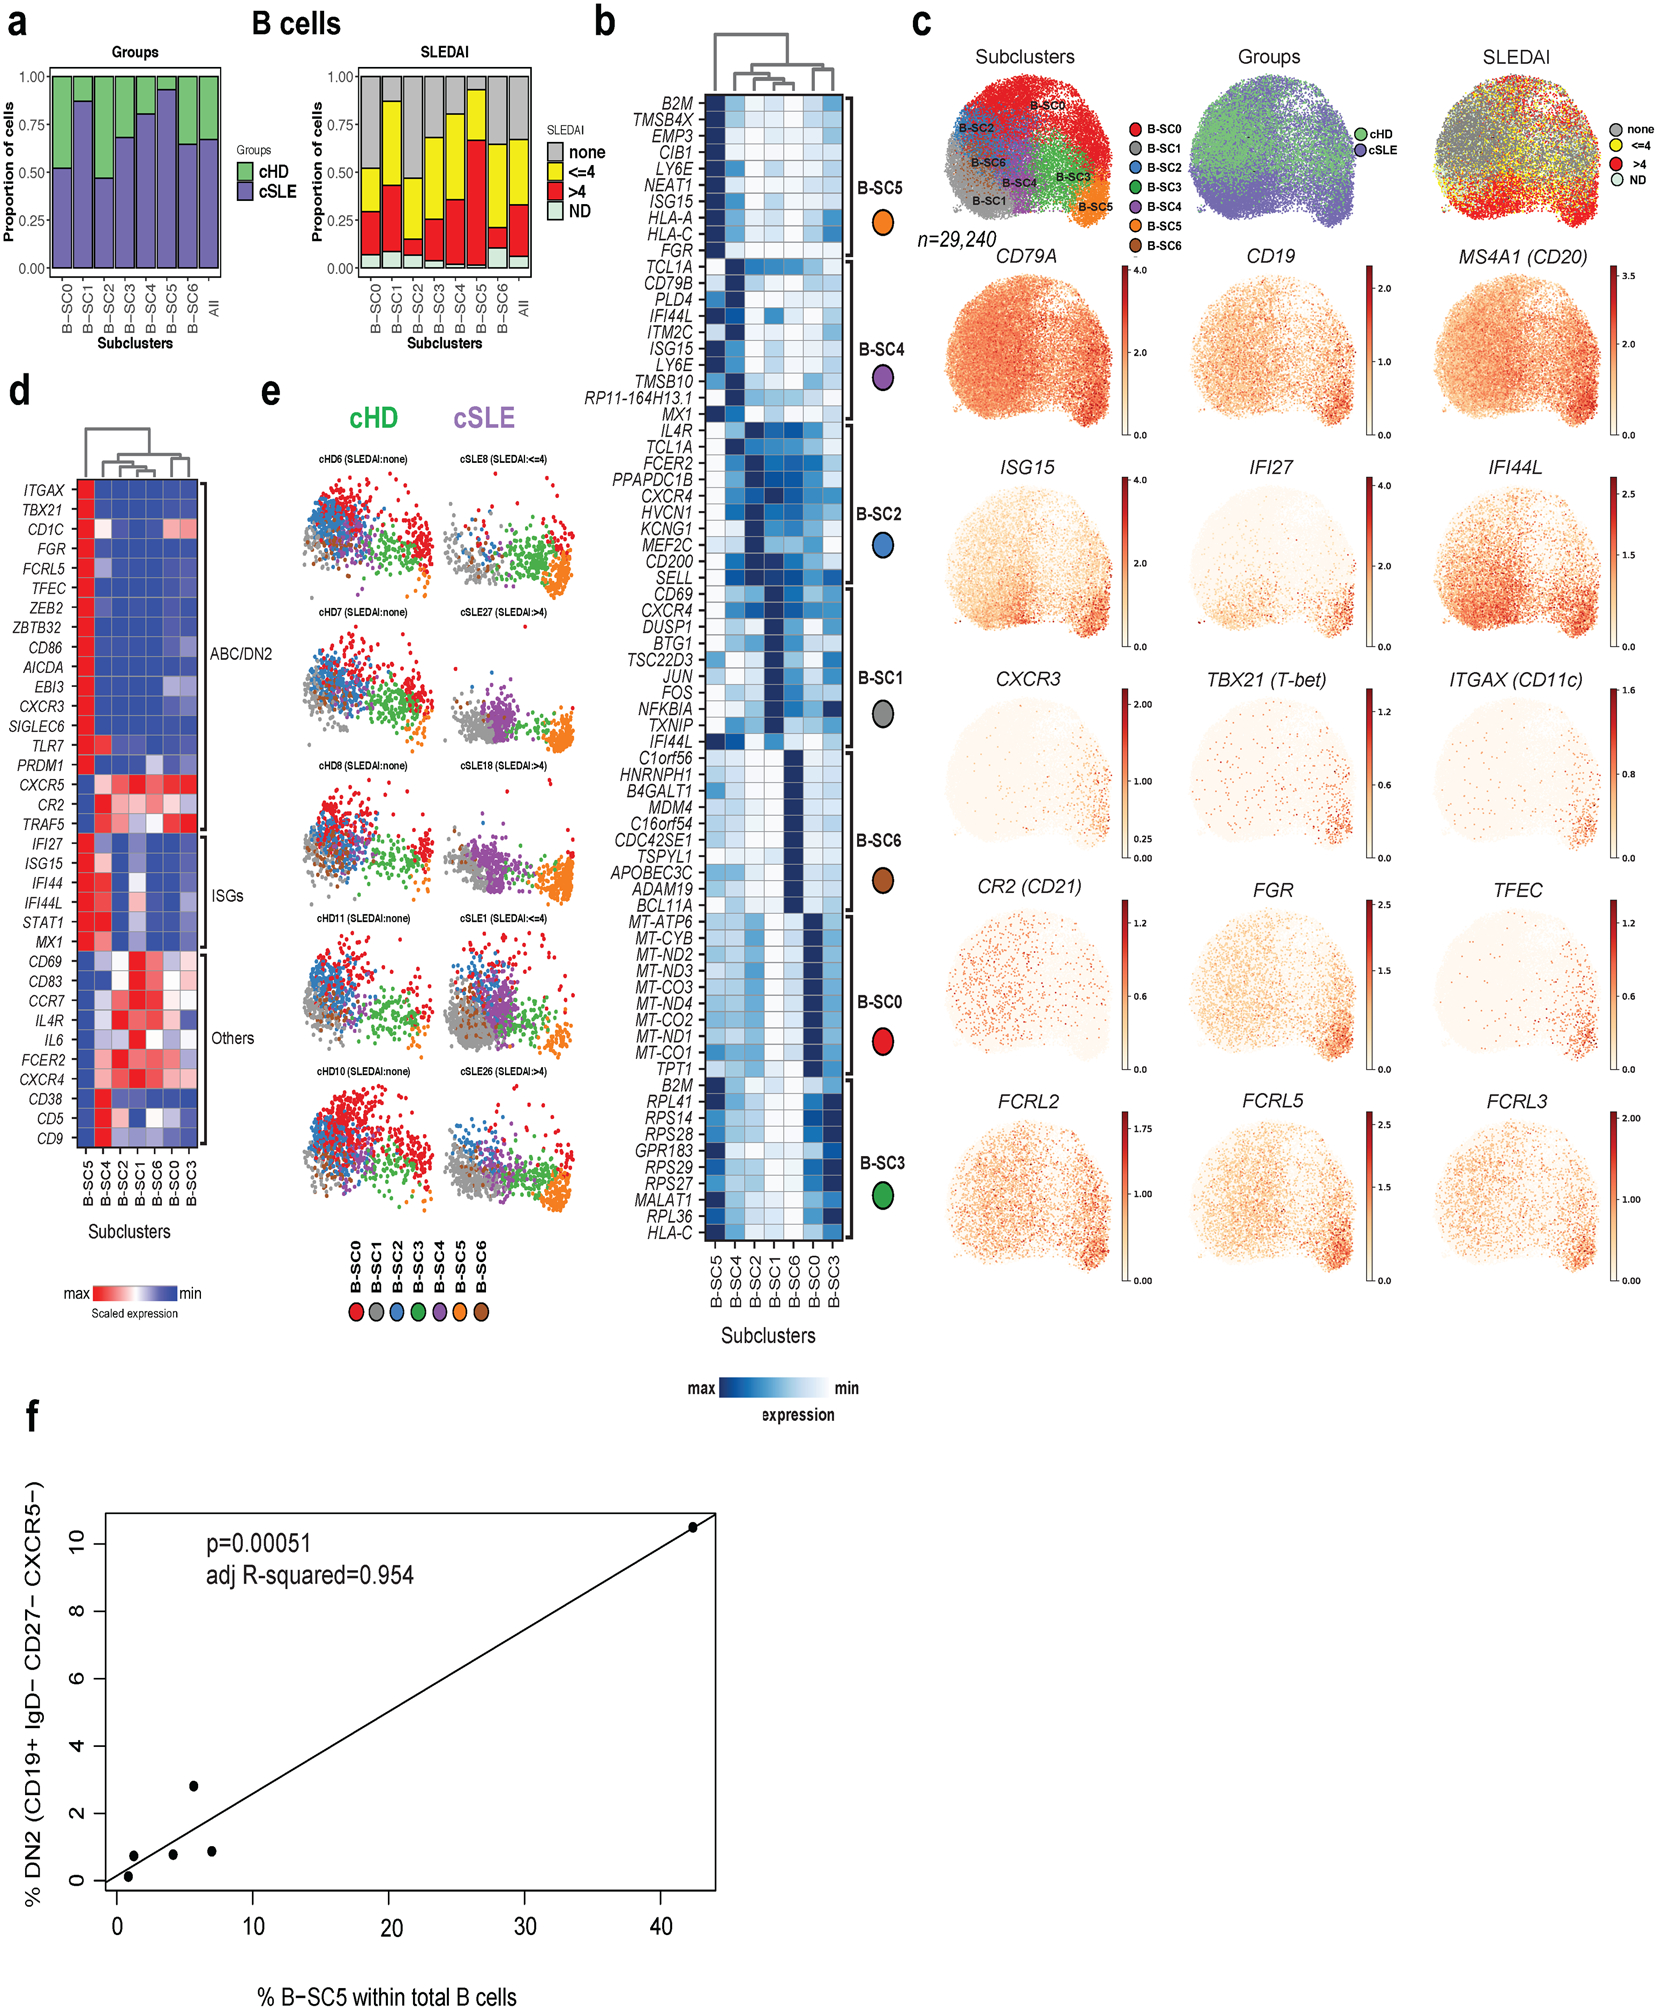
(a). Bar plot highlighting cell abundances across B-SCs (n=7) for the cSLE and cHD groups (left panel) and SLEDAI categories (right panel).
(b). Heatmap representing scaled expression values of the top 10 genes defining each of the B-SC (n=7, see methods).
(c). UMAP plots representing B-SCs (n=7), groups (cSLE or cHD), SLEDAI categories and expression values of selected genes.
(d). Heatmap representing scaled expression values of DN2, selected ISGs and other B cell gene markers across the seven B-SCs.
(e). Individual UMAP plots from five representative cHD (upper panel) and cSLE (lower panel, entire figure in Extended Data Fig. 3d) based on B-SCs (n=7). Each color represents a distinct SC.
(f). Correlation analysis comparing the percentage of DN2 (CD19+ IgD− CD27− and CXCR5−) as quantified by flow cytometry, with the percentage of B-SC5 within the total B cells as quantified by scRNA-seq.
B-SC4 and B-SC5 expressed the highest levels of TLR7 (Fig. 4d). B-SC4 expressed TCL1A, CD79A and TMSB10, as well as CD38, CD5 and CD9 (Fig. 4b and Supplementary Table 2e). Therefore, this population might represent a mixture of early bone marrow transitional emigrants (T1-T3) plus activated naïve B cells37, which are precursors of extrafollicular DN2 cells36.
Individual profiling (or UMAP plots) revealed homogeneity across cHD, contrasting with the heterogeneity of cSLE. B-SC5, barely detectable in cHD, was present in >50% (18/33) of cSLE patients (8/18 and 9/13 of cSLE patients with SLEDAI <=4 and >4, respectively; Fig. 4e and Extended Data Fig. 3d). DN2 cell frequency by flow cytometry (CD19+ IgD– CD27– CXCR5–), correlated with scRNA-seq data (p<0001 and R2=0.954; Fig.4f)
Despite their known sensitivity to cryopreservation, we detected 724 PCs (17% and 83% in cHD and cSLE patients, respectively). PCs contributed a large number of ISGs and expressed the highest levels of IFNAR. Further subclustering separated PCs into two main SCs (Fig.5a). PC-SC0, (n=451) was ISGhi and expanded in cSLE, while PC-SC1 (n=273) was ISGlo and expressed higher levels of mitochondrial protein-encoding genes (Fig. 5b,c; Supplementary Table 2f). Thus, cSLE is characterized by expansion of an ISGhi DN2 B cell subset and ISGhi plasma cells.
Figure 5. cSLE plasmablast/plasma cells analysis revealed an expansion of ISGhi subcluster.

(a). Bar plot highlighting cell abundances across PC-SCs (n=2) for the cSLE and cHD groups (left panel) and SLEDAI categories (right panel).
(b). Heatmap representing scaled expression values of the top 10 genes defining each of the PC-SC (n=2, see methods).
(c). UMAP plots representing PC-SCs (n=2), groups (cSLE or cHD), SLEDAI categories and expression values of selected genes.
SLE-restricted ISGhi and cytotoxic T cell subclusters.
T cell alterations are common in SLE38,39e . T cells represented 61% of PBMCs in our dataset. Combining all T cell clusters defined by CD3E and CD4 or CD8 expression yielded 158,914 cells (67% ascribed to cSLE). Subclustering yielded six T-SCs (T-SC0 to T-SC5), including one considerably expanded in cSLE (T-SC4, n=13,420 cells; 97% cSLE; Fig. 6a). Differential expression analysis highlighted the up-regulation of ISGs in T-SC4 (Fig. 6b and Supplementary Table 2g). Individual profiling revealed homogeneity across 11 cHD, contrasting with the heterogeneity of cSLE samples. While absent from cHD, ISGhi T-SC4 was present in 23/33 cSLE (11/18 and 12/13 cSLE with SLEDAI <=4 and >4, respectively; Fig. 6c and Extended Data Fig. 4a).
Figure 6. cSLE T cells analysis revealed an expansion of ISGhi subcluster.

(a). Bar plot highlighting the cell abundances across T-SCs (n=6) for cSLE and cHD groups (left panel) and SLEDAI categories (right panel).
(b). Heatmap representing scaled expression values of the top 10 genes defining each of the T-SC (n=6; c).
(c). Individual UMAP plots from five representative cHD (left) and cSLE (right, entire figure in Extended Data Fig. 4a) based on T-SCs (n=6). Each color represents a distinct SC.
(d). Heat map representing the scaled average expression of T cell lineage markers (columns) across the T-SCs (rows; n=6).
(e). UMAP plots representing T-SCs (n=6), groups (cSLE or cHD), SLEDAI categories and expression values of selected genes.
T-SC0, 1 and 4 displayed naïve T cell markers (e.g. CCR7 or SELL), while T-SC2, 3 and 5, exhibited memory markers including ‘S100A4’. T-SC0 displayed higher ribosomal gene expression but also higher counts of non-ribosomal transcripts, suggesting that this transcriptional program was not a reflect of cell damage. Cytotoxicity-related markers (PRF1, GZMB/A, KLRG1) were detected in two CD8+ T cells SCs, namely T-SC2 and T-SC5. T-SC5 expressed TH17 markers (RORC, IL17RE), while T-SC3 exhibited markers of TH2 (GATA3, CCR6) and regulatory T cells (FOXP3; Fig. 6d,e). T-SC4 represented 0.2% of cHD and 7.3% of cSLE T cells and included CD4+ T cells mapping to the ISGhi C11_CD4+_T cluster, which was expanded in cSLE.
In addition to ISGs, cSLE cells up-regulated cytotoxic genes in two CD8+ T-SCs (Fig. 6d,e). Flow cytometry analysis of PBMCs from 17 cSLE and 14 matched cHD samples revealed high expression of cytotoxic proteins (Granzyme B and Perforin) in cSLE CD8+ T cells but did not reach the resolution of scRNA-seq (Extended Data Fig. 4b,c). Taken together, these data reveal the presence of unique subpopulations of cSLE T cells expressing ISGs, and a strong cytotoxic program in a fraction of cSLE CD8+ T cells.
An SLE-restricted ISGhi NK cell subcluster.
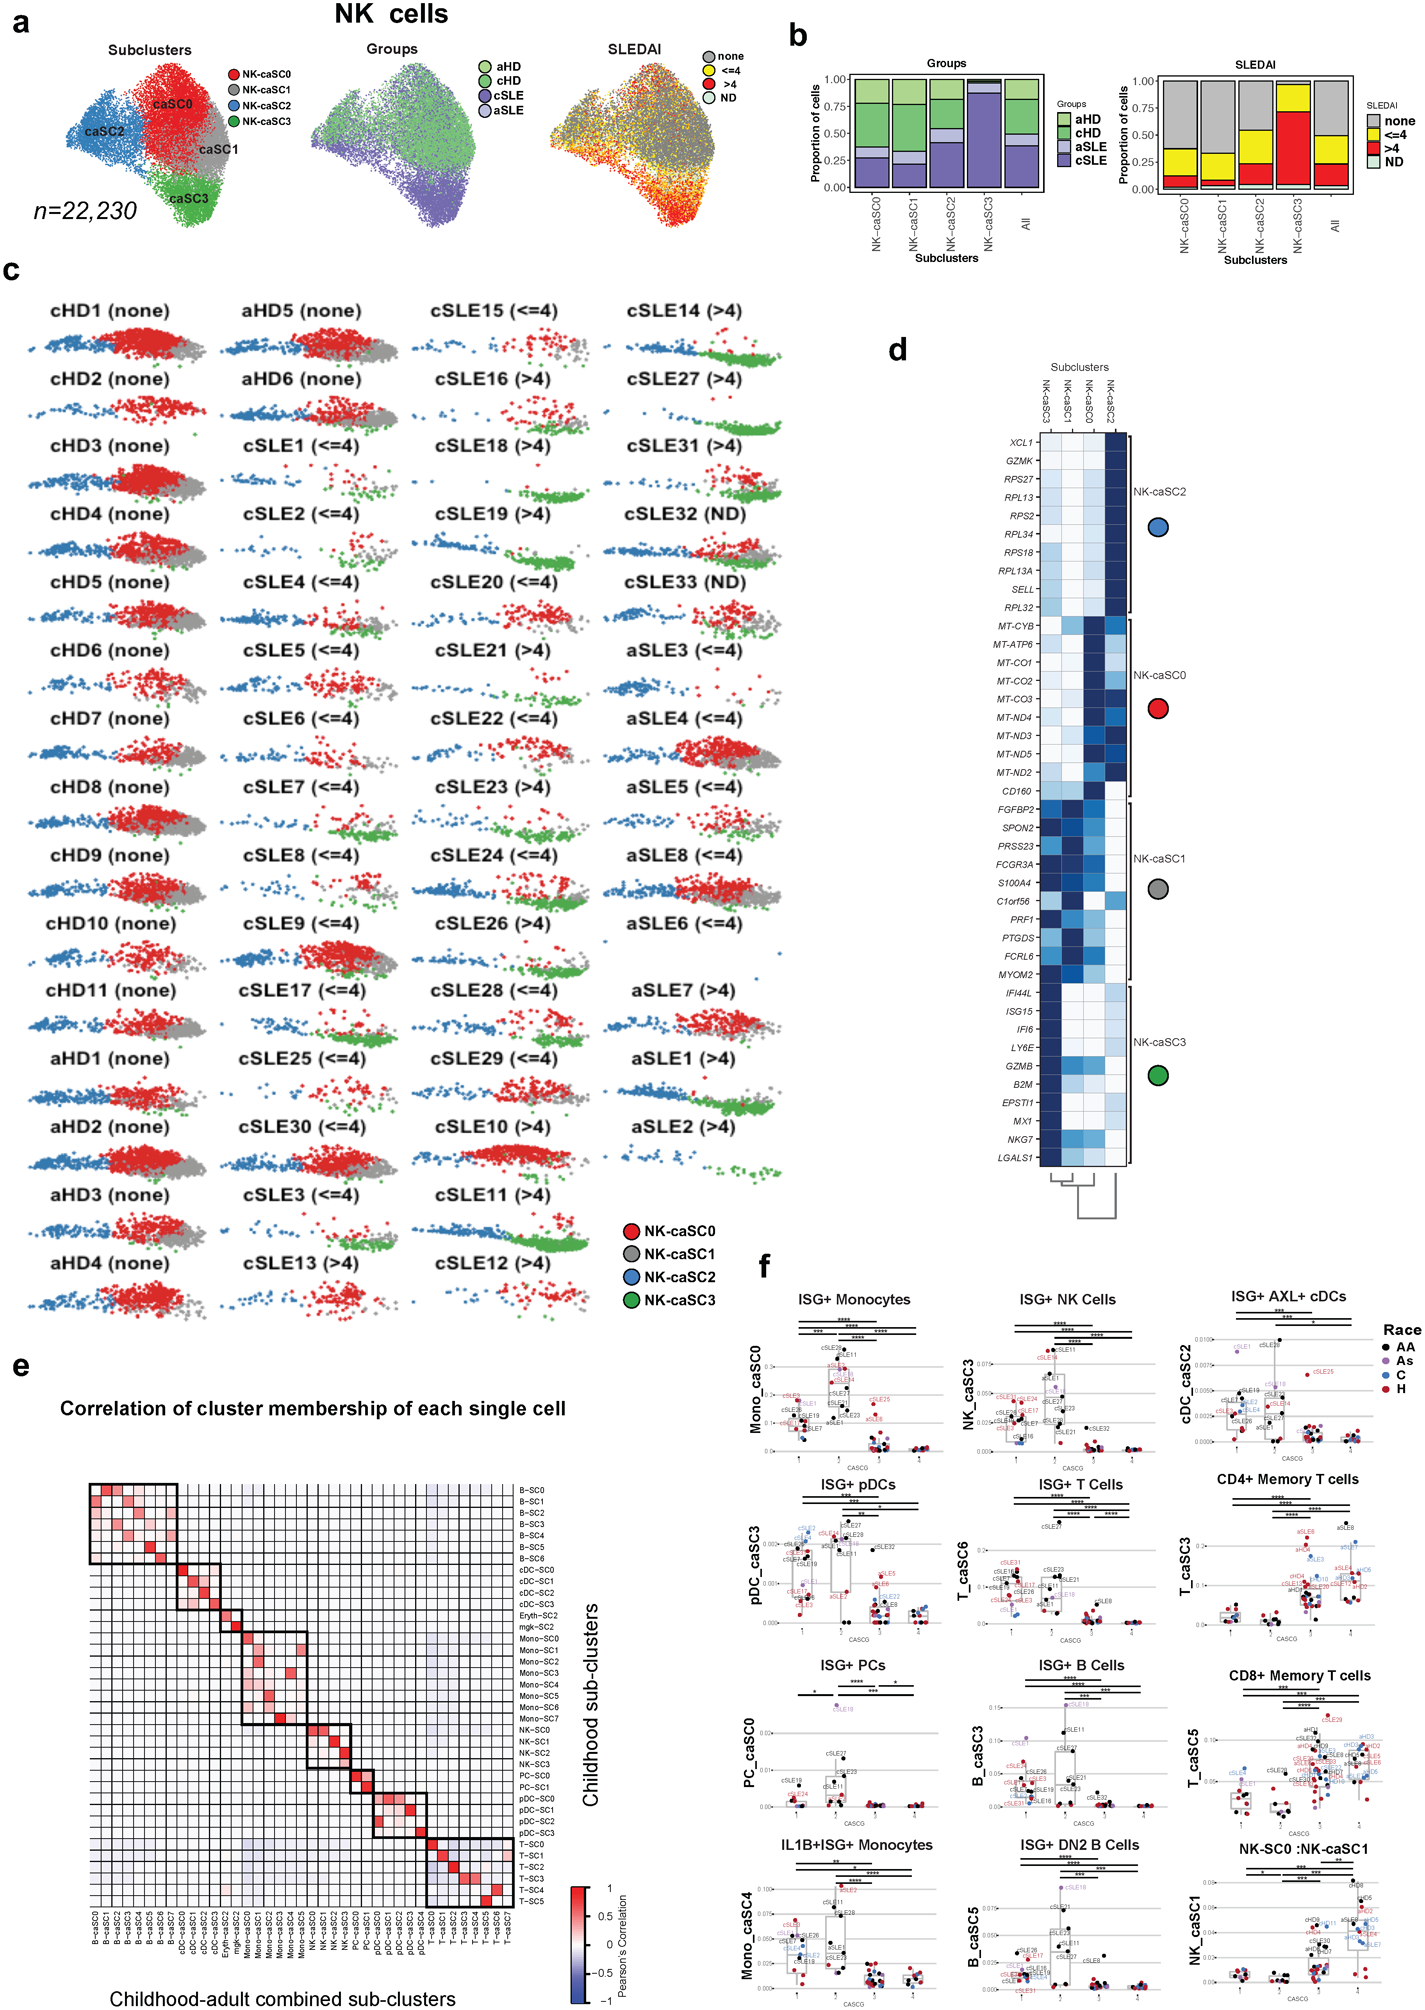
NK cells have not been thoroughly studied in SLE. Our analysis revealed the presence of 14,929 NK cells (54% cSLE, p<0.05; C7 in Fig. 1e), which after subclustering generated four SCs (NK-SC0 to NK-SC3). NK-SC2 (n= 3,206; 97% cSLE) and NK-SC3 (n= 360; 86% cSLE) were expanded in cSLE (Fig. 7a) and both SCs up-regulated ISGs and cytotoxicity-encoding genes (Fig. 7b, Supplementary Table 2h). All the SCs expressed NCAM1 (CD56) and ITGAM (CD11b). NK-SC1 was characterized by the up-regulation of XCL1, XCL2 and CD27 genes, whereas the remaining NK-SCs up-regulated FCGR3A (CD16); (Fig. 7b,c).
Figure 7. cSLE NK cells analysis revealed an expansion of ISGhi subcluster.

(a). Bar plot highlighting the cSLE and cHD groups (left panel) and SLEDAI categories (right panel) cell abundances across the four NK-SCs.
(b). Heatmap representing scaled expression values of the top 10 genes defining each of the NK-SC (n=4).
(c). UMAP plots representing NK-SCs (n=4), groups (cSLE or cHD), SLEDAI categories as well as expression values of selected genes.
Profiling of the 44 subjects based on the four NK-SCs revealed the homogeneity of cHD contrasting with the heterogeneity of cSLE samples. While absent from cHD, the ISGhi NK-SC2 was present in 19/33 of cSLE (8/18 and 10/13 cSLE with SLEDAI <=4 and >4, respectively; Extended Data Fig. 4d). ISG15 and CD56 protein expression was increased in two out of five cSLE patients (Extended Data Fig. 4e). Thus, our data identifies a potentially pathogenic NK cell compartment in cSLE.
Enrichment of genes associated with LRMDs in distinct PBMC SCs.
We next addressed the cellular distribution of LRMD-associated genes across the different PBMC SCs (Fig. 8a). These encode proteins involved in a variety of pathways connected to SLE pathogenesis, including regulation of IFN in different cell types (BLK, BANK1, IFIH1, ACP5), early B cell tolerance (PRKCD), lymphoid and DC development (IKZF1), extra- and intra-cellular degradation of nucleic acids (DNASE1, DNASE1L3, TREX1, RNASEH2A), nucleic acid editing (ADAR, SAMHD1) or downstream signaling (TMEM173), and early complement component activation (C1QA-C, C1R and C2)13,40. Except for complement components, the highest density and expression levels of LRMD-encoding genes were found in cDCs and pDCs, followed by PCs, discrete SCs of B cells, especially B-SC5, and NK-SC3, the smallest NK SC41. Two monocyte SCs (SC7 and SC3) expressed the highest level of early complement components as well as of antigen presentation-related genes. Finally, C1R expression was detected in PCs and to a lower extent in NK-SC3. These data therefore highlights the increased expression of monogenic lupus-related genes in antigen presenting cells.
Figure 8. Subcluster-based clinical stratification of children and adult cohorts.

(a). Heatmap representing scaled expression values of lupus related monogenic disorder (LRMD)-associated genes (n=19), across the 37 subclusters (SCs).
(b). Heat map representing frequencies of SCs (n=37) from childhood cohort, across cSLE (n=33, in purple) and cHD (n=11, in green) samples. Groups (cHD and cSLE), race (African American; AA, Hispanic; H Asian; As and Caucasian; C), mycophenolate mofetil (MMF) treatment and SLEDAI categories are indicated by color on the column-side key. Components of SLEDAI score on the visit date for SLE patients are color-coded on the bottom. Six main groups of samples are generated and denoted as subcluster groups (SCGs). Euclidian distance and ward.D2 clustering algorithm were used.
(c). Overview of the pipeline. Raw data from cSLE (n=33; dark purple), aSLE (n=8; light purple), cHD (n=11; dark green) and aHD (n=6; light green) were first cleaned from the multiplets using Scrublet19, then merged together, resulting in a dataset containing ~ 333k PBMCs. After batch correction, the Scanpy-based pipeline was then run (see Methods section).
(d). Heat map representing frequencies of subclusters (caSCs, n=39) generated from childhood-adult combined cohorts across cSLE (n=33), aSLE (n=8), cHD (n=11) and aHD (n=6). Groups, race, MMF, SLEDAI, and SCGs are indicated by color on the column-side key. SCG are the groups determined in Fig. 6b. SLEDAI components distribution on the visit date for SLE patients are color-coded on the bottom. SLEDAI scores for aSLE patients are denoted in the bottom of the SLEDAI component. Four main groups of samples are generated and denoted as Childhood-Adult combined Group (caSCG). Euclidian distance and ward.D2 clustering algorithm were used.
SC abundance classification reveals distinct cSLE groups
The hierarchical clustering of all cSLE (n=33) and cHD (n=11) samples according to overall SC abundance enabled the classification of six main SC Groups (SCG1 to SCG6; Fig. 8b). SCG1 through SCG4 included only cSLE patients, while SCG5 and SCG6 included both cSLE and cHD.
SCG1 included four cSLE patients (cSLE18, cSLE23, cSLE11 and cSLE11) displaying an expansion of ISGhi SCs (B-SC5 and B-SC4, PC-SC0, PC-SC1, T-SC4, NK-SC2 and-SC3; Mono-SC0). 5/8 SCs expressed high levels of LRMD-associated genes (Fig. 8a). All SCG1 patients had high DA scores due to musculoskeletal (arthritis), cutaneous (rash), systemic manifestations (fever, pleurisy, vasculitis) or leukopenia (Fig. 8a. bottom for SLEDAI components). SCG1 had the highest Erythrocyte Sedimentation Rate (ESR) and lowest complement (C3 and C4) levels (Extended Data Fig. 4f) among SCGs. Importantly, these patients were not receiving treatment with the broad immunosuppressant Micophenolate Mofetil (MMF) (Fig. 8a; top color panel for MMF). SCG2 included a single sample (cSLE12) with high DA (SLEDAI=8) and expansion of erythrocyte and Mgk SCs. SCG3 and SCG4 comprised eight and nine cSLE patients, respectively, with expansions of ISGhi cDC and pDC SCs (cDC-SC2 and pDC-SC1), together with non-ISGhi B cell SCs (B-SC1, -SC3 and -SC6), and monocyte SCs (Mono-SC3, -SC4 and -SC7). Of these, cDC-SC2, pDC-SC1, and Mono-SC3 and SC7 are enriched in LRMD-associated genes (Fig. 8a). 7/8 and 5/9 subjects in SCG3 and SCG4, respectively, were treated with MMF, (Fig. 8b). Finally, SCG5 (n=13; 4 cSLE and 9 cHD) and SCG6 (n=9; 7cSLE and 2 cHD), which included cSLE patients with the lowest SLEDAI (8/10) and all the cHDs, were enriched in ISGlo SCs including T cells (T-SC1 and -SC5) , B cells (B-SC0 and -SC2), NK cells (NK-SC0 and -SC1), pDCs (pDC-SC0 and -SC2, -SC3) and cDCs (cDC-SC0 and -SC3; Fig. 8b).
Taken together, these data identify cell subpopulations expanded in SLE patients with high disease activity and their sensitivity to conventional broad immunosuppression.
cSLE and aSLE exhibit similar transcriptional profiles
As no study has yet simultaneously assessed the blood transcriptome of cSLE and adult SLE (aSLE), we included an independent cohort of eight aSLE and six matched healthy controls (aHD). Five aSLE patients had low DA (SLEDAI ≤ 4) and three had high DA (SLEDAI > 4). Demographic, clinical and laboratory data are summarized in Supplementary Table 1a,b. After multiplets removal from each individual, adult and childhood raw data were combined resulting in a matrix of ~ 340k PBMCs (33 cSLE, 8 aSLE, 11cHD and 6 aHD; n=58; Fig. 8c), which respectively yielded 989, 1076, 974 and 936 genes per cell (Extended Data Fig. 5a). After correction for 10X runs batches20 (Extended Data Fig. 5b,c), unsupervised clustering revealed 21 distinct clusters (Extended Data Fig. 5d,e; Supplementary Table 3a).
Monocyte subclustering led to six Mono-caSCs, two of which were expanded in cSLE and aSLE (Mono-caSC0, n=18,578 and Mono-caSC4, n=5,586; Extended Data Fig. 6a,b). Differential analysis revealed that these two SCs were ISGhi (Extended Data Fig. 6c, Supplementary Table 3b). Individual profiling (UMAP plots) of the 58 subjects based on the six SCs revealed homogeneity across cHD and aHD, contrasting with the heterogeneity of cSLE and aSLE. ISGhi Mono-caSC0 and Mono-caSC4, nearly absent in healthy subjects, were present in 22/33 cSLE patients and 4/8 aSLE patients (Extended Data Fig. 6d), thus highlighting the similarity of cSLE and aSLE. Subclustering of pDCs revealed an expansion of an ISGhi pDC-caSC3 in both cSLE and aSLE (Extended Data Fig. 7a–c and Supplementary Table 3c). cDC analysis showed an expansion of ISGhi cDC-caSC2 in both cSLE and aSLE patients (Extended Data Fig. 7d–f). aSLE patients displayed remarkably lower B cell numbers compared to both cSLE and HDs (Extended Data Fig. 8a–c and Supplementary Table 3e). Finally, ISGhi PC-caSC0, T-caSC6 and NK-caSC3 were detected in both cSLE and aSLE (Extended Data Fig. 8d–f, Extended Data Fig. 9a–d, Extended Data Fig. 10a–d and Supplementary Table 3f–h). Overall, this single-cell data indicates that cSLE and aSLE share leukocyte transcriptomic profiles.
SC-based stratification of children and adult cohorts.
To further explore the patient stratification potential of PBMC scRNA-seq, we performed hierarchical clustering on combined childhood and adult matrices based on the caSC frequency in each subject (n=58). This yielded four childhood-adult SC groups (caSCG1 to caSCG4; Fig. 8d). One arm of the heatmap (caSCG1–2) included SLE patients exclusively (23 cSLE and 3 aSLE), while the other (caSCG3–4) encompassed 17 HD (11 cHD, 6 aHD) and 15 SLE patients (5 aSLE and 10 cSLE), 10 of whom had mild DA (Fig. 8d). As combining adult with childhood data resulted in different SC numbers (n=37 in cSLE vs. 39 in cSLE and aSLE combined) and composition, we addressed their connectivity by calculating SC-caSC correlation scores. This approach revealed a high correlation between ISGhi subsets in both the children-only and the combined datasets (Extended Data Fig. 10e). caSCG2, which included eight cSLE and two aSLE patients, classified patients with the highest disease burden (Fig. 8d, top and bottom for SLEDAI) and was characterized by the expansion of ISGhi caSCs. Furthermore, it included all cSLE patients previously classified as SCG1 (from Fig. 8b), 4/17 cSLE patients previously in SCG3–4, plus the two sickest aSLE patients. 7/10 caSCG2 patients were African-American (compared to 13/39 in the entire SLE group) and only 3/10 were on MMF. caSCG1 patients displayed an expansion of ISGhi SCs comparable to that of caSCG2 patients (Fig. 8d and Data Fig. 10f). However, ISGhi monocytes (Mono-caSC0) were less represented and ISGhi PCs (PC-caSC0) were absent. Most caSCG1 patients had a lower disease burden compared to caSCG2 patients, and larger fraction (10/16) were on MMF, a drug known to arrest PC development (Fig. 8b,d). In contrast, caSCG3–4 patients were characterized by the expansion of “memory” CD4+ T cell SC (T-caSC3) and CD8+T cell SC (T-caSC5), and by increased numbers of ISGlow NK-caSC1, thus resembling the HD pattern (Extended Data Fig. 10f). Collectively, these results reveal that pediatric and adult SLE patients display similar alterations in cellular compartments associated with SLE disease severity.
DISCUSSION
SLE is clinically heterogeneous, and underpinning clinical heterogeneity are complex blood transcriptional signatures, including a prominent one driven by IFN24,39. Here we used scRNA-seq to uncover the cell populations giving rise to these signatures. Our dataset includes >360K single-cell profiles from 33 cSLE patients, 11 healthy children, eight aSLE patients, and six adult controls. We identified cell clusters and subclusters contributing to the IFN signature and those expressing LRMD-associated genes. We confirmed the perturbation of subset frequencies, including AXL+ cDCs42 and DN2 B cells, and identified novel alterations such as the expansion of ISGhi monocytes, pDCs, PCs, and cytotoxic NK cells in the sickest patients.
This first direct comparison of childhood and adult SLE confirmed the presence of similar transcriptional patterns across age groups and enabled patient classification according to DA. Although ISGs were globally overexpressed in cSLE, eight out of 20 cell clusters contributed the most to the IFN signature. These included PCs, which expressed the highest levels of type I IFN receptor genes (IFNAR1 and IFNAR2), pDCs, cDCs, CD8+ T cells, NK cells and monocytes, the later representing the largest fraction of ISGhi PBMCs. ISG expression was also detected in a discrete cluster of CD4+ T cells (C11-T) both in cHD and cSLE, suggesting a constitutive activation of the IFN pathway43. Notably, IFNA and IFNL transcripts were not detected in any cluster, perhaps reflecting the migration of IFN-producing cells into tissues23.
Enrichment of ISG-expressing monocytes was detected in the sickest patients. A cSLE-predominant monocyte SC, Mono-SC6, co-expressed ISGs and IL1B-related genes, indicating that cross-regulation of these two pathways is altered in SLE. While overall pDC numbers were decreased in cSLE, pDC-SC1, an ISGhi subset, was expanded. This was the case as well for an ISGhi cDC cluster (cDC-SC2) expressing AXL31,44.
Mgk signatures were present in both SLE and HD, while erythroid cell signatures were found in some patients with high SLEDAI. Most megakaryocyte, but not erythroid SCs, carried ISGs. These signatures were not associated with thrombocytopenia or anemia. Erythroid cells might be the origin of a unique signature previously reported in cSLE and other inflammatory diseases46,47, as well as in pregnancy47. Lack of detection of a granulocyte cluster associated with renal inflammation6,8 is likely due to technical microfluidics limitations48.
ISGhi B cell SCs (B-SC5 and B-SC4) were expanded in cSLE patients. B-SC5 cells corresponded to extrafollicular (CXCR5–), double-negative (IgD–CD27–) memory B cells (DN2)35,49, also detected in aSLE kidney cell suspensions50, though the latter carried a low ISG score. In addition to ISGs, B-SC5 up-regulate genes (e.g. ACP5, BANK1 and BLK) linked to LRMDs. Similar observations apply to SLE-expanded PCs, which expressed among the highest ISG scores contrary to what was reported for SLE kidney PCs50. Whether these differences result from the cell purification methods or reflect compartment differences will require further studies.
T cells represented the largest lineage in both cHD and cSLE PBMCs. Yet, except for naïve and memory compartments, scRNAseq clustering algorithms did not classify T cells according to established surface markers. This might be due to the preferential capture of highly expressed genes. A small fraction (~9%) of T cells expanded in cSLE (T-SC4), but also present in HD, expressed higher levels of ISGs. T-SC4 encompassed both CD4+ and CD8+ T cells, suggesting that ISG upregulation might define this cluster.
scRNA-seq revealed SLE-restricted activated NK cells, as recently reported50, and an ISGhi NK cell SC associated with disease severity. The smallest NK SC (NK-SC3) was expanded in SLE and expressed high levels of the nucleic acid-degrading enzymes RNASEH2A and DNASE1, suggesting a potential link to LRMDs and SLE pathogenesis.
Unbiased clustering of cSLE and cHD samples based on PBMC SC frequency classified patients into unique groups of either cSLE or combinations of cSLE and cHD. SCs expressing high ISG and LRMD associated genes defined patients with high DA and off MMF, a drug known to modulate ISGs4 and block PC differentiation51. Additional ISGhi SCs, including pDCs, IL1β-ISG co-expressing monocytes and AXL+ DCs, were expanded in patients on and off MMF, perhaps reflecting these cells resistance to MMF. Thus, this cross-sectional classification highlights molecular pathways and cell types previously described as correlates of SLE DA in longitudinal studies of cSLE patients (e.g., ISG, plasma cell, erythroid, myeloid)8, though at a higher level of resolution. It also uncovers novel cell subpopulations expanded in cSLE patients with high DA that are reproduced in the sickest aSLE patients and might represent therapeutic targets.
While this study uncovers important novel leukocyte alterations in SLE, we acknowledge limitations due to the sensitivity of certain blood cells to cryopreservation (e.g., “PCs”) and/or microfluidic settings (e.g., neutrophils); the limited power of scRNA-seq to discriminate subsets of T cells, and the cross-sectional nature of the analyses. Combining scRNA-seq with oligonucleotide-tagged antibodies52,53, and cost reduction through multiplexing will enable conducting larger, longitudinal studies. This will pave the way towards both a better understanding of SLE pathogenesis and heterogeneity as well as the implementation of more effective personalized therapeutic approaches.
METHODS
Study design
This study was approved by the Institutional Review Boards of the University of Texas Southwestern Medical Center, Texas Scottish Rite Hospital for Children, Baylor-Scott & White Health Care Systems, Nationwide Children’s Hospital, the Ohio State University School of Medicine, University of Connecticut Health and THE JACKSON LABORATORY. Informed consent was obtained from all patients or their parent/guardians. Blood samples were obtained from patients fulfilling the diagnosis of SLE according to the criteria established by the American College of Rheumatology. Healthy pediatric and adult controls were visiting the clinic either for reasons not related to autoimmunity or for surgery not associated with any inflammatory diseases. Distribution of gender, race and disease activity (SLEDAI) in our cohort reflect the actual demographics and disease severity of the patients followed in our clinics8.
IRB information:
Childhood SLE (cSLE) cohort
Baylor Research Institute: IRB 007–221 (healthy pediatrics) and IRB 011–200 (autoimmunity in pediatrics). UT Southwestern Medical Center: IRB STU 092010–167 (autoimmunity in pediatrics). Texas Scottish Rite Hospital for Children: IRB TSRH-1060 (autoimmunity in pediatrics). Weill Cornell Medicine: IRB 1711018757. The Nationwide Children’s Hospital: IRB 18–00591. The Jackson Laboratory: IRB 16-JGM-26.
Adult SLE (aSLE) cohort
The UConn Health: IRB 18–126J-1.
Exclusion criteria
Autoimmune disease such as: Rheumatoid Arthritis, Inflammatory Bowel Disease.
HIV, AIDS or other Immunodeficiency
Use of steroids (prednisone >15mg/ day oral) or methotrexate or equivalent
Any changes in therapy with Methylprednisolone, Mycophenolic acid, Azathioprine or Methotrexate in the last 30 days
Use of biologics within the last 30 days
Use of Intramuscular or Intravenous Solumedrol within 30 days of screening
Current substance and/or alcohol abuse
Pregnancy
Prisoners
Flow Cytometry
Cells were stained with fluorochrome-labeled antibodies to the following surface markers: CD3 (UCHT1, 1:100, BD Biosciences), CD8a (RPA-T8, 1:100, BioLegend), and CD14 (MSE2; 1:100, BD Biosciences). Subsequent to surface staining and staining with live/dead fixable dye (Aqua, 1:1000, Thermo-Fisher), cells were fixed and permeabilized according to the manufacturer’s instructions (Cytofix/Cytoperm and Perm/Wash Buffer; BD Biosciences), and stained for 30 min on ice for Granzyme A (GB9, 1:50, BioLegend), Granzyme B (GB11, 1:50, BioLegend), Perforin (B-D48, 1:50, BD Biosciences), and ISG15 (IC8044P, 1:50, R&D Systems). The stained cells were acquired with LSR Fortessa X-20 (BD) and analyzed with FlowJo software (BD).
Sample processing.
All the adult subject samples were processed within one hour while the children samples were processed within three hours from venipuncture.
Samples included in Flow Cytometry
For ISG15 staining on CD14+ monocytes, as well as granzyme A, granzyme B, perforin and ISG15 on CD4+ and CD8+ T cells, 17 cSLE samples were included. Of these 17 samples, 11 were included in the scRNA-seq dataset analyzed, the 6 other samples were from the same patients that were included in scRNA-seq dataset, at different visit. These last 6 cSLE patients were also used for ISG15 staining on NK cell and DN2 B cell staining.
Blood preparation for single cell RNA sequencing (scRNA-seq).
Freezing media was 10% DMSO + 90% FBS. PBMCs were thawed quickly at 37°C and resuspended into DMEM supplemented with 10% FBS. Cells exhibiting a viability rate less than 70% were excluded. Cells were quickly spun down at 400 g, for 10 min. Cells were washed once with 1× PBS supplemented with 0.04% BSA and finally re-suspended in 1× PBS with 0.04% BSA. Viability was determined using trypan blue staining and measured on a Countess FLII. Briefly, 12,000 cells were loaded for capture onto the Chromium System using the v2 single cell reagent kit (10X Genomics). Following capture and lysis, cDNA was synthesized and amplified (12 cycles) as per manufacturer’s protocol (10X Genomics). The amplified cDNA was used to construct an Illumina sequencing library and sequenced on a single lane of a HiSeq 4000.
Single-cell Raw data processing and data combining
Illumina basecall files (*.bcl) were converted to fastqs using cellranger v2.1.0, which uses bcl2fastq v2.17.1.14. FASTQ files were then aligned to hg19 genome and transcriptome using the cellranger v2.1.0 pipeline, which generates a gene - cell expression matrix. The samples were merged together using cellranger aggr from cellranger, which aggregates outputs from multiple runs, normalizing them to the same sequencing depth (normalize=mapped) and then re-computing the gene-barcode matrices and analysis on the combined data. The sequencing information for each individual included in the study (e.g., number of reads per cell or UMI counts per cell) are shown in Supplementary Table 1c.
Scrublet for multiplet prediction and removal
Generally, we expected about 2 to 8% of the cells to be hybrid transcriptomes or multiplets, occurring when two or more cells are captured within the same microfluidic droplet and are tagged with the same barcode. Such artifactual multiplets can confound downstream analyses. We applied Scrublet19 python package to remove the putative multiplets. Scrublet assigns each measured transcriptome a ‘multiplet score’, which indicates the probability of being a hybrid transcriptome. Multiplet scores were determined for each individual (using the raw data), and 1.7% - 9.7% in children and 3.4% - 10.1% in adult cohort of highest scoring cells were tagged as multiplets after visual inspection of doublet score distributions and excluded from the further analysis. Next, UMAP of cells from each patient was built using Scanpy and clusters with a large fraction of potential doublets were removed after inspecting expression of putative cell surface markers. Before/after multiplet removal, the number of cells in cSLE and caSLE cohorts was 283,857/275,588 and 375,559/340,629 cells, respectively.
Single-cell preprocessing, dimension reduction, graph-based clustering, and cluster annotation
The cleaned (after multiplet removal using scrublet19) aggregated matrices were fed into the Python-based Scanpy54 workflow (https://scanpy.readthedocs.io/en/stable/), which includes preprocessing, visualization, clustering and differential expression testing. The pipeline we used was inspired by the Seurat55 R package workflow and can be found here: https://github.com/dnehar/SingleCells_SLE_paper.
Quality control and cell filtering
We applied the following filtering parameters: (i) all genes that were not detected in ≥ 3 cells were discarded, using pp.filter_genes function, (ii) cells with less than 400 total unique transcripts were removed prior to downstream analysis using pp.filter_cells function, (iii) cells in which > 20% of the transcripts mapped to the mitochondrial genes were filtered out, as this can be a marker of poor-quality cells and (iv) cells displaying a unique gene counts > 2,500 genes were considered outliers and discarded. The number of cells before and after these filtration steps, including the multiplet removal is shown for each individual in Extended Data Fig. 1a.
Data normalization
We normalized the data using the pp.normalize_per_cell function. Thus, library-size normalization was performed based on gene expression for each barcode by scaling the total number of reads per cell to 10,000. We log-transformed the data (pp.log1p function) and then regressed out using the total number of genes and the fraction of mitochondrial transcript content per cell. We then regressed out effects of total counts per cell and the percentage of mitochondrial genes expressed using pp.regress_out function . The data was then scaled data to unit variance using pp.scale function (with the following parameters: max_value=10). The 1205 highly variable genes (HVG) were identified using filter_genes_dispersion function (with the following parameters: min_mean=0.0125, max_mean=3, min_disp=0.5).
Linear dimensional reduction using PCA
To reduce the dimensionality of the data, we ran principal component analysis (PCA) using tl.pca function, which reveals the main axes of variation and denoises the data. The contribution of each PCs to the total variance was assessed using pl.pca_variance_ratio function.
Neighborhood graph computing, embedding and clustering
The neighborhood graph of cells was computed based on the PCA representation of the data matrix, using pp.neighbors function (with the following parameters: n_neighbors=10, n_pcs=40). The neighborhood graph was then embedded using UMAP22 (tl.umap function) and visualized using pl.umap function. We finally used the Louvain graph-based clustering using tl.louvain function with resolution=1.2.
Batch effect correction.
To account for technical source of variation, such as 10X runs, we applied a batch effect correction using BBKNN20 (github.com/Teichlab/bbknn).
bbknn.bbknn() function was ran using the following parameters: metric=“angular”, approx=True, neighbors_within_batch=5, n_pcs=20, trim=50. Additionally, we tested the Harmony21 R package (github.com/immunogenomics/harmony). We first converted the .h5ad object into Seurat object using a virtual environment with the following module versions scanpy==1.4 anndata==0.6.18 numpy==1.15.4 scipy==1.2.1 pandas==0.22.0 scikit-learn==0.20.2 statsmodels==0.9.0 python-igraph==0.7.1 louvain==0.6.1.
For the sake of comparing Harmony batch correction to BBKNN (in terms of number of clusters), we ran the RunHarmony function on the Seurat pipeline following by FindClusters function using the 15 first PCs and a resolution value of 1 (Extended Data Fig. 2c).
All the analyses presented in this study were done on the BBKNN corrected data. UMAP visualization and louvain clustering were then computed on the BBKNN corrected using the following parameters:
sc.tl.umap(BBKNN_corrected_object , min_dist=0.3,n_components=3)
sc.tl.louvain(BBKNN_corrected_object, resolution=1.2)
Finding marker genes/evaluation of cluster identity
To annotate the clusters generated from the BBKNN corrected object, we used both differential expression analysis between clusters and classification based on putative marker gene expression. We applied tl.rank_genes_groups function to compute a ranking for the differential genes in each cluster/Subcluster, comparing each cluster to the rest of the cell using Wilcoxon test (Supplementary Table 2 & 3). We only considerate clusters/Subclusters that showed distinct transcriptomic programs. The top 100 marker genes for cluster and subclusters, in cSLE and caSLE are included in Extended Data Fig. 2 and 3.
The top 10 marker genes were visualized using the sc.pl.rank_genes_groups_matrixplot function.
Subclustering parameters and data cleaning:
A script showing the subclustering process can be found here: github.com/dnehar/SingleCells_SLE_paper. Based on the number of cells and to avoid over-clustering, we used different clustering resolutions. For both cSLE and caSLE, the following parameters of resolution were used: 0.8 (T and B cells), 0.6 (Monocytes, PCs, cDC and pDC), 0.4 (NK cells) and 0.3 (megakaryocytes/mgk and Erythrocytes/Eryth). We only considered SC defined by a distinct gene sets, by merging similar ones (for T, B cells and plasma cells especially).
We discarded two small SC of T (n = 2128) and NK (n = 483) cells, which were exclusively defined by mitochondrial genes. Some SCs (i.e. PC-SC1) expressed high number of mitochondrial genes, which might be linked to metabolic changes56,57. Concerning the mgk and Eryth, we discarded SCs that were suspected to include multiplets with other cells types. The number of cells in each cluster/SC within both cSLE and caSLE datasets is shown in Supplementary Table 4.
Overall, the number of cells after multiplet removal and the filtration steps was 252,279 and 332,641 in cSLE and caSLE cohorts, respectively.
IFN score
ISGs (from previously described interferon-related modules, as well as Gene Ontology) were used to score IFN expression in each cluster/subcluster generated in the cSLE dataset. To do so, we calculated the mean expression for each cell, within each cluster/subcluster using the h5ad object (adata), as follow: adata.obs[‘ISG_score’] = adata.X[:,IFN_markers].mean(1).
The scores were then plotted, as shown in Extended Data Fig. 2e,f.
Correlation matrices
Hierarchical clustering was computed based on the first 50 PCs were performed using sc.tl.dendrogram function from the scanpy pipeline, then the Pearson correlation heatmaps were generated using sc.pl.correlation_matrix. The results showing the inter-individual, or inter SLEDAI-categories correlation are shown in Extended Data Fig. 2c and Extended Data Fig. 2d, respectively.
Children and adult-single cell subcluster frequency calculation and heatmaps
Frequency of cSLE subclusters (n = 37) generated in children cohort were calculated per subject and used for hierarchical clustering using ‘ward.D2’ algorithm using heatmap.2 in gplots R package. Independent subclusters (n = 39) generated in entire children and adult cohort (caSLE) were used for calculating frequency per subject and used for heatmap generation using the same algorithm.
Statistical analysis
Statistical analysis was performed using R/3.4.1. Tests were used to determine data distribution and depending on the normality of the data, comparisons were performed using the Student t test (for two groups, parametric) or the non-parametric the Wilcoxon signed rank test (for two groups, paired) with two-tailed P values unless otherwise stated. Differences were considered to be significant when P <0.05 (*), P < 0.01 (**), P < 0.001 (***) and P < 0.0001 (****).
Reporting Summary.
Further information on research design is available in the Nature Research Reporting Summary linked to this article.
DATA AVAILABILITY.
scRNA-seq data from childhood and adult cohorts reported in this study have been deposited in the dbGAP database under accession number phs002048.v1.p1.
The processed data can be viewed using an interactive R Shiny App here: https://scrnaseq-sle.jax.org/
CODE AVAILABILITY.
Jupyter notebooks used for the analysis, including processing, clustering, batch effect correction and subclustering are available on GitHub: github.com/dnehar/SingleCells_SLE_paper.
ADDITIONAL INFORMATION
Correspondence and requests for materials should be addressed to J.F.B., V.P. or D.N.-B.
Extended Data
Extended Data Fig. 1. childhood SLE (cSLE) dataset overview and batch effect correction.

(a). Number of cells per individual (n=44). cSLE (n=33, in purple) and cHD (n=11; in green).
(b). Number of genes per individual. cSLE (n=33, in purple) and cHD (n=11; in green).
(c). Number of cells before and after filtration (which includes multiplet removal and other filtration steps that are described in Method), across the 44 individuals (33 cSLE and 11 cHD).
(d). Bar plot highlighting the cell abundances across clusters (n=27) for cSLE and cHD (left panel) and 10X run batches (right panel) before batch effect correction.
(e,f). Bar plot highlighting the cell abundances across clusters (n=20) for cSLE and cHD (left panel) and 10X run batches (right panel) after BBKNN (e), or Harmony (f) batch effect correction.
Extended Data Fig. 2. Global information after BBKNN batch correction and ISG scores throughout clusters/subclusters.

(a). Bar plot displaying the cell composition of the 20 clusters.
(b). Bar plot highlighting the individual (n=44) cell abundances across clusters (n=20) after BBKNN batch effect correction.
(c,d). Heatmap representing Pearson correlation between individuals (n=44; c) or SLEDAI categories (d) based on overall scRNA seq dataset. The hierarchical clustering was based on the first 50 PCs. Red and blue colors, indicate positive and negative correlation, respectively.
(e,f). ISG scores across the clusters (n=20; e) or SCs (n=37; f). Based on the average expression IFN modules M1.2, M3.4, M5.12, ISG scores have been calculated for each cell, across the clusters (e), or SCs (f). Erythrocyte cluster was a negative control.
Extended Data Fig. 3. Individuals’ UMAP for Monocytes and B cells subclusters.

(a). Individual UMAP plots from 11 cHD (left), 33 cSLE (right) based on monocyte SCs (Mono-SCs, n=8). Each color represents a distinct SC.
(b). Flow cytometry detection of ISG15 in PBMCs gated on CD14+ monocytes from 17 cSLE patients with different SLEDAI scores, as well as 14 cHD.
(c). Percentage of ISG15+ CD14+ monocytes in cHD and cSLE as categorized based on SLEDAI (cHD cells ‘none’ in gray, SLEDAI <=4, in yellow; n=9, and SLEDAI >4, in red; n=8). T-test was used for statistical analysis. P-values are shown for the respective comparisons.
(d). Individual UMAP plots from 11 cHD (left), 33 cSLE (right) based on B cells SCs (B-SCs, n=7). Each color represents a distinct SC.
Extended Data Fig. 4. Individuals’ UMAP for T and NK cells subclusters.

(a). Individual UMAP plots from 11 cHD (left), 33 cSLE (right) based on T cells SCs (T-SCs, n=6). Each color represents a distinct SC.
(b). Percentage of GzB+, or Perforin+ CD8+ T cells within cHD and cSLE as categorized based on SLEDAI categories (cHD cells ‘none’ in gray, SLEDAI <=4 in yellow; n=9 and SLEDAI >4, in red; n=8).
(c). Flow cytometry detection of GzB and perforin proteins in PBMCs, gated on CD8+ T cells, from cSLE (n=17) with different SLEDAI scores and cHD (n=14). T-test was used for statistical analysis. P-values are shown for the respective comparisons.
(d). Individual UMAP plots from 11 cHD (left), 33 cSLE (right) based on NK SCs (NK-SCs, n=4). Each color represents a distinct SC.
(e). Flow staining of ISG15 on PBMCs gated on CD57+ NK cells from six cSLE patients (in purple) with different SLEDAI scores and nine matched cHD (in green). MFI values are represented.
(f). Boxplots representing the ESR (left panel), C4 (middle panel) and C3 (right panel) levels across the six cSLE subcluster groups (SCGs) depicted in Fig. 8b.
(g). Dotplot representing the correlation between hemoglobin (HGB) levels (g/dL) and proportion of cells from the Erythrocyte cluster across the cSLE samples.
Extended Data Fig. 5. Overview of cSLE and aSLE combined (caSLE) dataset.
(a). Number of detected genes across cells in cSLE (n=33), aSLE (n=8), cHD (n=11) and aHD (n=6). Vertical lines represent the mean.
(b,c). Bar plot highlighting the cell abundances across cluster (n=26) for cSLE, aSLE, cHD and aHD groups (left panel) and 10X run batches (right panel) before (b) and after (c) BBKNN batch effect correction. Each color represents groups (left) and batch (right).
(d). UMAP plot representing the 21 clusters across 340,629 PBMCs from cSLE (n=33), aSLE (n=8), cHD (n=11) and aHD (n=6). Each color represents a distinct cluster.
(e). Cluster annotation. Dot plot representing expression values of selected genes (x-axis) across each cluster (y-axis). Dot size represents the percentage of cells expressing the marker of interest. Color intensity indicates the mean expression within expressing cells.
Extended Data Fig. 6. caSLE monocytes analysis.

(a). UMAP plots representing caSLE monocyte subclusters (Mono-caSCs, n=6), groups (cSLE, cHD, aSLE or aHD) and SLEDAI categories.
(b). Bar plot highlighting the cell abundances across Mono-caSCs (n=6) for cSLE, cHD, aSLE or aHD groups (left panel) and SLEDAI categories (right panel).
(c). Heatmap representing scaled expression values of the top 10 genes defining each of the Mono-SCs (n=6).
(d). Individual UMAP plots from cSLE (n=33), aSLE (n=8), 11 cHD (n=11), or aHD (n=6), based on Mono-caSCs (n=6). Each color represents a distinct caSC.
Extended Data Fig. 7. caSLE pDC and cDC cells analysis.
(a). UMAP plots representing caSLE pDC subclusters (pDC-caSCs, n=5), groups (cSLE, cHD, aSLE or aHD), SLEDAI categories and selected genes.
(b). Bar plot highlighting the cell abundances across pDC-caSCs (n=5) for cSLE, cHD, aSLE or aHD groups (top panel) and SLEDAI categories (bottom panel).
(c). Heatmap representing scaled expression values of the top 10 genes defining each of the pDC-SCs (n=5).
(d). UMAP plots representing cDC-caSCs (n=4), groups (cSLE, cHD, aSLE or aHD), SLEDAI categories and selected genes.
(e). Bar plot highlighting the cell abundances across cDC-caSCs (n=4) for cSLE, cHD, aSLE or aHD groups (top panel) and SLEDAI categories (bottom panel).
(f). Heatmap representing scaled expression values of the top 10 genes defining each of the cDC-caSCs (n=4).
Extended Data Fig. 8. caSLE B cells and plasma cells analysis.
(a). UMAP plots representing caSLE B cell subclusters (B-caSCs, n=8), groups (cSLE, cHD, aSLE or aHD) and SLEDAI categories.
(b). Bar plot highlighting the cell abundances across B-caSCs (n=8) of cSLE, cHD, aSLE or aHD groups (left panel) and SLEDAI categories (right panel).
(c). Heatmap representing scaled expression values of the top 10 genes defining each of the B-caSCs (n=8).
(d). Individual UMAP plots from cSLE (n=33), aSLE (n=8), 11 cHD (n=11), or aHD (n=6), based on B-caSCs (n=8). Each color represents a distinct caSC.
(e). UMAP plots representing PC SCs (n=2), Groups (cSLE, cHD, aSLE or aHD), SLEDAI categories and selected genes.
(f). Bar plot highlighting the cell abundances across PC SCs (n=2) for cSLE, cHD, aSLE or aHD groups (left panel) and SLEDAI categories (right panel).
(g). Heatmap representing scaled expression values of the top 10 genes defining each of the PC-caSC (n=2).
Extended Data Fig. 9. caSLE T cells analysis.

(a). UMAP plots representing caSLE T subclusters (T-caSCs, n=8), groups (cSLE, cHD, aSLE or aHD), and SLEDAI categories.
(b). Bar plot highlighting the cell abundances across T-caSCs (n=8) for cSLE, cHD, aSLE or aHD (Groups; upper panel) and SLEDAI categories (lower panel).
(c). Individual UMAP plots from cSLE (n=33), aSLE (n=8), 11 cHD (n=11), or aHD (n=6), based on SCs (n=8). Each color represents a distinct caSCs.
(d). Heatmap representing scaled expression values of the top 10 genes defining each of the T-caSC (n=8).
Extended Data Fig. 10. caSLE NK cells analysis, correlation of cSC and caSC, and boxplots of caSC abundance throughout caSCGs.
(a). UMAP plots representing caSLE NK subclusters (NK-caSCs, n=4), groups (cSLE, cHD, aSLE or aHD) and SLEDAI categories.
(b). Bar plot highlighting the cell abundances across NK-caSCs (n=4) for cSLE, cHD, aSLE or aHD (Groups; left panel) and SLEDAI categories (right panel).
(c). Individual UMAP plots from cSLE (n=33), aSLE (n=8), 11 cHD (n=11), or aHD (n=6), based on NK-caSCs (n=4). Each color represents a distinct caSC.
(d). Heatmap representing scaled expression values of the top 10 genes defining each of the NK-caSC (n=4).
(e). Correlation plot of cluster memberships for each single cell in cSLE vs. caSLE datasets. SC membership information from the caSLE combined dataset (excluding aSLE samples) was correlated with cSLE dataset.
(f). Boxplots representing the proportion of ISGhi Monocytes (Mono-caSC0), ISGhi NK cells (NK-caSC3), ISG+ AXL+ cDCs(cDC-caSC2), ISGhi pDCs (pDC-caSC3), ISGhi T cells (T-caSC6), CD4+ Memory T cells (T-caSC3), ISGhi PCs (PC-caSC0), ISGhi B cells (B-caSC3), CD8+ Memory T cells (T-caSC5), IL1B+ ISGhi Monocytes (Mono-caSC4), DN2 B cells (B-caSC5), NK-SC0 (NK-caSC1) SCs across the four caSCGs. Patients with Mono-caSC0 >0.08, NK-caSC3>0.01, cDC-caSC2>0.02, pDC-caSC3>0.0005, T-caSC6 >0.05, PC-caSC0>0.002, B-caSC3 >0.01, T-caSC5 >0.05, Mono-caSC4 >0.025, B-caSC5 >0.01, NK-caSC1> 0.022 are labelled with their sample names. *, P<0.05; **, P<0.01; ***, P<0.001: ****, P<0.0001
Supplementary Material
Supplementary Table 1. Clinical and sequencing information
(a). Distribution and statistics (when applicable) of demographics (SLE and HD) and SLEDAI and medications of cSLE and aSLE cohorts.
(b). Clinical information of cSLE and aSLE cohorts.
(c). Sequencing information of samples included in the study.
Supplementary Table 2. Top 100 genes defining clusters and subclusters in cSLE
(a). Top 100 genes comparing expression values from cell within a given cluster (cSLE) with those from the rest of the cells (Wilxocon test).
(b-h). Top 100 genes comparing expression values from cell within a given cSLE-subcluster (in moncocytes, pDCs, cDC, B cells, PC, T and NK cells) with those from the rest of the cells (Wilxocon test).
Supplementary Table 3. Top 100 genes defining clusters and subclusters in caSLE
(a). Top 100 genes comparing expression values from cell within a given cluster (caSLE) with those from the rest of the cells (Wilxocon test), within each subset.
(b-h). Top 100 genes comparing expression values from cell within caSLE-subcluster (in moncocytes, pDCs, cDC, B cells, PC, T and NK cells) with those from the rest of the cells (Wilxocon test), within each subset.
Supplementary Table 4. Number of cells in each cluster/subclusters in cSLE and caSLE across individuals.
(a,c). Number of cells per individual within each cluster in cSLE (a) and caSLE (c).
(b,d). Number of cells per individual within each subcluster in cSLE (SCs; b) and caSLE (caSC; d).
ACKNOWLEDGMENTS
We are grateful to the patients with SLE, their families, the healthy individuals who participated in our study and the members of the Pediatric Rheumatology Clinics at Texas Scottish Rite Hospital for Children and the Children’s Medical Center in Dallas, TX; and M. Sansone, T. Jackson and F. Jawed for help with recruiting adults with SLE.We gratefully acknowledge the contribution of Flow Cytometry, Single Cell Biology and Genome Technologies Scientific Services at The Jackson Laboratory, which are partially supported by NCI P30CA034196, and thank them for expert assistance with the work described in this publication. In addition, we thank JAX Research IT (particularly Sandeep Namburi) for the support with maintaining the R Shiny application. This work was supported by grants NIAMS CORT P50AR070594 Center for Lupus Research (to V.P. and J.F.B.), NIAID NIH U19 AI082715 (to V.P.) and U01 AI 131386 (to O.R. and J.F.B.) and start-up funds from the Jackson Laboratory and the Drukier Institute for Children’s Health at Weill Cornell Medicine.
Footnotes
COMPETING INTERESTS STATEMENT
V.P. has acted as consultant for Sanofi and Astra Zeneca and is the recipient of a research award from Sanofi. J.F.B. is a member of the BOD and SAB of Neovacs.
REFERENCES
- 1.Arbuckle MR et al. Development of autoantibodies before the clinical onset of systemic lupus erythematosus. N. Engl. J. Med 349, 1526–1533 (2003). [DOI] [PubMed] [Google Scholar]
- 2.Elkon KB & Wiedeman A Type I IFN system in the development and manifestations of SLE: Current Opinion in Rheumatology 24, 499–505 (2012). [DOI] [PubMed] [Google Scholar]
- 3.Tsokos GC Systemic lupus erythematosus. N. Engl. J. Med 365, 2110–2121 (2011). [DOI] [PubMed] [Google Scholar]
- 4.Navarra SV et al. Efficacy and safety of belimumab in patients with active systemic lupus erythematosus: a randomised, placebo-controlled, phase 3 trial. The Lancet 377, 721–731 (2011). [DOI] [PubMed] [Google Scholar]
- 5.Baechler EC et al. Interferon-inducible gene expression signature in peripheral blood cells of patients with severe lupus. Proc. Natl. Acad. Sci. U.S.A 100, 2610–2615 (2003). [DOI] [PMC free article] [PubMed] [Google Scholar]
- 6.Bennett L et al. Interferon and granulopoiesis signatures in systemic lupus erythematosus blood. Journal of Experimental Medicine 197, 711–723 (2003). [DOI] [PMC free article] [PubMed] [Google Scholar]
- 7.Chiche L et al. Modular Transcriptional Repertoire Analyses of Adults With Systemic Lupus Erythematosus Reveal Distinct Type I and Type II Interferon Signatures: Modular Interferon Signatures and Systemic Lupus Erythematosus. Arthritis & Rheumatology 66, 1583–1595 (2014). [DOI] [PMC free article] [PubMed] [Google Scholar]
- 8.Banchereau R et al. Personalized Immunomonitoring Uncovers Molecular Networks that Stratify Lupus Patients. Cell 165, 551–565 (2016). [DOI] [PMC free article] [PubMed] [Google Scholar]
- 9.Chaussabel D et al. A Modular Analysis Framework for Blood Genomics Studies: Application to Systemic Lupus Erythematosus. Immunity 29, 150–164 (2008). [DOI] [PMC free article] [PubMed] [Google Scholar]
- 10.Kirou KA et al. Activation of the interferon-alpha pathway identifies a subgroup of systemic lupus erythematosus patients with distinct serologic features and active disease. Arthritis Rheum 52, 1491–1503 (2005). [DOI] [PubMed] [Google Scholar]
- 11.Langefeld CD et al. Transancestral mapping and genetic load in systemic lupus erythematosus. Nat Commun 8, 16021 (2017). [DOI] [PMC free article] [PubMed] [Google Scholar]
- 12.Rice GI et al. Assessment of Type I Interferon Signaling in Pediatric Inflammatory Disease. J. Clin. Immunol 37, 123–132 (2017). [DOI] [PMC free article] [PubMed] [Google Scholar]
- 13.Omarjee O et al. Monogenic lupus: Dissecting heterogeneity. Autoimmun Rev 18, 102361 (2019). [DOI] [PubMed] [Google Scholar]
- 14.Jaitin DA et al. Massively parallel single-cell RNA-seq for marker-free decomposition of tissues into cell types. Science 343, 776–779 (2014). [DOI] [PMC free article] [PubMed] [Google Scholar]
- 15.Schlitzer A et al. Identification of cDC1- and cDC2-committed DC progenitors reveals early lineage priming at the common DC progenitor stage in the bone marrow. Nat. Immunol 16, 718–728 (2015). [DOI] [PubMed] [Google Scholar]
- 16.Shalek AK et al. Single-cell transcriptomics reveals bimodality in expression and splicing in immune cells. Nature 498, 236–240 (2013). [DOI] [PMC free article] [PubMed] [Google Scholar]
- 17.Gaublomme JT et al. Single-Cell Genomics Unveils Critical Regulators of Th17 Cell Pathogenicity. Cell 163, 1400–1412 (2015). [DOI] [PMC free article] [PubMed] [Google Scholar]
- 18.Li H et al. Reference component analysis of single-cell transcriptomes elucidates cellular heterogeneity in human colorectal tumors. Nat. Genet 49, 708–718 (2017). [DOI] [PubMed] [Google Scholar]
- 19.Wolock SL, Lopez R & Klein AM Scrublet: Computational Identification of Cell Doublets in Single-Cell Transcriptomic Data. Cell Syst 8, 281–291.e9 (2019). [DOI] [PMC free article] [PubMed] [Google Scholar]
- 20.Polański K et al. BBKNN: Fast Batch Alignment of Single Cell Transcriptomes. Bioinformatics (2019) doi: 10.1093/bioinformatics/btz625. [DOI] [PMC free article] [PubMed] [Google Scholar]
- 21.Korsunsky I et al. Fast, sensitive and accurate integration of single-cell data with Harmony. Nature Methods 16, 1289–1296 (2019). [DOI] [PMC free article] [PubMed] [Google Scholar]
- 22.Becht E, McInnes L, Healy J, Dutertre C-A Kwok IWH, Ng LG, Ginhoux F & Newell EW Dimensionality reduction for visualizing single-cell data using UMAP. Nat. Biotechnol 37, 38–44 (2019). [DOI] [PubMed] [Google Scholar]
- 23.Blanco P, Palucka AK, Gill M, Pascual V & Banchereau J Induction of dendritic cell differentiation by IFN-alpha in systemic lupus erythematosus. Science 294, 1540–1543 (2001). [DOI] [PubMed] [Google Scholar]
- 24.Rodriguez-Pla A et al. IFN Priming Is Necessary but Not Sufficient To Turn on a Migratory Dendritic Cell Program in Lupus Monocytes. The Journal of Immunology 192, 5586–5598 (2014). [DOI] [PMC free article] [PubMed] [Google Scholar]
- 25.Guarda G et al. Type I Interferon Inhibits Interleukin-1 Production and Inflammasome Activation. Immunity 34, 213–223 (2011). [DOI] [PubMed] [Google Scholar]
- 26.Gill MA et al. Blood dendritic cells and DC-poietins in systemic lupus erythematosus. Hum. Immunol 63, 1172–1180 (2002). [DOI] [PubMed] [Google Scholar]
- 27.Guiducci C et al. TLR recognition of self nucleic acids hampers glucocorticoid activity in lupus. Nature 465, 937–941 (2010). [DOI] [PMC free article] [PubMed] [Google Scholar]
- 28.Sisirak V et al. Genetic evidence for the role of plasmacytoid dendritic cells in systemic lupus erythematosus. J. Exp. Med 211, 1969–1976 (2014). [DOI] [PMC free article] [PubMed] [Google Scholar]
- 29.Farkas L, Beiske K, Lund-Johansen F, Brandtzaeg P & Jahnsen FL Plasmacytoid dendritic cells (natural interferon- alpha/beta-producing cells) accumulate in cutaneous lupus erythematosus lesions. Am. J. Pathol 159, 237–243 (2001). [DOI] [PMC free article] [PubMed] [Google Scholar]
- 30.Tucci M et al. Glomerular accumulation of plasmacytoid dendritic cells in active lupus nephritis: role of interleukin-18. Arthritis Rheum 58, 251–262 (2008). [DOI] [PubMed] [Google Scholar]
- 31.Villani A-C et al. Single-cell RNA-seq reveals new types of human blood dendritic cells, monocytes, and progenitors. Science 356, eaah4573 (2017). [DOI] [PMC free article] [PubMed] [Google Scholar]
- 32.Arce E et al. Increased frequency of pre-germinal center B cells and plasma cell precursors in the blood of children with systemic lupus erythematosus. J. Immunol 167, 2361–2369 (2001). [DOI] [PubMed] [Google Scholar]
- 33.Jacobi AM et al. Activated memory B cell subsets correlate with disease activity in systemic lupus erythematosus: delineation by expression of CD27, IgD, and CD95. Arthritis Rheum 58, 1762–1773 (2008). [DOI] [PubMed] [Google Scholar]
- 34.Tipton CM et al. Diversity, cellular origin and autoreactivity of antibody-secreting cell population expansions in acute systemic lupus erythematosus. Nat. Immunol 16, 755–765 (2015). [DOI] [PMC free article] [PubMed] [Google Scholar]
- 35.Jenks SA et al. Distinct Effector B Cells Induced by Unregulated Toll-like Receptor 7 Contribute to Pathogenic Responses in Systemic Lupus Erythematosus. Immunity 49, 725–739.e6 (2018). [DOI] [PMC free article] [PubMed] [Google Scholar]
- 36.Wang S et al. IL-21 drives expansion and plasma cell differentiation of autoreactive CD11chiT-bet+ B cells in SLE. Nat Commun 9, 1758 (2018). [DOI] [PMC free article] [PubMed] [Google Scholar]
- 37.Sanz I et al. Challenges and Opportunities for Consistent Classification of Human B Cell and Plasma Cell Populations. Front Immunol 10, 2458 (2019). [DOI] [PMC free article] [PubMed] [Google Scholar]
- 38.Rivero SJ, Díaz-Jouanen E & Alarcón-Segovia D Lymphopenia in systemic lupus erythematosus. Clinical, diagnostic, and prognostic significance. Arthritis Rheum 21, 295–305 (1978). [DOI] [PubMed] [Google Scholar]
- 39.Becker AM et al. SLE peripheral blood B cell, T cell and myeloid cell transcriptomes display unique profiles and each subset contributes to the interferon signature. PLoS ONE 8, e67003 (2013). [DOI] [PMC free article] [PubMed] [Google Scholar]
- 40.Jiang SH et al. Functional rare and low frequency variants in BLK and BANK1 contribute to human lupus. Nat Commun 10, 2201 (2019). [DOI] [PMC free article] [PubMed] [Google Scholar]
- 41.Karnell JL et al. Mycophenolic acid differentially impacts B cell function depending on the stage of differentiation. J. Immunol 187, 3603–3612 (2011). [DOI] [PMC free article] [PubMed] [Google Scholar]
- 42.See P et al. Mapping the human DC lineage through the integration of high-dimensional techniques. Science 356, eaag3009 (2017). [DOI] [PMC free article] [PubMed] [Google Scholar]
- 43.Gough DJ, Messina NL, Clarke CJP, Johnstone RW & Levy DE Constitutive type I interferon modulates homeostatic balance through tonic signaling. Immunity 36, 166–174 (2012). [DOI] [PMC free article] [PubMed] [Google Scholar]
- 44.Matsui T et al. CD2 distinguishes two subsets of human plasmacytoid dendritic cells with distinct phenotype and functions. J. Immunol 182, 6815–6823 (2009). [DOI] [PMC free article] [PubMed] [Google Scholar]
- 45.Allantaz F et al. Blood leukocyte microarrays to diagnose systemic onset juvenile idiopathic arthritis and follow the response to IL-1 blockade. J. Exp. Med 204, 2131–2144 (2007). [DOI] [PMC free article] [PubMed] [Google Scholar]
- 46.Banchereau R et al. Host immune transcriptional profiles reflect the variability in clinical disease manifestations in patients with Staphylococcus aureus infections. PLoS ONE 7, e34390 (2012). [DOI] [PMC free article] [PubMed] [Google Scholar]
- 47.Hong S et al. Longitudinal profiling of human blood transcriptome in healthy and lupus pregnancy. J. Exp. Med 216, 1154–1169 (2019). [DOI] [PMC free article] [PubMed] [Google Scholar]
- 48.Chen J et al. PBMC fixation and processing for Chromium single-cell RNA sequencing. J Transl Med 16, 198 (2018). [DOI] [PMC free article] [PubMed] [Google Scholar]
- 49.Scharer CD et al. Epigenetic programming underpins B cell dysfunction in human SLE. Nat. Immunol 20, 1071–1082 (2019). [DOI] [PMC free article] [PubMed] [Google Scholar]
- 50.Arazi A et al. The immune cell landscape in kidneys of patients with lupus nephritis. Nat. Immunol 20, 902–914 (2019). [DOI] [PMC free article] [PubMed] [Google Scholar]
- 51.Gatto M, Zen M, Iaccarino L & Doria A New therapeutic strategies in systemic lupus erythematosus management. Nat Rev Rheumatol 15, 30–48 (2019). [DOI] [PubMed] [Google Scholar]
- 52.Peterson VM et al. Multiplexed quantification of proteins and transcripts in single cells. Nat. Biotechnol 35, 936–939 (2017). [DOI] [PubMed] [Google Scholar]
- 53.Stoeckius M et al. Cell Hashing with barcoded antibodies enables multiplexing and doublet detection for single cell genomics. Genome Biol 19, 224 (2018). [DOI] [PMC free article] [PubMed] [Google Scholar]
- 54.Wolf FA, Angerer P & Theis FJ SCANPY: large-scale single-cell gene expression data analysis. Genome Biol 19, 15 (2018). [DOI] [PMC free article] [PubMed] [Google Scholar]
- 55.Satija R, Farrell JA, Gennert D, Schier AF & Regev A Spatial reconstruction of single-cell gene expression data. Nat. Biotechnol 33, 495–502 (2015).x [DOI] [PMC free article] [PubMed] [Google Scholar]
- 56.Jang K-J et al. Mitochondrial function provides instructive signals for activation-induced B-cell fates. Nat Commun 6, 6750 (2015). [DOI] [PMC free article] [PubMed] [Google Scholar]
- 57.Weisberg SP et al. Tissue-Resident Memory T Cells Mediate Immune Homeostasis in the Human Pancreas through the PD-1/PD-L1 Pathway. Cell Reports 29, 3916–3932.e5 (2019). [DOI] [PMC free article] [PubMed] [Google Scholar]
Associated Data
This section collects any data citations, data availability statements, or supplementary materials included in this article.
Supplementary Materials
Supplementary Table 1. Clinical and sequencing information
(a). Distribution and statistics (when applicable) of demographics (SLE and HD) and SLEDAI and medications of cSLE and aSLE cohorts.
(b). Clinical information of cSLE and aSLE cohorts.
(c). Sequencing information of samples included in the study.
Supplementary Table 2. Top 100 genes defining clusters and subclusters in cSLE
(a). Top 100 genes comparing expression values from cell within a given cluster (cSLE) with those from the rest of the cells (Wilxocon test).
(b-h). Top 100 genes comparing expression values from cell within a given cSLE-subcluster (in moncocytes, pDCs, cDC, B cells, PC, T and NK cells) with those from the rest of the cells (Wilxocon test).
Supplementary Table 3. Top 100 genes defining clusters and subclusters in caSLE
(a). Top 100 genes comparing expression values from cell within a given cluster (caSLE) with those from the rest of the cells (Wilxocon test), within each subset.
(b-h). Top 100 genes comparing expression values from cell within caSLE-subcluster (in moncocytes, pDCs, cDC, B cells, PC, T and NK cells) with those from the rest of the cells (Wilxocon test), within each subset.
Supplementary Table 4. Number of cells in each cluster/subclusters in cSLE and caSLE across individuals.
(a,c). Number of cells per individual within each cluster in cSLE (a) and caSLE (c).
(b,d). Number of cells per individual within each subcluster in cSLE (SCs; b) and caSLE (caSC; d).
Data Availability Statement
scRNA-seq data from childhood and adult cohorts reported in this study have been deposited in the dbGAP database under accession number phs002048.v1.p1.
The processed data can be viewed using an interactive R Shiny App here: https://scrnaseq-sle.jax.org/