

Dear Editor,
Previous studies reported that MUC16 mutation was associated with better prognosis and higher tumor mutation burden (TMB) in gastric cancer, while TTN mutation was associated with better response to immune checkpoint blockage in solid tumors, but the potential mechanisms were still unclear. 1 , 2 Through the analysis in TCGA gastric adenocarcinoma cohort (N = 443) and FUSCC gastric cancer cohort (N = 177), we identified two mucin genes, MUC4 and MUC16. These two mucin genes were selected based on mutational frequencies in gastric cancer, gene length, correlation with prognosis, and previous studies (Table S1, Figure S1). We further included the longest gene, TTN, into analysis, in consideration of its high mutation frequency and close correlation with TMB.
We observed high potency MUC4, MUC16, and TTN had in predicting TMB in both TCGA and FUSCC cohort. MUC4‐, MUC16‐, and TTN‐mutated cancer showed higher TMB (Figure 1). Mutation numbers of MUC4, MUC16, and TTN were closely correlated with TMB (Table S2). In TCGA cohort, correlation coefficient reached the highest of 0.782 when combined mutation numbers of three genes together; while in FUSCC cohort, the correlation coefficient reached the highest of 0.748 for MUC16 plus TTN, and was 0.735 for three genes. The receiver operating characteristic (ROC) curve further proved the efficacy using mutation numbers to predict TMB (Figure 1, TMB high was defined as top 20% in each cohort, TCGA: >20 mutations/Mb, FUSCC: >8 mutations/Mb). In TCGA cohort, area under ROC curve (AUROC) reached the highest of 0.936 when combined three genes together; while in FUSCC cohort, AUROC reached the highest of 0.925 for MUC16 plus TTN, and was 0.915 for three genes together. The Youden index is shown in Tables S3 and S4. In both TCGA and FUSCC cohort, high TMB was correlated with better overall survival (OS) (Figure 1). High mutation number of MUC4, MUC16, and TTN was correlated with better OS in TCGA cohort, while showing a trend of better OS in FUSCC cohort (Figure 1, high mutation number was defined as top 20% in each cohort).
FIGURE 1.
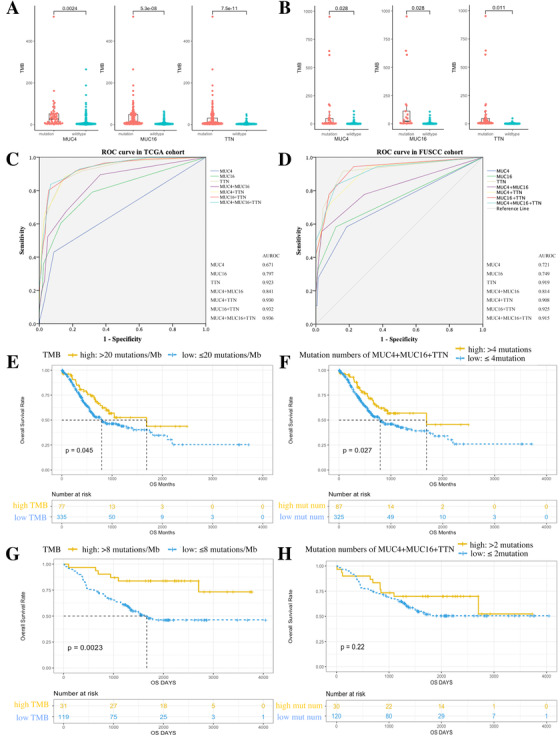
Mutation status and mutation number of MUC4, MUC16, and TTN predict TMB and prognosis in TCGA and FUSCC cohort. A and B, MUC4, MUC16, and TTN mutations showed higher TMB in TCGA and FUSCC cohort. C and D, ROC curve using gene mutation numbers to estimate TMB status in TCGA and FUSCC cohort. E and F, Kaplan‐Meier survival analysis stratified by high‐TMB and high mutation numbers in TCGA cohort. G and H, Kaplan‐Meier survival analysis stratified by high‐TMB and high mutation numbers in FUSCC cohort
In order to realize whether mutation of MUC4, MUC16, and TTN gained functional change or just contributed to TMB, we further analyzed the gene mutation sites distribution (Figure S2). 3 , 4 Somatic mutations of MUC16 and TTN were sporadic in both TCGA and FUSCC cohort. Only MUC4 gene had a slightly high mutation rate of H4205Q in TCGA cohort (2.04%) and V3305_S3320del in FUSCC cohort (7.34%). The univariate and multivariate survival analysis showed H4205Q mutation was independently correlated with worse OS in TCGA cohort (Table S5, HR (95% CI): 2.266 (1.028‐4.994), P = .043), while V3305_S3320del was independently correlated with better OS in FUSCC cohort (Table S6, HR (95% CI): 0.221 (0.053‐0.928), P = .039). Of note, TMB and mutation numbers were not independent prognostic factors, which indicated them as marker for prognosis but not determining factors.
We further clarified the potential mechanism why MUC4 and MUC16 mutation, high TMB and high mutation numbers were correlated with prognosis. In both TCGA and FUSCC cohort, patients with MUC4 mutation showed lower T stage, while MUC16‐mutated patients showed lower N stage. High TMB and high mutation numbers were correlated with lower N stage in TCGA cohort but lower T stage in FUSCC cohort (Table S7, P < .05). In both cohorts, MUC4, MUC16, and TTN mutation showed alternations in cell signaling pathway, immune checkpoint expression, and immune cell infiltration (Figures S3–S6). High TMB cancers upregulated myc, cell cycle, metabolism, and DNA repair pathways; at the same time, they also showed upregulation of immune response pathway and high infiltration of CD8 T cells, CD4 T cells, macrophage 1, and macrophage 2 cells (Figure S7). These findings indicated that high TMB was accompanied with high genetic instability. Under this circumstance, oncogenes and metabolism genes had more opportunity generating mutations, but also more neoantigens were produced to stimulate immune response. 5 So the prognosis might be based on a comprehensive consideration of disease status and treatment. 6 High mutation numbers showed similar results on cell signaling pathways, immune cell infiltration, and immune checkpoint expression to TMB, indicating that gene mutation number might be the maker of TMB (Figure S7).
We verified our hypothesis in one gastric cancer immunotherapy dataset from Sun Yat‐sen University Cancer Center (SYSUCC cohort) 7 and another pan‐cancer immunotherapy dataset from one published study. 8 In both SYSUCC and pan‐cancer cohort, mutation status and mutation numbers of MUC4, MUC16, and TTN were closely correlated with TMB and showed high potency in predicting TMB (Figure 2; Tables S2, S8, and S9). In SYSUCC, although single gene mutation showed limited association with objective response rate (ORR), OS, and progression‐free survival (PFS) (Table S10, Figure S8), mutation numbers of combined MUC4, MUC16, and TTN showed similar efficacy with TMB in predicting immunotherapy effects, as similar in ORR, weaker in OS, but better in PFS than TMB (Figure 2, mutation numbers vs TMB, ORR: P = .036 vs P = .017; OS: P = .17 vs P = .038; PFS: P = .016 vs P = .055). 7 In the pan‐cancer dataset, MUC4 mutation presented limited association with OS, while MUC16 and TTN mutations showed significantly better OS, respectively (Figure S9). Mutation numbers of combined MUC4, MUC16, and TTN was more powerful than TMB in predicting OS, while none of them met statistical significance in PFS or ORR (Figure 2, Table S11, mutation numbers vs TMB: OS: P = .002 vs. P = .041; PFS: P = .56 vs P = .49; ORR: P = .59 vs P = .064).
FIGURE 2.
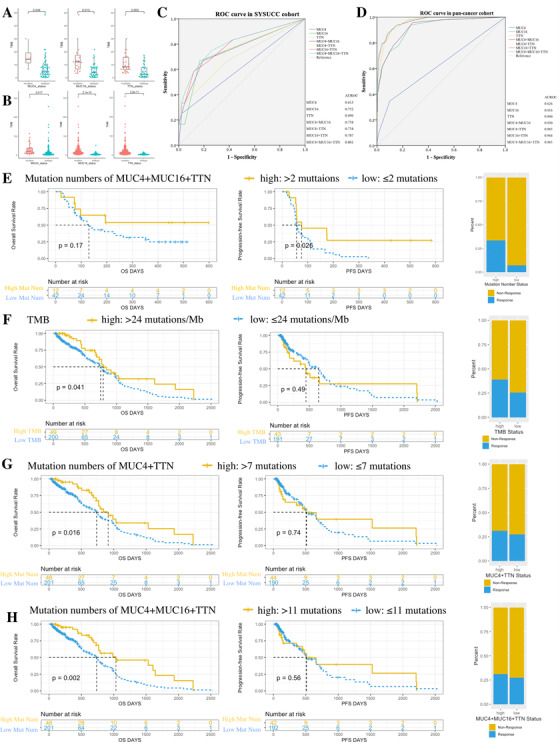
Mutation status and mutation number of MUC4, MUC16, and TTN predict TMB, prognosis, and immunotherapy efficacy in SYSUCC and pan‐cancer cohort. A and B, MUC4, MUC16, and TTN mutations had higher TMB in SYSUCC and pan‐cancer cohort. C and D, ROC curve using gene mutation numbers to estimate TMB status. E, High mutation numbers of MUC4, MUC16, and TTN genes showed better OS, PFS, and immunotherapy efficacy in SYSUCC cohort. F‐H, TMB status, mutation numbers of MUC4 plus TTN, and mutation numbers of MUC4, MUC16 plus TTN were correlated with OS, PFS, and ORR in pan‐cancer cohort
In conclusion, we found MUC4 and MUC16 mutations were potentially associated with prognosis, while H4205Q and V3305_S3320del mutation of MUC4 might be functional mutation sites that affect tumor progression and prognosis. Mutation status and mutation numbers of MUC4, MUC16, and TTN showed high potency in predicting TMB. Random mutation of long gene had no specific function, but might become window to represent whole TMB. Single long gene mutation showed certain but limited correlation with TMB, but combination of MUC4, MUC16, and TTN showed better correlation with TMB and was sufficient to predict TMB. We put forward a gene combination, MUC4, MUC16, and TTN, to predict TMB, and this gene combination may serve as a more economic and convenient biomarker for immunotherapy efficacy substituting for TMB.
ETHICS APPROVAL
For FUSCC cohort, approval was granted by the Ethics Committee of Fudan University Shanghai Cancer Center, and signed informed consents were obtained from all participants. For SYSUCC cohort, the study protocol was approved by the institutional ethics committees of all participating centers, and signed informed consents were obtained from all participants.
CONFLICT OF INTEREST
The authors declared no conflict of interest.
AUTHOR CONTRIBUTIONS
Conceptualization: Guo; project administration and resource: Guo, Xu, and Zhao; data curation: Yang, Zhang, Chen, Xu, and Zhao; formal analysis: Yang, Zhang, Chen, and Zhao; writing and original draft: Yang; writing and review and editing: Guo.
Supporting information
Supporting Information
Supporting Information
Supporting Information
Supporting Information
Supporting Information
Supporting Information
Supporting Information
Supporting Information
Supporting Information
Supporting Information
ACKNOWLEDGMENTS
The authors acknowledged the financial support from National Key R&D Program of China and the National Natural Science Foundation of China. We thanked the patients participated in the study in Fudan University Cancer Center and Sun Yat‐sen University Cancer Center. We also thanked The Cancer Genome Atlas program.
Contributor Information
Qi Zhao, Email: zhaoqi@sysucc.org.cn.
Weijian Guo, Email: guoweijian1@sohu.com.
DATA AVAILABILITY STATEMENT
The FUSCC and SYSUCC datasets generated and/or analyzed during the current study are not publicly available due information protection but are available from the corresponding author on reasonable request. The pan‐cancer dataset generated and/or analyzed during the current study are available in the reference.8
REFERENCES
- 1. Li X, Pasche B, Zhang W, Chen K. Association of MUC16 mutation with tumor mutation load and outcomes in patients with gastric cancer. JAMA Oncology. 2018;4(12):1691‐1698. [DOI] [PMC free article] [PubMed] [Google Scholar]
- 2. Jia Q, Wang J, He N, He J, Zhu B. Titin mutation associated with responsiveness to checkpoint blockades in solid tumors. JCI Insight. 2019;4(10). 10.1172/jci.insight.127901 [DOI] [PMC free article] [PubMed] [Google Scholar]
- 3. Mayakonda A, Lin DC, Assenov Y, Plass C, Koeffler HP. Maftools: efficient and comprehensive analysis of somatic variants in cancer. Genome Res. 2018;28(11):1747‐1756. [DOI] [PMC free article] [PubMed] [Google Scholar]
- 4. Lawrence MS, Stojanov P, Polak P, et al. Mutational heterogeneity in cancer and the search for new cancer‐associated genes. Nature. 2013;499(7457):214‐218. [DOI] [PMC free article] [PubMed] [Google Scholar]
- 5. Maleki Vareki S. High and low mutational burden tumors versus immunologically hot and cold tumors and response to immune checkpoint inhibitors. J Immunother Cancer. 2018;6(1):157. [DOI] [PMC free article] [PubMed] [Google Scholar]
- 6. Samstein RM, Lee CH, Shoushtari AN, et al. Tumor mutational load predicts survival after immunotherapy across multiple cancer types. Nat Genet. 2019;51(2):202‐206. [DOI] [PMC free article] [PubMed] [Google Scholar]
- 7. Wang F, Wei XL, Wang FH, et al. Safety, efficacy and tumor mutational burden as a biomarker of overall survival benefit in chemo‐refractory gastric cancer treated with toripalimab, a PD‐1 antibody in phase Ib/II clinical trial NCT02915432. Ann Oncol. 2019;30(9):1479‐1486. [DOI] [PMC free article] [PubMed] [Google Scholar]
- 8. Miao D, Margolis CA, Vokes NI, et al. Genomic correlates of response to immune checkpoint blockade in microsatellite‐stable solid tumors. Nat Genet. 2018;50(9):1271‐1281. [DOI] [PMC free article] [PubMed] [Google Scholar]
Associated Data
This section collects any data citations, data availability statements, or supplementary materials included in this article.
Supplementary Materials
Supporting Information
Supporting Information
Supporting Information
Supporting Information
Supporting Information
Supporting Information
Supporting Information
Supporting Information
Supporting Information
Supporting Information
Data Availability Statement
The FUSCC and SYSUCC datasets generated and/or analyzed during the current study are not publicly available due information protection but are available from the corresponding author on reasonable request. The pan‐cancer dataset generated and/or analyzed during the current study are available in the reference.8