

Abstract
Healthy lifestyles are promising targets for prevention of cognitive aging, yet the optimal time windows for interventions remain unclear. We selected a case-control sample nested within the Nurses’ Health Study (starting year 1976, mean age = 51 years), including 14,956 women aged ≥70 years who were free of both stroke and cognitive impairment at enrollment in a cognitive substudy (1995–2001). Cases (n = 1,496) were women with the 10% worst slopes of cognitive decline, and controls (n = 7,478) were those with slopes better than the median. We compared the trajectories of body mass index (weight (kg)/height (m)2), alternate Mediterranean diet (A-MeDi) score, and physical activity between groups, from midlife through 1 year preceding the cognitive substudy. In midlife, cases had higher body mass index than controls (mean difference (MD) = 0.59 units, 95% confidence interval (CI): 0.39, 0.80), lower physical activity (MD = –1.41 metabolic equivalent of task–hours/week, 95% CI: –2.07, –0.71), and worse A-MeDi scores (MD = –0.16 points, 95% CI: –0.26, –0.06). From midlife through later life, compared with controls, cases had consistently lower A-MeDi scores but a deceleration of weight gain and a faster decrease in physical activity. In conclusion, maintaining a healthy lifestyle since midlife may help reduce cognitive decline in aging. At older ages, both deceleration of weight gain and a decrease in physical activity may reflect early signs of cognitive impairment.
Keywords: body mass index, cognitive decline, Mediterranean diet, physical activity, prospective cohort studies
Abbreviations
- A-MeDi
alternate Mediterranean diet
- BMI
body mass index
- MD
mean difference
- MET
metabolic equivalent of task
- NHS
Nurses’ Health Study
- TICS
Telephone Interview for Cognitive Status
Long-term exposures to lifestyle factors probably contribute to a large burden of cognitive aging and dementia risk (1, 2). Epidemiologic research has suggested that optimal body weight (3–5), healthy diets such as the Mediterranean diet (6–8), and higher levels of physical activity (9, 10) are associated with less cognitive decline and a reduced risk of dementia. However, there have been inconsistencies in the literature on the age range at which lifestyle factors critically affect cognitive aging and dementia. For example, obesity in midlife has been consistently associated with decreased cognitive performance, whereas studies have been less consistent when body mass index (BMI) was evaluated in late life (11). In addition, healthy diets and regular exercise in late life (6, 10, 12, 13) have generally been found to be inversely associated with cognitive decline or dementia risk, while research with midlife assessment has been relatively limited and inconsistent (14–17).
As aging progresses, subtle cognitive disorders may alter both physiology and behaviors (18), leading to modifications of lifestyle. For example, weight loss and decreases in the intake of healthy foods and in physical activity levels have been reported several years before the diagnosis of dementia (16, 19–22). By addressing temporality, the study of trajectories over a long time period may provide important additional clues for studies carried out during selected time windows. Virtually no research has investigated the long-term trajectories of lifestyle exposures preceding cognitive decline. Our objective was thus to model the trajectories of 3 major lifestyle risk factors—BMI, adherence to a healthy diet (as represented by the alternate Mediterranean diet (A-MeDi) score), and physical activity—from midlife through older ages in relation to subsequent cognitive decline in a large observational cohort of women, the Nurses’ Health Study (NHS).
METHODS
Population
The NHS began in 1976, when 121,700 female registered nurses aged 30–55 years who resided in 11 US states returned a mailed questionnaire about their lifestyle and health, including their weight and height (23). Thereafter, the participants continued to complete biennial questionnaires; a food frequency questionnaire and detailed items on physical activity were added from 1984 and 1986 onward, respectively. To date, the follow-up rate in the NHS is approximately 90%. The Institutional Review Board of Brigham and Women’s Hospital (Boston, Massachusetts) approved the NHS protocol.
Study population
From 1995 to 2001, all nurses who had reached age 70 years or older and had no history of stroke were invited to participate in a telephone-based study of cognitive function. Among eligible women (n = 21,103), 19,415 (92%) completed the initial Telephone Interview for Cognitive Status (TICS), which was conducted by trained nurses and validated. The TICS (score range, 0–41) is a modified version of the Mini-Mental State Examination (24), with a score lower than 31 points indicating cognitive impairment (25). The high reliability of the NHS interviewers and the validity of telephone interviews as compared with in-person examinations have been previously demonstrated (26). Cognitive assessments were repeated on 3 occasions approximately every 2 years, with a high participation rate (>90% among those remaining alive at each follow-up point).
For the current analyses, among the 19,415 participants in the cognitive substudy, we excluded 2,185 women who had cognitive impairment at the first cognitive interview and 1,831 women without any follow-up measure of cognition. We also excluded 443 participants who did not have at least 1 measurement of each lifestyle factor during follow-up. These exclusions led to a sample of 14,956 women.
Assessment of lifestyle risk factors since midlife
To limit the risk of reverse causality, which occurs when behaviors are modified by underlying disease, we ended the modeling of trajectories at the assessment immediately preceding the initial cognitive interview (see Figure 1 for the timeline of data used in the analyses).
Figure 1.
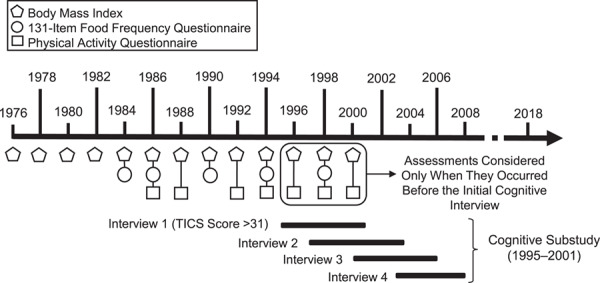
Nurses’ Health Study data used in an analysis of lifestyle factors (body mass index, diet, and physical activity) and subsequent cognitive decline, United States, 1976–2008. TICS, Telephone Interview for Cognitive Status.
Data on weight and height were collected on the baseline questionnaire in 1976, and thereafter weight was recorded every 2 years. Self-reported weight was highly correlated with measured weight in a validation study (27). BMI was computed as weight in kilograms divided by squared height in meters.
Information on usual dietary intake during the past year was collected through a 131-item semiquantitative food frequency questionnaire (28) in 1984, 1986, 1990, 1994, and 1998. For each food item, participants were asked about consumption in 9 frequency categories, ranging from never or less than once a month to more than 6 times per day, and a standardized portion size was specified for estimation of the quantity consumed daily. Food intake estimates were converted into nutrient intakes by multiplying the consumption of each food by its nutrient content using the US Department of Agriculture database (29). From these repeated diet assessments, we computed a 9-point A-MeDi score for each time point (30). All of the repeated A-MeDi scores were defined using the median cutoffs calculated at the first dietary assessment in order to ensure a constant structure of the outcome over time (see Web Appendix 1, available at https://academic.oup.com/aje). At each time point, item nonresponses were imputed using the median value (31) of available data at that time point (see Web Table 1 for counts of missing values).
Detailed information on leisure-time physical activity was collected in 1986, 1988, 1992, 1994, 1996, 1998, and 2000 through a validated questionnaire (32). For the current analysis, total physical activity was calculated as the sum of all reported activities, and low-intensity physical activity was calculated as the sum of walking and stair-climbing. Physical activity was expressed in metabolic equivalent of task (MET)-hours per week according to accepted standards (33), as described previously (34) (see Web Appendix 1). As with diet, at each time point, item nonresponses were imputed using the median value of the data distribution (31) at that time point (see Web Table 2 for counts of missing values).
Statistical analysis
Definition of cases and controls according to the intensity of their cognitive decline.
We determined the trajectories of global cognition by modeling the 4 repeated TICS measures in a linear mixed model, according to the elapsed time since the first cognitive interview in 1995–2001. The model included a correlated individual random intercept and slope, and results were adjusted for age, educational level (on both the intercept and the slope), and an indicator for the first cognitive assessment (35). From the individual slope of cognitive decline estimated by the model (a continuous metric), we defined cases of cognitive decline and controls with lower decline using a priori cutoffs. In our primary analysis, we defined cases as women with the 10% worst cognitive slopes (n = 1,496) and controls as those with a cognitive slope above the median (n = 7,478). Alternative cutoffs were evaluated in supplementary analyses.
Trajectories of lifestyle risk factors in cases and controls.
We estimated trajectories of BMI, A-MeDi score, and physical activity during the years preceding the first cognitive interview (i.e., up to −23, −15, and –13 years for BMI, A-MeDi score, and physical activity, respectively) using latent process mixed models. Latent process mixed models extend linear mixed models to potentially non-Gaussian continuous longitudinal outcomes—the observed measures are transformed into a Gaussian latent process using parameterized link functions (36). We used a quadratic function of time to capture potential nonlinear evolutions of lifestyle exposures over time. The models included case-control status, age, and educational level as a simple effect and in interaction with the function of time. Within-participant correlation was captured by a correlated random intercept and slopes on the function of time (see Web Appendix 1).
Trajectories were represented among cases and controls for the most common profile of covariates in the study sample (i.e., a registered nurse aged 51 years in 1976). This methodological choice only influences the mean levels of trajectories, not the differences between groups. We tested the differences in trajectories between cases and controls using 2-sided Wald tests. First, we compared risk factor changes over the entire time period in the 2 groups by testing group × time interactions. Second, we evaluated pointwise differences in mean risk factors between groups every 2 years, and we accounted for the multiple comparisons by adjusting the threshold of statistical significance (37). Web Appendix 2 provides the R code needed to replicate the analyses.
Supplementary analyses
In supplementary analyses, we first assessed the robustness of the results to the case-control cutpoints. We applied a less stringent definition of controls, including in the control group all of the noncases (i.e., slope within the best 90%), as well as less stringent definitions of cases by considering the 20% or 30% worst cognitive slopes; we also tested a quadratic model for cognition instead of a linear model to define cases and controls. Second, we explored for each factor whether potential differences in trajectories between cases and controls were confounded by the other 2 factors (see Web Appendix 1). Third, we focused on trajectories of low-intensity physical activity (e.g., walking) by excluding all of the women who reported engaging in activities with an intensity higher than 6 METs (with the exception of stair-climbing, which is an important contributor to walking). Finally, we examined the robustness of findings to statistical assumptions. We allowed smoother trajectories over time as approximated by natural cubic splines, and considered using multiple imputation by chained equations (M = 5 imputations) to handle missing data items.
We used the SAS software package (SAS Institute, Inc., Cary, North Carolina), version 9.1, for selection of the case-control sample; the “lcmm” function of the lcmm R package, version 1.7.8 (38), for latent process mixed models (R Foundation for Statistical Computing, Vienna, Austria); and the “mice” function of the mice R package, version 2.46.0 (39), for the imputation by chained equations.
RESULTS
Among the 14,956 women included in the study sample, the average TICS score at the first cognitive interview was 34.4 (standard deviation, 2.0) points, and 86.4% of the women completed at least 3 of the 4 interviews between 1995 and 2008 (average duration of follow-up = 5.7 (standard deviation, 1.9) years). The average estimated individual slope of cognitive decline was −0.2 (standard deviation, 0.2) points per year (Figure 2).
Figure 2.
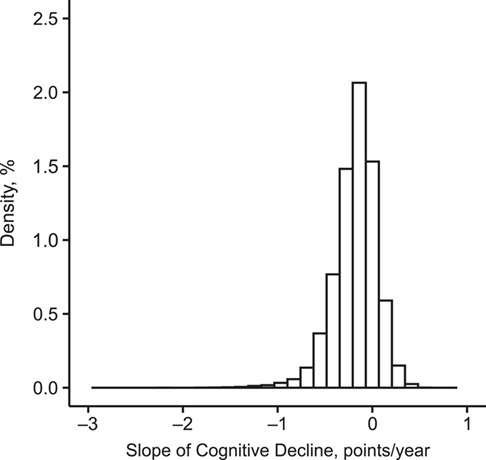
Distribution of individual slopes of cognitive decline, as measured by the Telephone Interview for Cognitive Status (25), in the Nurses’ Health Study (n = 14,956), United States, 1995–2008. Cases (n = 1,496) were defined as the women with the 10% worst cognitive slopes (cutoff value ≤ −0.461) and controls (n = 7,478) as those with a cognitive slope above the median (cutoff value > −0.156).
In 1986 (i.e., the midpoint time of the longest follow-up period for the risk factors examined; Figure 1), cases and controls were approximately 61 years of age, on average, and most had an associate’s degree (Table 1). Compared with controls, cases of cognitive decline were more likely to smoke and to report high blood pressure, a high cholesterol level, and diabetes. In addition, cases were more often overweight or obese, and they reported a slightly lower average A-MeDi score and physical activity, including low-intensity activity. The mean observed values of BMI, A-MeDi score, and physical activity during the years preceding the initial cognitive interview are presented in Web Figure 1.
Table 1.
Characteristics of Cases of Cognitive Declinea (First Decile of Slope or Lower) and Controls (Greater Than Median Slope) in the Nurses’ Health Study, United States, 1986b
| Characteristic |
Cases
(n = 1,496) |
Controls
(n = 7,478) |
||
|---|---|---|---|---|
| Mean (SD) | % | Mean (SD) | % | |
| Response to the 1986 questionnaireb | 95.9 | 95.8 | ||
| Age, years | 61.3 (2.5) | 60.9 (2.4) | ||
| Educational level | ||||
| Registered nurse | 78.3 | 77.0 | ||
| Bachelor’s degree | 16.1 | 16.9 | ||
| Master’s or doctoral degree | 5.6 | 6.1 | ||
| Current smokerc | 19.7 | 15.8 | ||
| History of chronic disease | ||||
| High blood pressure | 38.7 | 31.3 | ||
| High cholesterol level | 19.5 | 17.2 | ||
| Diabetes mellitus | 4.9 | 2.8 | ||
| Body mass indexc,d | 25.9 (4.8) | 25.3 (4.2) | ||
| Body mass index categoryc | ||||
| Underweight (<18.5) | 1.4 | 0.9 | ||
| Normal-weight (18.5–24.9) | 48.9 | 54.7 | ||
| Overweight (25.0–29.9) | 32.8 | 31.7 | ||
| Obese (≥30.0) | 16.9 | 12.8 | ||
| Physical activity, MET-hours/week | ||||
| Total | 13.1 (25.2) | 13.6 (18.3) | ||
| Low-intensitye | 6.7 (9.2) | 7.4 (9.6) | ||
| A-MeDi scorec | 4.3 (1.8) | 4.4 (1.9) | ||
| A-MeDi componentsc | ||||
| Food consumption, servings/day | ||||
| Vegetables | 3.3 (1.9) | 3.3 (1.9) | ||
| Legumes | 0.4 (0.3) | 0.4 (0.3) | ||
| Fruits | 2.6 (1.5) | 2.6 (1.5) | ||
| Nuts | 0.4 (0.5) | 0.4 (0.5) | ||
| Whole grains | 1.6 (1.2) | 1.6 (1.2) | ||
| Fish | 0.4 (0.3) | 0.4 (0.3) | ||
| Red/processed meat | 0.8 (0.5) | 0.8 (0.5) | ||
| Alcohol consumption, g/day | 6.3 (11.3) | 6.5 (10.7) | ||
| MUFA:SFA ratio | 1.1 (0.2) | 1.1 (0.2) | ||
Abbreviations: A-MeDi, alternate Mediterranean diet; MET, metabolic equivalent of task; MUFA, monounsaturated fatty acid; SD, standard deviation; SFA, saturated fatty acid.
a Cognitive decline was measured using the Telephone Interview for Cognitive Status (25).
b The midpoint time of the longest study period for exposures (i.e., 1986 for body mass index).
c Among nonmissing values. Data were missing for 0.3% of cases and 0.1% of controls for smoking, 15.8% of cases and 12.0% of controls for body mass index, and 20.7% of cases and 18.3% of controls for A-MeDi score.
d Weight (kg)/height (m)2.
e Low-intensity physical activity was calculated as the sum of walking and stair-climbing.
Estimated trajectories of lifestyle risk factors
In midlife, cases had higher BMIs (Figure 3A), lower adherence to the A-MeDi (Figure 3B), and lower levels of total (Figure 3C) and low-intensity (Figure 3D) physical activity than controls. For example, the mean differences (MDs) between groups (cases vs. controls) were 0.59 units (95% confidence interval (CI): 0.39, 0.80) at −23 years for BMI; −1.41 MET-hours/week (95% CI: −2.07, –0.71) and −0.76 MET-hours/week (95% CI: −1.13, –0.41) at −13 years for total and low-intensity physical activity, respectively; and −0.16 points (95% CI: −0.26, –0.06) at −15 years for A-MeDi score.
Figure 3.
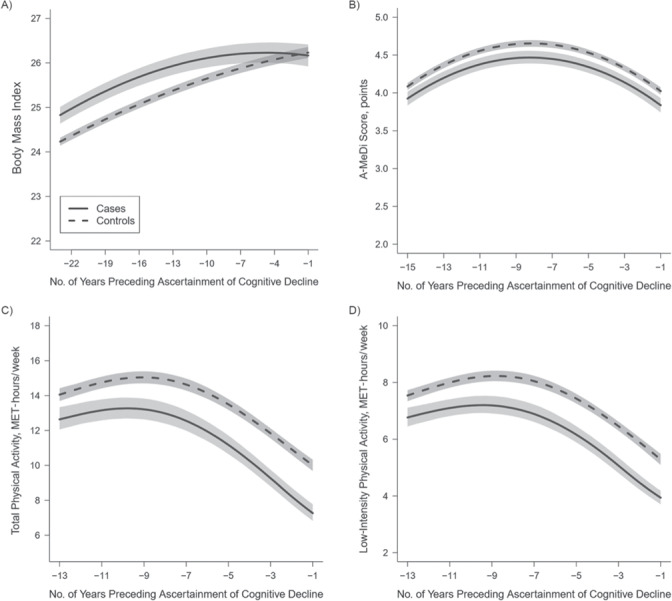
Trajectories of body mass index (weight (kg)/height (m)2) (A), alternate Mediterranean diet (A-MeDi) score (B), and total (C) and low-intensity (D) physical activity during the 23, 15, and 13 years preceding ascertainment of cognitive decline among cases of cognitive decline (n = 1,496) and controls (n = 7,478) in the Nurses’ Health Study, United States, 1976–2000. Mean predicted trajectories (solid lines, cases; dashed lines, controls) with 95% pointwise confidence intervals (shading) were predicted using a latent process linear mixed model according to the number of years preceding ascertainment of cognitive decline. The model included a quadratic function of time (time, time2) and adjusted for case-control status, age, and educational level and their interactions with the function of time; correlated random effects were considered on both the intercept and the time function. Trajectories were plotted for the most common profile of covariates in the study sample (a registered nurse aged 51 years in 1976). Outcomes were normalized by means of I-splines, and the corrected thresholds for multiple testing were α = 0.03 for body mass index, α = 0.02 for A-MeDi score, α = 0.02 for low-intensity physical activity, and α = 0.01 for total physical activity. MET, metabolic equivalent of task.
From midlife through later life, the trajectories of BMI and physical activity started to differ between groups (P < 0.001 for group × time interactions for both BMI and physical activity). Although both groups gained weight over time, cases had a deceleration of weight gain starting at approximately −13 years, followed by weight stabilization at −3 years, leading to progressive attenuation of BMI differences between groups (Figure 3A; MD = 0.49 units (95% CI: 0.27, 0.72), MD = 0.32 units (95% CI: 0.09, 0.56), and MD = 0.09 units (95% CI: −0.17, 0.33) at −11 years, −7 years, and –3 years, respectively). Physical activity levels started to decrease among cases around −9 years, and the difference between cases and controls gradually increased from midlife to older ages (for total physical activity (Figure 3C), MD = –1.59 MET-hours/week (95% CI: −2.21, –0.97), MD = −2.08 MET-hours/week (95% CI: −2.69, –1.46), and MD = −2.56 MET-hours/week (95% CI: −3.06, –2.03) at −11 years, −7 years, and –3 years, respectively; for low-intensity physical activity (Figure 3D), MD = –0.89 MET-hours/week (95% CI: −1.22, –0.55), MD = −1.15 MET-hours/week (95% CI: −1.49, –0.80), and MD = –1.38 MET-hours/week (95% CI: −1.67, –1.10) at −11 years, −7 years, and –3 years, respectively). For A-MeDi score, we found consistently lower diet quality for cases than for controls (Figure 3B; MD = –0.18 points (95% CI: −0.27, –0.09), MD = −0.19 points (95% CI: −0.28, –0.10), and MD = –0.19 points (95% CI: −0.28, –0.11) at −11 years, −7 years, and –3 years, respectively) and a similar evolution over time for both groups (P = 0.86 for group × time interaction), with increasing adherence to the A-MeDi from midlife to around −8 years, followed by a slight decrease in A-MeDi scores in both groups.
One year before ascertainment of cognitive decline in later life, the BMI level of cases attained that of controls (Figure 3A; MD = –0.07 units, 95% CI: −0.33, 0.19), while physical activity levels were markedly lower for cases than for controls (Figures 3C and 3D; MD =–2.71 MET-hours/week (95% CI: −3.21, –2.21) and MD = –1.34 MET-hours/week (95% CI: −1.61, –1.06) for total and low-intensity physical activity, respectively). Diet quality appeared less influenced by time and cognitive aging; as found on the entire trajectory from midlife to late life, A-MeDi score remained slightly lower for cases than for controls at −1 year (Figure 3B; MD = –0.19 points, 95% CI: −0.29, –0.09). For each risk factor, the MDs between groups every 2 years (with confidence intervals) are presented in Web Figure 2.
Supplementary analyses
When considering different thresholds for the definition of cases or controls or defining cases and controls according to a quadratic cognitive change, all relative shapes of trajectories remained similar, although MDs between groups were sometimes smaller (Web Figures 3–6). Overall, findings remained largely consistent across varying case and control cutpoints and models. Likewise, adjustment of each lifestyle factor trajectory for the other two did not modify the differences in BMI between groups but slightly attenuated those in physical activity and A-MeDi score (Web Figures 7 and 8). Finally, the results were not meaningfully modified when excluding women who reported activity levels higher than 6 MET-hours/week (Web Figure 9), when using natural cubic splines (Web Figure 10), or when using multiple imputation (results available upon request).
DISCUSSION
In this large prospective study of women, participants with greater cognitive decline after age 70 years had higher body weight, a lower level of physical activity, and lower diet quality during a ≤2-decade period from midlife to late life. However, while there was an average increase in weight and diet quality and a decrease in physical activity levels with aging among all women, those with worse cognitive aging at older ages had a deceleration of weight gain and a steeper drop in physical activity starting several years before cognitive ascertainment. These findings support associations of healthy weight, healthy diet, and regular exercise starting in midlife with lower cognitive decline in older age. One likely explanation for the later deceleration of weight gain and decrease in physical activity levels is reverse causation (as early consequences of underlying cognitive changes and deteriorating health).
Major strengths of the current study include a large sample size, a high follow-up rate, and the long duration of follow-up in the NHS, allowing for analysis of both long-term lifestyle habits prior to cognitive impairment (over a period of up to 23 years) and subsequent cognitive decline (over a period of up to 6 years). The use of nonconcomitant time periods for the exposure and outcome assessments also reduced reverse causality, and the use of generally invariant questionnaires since 1984–1986 decreased noise in the modeling of trajectories. Additionally, we limited misclassification in the definition of cases and controls by using a validated test of global cognition (TICS) and by modeling cognitive decline with linear mixed-effect models. Finally, by modeling trajectories of lifestyle factors prior to cognitive decline using a flexible latent process mixed-effect model combined with a case-control approach, our methodology enabled a direct comparison of trajectories among groups, with statistical testing of differences.
However, several limitations warrant consideration. First, generalization of our results is limited to primarily Caucasian women, and further research should be conducted in populations with different sociodemographic backgrounds. Moreover, because of the observational nature of the present study, a causal association between lifestyle factors and cognitive disorders cannot be formally established, and our findings should be interpreted with caution. Finally, although the homogeneity of our study population of nurses with respect to demographic characteristics and health knowledge reduces the possibilities for confounding, residual confounding may still persist.
We are aware of only 2 large studies, the Whitehall II Study in the United Kingdom and the Three-City study in France, in which risk factor trajectories preceding dementia diagnosis were predicted by statistical modeling (17, 21, 22, 40). Comparability with this existing research is limited. Indeed, our study focused on cognitive decline rather than dementia, and we ended follow-up for exposures at the questionnaire immediately preceding the cognitive substudy to limit reverse causality. Nonetheless, BMI trajectories found in our cohort were generally in accordance with those of previous studies. In the Whitehall II Study, compared with controls, dementia cases had higher BMIs 16–28 years prior to diagnosis, and BMI dropped below that of controls starting 8 years prior to diagnosis (40). In the Three-City Study, BMI was higher in dementia cases from 14 years before diagnosis onward and dropped below that of controls about 7 years before diagnosis (22). In our American population with high BMI and substantial weight gain over the life course, we did not observe the weight loss reported in prodromal dementia in the 2 European cohorts, but we did observe a deceleration of weight gain among cases approximately a decade prior to ascertainment of cognitive decline.
For diet and physical activity, while extensive epidemiologic data support an association of higher adherence to the MeDi (12, 41) and greater levels of physical activity (10) with lower cognitive decline or dementia, most of the previous studies assessed late-life exposures; research on midlife has been limited and inconsistent. In Whitehall II, adherence to the Alternate Healthy Eating Index in midlife was not associated with dementia risk (42). In the NHS, long-term adherence to the A-MeDi since midlife was associated with better average cognitive status, but not cognitive decline, after age 70 years (14). The present study extended the findings of the previous report (14), using a powerful and flexible approach applied to A-MeDi trajectories since midlife. We recognize that average differences between cases and controls were of modest magnitude (a 0.2-point difference in A-MeDi score over a maximum of 9 points). However, the objective here was to compare average trajectories of diet quality among cases and controls, not to evaluate the full range of diet exposure levels in relation to cognitive decline; thus, modest differences were expected.
Regular physical activity in midlife has been related to lower risk of cognitive decline or dementia (43–45), including in the NHS (34), but this association was not consistently reported (15–17). As with BMI, the Whitehall II investigators found a decrease in physical activity 9 years before dementia diagnosis, while levels of physical activity a decade or more prior to dementia were not different from those of participants free of dementia (17). We also found a decrease in physical activity among cases 9 years before ascertainment of cognitive decline. However, physical activity levels were consistently lower among cases in the NHS. This persistent difference in physical activity levels between cases and controls before the drop in physical activity attributed to the evolution of incipient deterioration of cognitive/general health with aging suggests that low physical activity may be both a risk factor for cognitive decline (in midlife) and a potential prodrome of underlying age-related alterations when getting older.
Overweight may alter cognitive health through various mechanisms, including elevated leptin levels and inflammation, leading to impaired cerebral metabolism and neuronal degradation (46). In contrast, healthy diets and physical activity may protect the aging brain through a beneficial effect on cardiovascular risk factors (including overweight/obesity) and their ability to reduce inflammation (7, 10), thereby improving brain plasticity (7, 47) and lowering age-related brain atrophy (48). Overall, the preclinical and clinical literature supporting a beneficial effect of healthy weight, physical activity, and diet on the multiple pathways associated with cognitive aging is substantial.
At the same time, the aging process involves multiple psychosocial, behavioral, and physiological changes, which may explain part of the decreases in weight gain and physical activity found in our cases of cognitive decline. For example, the loss of appetite and taste associated with aging may lead to a general decline in dietary intake, malnutrition, and weight loss (49), and the slowed performance and decrease of muscular strength may decrease engagement in regular exercise with aging (50). Life-altering experiences that increase with age (e.g., caregiving or the death of a parent or spouse) can also induce both cognitive decline (51) and behavioral modifications (e.g., a reduction of physical activity or worse diet). In addition to mechanisms associated with general aging, there is a suggestion that physiology and behaviors may be altered years before diagnosis in dementia. The neuropathological changes underlying cognitive aging start decades before dementia onset (52), with a progressive evolution of cognitive deficits (18), alterations in activities of daily living (53), and loss of olfactory function and taste (54), potentially leading to loss of initiative, a decrease in physical activity and dietary intake, and eventually weight loss or less weight gain.
In summary, our longitudinal study indicates dynamic relationships between lifestyle factors and cognitive health. In this large cohort of women, those with cognitive decline after 70 years of age had poorer body weight, diet, and physical activity levels in midlife. Approximately a decade before ascertainment of cognitive decline, body weight gain decelerated and physical activity decreased among cases, as likely prodromes of accelerated aging in those who later developed cognitive decline. These results emphasize the importance of adhering to a healthy lifestyle from midlife onward to maintain optimal brain aging, while suggesting that associations of risk factors in late life with cognitive aging may be subject to bias in studies focused on late life. These findings may be key both for understanding risk factors for cognitive aging and for designing and analyzing the results of cognitive research.
Supplementary Material
ACKNOWLEDGMENTS
Author affiliations: Bordeaux Population Health Research Center, Institut National de la Santé et de la Recherche Médicale Unité 1219, and University of Bordeaux, Institut de Santé Publique d’Epidémiologie et de Développement, Bordeaux, France (Maude Wagner, Cécile Proust-Lima, and Cécilia Samieri); Department of Epidemiology, Harvard T.H. Chan School of Public Health, Boston, Massachusetts (Francine Grodstein); and Channing Division of Network Medicine, Department of Medicine, Brigham and Women’s Hospital and Harvard Medical School, Boston, Massachusetts (Francine Grodstein).
C.P.-L. and C.S. contributed equally to this work.
The Nurses’ Health Study was funded by National Institutes of Health grants UM1-CA186107 and CA-40356. This project was partly funded by a grant from France Alzheimer DATALINk, a Jean Walter-Zellidja grant awarded by the Académie Française, and an IdEx-Bordeaux grant awarded by the University of Bordeaux.
None of the funding sources influenced the design, conduct, or analysis of this study.
F.G. received unrestricted research funds from Nestlé Waters, Inc. (Issy-les-Moulineaux, France) and the California Walnut Commission (Folsom, California).
REFERENCES
- 1. Livingston G, Sommerlad A, Orgeta V, et al. Dementia prevention, intervention, and care. Lancet. 2017;390(10113):2673–2734. [DOI] [PubMed] [Google Scholar]
- 2. Kivipelto M, Mangialasche F, Ngandu T. Lifestyle interventions to prevent cognitive impairment, dementia and Alzheimer disease. Nat Rev Neurol. 2018;14(11):653–666. [DOI] [PubMed] [Google Scholar]
- 3. Prickett C, Brennan L, Stolwyk R. Examining the relationship between obesity and cognitive function: a systematic literature review. Obes Res Clin Pract. 2015;9(2):93–113. [DOI] [PubMed] [Google Scholar]
- 4. Anstey KJ, Cherbuin N, Budge M, et al. Body mass index in midlife and late-life as a risk factor for dementia: a meta-analysis of prospective studies. Obes Rev. 2011;12(5):e426–e437. [DOI] [PubMed] [Google Scholar]
- 5. Pedditzi E, Peters R, Beckett N. The risk of overweight/obesity in mid-life and late life for the development of dementia: a systematic review and meta-analysis of longitudinal studies. Age Ageing. 2016;45(1):14–21. [DOI] [PubMed] [Google Scholar]
- 6. Trichopoulou A, Kyrozis A, Rossi M, et al. Mediterranean diet and cognitive decline over time in an elderly Mediterranean population. Eur J Nutr. 2015;54(8):1311–1321. [DOI] [PubMed] [Google Scholar]
- 7. Scarmeas N, Anastasiou CA, Yannakoulia M. Nutrition and prevention of cognitive impairment. Lancet Neurol. 2018;17(11):1006–1015. [DOI] [PubMed] [Google Scholar]
- 8. Féart C, Samieri C, Rondeau V, et al. Adherence to a Mediterranean diet, cognitive decline, and risk of dementia. JAMA. 2009;302(6):638–648. [DOI] [PMC free article] [PubMed] [Google Scholar]
- 9. Hamer M, Chida Y. Physical activity and risk of neurodegenerative disease: a systematic review of prospective evidence. Psychol Med. 2009;39(1):3–11. [DOI] [PubMed] [Google Scholar]
- 10. Guure CB, Ibrahim NA, Adam MB, et al. Impact of physical activity on cognitive decline, dementia, and its subtypes: meta-analysis of prospective studies. Biomed Res Int. 2017;2017:9016924. [DOI] [PMC free article] [PubMed] [Google Scholar]
- 11. Gustafson D. Adiposity indices and dementia. Lancet Neurol. 2006;5(8):713–720. [DOI] [PubMed] [Google Scholar]
- 12. Koyama A, Houston DK, Simonsick EM, et al. Association between the Mediterranean diet and cognitive decline in a biracial population. J Gerontol A Biol Sci Med Sci. 2015;70(3):354–359. [DOI] [PMC free article] [PubMed] [Google Scholar]
- 13. Scarmeas N, Luchsinger JA, Schupf N, et al. Physical activity, diet, and risk of Alzheimer disease. JAMA. 2009;302(6):627–637. [DOI] [PMC free article] [PubMed] [Google Scholar]
- 14. Samieri C, Okereke OI, Devore E, et al. Long-term adherence to the Mediterranean diet is associated with overall cognitive status, but not cognitive decline, in women. J Nutr. 2013;143(4):493–499. [DOI] [PMC free article] [PubMed] [Google Scholar]
- 15. Morgan GS, Gallacher J, Bayer A, et al. Physical activity in middle-age and dementia in later life: findings from a prospective cohort of men in Caerphilly, South Wales and a meta-analysis. J Alzheimers Dis. 2012;31(3):569–580. [DOI] [PubMed] [Google Scholar]
- 16. Gross AL, Lu H, Meoni L, et al. Physical activity in midlife is not associated with cognitive health in later life among cognitively normal older adults. J Alzheimers Dis. 2017;59(4):1349–1358. [DOI] [PubMed] [Google Scholar]
- 17. Sabia S, Dugravot A, Dartigues J-F, et al. Physical activity, cognitive decline, and risk of dementia: 28 year follow-up of Whitehall II cohort study. BMJ. 2017;357:j2709. [DOI] [PMC free article] [PubMed] [Google Scholar]
- 18. Amieva H, Le Goff M, Millet X, et al. Prodromal Alzheimer’s disease: successive emergence of the clinical symptoms. Ann Neurol. 2008;64(5):492–498. [DOI] [PubMed] [Google Scholar]
- 19. Knopman DS, Edland SD, Cha RH, et al. Incident dementia in women is preceded by weight loss by at least a decade. Neurology. 2007;69(8):739–746. [DOI] [PubMed] [Google Scholar]
- 20. Tolppanen A-M, Ngandu T, Kåreholt I, et al. Midlife and late-life body mass index and late-life dementia: results from a prospective population-based cohort. J Alzheimers Dis. 2014;38(1):201–209. [DOI] [PubMed] [Google Scholar]
- 21. Wagner M, Dartigues J-F, Samieri C, et al. Modeling risk-factor trajectories when measurement tools change sequentially during follow-up in cohort studies: application to dietary habits in prodromal dementia. Am J Epidemiol. 2018;187(4):845–854. [DOI] [PubMed] [Google Scholar]
- 22. Wagner M, Helmer C, Tzourio C, et al. Evaluation of the concurrent trajectories of cardiometabolic risk factors in the 14 years before dementia. JAMA Psychiatry. 2018;75(10):1033–1042. [DOI] [PMC free article] [PubMed] [Google Scholar]
- 23. Colditz GA, Manson JE, Hankinson SE. The Nurses’ Health Study: 20-year contribution to the understanding of health among women. J Women’s Health. 1997;6(1):49–62. [DOI] [PubMed] [Google Scholar]
- 24. Folstein MF, Folstein SE, McHugh PR. “Mini-mental state”: a practical method for grading the cognitive state of patients for the clinician. J Psychiatr Res. 1975;12(3):189–198. [DOI] [PubMed] [Google Scholar]
- 25. Brandt J, Spencer M, Folstein M. The Telephone Interview for Cognitive Status. Neuropsychiatry Neuropsychol Behav Neurol. 1988;1(2):111–117. [Google Scholar]
- 26. Stampfer MJ, Kang JH, Chen J, et al. Effects of moderate alcohol consumption on cognitive function in women. N Engl J Med. 2005;352(3):245–253. [DOI] [PubMed] [Google Scholar]
- 27. Willett W, Stampfer MJ, Bain C, et al. Cigarette smoking, relative weight, and menopause. Am J Epidemiol. 1983;117(6):651–658. [DOI] [PubMed] [Google Scholar]
- 28. Willett WC, Sampson L, Stampfer MJ, et al. Reproducibility and validity of a semiquantitative food frequency questionnaire. Am J Epidemiol. 1985;122(1):51–65. [DOI] [PubMed] [Google Scholar]
- 29. Yuan C, Spiegelman D, Rimm EB, et al. Validity of a dietary questionnaire assessed by comparison with multiple weighed dietary records or 24-hour recalls. Am J Epidemiol. 2017;185(7):570–584. [DOI] [PMC free article] [PubMed] [Google Scholar]
- 30. Fung TT, Rexrode KM, Mantzoros CS, et al. Mediterranean diet and incidence of and mortality from coronary heart disease and stroke in women. Circulation. 2009;119(8):1093–1100. [DOI] [PMC free article] [PubMed] [Google Scholar]
- 31. Parr CL, Hjartåker A, Scheel I, et al. Comparing methods for handling missing values in food-frequency questionnaires and proposing k nearest neighbours imputation: effects on dietary in the Norwegian Women and Cancer Study (NOWAC). Public Health Nutr. 2008;11(4):361–370. [DOI] [PubMed] [Google Scholar]
- 32. Wolf AM, Hunter DJ, Colditz GA, et al. Reproducibility and validity of a self-administered physical activity questionnaire. Int J Epidemiol. 1994;23(5):991–999. [DOI] [PubMed] [Google Scholar]
- 33. Ainsworth BE, Haskell WL, Leon AS, et al. Compendium of Physical Activities: classification of energy costs of human physical activities. Med Sci Sports Exerc. 1993;25(1):71–80. [DOI] [PubMed] [Google Scholar]
- 34. Weuve J, Kang JH, Manson JE, et al. Physical activity, including walking, and cognitive function in older women. JAMA. 2004;292(12):1454–1461. [DOI] [PubMed] [Google Scholar]
- 35. Vivot A, Power MC, Glymour MM, et al. Jump, hop, or skip: modeling practice effects in studies of determinants of cognitive change in older adults. Am J Epidemiol. 2016;183(4):302–314. [DOI] [PMC free article] [PubMed] [Google Scholar]
- 36. Proust-Lima C, Amieva H, Jacqmin-Gadda H. Analysis of multivariate mixed longitudinal data: a flexible latent process approach. Br J Math Stat Psychol. 2013;66(3):470–487. [DOI] [PubMed] [Google Scholar]
- 37. Liquet B, Commenges D. Correction of the P value after multiple coding of an explanatory variable in logistic regression. Stat Med. 2001;20(19):2815–2826. [DOI] [PubMed] [Google Scholar]
- 38. Proust-Lima C, Philipps V, Liquet B. Estimation of extended mixed models using latent classes and latent processes: the R package lcmm. J Stat Softw Artic. 2017;78:1–56. [Google Scholar]
- 39. van, Buuren S, Groothuis-Oudshoorn K. Mice: multivariate imputation by chained equations in R. J Stat Softw. 2011;45(3):1–67. [Google Scholar]
- 40. Singh-Manoux A, Dugravot A, Shipley M, et al. Obesity trajectories and risk of dementia: 28 years of follow-up in the Whitehall II Study. Alzheimers Dement. 2018;14(2):178–186. [DOI] [PMC free article] [PubMed] [Google Scholar]
- 41. Singh B, Parsaik AK, Mielke MM, et al. Association of Mediterranean diet with mild cognitive impairment and Alzheimer’s disease: a systematic review and meta-analysis. J Alzheimers Dis. 2014;39(2):271–282. [DOI] [PMC free article] [PubMed] [Google Scholar]
- 42. Akbaraly TN, Singh-Manoux A, Dugravot A, et al. Association of midlife diet with subsequent risk for dementia. JAMA. 2019;321(10):957–968. [DOI] [PMC free article] [PubMed] [Google Scholar]
- 43. Iso-Markku P, Waller K, Vuoksimaa E, et al. Midlife physical activity and cognition later in life: a prospective twin study. J Alzheimers Dis. 2016;54(4):1303–1317. [DOI] [PubMed] [Google Scholar]
- 44. Tolppanen A-M, Solomon A, Kulmala J, et al. Leisure-time physical activity from mid- to late life, body mass index, and risk of dementia. Alzheimers Dement. 2015;11(4):434–443.e6. [DOI] [PubMed] [Google Scholar]
- 45. Rovio S, Kåreholt I, Helkala E-L, et al. Leisure-time physical activity at midlife and the risk of dementia and Alzheimer’s disease. Lancet Neurol. 2005;4(11):705–711. [DOI] [PubMed] [Google Scholar]
- 46. Kiliaan AJ, Arnoldussen IAC, Gustafson DR. Adipokines: a link between obesity and dementia? Lancet Neurol. 2014;13(9):913–923. [DOI] [PMC free article] [PubMed] [Google Scholar]
- 47. Pereira AC, Huddleston DE, Brickman AM, et al. An in vivo correlate of exercise-induced neurogenesis in the adult dentate gyrus. Proc Natl Acad Sci U S A. 2007;104(13):5638–5643. [DOI] [PMC free article] [PubMed] [Google Scholar]
- 48. Colcombe SJ, Erickson KI, Raz N, et al. Aerobic fitness reduces brain tissue loss in aging humans. J Gerontol A Biol Sci Med Sci. 2003;58(2):176–180. [DOI] [PubMed] [Google Scholar]
- 49. Amieva H, Andrieu S, Berr C. Maladie d’Alzheimer: enjeux scientifiques, médicaux et sociétaux. Paris, France: Institut national de la santé et de la recherche médicale; 2007. http://www.ipubli.inserm.fr/handle/10608/72. Accessed September 1, 2019. [Google Scholar]
- 50. Ding Y, Kuha J, Murphy M. Pathways from physical frailty to activity limitation in older people: identifying moderators and mediators in the English Longitudinal Study of Ageing. Exp Gerontol. 2017;98:169–176. [DOI] [PubMed] [Google Scholar]
- 51. Shin SH, Kim G, Park S. Widowhood status as a risk factor for cognitive decline among older adults. Am J Geriatr Psychiatry. 2018;26(7):778–787. [DOI] [PubMed] [Google Scholar]
- 52. Jack CR, Knopman DS, Jagust WJ, et al. Hypothetical model of dynamic biomarkers of the Alzheimer’s pathological cascade. Lancet Neurol. 2010;9(1):119–128. [DOI] [PMC free article] [PubMed] [Google Scholar]
- 53. Pérès K, Helmer C, Amieva H, et al. Natural history of decline in instrumental activities of daily living performance over the 10 years preceding the clinical diagnosis of dementia: a prospective population-based study. J Am Geriatr Soc. 2008;56(1):37–44. [DOI] [PubMed] [Google Scholar]
- 54. Wilson RS, Arnold SE, Schneider JA, et al. Olfactory impairment in presymptomatic Alzheimer’s disease. Ann N Y Acad Sci. 2009;1170:730–735. [DOI] [PMC free article] [PubMed] [Google Scholar]
Associated Data
This section collects any data citations, data availability statements, or supplementary materials included in this article.