

Abstract
Gonadotropes represent approximately 5–15% of the total endocrine cell population in the mammalian anterior pituitary. Therefore, assessing the effects of experimental manipulation on virtually any parameter of gonadotrope biology is difficult to detect and parse from background noise. In non-rodent species, applying techniques such as high-throughput ribonucleic acid (RNA) sequencing is problematic due to difficulty in isolating and analyzing individual endocrine cell populations. Herein, we exploited cell-specific properties inherent to the proximal promoter of the human glycoprotein hormone alpha subunit gene (CGA) to genetically target the expression of a fluorescent reporter (green fluorescent protein [GFP]) selectively to ovine gonadotropes. Dissociated ovine pituitary cells were cultured and infected with an adenoviral reporter vector (Ad-hαCGA-eGFP). We established efficient gene targeting by successfully enriching dispersed GFP-positive cells with flow cytometry. Confirming enrichment of gonadotropes specifically, we detected elevated levels of luteinizing hormone (LH) but not thyrotropin-stimulating hormone (TSH) in GFP-positive cell populations compared to GFP-negative populations. Subsequently, we used next-generation sequencing to obtain the transcriptional profile of GFP-positive ovine gonadotropes in the presence or absence of estradiol 17-beta (E2), a key modulator of gonadotrope function. Compared to non-sorted cells, enriched GFP-positive cells revealed a distinct transcriptional profile consistent with established patterns of gonadotrope gene expression. Importantly, we also detected nearly 200 E2-responsive genes in enriched gonadotropes, which were not apparent in parallel experiments on non-enriched cell populations. From these data, we conclude that CGA-targeted adenoviral gene transfer is an effective means for selectively labeling and enriching ovine gonadotropes suitable for investigation by numerous experimental approaches.
Keywords: anterior pituitary, gonadotropin-releasing hormone (GnRH/GnRH receptor): ovine/sheep, transcription
Summary sentence: Unique RNA signatures establish the efficacy of combining adenovirus-mediated gene transfer and flow cytometry to isolate an enriched population of gonadotrope cells from the ovine pituitary gland.
Introduction
Ovulation is one of the most fundamental events in reproduction, requiring a coordinated surge of luteinizing hormone (LH), released by pituitary gonadotropes into the peripheral circulation. Two critical endocrine inputs cue heightened LH secretion by gonadotropes: (1) the hypothalamic neuropeptide, gonadotropin-releasing hormone (GnRH) and (2) the ovarian steroid hormone, estradiol-17β (E2) [1, 2]. Thus, gonadotropes ultimately must integrate both hypothalamic and ovarian signals to generate the LH surge. It is almost axiomatic that E2 serves as the most proximate regulator of the LH surge by enhancing the sensitivity of gonadotropes to GnRH by increasing GnRH receptor (GNRHR) expression [2–6] and by increasing the frequency of GnRH pulses from the hypothalamus. In sheep, the timing of the events associated with the LH surge is well characterized [2, 7–9]. Therefore, the ovine pituitary serves as a powerful model to define the unique transcriptional signatures induced by E2, and then by GnRH, in the context of clearly defined windows of the LH surge.
Unfortunately, in the ovine pituitary, we have only a limited understanding of underlying cellular mechanisms at the level of the gonadotrope by which either E2 or GnRH regulates gonadotropin production. Investigation of the mechanisms underlying E2 signaling in gonadotropes has been immensely challenging for one principal reason: gonadotropes are one of five endocrine cell types in the pituitary and comprise only 5–15% of all pituitary cells. Therefore, the effect of a treatment on any parameter of gonadotrope biology, whether that is an alteration in gene expression, an association of transcription factors with promoter sequences, epigenetic changes, or phosphorylation of proteins, is difficult to detect and parse from the background noise created by the majority of non-gonadotrope cells in the pituitary gland.
We should underscore that genes that are expressed uniquely in gonadotropes, such as luteinizing hormone beta glycoprotein (LHB) and GNRHR, are routinely assayed and changes induced by either GnRH or E2 are readily evident at the transcript and protein level [2, 8, 10–12]. These changes, however, are the more distal responses of genes expressed in a gonadotrope-restricted fashion. Therefore, the fundamental problem has not been defining the distal, gonadotrope-specific responses to E2 and GnRH, but rather the most proximate and intermediate events that culminate in the phenotypic changes characteristic of gonadotropes in advance of the LH surge. Furthermore, the candidate genes and proteins underlying these events are likely not uniquely expressed in gonadotropes. The simple reality is that without a reliable and efficient method for enriching populations of gonadotropes, advances in understanding the molecular regulation of gonadotropin synthesis and secretion in non-rodent species will remain constrained and painfully slow.
In mice, the issue of gonadotrope enrichment or purification has largely been mitigated by the ability to target gonadotrope-specific expression of fluorescent proteins and the relative ease of genetic manipulations, making the mouse a powerful model for elucidating the contribution of discrete genes to gonadotrope function and mammalian reproduction. Similar genetic approaches do not easily or readily lend themselves to sheep and other important models of the hypothalamic-pituitary-gonadal (HPG) axis. The paucity of genetic tools available for sheep is unfortunate, as the ovine model has provided much of the foundational knowledge underlying our current understanding of hypothalamic and ovarian regulation of LH secretion. Additionally, key insights into the areas of divergence between rodent and non-rodent species and differences in the organization and regulation of the HPG axis will continue to rely on the ovine model.
Herein, we describe a new methodological platform that takes advantage of gonadotrope-specific properties inherent to the proximal promoter of the human glycoprotein hormones, alpha polypeptide (CGA) gene, in which adenoviral mediated expression of enhanced green fluorescent protein (GFP) is coupled with sorting via flow cytometry to enrich a population of ovine gonadotropes and show the application of this approach to query the transcriptome of sorted ovine pituitary cells in response to treatment with E2.
Materials and methods
Ethics statement
All procedures involving animals were approved by the Colorado State University Animal Care and Use Committee and in compliance with National Institutes of Health (NIH) and United States Department of Agriculture guidelines.
Materials
Dulbecco Modified Eagle Medium (DMEM) without phenol red was purchased from Corning (Corning, NY). Polyethersulfone (PES) 0.2-μm and polyvinylidene fluoride (PVDF) 0.45-μm filters were acquired from Millipore (Billerica, MA). CellTricks filters were purchased from Sysmex America Inc. (Lincolnshire, IL). Qiagen RNeasy Kits and RNase-Free DNase sets were purchased from Qiagen (Valencia, CA). iScript Reverse Transcription Supermix and IQ SYBR Green Supermix were purchased from Bio-Rad (Hercules, CA). StrataClone PCR Cloning Kit was obtained from Agilent (Santa Clara, CA). Primers were obtained from Integrated DNA Technologies (Coralville, IA). All other chemicals were purchased from MilliporeSigma (St. Louis, MO). Ovariectomized (OVX) ewe serum was obtained from OVX sheep in our care.
Dissociation and culture of ovine pituitaries
Western white-faced ewes (3–6 years old) housed together in pens or on pasture in good body condition were OVX within 3 months of purchase and allowed a minimum of 3 weeks recovery prior to pituitary gland extraction. At collection, OVX sheep were euthanized with an overdose of sodium pentobarbital followed by exsanguination. Pituitary glands were removed and placed in ice-cold dissociation medium containing 137-mM NaCl, 25-mM 4-(2-hydroxyethyl)-1piperazineethanesulfonic acid (HEPES), 10-mM glucose, and 5-mM KCl, pH 7.4. Tissue was dispersed as described by Adams et al. [13], with the omission of trypsin digestion. Briefly, pituitary tissue was sectioned into 0.5-mm-thick slices with a Stadie-Riggs tissue slicer (Thomas Scientific, Swedesboro, NJ), and slices were washed 4–5 times with dissociation medium. Washed slices were transferred to freshly prepared and sterile-filtered (0.2-μm PES filter) enzymatic cocktail containing 20 ml of dissociation medium with 1 mg/ml of collagenase Type II, 1 mg/ml of hyaluronidase Type V, and 0.02 mg/ml deoxyribonuclease I and incubated at 37 °C for 45 min in a Dubnoff metabolic shaker (GCA/Precision Scientific, Winchester, VA). Pituitary slices were then passed through a Pasteur pipette and placed back into dissociation media. These steps were repeated every 15 min for a total of 45 min to obtain a homogeneous cell suspension for plating. The collected cell suspension was washed with dissociation medium and collected by centrifugation (200×g, 4 min) five times and then cultured in 15-cm tissue culture dishes (Sarstedt, Nümbrecht, Germany) with pituitary cell culture medium (DMEM, supplemented with 10% OVX ewe serum, 50-units/ml penicillin, 50-μg/ml streptomycin, 25-μg/ml amphotericin B, 1-mM sodium pyruvate, 2-mM glutamate, 1-mM nonessential amino acids, 25-mM HEPES, and 3.7 g/L of NaHCO3) at 37 °C under an atmosphere of 5% CO2 for at least 24 h before any manipulation.
Ad-hαCGA-eGFP adenoviral vector construction
Primers were designed to amplify the proximal 1500 bp of the promoter of the human CGA gene. The primers were designed to add XhoI and HindIII restriction enzyme sites to the 5′ and 3′ ends of the amplicon, respectively. The template for the polymerase chain reaction (PCR) reaction was 1 ng of the plasmid −1500 human CGA [14, 15]. This amplicon was cloned using the StrataClone PCR Cloning Kit. A XhoI/HindIII fragment was released from the PCR vector and ligated to a HindIII/XbaI fragment from pEGFP-1 (Clontech, Mountain View, CA). The resulting composite complementary DNA fragment was ligated into a XhoI/XbaI cut pShuttle vector (Agilent, Santa Clara, CA). Expression cassettes were verified by sequencing and viral particles for Ad-hαCGA-eGFP were generated following the AdEasy XL Adenoviral Vector System protocol (Agilent; Figure 1). After amplification, viral particles were collected by passing adenovirus-containing cell lysates through 0.45-μm PVDF filters after three freeze–thaw cycles in a methanol-dry ice bath and titered by end-point dilution assay. Based on preliminary studies using multiple titers (data not shown), we established that a multiplicity of infection (MOI) of 250 induced a high rate of infection without significant detachment of ovine pituitary cells from the culture surface. All subsequent studies utilized an MOI of 250.
Figure 1.
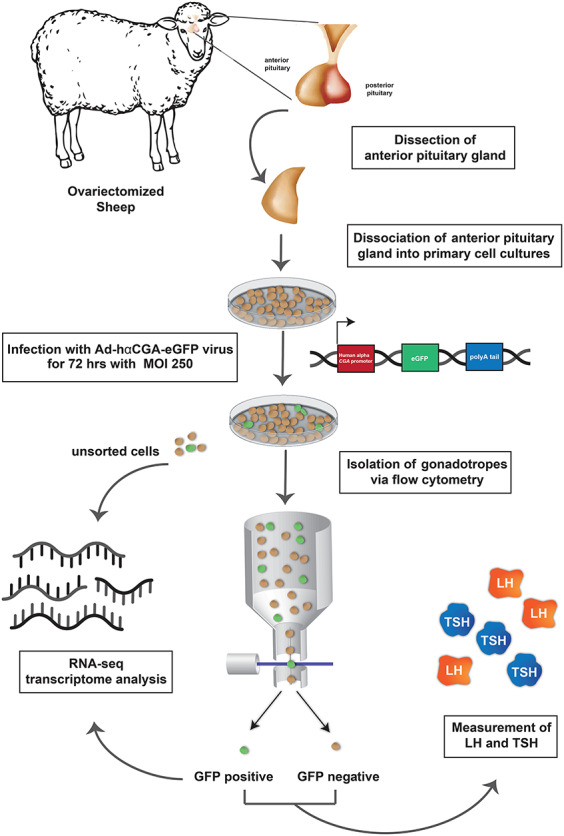
Workflow for enrichment and analysis of sorted GFP+ gonadotropes from primary ovine pituitary cell cultures infected with Ad-hαCGA-eGFP.
Cell sorting with flow cytometry
Following 72 h of infection with Ad-hαCGA-eGFP, cells were treated with either vehicle (ethanol) or 10-nM E2 for a total of 6 h, which included the time required for sorting to be completed. Cells to be sorted were scraped off of the culture dish, placed in culture media, and kept at room temperature until sorting. To disperse and remove cell clusters, each cell suspension sample was passed through a Pasteur pipet and filtered through a 50-μm CellTricks filter directly into a round bottom 12 × 75 mm Falcon collection tube. Approximately 20 × 106 cells were sorted at a time using a MoFlo Legacy flow cytometer with an excitatory 488 nm laser, a 530/40 nm bandpass emissions filter, a photomultiplier tube voltage of 400 V, and a 100 μm diameter flow cell tip. A forward scatter pulse width versus forward scatter area bivariate plot was established and gated to distinguish single cells from doublets/aggregates (Figure 2A). All cell sorts were performed in purify mode: all GFP-positive (GFP+) droplets with no coincident GFP-negative (GFP−) cells are retained. Cells not infected with Ad-hαCGA-eGFP were used to set the threshold for gating of GFP+ and GFP− cells. Within the GFP+ gate, two secondary gates were evaluated (Figure 2B and C): a gate with the brightest GFP+ cells (strict gate) and a gate with all GFP+ cells (wide gate). Nine sheep were used in this work: three were used to validate gates with radioimmunoassay (RIA) for LH and thyrotropin-stimulating hormone (TSH) measurements and six were used to perform ribonucleic acid (RNA)-sequencing. After sorting, the cells were centrifuged at 200×g for 5 min and either snap frozen for the RIA or lysed in RLT buffer for RNA lysis buffer.
Figure 2.
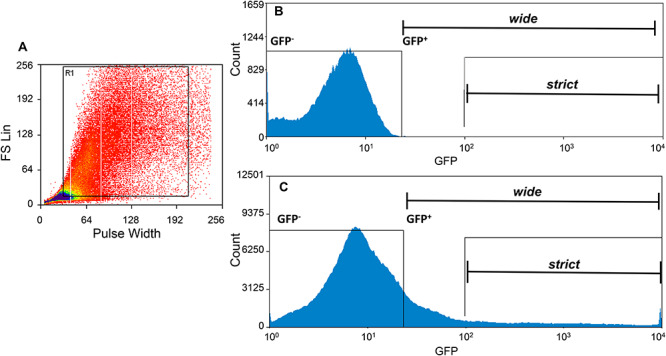
Sorting of GFP-labeled ovine pituitary cells. (A) Gating was performed to remove dead cells, debris, and aggregates before sorting (cells located outside the black box R1). (B) Histogram of uninfected cells used to establish GFP+ and GFP− gate parameters. (C) GFP+ cells isolated using wide and strict gating.
Luteinizing hormone and thyrotropin-stimulating hormone radioimmunoassay
LH [16] and TSH [17] in GFP+ and GFP− sorted cells were quantified by double-antibody RIAs. The reference standard for LH and TSH were NIH-OLH-S24 and NIH-MTSH-CSU-S4, respectively. Triplicate standard curves were included in each assay and samples were analyzed in duplicate at 100-μl sample/tube. Intra- and inter-assay coefficients of variation for LH were 9 and 11%, respectively, and the minimum detectable concentration of LH averaged 64 pg. Intra- and inter-assay coefficients of variation for TSH were 10 and 13%, respectively, and the minimum detectable concentration of TSH averaged 230 pg. Enrichment was defined as the ratio of hormone concentration between GFP+ and GFP− cell populations, adjusted by the number of cells in each population quantified by cell sorting, and expressed as fold change (FC).
Ribonucleic acid isolation and real-time quantitative reverse transcription polymerase chain reaction
Total RNA was isolated using the Qiagen RNeasy Mini Kit, with on-column DNase digestion conducted according to the manufacturer’s instructions. RNA yield was quantified with a BioTek Synergy 2 Microplate reader with Gen5 version 2.0 All-in-One Microplate Reader Software (BioTek Instruments, Inc., Highland Park, Vermont). Complimentary DNA was synthesized using iScript Reverse Transcription Supermix from 100 ng of total RNA in a total volume of 20 μl. The resulting cDNA was diluted 1:5 prior to quantitative reverse transcription polymerase chain reaction (qRT-PCR). Each real-time PCR reaction was carried out in triplicate, consisting of 3 μl of diluted cDNA, 7.5 μl of IQ SYBR Green Supermix, and 350 nM of forward and reverse primers (Supplemental Table S1), in a total reaction volume of 15 μl. Reactions were carried out on a LightCycler 480 System (Roche Diagnostics Corporation, Indianapolis, IN) for 40 cycles (15 s denaturation at 95 °C, 30 s annealing at 60 °C, and 30 s elongation at 72 °C) after an initial 5-min incubation at 95 °C. Sequence integrity of qRT-PCR products was verified by direct sequencing. Melting curves for all products showed a single peak. Validation experiments for each primer set were performed initially to ensure that PCR efficiency was between 87 and 110% and that this method of data analysis was valid across a wide range of input template amounts. The FC in expression of each gene was quantified by the 2-ΔΔCt method [18], using glyceraldehyde-3-phosphate dehydrogenase (GAPDH) as a housekeeping gene and normalizing to GFP+ controls.
Ribonucleic acid-sequencing
Five hundred nanograms of RNA from control sorted GFP+ cells (n = 6), E2-treated sorted GFP+ cells (n = 6), control infected but unsorted cells (n = 6), and E2-treated but infected unsorted cells (n = 6) were submitted to the University of Colorado Next-Generation Sequencing Core at the Anschutz Medical Campus (http://www.ucdenver.edu/academics/colleges/medicalschool/centers/cancercenter/Research/sharedresources/genomics/Pages/genomics.aspx) for quality analysis, polyA enrichment, cDNA library preparation, and RNA sequencing on the Illumina HiSeq platform. Each RNA sample was subjected to Agilent Bioanalysis, which detects RNA degradation or a poor polyA-to-ribosomal RNA ratio. RNA-Seq libraries were constructed using the Illumina TruSeq mRNA standard protocol. Samples were barcode tagged to be multiplexed and allow detection of an individual sequence in the sequence data. The Illumina (HiSeq) was used for sequencing the amplified fragments, and 50- and 150-bp single reads were obtained.
Read alignment and measurement of read-count-per-gene
The first quality control of the raw reads was assessed with fastQC software version 0.10.1 (http://www.bioinformatics.bbsrc.ac.uk/projects/fastqc; accessed August 17, 2017). Clean data were obtained by removing reads containing adapters and low quality reads from raw data with Trimmomatic version 0.36 [19], using supplied TruSeq3-SE adapter sequences FASTA files. Reads were trimmed to 40- or 113-bp from 50- and 150-bp reads, respectively, to remove adapter sequences and sequences of low quality. Each sequencing data set was independently mapped to the ovine reference genome (Ensembl release 89) with Genomic Short-Read Nucleotide Alignment Program (GSNAP) version 2017-06-20 [20], using 30 processors and parameters indicated in Supplemental Table S2. Binary Alignment/MAP files generated with GSNAP and SAMtools version 0.1.19 [21] were used by featureCounts software version 1.5.1 [22] to extract reads-counts-per-gene. Total gene read counts for all 27 054 gene features of each sample were used as inputs for count-based differential analysis of GFP+ and unsorted samples, using the edgeR package of Bioconductor [23]. To filter out genes with low counts, the read-count-per-gene was summed across all genes and across 6 sorted control GFP+, 6 E2-treated sorted GFP+, 6 control infected unsorted, and 6 E2-treated infected unsorted samples. If the sum of read-counts-per-gene was less than 25 for any given gene, that gene was eliminated from further analysis.
K-means clustering and principal component analysis plots
K-means clustering was performed by combining all genes [24] with normalization of expression data to diminish variability between sheep. Normalization was achieved for each sample by dividing by the maximum count of the pairs from a sample, resulting in a gene expression range of −1 to 1. This clustering has been done with k = 2. Results were analyzed by principal component analysis (PCA) and plotted. K-means clustering and PCA plot were generated with the “sklearn” library in Python.
Enrichment analysis of genes in isolated GFP+ cells
Differential gene expression tools calculate an FC, expressed as a logarithm to base-2 (log2) of the expression ratio and a statistical significance of differential expression for each gene [25]. The FC is based on the mean count across 6 replicates in GFP+ (sorted) and unsorted samples. This includes a calculation of sample-specific normalization factors based on the gene-read-count data. Enrichment analysis of two groups (sorted and unsorted) was performed in R, version 3.4.2 (https://www.r-project.org/.) using the edgeR package of Bioconductor [23]. This tool provides statistical routines for determining differential expression in digital gene expression data using a model based on the negative binomial distribution and a shrinkage estimator for the distribution’s variance [26]. Resulting P-values were adjusted to overcome multiple testing problems, using Benjamini and Hochberg approach for controlling the false discovery rate (FDR ≤ 0.05) [27]. Gene expressions with FC ≥ 3 and FDR ≤ 0.05 found with edgeR were assigned as genes that were overrepresented/underrepresented in the gonadotrope population. Hierarchical clustering was performed to generate an overview of the characteristics of the expression profiles based on values of significantly differentially expressed genes. A volcano plot and hierarchical clustering were drawn using ggplot2 packages in R. The sequence data were deposited at Gene Expression Omnibus (GEO) https://www.ncbi.nlm.nih.gov/geo/info/seq.html, a publicly available database, with the accession number GSE121685.
Analysis of differentially expressed genes in isolated GFP+ and unsorted cells treated with E2
Analysis of differentially expressed genes in GFP+ cells (control and E2-treated) and unsorted cells (control and E2-treated) was performed in R, version 3.4.2, using the edgeR package of Bioconductor [23]. Gene expressions with FC ≥ 1.5 and the FDR ≤ 0.1 were assigned as genes that were up-regulated/down-regulated in respective groups. Hierarchical clustering was performed to generate an overview of the characteristics of the expression profiles based on values of significantly differentially expressed genes, using ggplot2 packages in R. The sequence data were deposited at GEO https://www.ncbi.nlm.nih.gov/geo/info/seq.html with the accession number GSE121685.
Statistical analyses
Data unrelated to RNA-seq raw data were analyzed by one-way analysis of variance (ANOVA) with Tukey post hoc comparison of means or by Student t-test for paired samples, using Prism software (GraphPad Software Inc., San Diego, CA). Data for Figures 4 and 8 were log2 transformed to yield equal variance and analyzed by two-way ANOVA with Tukey post hoc comparison of means with Prism. P-values of ≤ 0.05 were considered significant. Values are presented as means ± standard error of the means (SEM).
Figure 4.
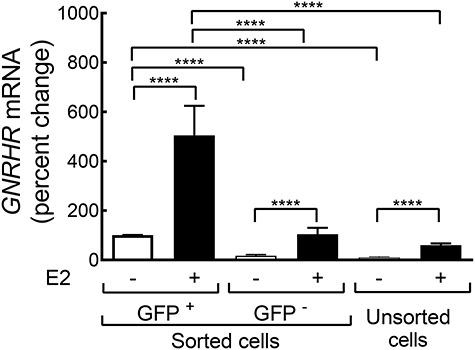
E2 regulation of GNRHR expression in sorted and unsorted ovine pituitary cells. Data expressed as the percent change from GNRHR expression in vehicle-treated GFP+ cells (defined as 100%). Significant differences are indicated (****—P < 0.0001).
Figure 8.
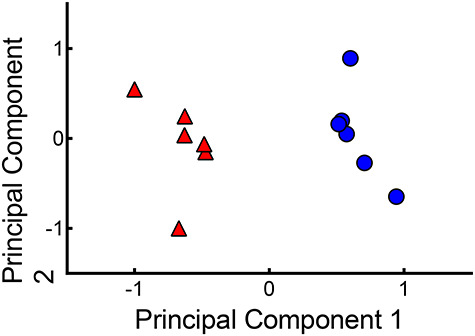
PCA plot of sorted control GFP+ cells (red triangles) versus E2-treated sorted GFP+ cells (blue circles) in six isolated replicates.
Gonadotrope enrichment experimental workflow
The experimental workflow is presented in Figure 1. Primary cultures of ovine pituitary cells from OVX ewes were established through mechanical and enzymatic dispersion of anterior pituitary glands (152 × 106 ± 23 × 106 cells per pituitary, n = 9). Twenty-four hours after plating, cells were infected with Ad-hαCGA-eGFP construct at an MOI of 250 for 72 hrs. After infection, the cell suspension was sorted into GFP+ cells (putative gonadotropes) and GFP− cells (non-gonadotropes) via flow cytometry (Figure 2). Gating was first set via forward and side scatter to eliminate debris and cellular clusters (Figure 2A) and then via two flow cytometer sort gates, wide (Figure 2B) and strict (Figure 2C), to evaluate the extent of the signal-to-noise ratio. Approximately 50% of the cells were lost due to cell detachment from the dish after viral infection, removal of cell aggregates during filtration, and cell rejection during sorting. The extent of gonadotrope enrichment was examined by quantification of LH (as a marker for gonadotropes) and TSH (as a marker for thyrotropes) by RIA and of GnRHR mRNA in GFP+ and GFP− sorted cells. The functional viability of cells to be sorted was evaluated by the expression of GNRHR in cells treated with 10 nM of E2 6 h before sorting. Gene expression profiles from sorted GFP+ cells and Ad-hαCGA-eGFP infected cells not subjected to sorting were analyzed by RNA-Seq.
Results
Enrichment of gonadotrope population determined by hormone content. Effect of sorting gate
Regardless of the sorting gate, the LH content in the GFP+ cells population (0.74 ± 0.10 fg/cell) was higher (n = 9; P < 0.001) than in the GFP− cells population (0.06 ± 0.01 fg/cell; Figure 3A); in contrast, TSH content did not differ (P > 0.2) between GFP+ and GFP− cell populations (0.0022 ± 0.0006 vs. 0.0037 ± 0.0011 fg/cell, respectively; Figure 3A).
Figure 3.
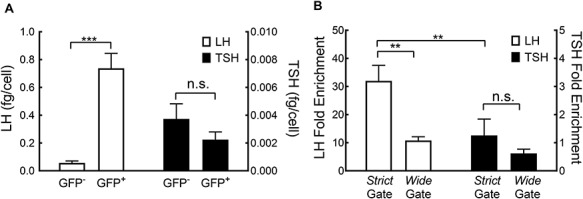
(A) LH and TSH content (means ± SEM) in GFP+ and GFP− sorted cells. (B) LH and TSH enrichment (means ± SEM) in GFP+ cells sorted using wide or strict gating. Significant differences are indicated (**P < 0.05, ***—P < 0.001).
LH content was higher (n = 3; P < 0.02) in cells sorted with the strict gate (32 ± 5.5 FC) than with the wide gate (10.8 ± 1.3 FC; Figure 3B); whereas, TSH FC was similar (n = 3; P > 0.3) between sorting gates (1.26 ± 0.58 vs. 0.62 ± 0.15 FC; average 0.94 ± 0.365; Figure 3B). The ratio between LH (32 ± 5.5 FC) and TSH (0.94 ± 0.365 FC) was 34 times higher using the strict gate than with the less restrictive wide gate (P < 0.01; Figure 3B). Accordingly, we opted to use the more selective strict sorting gate for our subsequent experiments. A downside of the strict gate is the lower (n = 5, P < 0.01) percentage of GFP+ cells (1.0 ± 0.04) isolated from the entire population as compared to less restrictive gating (6.2 ± 1.6).
Validation of an enriched population of gonadotropes
The physiological response of gonadotrope exposure to E2 includes increased GNRHR transcriptional expression [2, 7, 8]. To confirm that enriched GFP+ gonadotropes are viable and retain E2 responsiveness, we treated sorted (GFP+ and GFP−) and unsorted cells with either E2 (10 nM for 6 h) or vehicle (ethanol). Following RNA isolation and reverse transcription, the cDNA was analyzed by qRT-PCR (Figure 4). In vehicle-treated populations, expression of GNRHR was higher in GFP+ cells (100 ± 0.3%) compared to GFP− cells (17 ± 4%; P < 0.0001) or to unsorted cells (11 ± 3%; P < 0.0001). The expression of GNRHR was not different between GFP− and unsorted cells (P = 0.40).
In cells treated with E2, expression of GNRHR was higher in GFP+ cells (510 ± 120%) compared to GFP− cells (105 ± 26%; P < 0.0001) or to unsorted cells (56 ± 7%; P < 0.0001; Figure 4). The change in expression of GNRHR in response to E2 was not different (P = 0.45) between GFP− and unsorted cells. Importantly, E2 treatment of GFP+ cells significantly enhanced (510 ± 120%; P < 0.0001) GNRHR expression in GFP+ cells. In GFP− cells, GNRHR expression was higher (P < 0.0001) in cells treated with E2 (105 ± 26%) than in cells treated with vehicle (17 ± 4%). Note that the relative FC in GNRHR expression in response to E2 was not different between GFP+ (5.1 ± 1.2 FC), GFP− (7.9 ± 2.7 FC), and unsorted (7.2 ± 1.5 FC) cells (P = 0.34). This result suggests that, at least in regard to E2 regulation of the GNRHR gene, we have not selected for a unique sub-population of gonadotropes.
Sequencing and annotation of ovine transcriptome
To evaluate the degree of gonadotrope enrichment at the transcriptome level, RNA from sorted GFP-positive cells and the unsorted cell populations were analyzed by RNA-seq. On average, 124 × 106 raw reads per sample (ranging from 38.2 to 259.3 × 10⁶) and an average of 95.4% genomic alignment was achieved. The Ovis aries reference genome (Oar v3.1) includes 27 054 genes (20 921 protein coding), of which 25 350 genes (19 921 protein coding) showed detectable expression in at least one tissue contained in the sheep gene expression atlas dataset [28]. Of all Ensembl Reference Sequence genes of Ovis aries, 63.1% of the genes (17 082) had count values greater than 1, with 7.2% (1968) genes surpassing expression levels above 1.585 in the absolute log2 scale. To initially identify patterns of gene expression, we performed a k-means clustering analysis and used a PCA plot to project our data in two dimensions (Figure 5). We found that sorted GFP+ sample replicates clustered tightly together (blue circles), as did all unsorted sample replicates (red triangles). Indeed, all sample replicates of each cluster belonged to the same group, indicating that the differentiation of the treatment groups resulted from dissimilarities in gene expression. These results indicate that our RNA-Seq data successfully identified a population of genes uniquely expressed in GFP+ gonadotropes compared to the entire population of anterior pituitary cells.
Figure 5.
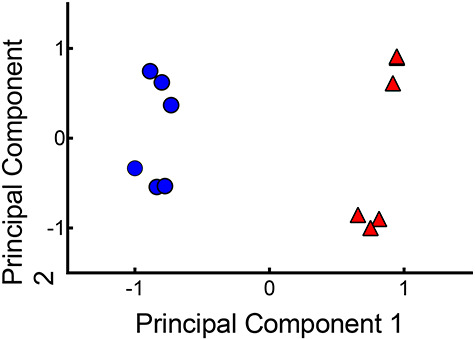
PCA plot of sorted GFP+ (red triangles) and infected unsorted (blue circles) cells in six isolated replicates.
Identification of over/underrepresented genes in GFP+ cells
The RNA-seq data were analyzed with the edgeR package of R to obtain the number of ovine gonadotrope genes that are either overrepresented or underrepresented in GFP+ cells (putative gonadotropes) versus unsorted cells. The edgeR software implements a trimmed means of values (TMM) normalization. TMM normalization estimated sequencing depth after excluding genes for which the ratio of counts between a pair of experiments is too extreme or for which the average expression is too extreme [29]. Genes (n = 7475) with FDR less than 0.05 were used for further analysis. An FC in gene expression between GFP+ samples and unsorted samples more or equal to 3-fold was utilized, with 372 genes identified as overrepresented in the gonadotrope population (Figure 6A, upper left red; Figure 6B, red points; see Supplemental Table S3) and 1596 genes identified as underrepresented in the gonadotrope population (Figure 6A, lower left green; Figure 6B, green points). Among the overrepresented genes, 26 (19 of them protein coding) displayed a fold difference of ≥10 (Supplemental Table S3). Genes that exhibited a fold difference of ≥5 included 139 genes (122 of them protein coding), and this category contained several gonadotrope-specific genes, including GNRHR, CGA, and subfamily 5 group A member 1 (steroidogenic factor 1; NR5A1).
Figure 6.
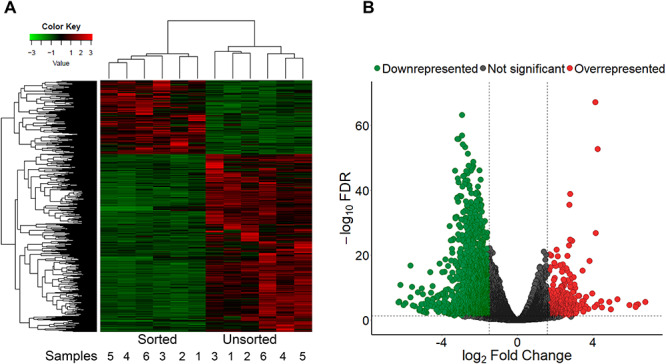
(A) Heatmap of 372 overrepresented and 1596 underrepresented genes (FDR ≤ 0.05) in sorted (GFP+) and unsorted ovine pituitary cells. Each row represents a single gene; each column represents a single isolated replicate. The horizontal axis shows clustering within the two groups (sorted and unsorted). Color key represents the FCs. (B) Volcano plot of 17 082 genes. log2 FCs are on the X-axis and log10-transformed adjusted FDR values are on the Y-axis. Red points represent overrepresented genes (FDR ≤ 0.05 and absolute FC ≥ 3; right dashed vertical line) in the sorted (GFP+) population compared to the unsorted cells; the green points represent underrepresented genes (FDR ≤ 0.05 and absolute FC ≥ 3; left dashed vertical line). Gray points represent genes excluded from the analysis (FDR > 0.05 and absolute FC ≤ 3; horizontal dashed line).
Gonadotrope-specific genes whose FC difference ≥3 included FSHB and LHB. Genes with statistically significant values were clustered with hierarchical clustering analysis, and differences between gene expression in the GFP+ and unsorted populations were clearly distinguishable (Figure 6A).
To further analyze the 372 genes (306 of them annotated) enriched in GFP+ sorted samples, we performed a Gene Ontology (GO) enrichment analysis to characterize their molecular functions and involvement with various biological processes. To do so, we used Protein Analysis Through Evolutionary Relationships, v14.0 (PANTHER) software [30] incorporating the Bos taurus database. GO analysis demonstrated that the genes enriched in GFP+ cells were involved with biological process including regulation of membrane potential (GO:0042391, 15 genes), cell-substrate adhesion (GO:0031589, 5 genes), synaptic signaling (GO:0099536, 15 genes), cell–cell signaling (GO:0007267, 16 genes), signal transduction (GO:0007165, 46 genes), biological regulation (GO:0065007, 79 genes), multicellular organismal process (GO:0032501, 19 genes), and regulation of lyase activity (GO:0051339, 7 genes). Overall, most of the enriched genes were related to ion channel function, receptor binding, and transporter activity. In addition, the PANTHER pathway analysis identified 3 pathways with FDR less than 0.05 (Fisher exact with FDR multiple test correction), which included (appropriately) the GnRHR pathway (P06664, 11 genes, FDR = 0.033), the nicotinic acetylcholine receptor signaling pathway (P00044, 6 genes, FDR = 0.04), and the endothelin receptor signaling pathway (P00019, 5 genes, FDR = 0.036). Genes that are involved in the GnRHR pathway are presented in Table 1.
Table 1.
Genes in the GnRHR signaling pathway
| Gene ID | Gene symbol | Name | FDR | Fold enrichment |
|---|---|---|---|---|
| ENSOARG00000009983 | FOSB | FosB proto-oncogene, AP1 transcription factor subunit | 1.64945E−27 | 17.6 |
| ENSOARG00000015425 | FSHB | Follicle-stimulating hormone subunit beta | 1.7145E−07 | 3.6 |
| ENSOARG00000016470 | EGR1 | Early growth response 1 | 1.50776E−53 | 19 |
| ENSOARG00000007526 | GNRHR | Gonadotropin-releasing hormone receptor | 6.91779E−14 | 7.8 |
| ENSOAR00000013153 | CGA | Glycoprotein hormones, alpha polypeptide | 9.45512E−24 | 6.6 |
| ENSOAR00000001783 | FOS | FOS proto-oncogene, AP1 transcription factor subunit | 5.63804E−68 | 17.4 |
| ENSOARG00000012583 | LHB | Luteinizing hormone beta polypeptide | 8.54743E−06 | 4.1 |
| ENSOARG00000014690 | ID2 | Inhibitor of DNA binding 2 | 5.90874E−21 | 3.3 |
| ENSOARG00000000632 | HTR3A | 5-Hydroxytryptamine receptor 3A | 0.005220297 | 4.1 |
| ENSOARG00000013422 | NR5A1 | Nuclear receptor subfamily 5 group A member 1 | 2.60733E−11 | 5.6 |
| ENSOAR00000004210 | NOS1 | Nitric oxide synthase 1 | 7.26378E−18 | 5.3 |
Validation of ribonucleic acid-seq with quantitative reverse transcription polymerase chain reaction
To validate our RNA-seq findings, we used qRT-PCR to measure the levels of several transcripts in the same RNA samples. We selected a total of 11 transcripts for qRT-PCR analysis, which included a set of genes uniquely expressed in gonadotropes (GNRHR, LHB, CGA, EGR1, NR5A1, and FSHB) and a set of genes uniquely expressed in the other anterior pituitary endocrine cells: proopiomelanocortin (POMC; corticotropes), growth hormone (GH; somatotropes), prolactin (PRL; lactotropes), thyroid stimulating hormone beta subunit (TSHB; thyrotropes), and thyrotropin-releasing hormone receptor (TRHR; thyrotropes). Wholly consistent with an enrichment of gonadotropes in GFP+ sorted cells, we found that the transcript levels corresponding to GNRHR, CGA, LHB, FSHB, NR5A1, and EGR1 were all greater in GFP+ cells than in unsorted cells (12.7 ± 2.4, 15.8 ± 1.4, 11.7 ± 3.6, 8.1 ± 2.7, 7.3 ± 1.0, and 22.4 ± 4.6 FCs, respectively; Figure 7A, open bars). In sharp contrast, expression levels of all the non-gonadotrope-specific transcripts, while statistically enriched, were much lower than that of the gonadotrope-specific genes (Figure 7A, closed bars). Although less pronounced, our RNA-seq data correspond well with our qRT-PCR measurements (Figure 7A and B). Altogether, these transcriptomic analyses support the conclusion that sorted GFP+ cells contain an enriched population of ovine gonadotropes.
Figure 7.
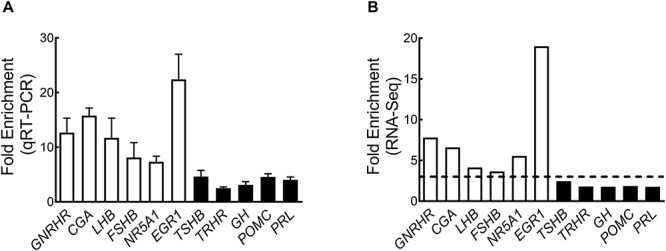
(A) Fold enrichment of selected genes in GFP+ cells compared to the unsorted population as determined by qRT-PCR. Results are expressed as means ± SEM. (B) Fold enrichments obtained from RNA-seq data. White bars represent genes that are key gonadotrope markers; black bars represent genes that are markers for non-gonadotrope endocrine cells of the anterior pituitary gland. The dotted line represents the FC cutoff (FC ≥ 3) used in RNA-Seq for the overrepresented genes.
Estrogen-regulated gene expression in sorted GFP+ and unsorted cells treated with E2
To detect the E2-regulated genes in gonadotropes, RNA-seq was performed using dissociated pituitary gland cells from two different experimental groups: group 1—sorted GFP+ cells (control and E2-treated) and group 2—unsorted pituitary cells (control and E2-treated). In group 1, 61.2% of the genes (16 570) and in group 2, 63.7% of the genes (17 245) had count values greater than 1, with 262 genes in group 1 and 110 genes in group 2 meeting standards (FDR ≤ 0.1 and FC ≥ 1.5) for use in further analysis. K-means clustering analysis of genes detected in sorted GFP+ cells revealed that control (vehicle) replicates (red triangles, Figure 8) were distinct from E2-treated replicates (blue circles, Figure 8). Hierarchical clustering analysis of statistically significant genes (Figure 9A and B, upper panels) revealed robust differences in gene expression between vehicle and E2-treated sorted GFP+ cells (Figure 9A) and between vehicle and E2-treated unsorted cells (Figure 9B).
Figure 9.
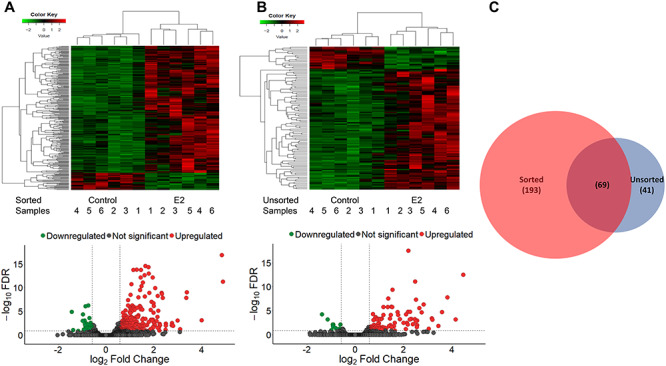
(A) Upper panel: Heatmap of 232 up-regulated and 31 down-regulated genes (FDR ≤ 0.1) in sorted GFP+ cells either untreated or treated with E2. Each row represents a single gene; each column represents a single isolated replicate. The horizontal axis shows clustering within the two groups (vehicle and E2 treated). Color key represents the FCs. Lower panel: log2 FCs are on the X-axis and log10-transformed adjusted FDR values are on the Y-axis. Red points represent up-regulated differentially expressed genes (FDR ≤ 0.1 and absolute FC ≥ 1.5; right dashed vertical line) in untreated cells compared with E2-treated samples. The green points represent down-regulated differentially expressed genes (FDR ≤ 0.1 and absolute FC ≥ 1.5; left dashed vertical line). Gray points represent genes excluded from the analysis (FDR > 0.1 and absolute FC ≤ 1.5; horizontal dashed line). (B) Upper panel: Heatmap of 93 up-regulated and 17 down-regulated genes (FDR ≤ 0.1) in unsorted cells either untreated or treated with E2. Each row represents a single gene; each column represents a single isolated sample. The horizontal axis shows clustering within the two groups (vehicle and E2 treated). Color key represents the FCs. Lower panel: log2 FCs are on the X-axis and log10-transformed adjusted FDR values are on the Y-axis. Red points represent up-regulated differentially expressed genes (FDR ≤ 0.1 and absolute FC ≥ 1.5; right dashed vertical line) in infected unsorted compared with E2-treated infected unsorted samples. Green points represent down-regulated differentially expressed genes (FDR ≤ 0.1 and absolute FC ≥ 1.5; left dashed vertical line). Gray points represent genes excluded from the analysis (FDR > 0.1 and absolute FC ≤ 1.5; horizontal dashed line). (C) Venn diagram showing the number of genes differentially regulated by E2 that are unique to either the sorted or unsorted populations or common to both populations.
In group 1, 232 genes were detected as up-regulated (Figure 9A; heatmap, upper portion; volcano plot, red points; Supplemental Table S4) and 31 were down-regulated following E2 treatment (Figure 9A; heatmap, lower portion; volcano plot, green points; see Supplemental Table S4). In group 2, 93 genes were up-regulated (Figure 9B; heatmap, upper portion; volcano plot, red points; see Supplemental Table S5) and 17 were down-regulated with E2 treatment (Figure 9B; heatmap, lower portion; volcano plot, green points; see Supplemental Table S5). In comparing group 1 and group 2, 193 genes (FDR ≤ 0.1 and FC ≥ 1.5) were found differentially expressed only in group 1 (Supplemental Table S4), 41 genes were found differentially expressed only in group 2, and 69 genes were identified in both group 1 and group 2 (Figure 9C).
We performed a GO analysis (as above) on the 262 genes identified as enriched in sorted GFP+ cells. This analysis revealed high representation of genes related to the regulation of locomotion (GO:0040012, 5 genes), tissue development (GO:0009888, 6 genes), cell motility (GO:0048870, 10 genes), movement of cell or subcellular components (GO:0006928, 12 genes), signal transduction (GO:0007165, 40 genes), and biological regulation (GO:0065007, 76 genes). Pathway analysis (PANTHER) of these genes identified 11 significant biological pathways (FDR < 0.05; Fisher exact with FDR multiple test correction), including the GnRHR pathway (P06664, 9 genes, FDR = 0.01252), heterotrimeric G-protein signaling pathway-Gq alpha and Go alpha-mediated pathway (P00027, 7 genes, FDR = 0.000695), heterotrimeric G-protein signaling pathway-Gi alpha and Gs alpha-mediated pathway (P00026, 10 genes, FDR = 4.80E − 05), PDGF signaling pathway (P00047, 8 genes, FDR = 0.00142), B-cell activation (P00010, 4 genes FDR = 0.0114), T-cell activation (P00053, 4 genes, FDR = 0.0376), cholecystokinin receptor (CCKR) signaling map (P06959, 8 genes, FDR = 0.00121), oxidative stress response (P00046, 4 genes, FDR = 0.00059), p38 MAPK kinase pathway (P05918, 3 genes, FDR = 0.0087), and inflammation mediated by chemokine and cytokine signaling pathway (P00031, 7 genes, FDR = 0.0321).
E2 effect in sorted GFP+ and infected unsorted cells determined with quantitative reverse transcription polymerase chain reaction
To validate our RNA-seq results with qRT-PCR, we selected three representative genes based on their differential expression responses to E2 among our experimental groups. We included the progesterone receptor (PGR), which increased in response to E2 in sorted GFP+ and unsorted cells; vascular endothelial growth factor A (VEGFA), which increased in response to E2 only in sorted GFP+ cells; and LHB, which showed no response to E2 in either GFP+ or unsorted cells. Gene where gene expression remained unchanged in either group in response to E2. Quantitative PCR revealed higher expression of PGR and VEGFA in sorted GFP+ cells treated with E2 (5.58 ± 1.65 and 3.99 ± 0.64 FC respectively) than control sorted GFP+ cells (P < 0.002 and P < 0.0001, respectively; Figure 10A and B), LHB expression was unchanged with E2 treatment in sorted GFP+ cells (P = 0.99; Figure 10C). Expression of VEGFA and LHB of control unsorted samples was not different in comparison to unsorted cells treated with E2 (P = 0.45, P = 0.074; Figure 10B and C). Expression of PGR was higher (P < 0.001) in unsorted cells treated with E2 (0.71 ± 0.25 FC; Figure 10A) than control unsorted cells (0.10 ± 0.02 FC). These results of quantitative PCR validate the results for these genes obtained in RNA-seq (Supplemental Tables S4 and S5).
Figure 10.
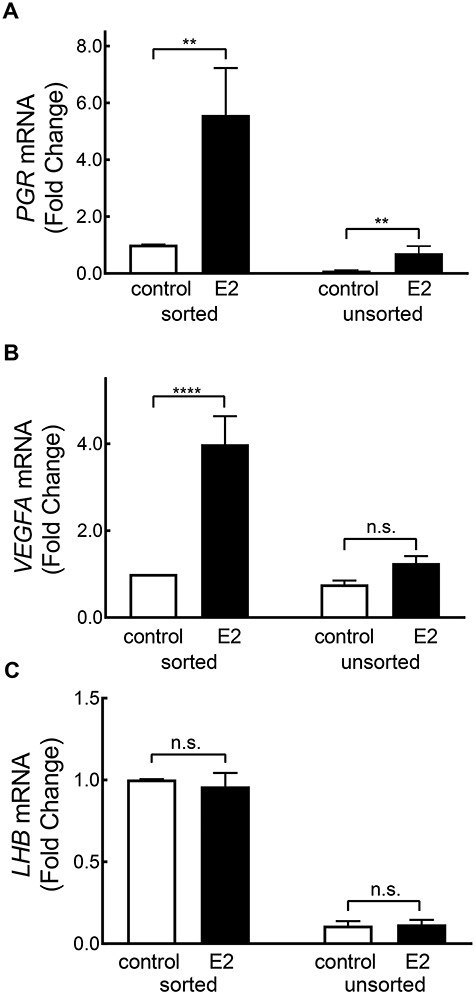
qRT-PCR analysis of PGR, VEGFA, and LHB expression in sorted GFP+ and unsorted cells with and without E2 treatment. Data are expressed as an FC compared with GFP+ ovine cells, which was arbitrarily set as 1. Means ± SEM. Significant differences are indicated (**P < 0.05, ****P < 0.0001).
Discussion
Integration of hypothalamic and gonadal inputs by gonadotropes is essential for reproduction. The most notable example is the ability of ovarian E2 during the late follicular phase to enhance GnRH receptor expression in gonadotropes, leading to heightened pituitary sensitivity to the subsequent increase in hypothalamic GnRH pulse frequency. Thus, the pituitary is not a passive player that simply awaits GnRH but rather is an active participant in preparing for GnRH input. In fact, the role of E2 activation of gonadotropes preceding the LH surge is critical in non-rodent species such as sheep and primates [2, 4, 5]. Furthermore, there is an increasing body of data to suggest that diminished LH production characteristic of non-polycystic ovary syndrome-associated obesity, elevated Body mass index (BMI) in general, and hyperlipidemia manifests at the level of the pituitary rather than the hypothalamus [31, 32]. These data underscore the need for further exploration of the molecular events underlying gonadotrope function and the molecular responses of non-rodent gonadotropes to hypothalamic, gonadal, and metabolic inputs in normal conditions and conditions associated with emerging global comorbidities such as under- and overnutrition.
The relative ease of genetic manipulation and short generation intervals has made the mouse a powerful model in studying the many components of gonadotrope biology. Nevertheless, the sheep has also long served as a highly relevant and informative model in reproductive endocrinology and neuroendocrinology. Furthermore, the critical role of E2 input to the pituitary in eliciting the LH surge is clearly evident in both sheep and primates, and arguably the sheep model has provided foundational knowledge for our current understanding of the physiological integration of GnRH and E2 signaling at the pituitary. Thus, our view is that a more appropriate and complete platform for understanding hypothalamic and gonadal regulation of gonadotrope function can be derived using non-rodent models such as sheep. Unfortunately, our ability to make significant inroads using this model will remain hampered until reliable methods exist for enriching the relatively minor gonadotrope population from the overall population of endocrine and non-endocrine cells in the sheep pituitary.
Enrichment of gonadotrope populations has been achieved in rodent models using several approaches. Before the advent of genetically engineered mice, rat gonadotropes were isolated with a fluorescent GnRH antagonist [33] or purified using LH-antibody conjugated to highly fluorescent microspheres [34]. In the post-genomic era, mouse gonadotropes have been engineered to express specific cell surface antigens that have allowed for immunological enrichment [35]. More recently, the application of Cre-Lox technology to target gonadotrope-specific expression of intrinsically fluorescent proteins coupled with flow cytometry has allowed for RNA-seq of mouse gonadotropes [36]. In contrast, an efficient and reliable approach for enriching non-rodent gonadotropes (e.g., from sheep) remains elusive.
Each of the five endocrine cell types of the anterior pituitary expresses and is defined by a unique hormone or, in the case of gonadotropes, two hormones—LH and FSH. Additionally, except for lactotropes, each endocrine cell type harbors unique G protein-coupled receptors for the corresponding hypothalamic “releasing hormone.” The unique transcriptional signature of each endocrine cell type potentially serves as a target to be exploited for cell-specific identification and purification. For gonadotropes, this signature includes GNRHR, LHB, FSHB, and CGA expression. As such, promoter regions of each of these genes are potential candidates to target gonadotrope specific expression. In our approach, we have chosen the CGA gene promoter for two primary reasons. First, since gonadotrope cells can express either LHB, FSHB, or both [37], the promoters of these genes may select for unique sub-populations of gonadotropes. Similarly, GNRHR expression has been found in sub-populations of GH producing cells, indicating possible plasticity between somatotrope and gonadotrope phenotypes [38]. For these reasons, we chose the well-characterized 1500 bp proximal promoter of the human CGA gene, which we reasoned would facilitate specific labeling of all gonadotrope populations.
We recognize that CGA is also expressed in thyrotropes; however, the gonadotrope-specific properties of the 1500 bp human CGA promoter have been extensively described and, importantly, the genetic information that directs thyrotrope expression of CGA is not present in the 1500 bp human CGA promoter [14, 15, 39]. Consistent with this notion, we find that total TSH content between GFP+ and GFP− cells sorted via flow cytometry was not statistically different (0.62-fold difference). Conversely, the LH content of the sorted GFP+ cell population was 13-fold greater than in GFP− cells. Further, using a stricter gating strategy for flow cytometry experiments led to selection of a GFP+ population with 32-fold greater LH content, while TSH content was again essentially unchanged (1.3-fold). Thus, the human CGA promoter fragment effectively separates thyrotrope and gonadotrope populations—the only two populations of endocrine cells in the pituitary gland that express the endogenous CGA gene.
Certainly, one key question in our approach is cell viability and the retention of physiological regulation following the arduous processes of infection, culture, and flow cytometry. Importantly, and consistent with an essential component of gonadotrope functionality, we found that sorted GFP+ cells retained E2-responsive stimulation of GNRHR expression. Although expression levels of E2 induction of GNRHR were lower, it is interesting that E2 regulation of GNRHR expression was still evident in the GFP− population. This is not an unexpected result and may be the product of a false negatives in the sorted GFP− population, a suboptimal level of infection, less than 100% penetrance of the Ad-hαCGA-eGFP into gonadotropes, and/or GNRHR expression in non-gonadotrope cells as previously documented [37, 38]. If the explanation is more technical than biological, then a less selective sorting gate may recover “mis-sorted” cells; however, it will correspondingly decrease the signal-to-noise ratio. Based on the selective enrichment for LH as compared to TSH and the retention of E2 responsiveness, we felt that our approach could give a unique opportunity to utilize RNA-seq to interrogate, for the first time, the unique gene expression profile of an enriched population of ovine gonadotropes. As a general indication of successful enrichment, our k-means clustering analysis of gene expression identified two distinct transcriptional signatures between GFP+ and unsorted cells. Equally important is that differential expression analytics, following edgeR [23] normalization, revealed the expected enrichment of the four defining markers of a gonadotrope phenotype—LHB, FSHB, GNRHR, and CGA. Of these four genes, FSHB showed the smallest enrichment in GFP+ sorted cells (3.6-fold). Accordingly, we used a 3-fold difference as the cutoff value for identifying over- and underrepresented genes in GFP+ cells. Note that expression of the other unique endocrine cell markers, including TSHB, TRHR, GH, POMC, and PRL, fell below this criterion. Using qRT-PCR to validate our RNA-seq data, we found robust enrichment of gonadotrope-specific genes and, to a lesser extent, nominal enrichment of non-gonadotrope endocrine cell markers. The latter likely reflects greater sensitivity of qRT-PCR compared to RNA-seq. However, we would note that markers of non-endocrine cells such as fibronectin 1 (FN1: −7.1-fold), vimentin (VIM: −4.2-fold), annexin A1 (ANXA1: −3.7-fold), and platelet and endothelial cell adhesion molecule 1 (PECAM1: −4.2-fold) were significantly underrepresented in sorted GFP+ cells compared to unsorted cells (see Supplemental Table S3).
Our RNA-seq analysis identified 372 overrepresented genes and 1596 underrepresented genes in sorted GFP+ cells (gonadotropes) compared to the unsorted population. Of particular importance is that subsequent GO pathway analysis revealed GnRHR signaling as the most prominent pathway enriched in sorted GFP+ cells. This observation reflects the expected enrichment for GNRHR and the gonadotropin subunit genes as well as key intermediaries of GnRH signaling to target genes such as EGR1 and NR5A1 (SF1). The marked enrichment of EGR1 could reflect the higher GnRH pulse frequency one would expect in an OVX model [40].
The importance of E2-dependent enhanced sensitivity of gonadotropes to GnRH during the peri-ovulatory period is well established in sheep and non-human primate models [2, 4–6, 8]. Less clear, however, are the underlying molecular mechanisms. Using our enrichment approach as a new experimental platform, we investigated E2-dependent changes in the sheep gonadotrope transcriptome to provide new insights into the transcriptional events occurring in advance of the LH surge. For several reasons, we queried the transcriptome following a 6-h E2 treatment. First, we had already established that a 6-h E2 treatment led to the expected increase in GNRHR expression following infection and sorting. This was important to us as the GNRHR gene served as our primary “sentinel” for E2 responsiveness of the gonadotrope population. Second, from prior work, we knew that this was a point at which E2 responsiveness of the GNRHR gene is clearly evident but is well before peak expression levels at approximately 12 h [7, 8]. It is important to underscore that the goal of this initial study was not to characterize the E2-regulated transcriptome across time but to test the underlying hypothesis that we would be able to identify E2-regulated genes in an enriched population of gonadotropes that would otherwise remain undetected in the entire population of anterior pituitary cells simply due to dilution of the “signal” by the noise resulting from the much larger population of non-gonadotrope cells. Consistent with this hypothesis, we identified nearly 200 E2-responsive genes in the GFP+ sorted cells that were not detected in the unsorted cells. We note an important implication of this observation: analysis of gonadotrope function (E2 responsiveness in this case), with powerful investigative techniques such as RNA-seq, in the absence of enrichment, would be incomplete and in all likelihood lead to missed experimental opportunities and potentially inappropriate conclusions.
The cohort of E2-responsive genes in sorted GFP+ gonadotropes corroborates several independent reports related to gonadotrope function. We have shown that E2 enhances the architectural plasticity of gonadotropes [41, 42]. As such, it is interesting to note the large number of genes up-regulated by E2 is involved in cytoskeletal reorganization including angoimotin (AMOT), aquaporin1 (AQP1), BCAR1 scaffold protein (BCAR1), EF-hand domain family member D2, FERM, ARH/RhoGEF and plekstrin domain protein 2, formin like 1 (FMNL1), huntihgtin interacting protein 1 (HIP1), integrin subunit beta 5 (ITGB5), lipin1 (LPIN1), leucine rich adaptor protein 1 (LURAP1), myocyte enhancer factor 2C (MEF2C), NPHS2 stomatin family member, podocin (NPHS2), phosphatidylinositol-3,4,5-trisphosphate dependent Rac exchange factor 1 (PREX1), ring finger protein 165 (RNF165), and villin like (VILL). Indeed, four of these genes, AQP1, NPHS2, RNF165, and VILL, were among the top 20 up-regulated genes. We identified crystalline beta B2 (CRYBB2), previously known to be expressed in the mammalian eye lens and retina, brain, and testis, as a novel E2-responsive gene in sorted GFP+ gonadotropes. Male and female Crybb2-deficient mice have reduced fertility compared with wild-type mice [43]. Supplemental Tables S4 and S5 contain the complete list of genes differentially expressed in control and E2-treated GFP+ sorted and unsorted cells, respectively. Regarding pathway analysis, it was not surprising that GnRHR signaling was one of the prominent pathways identified in the E2-regulated transcriptome; however, we were intrigued that pathway analysis also identified the CCKR pathway. In addition to its well-established role in regulating gastrointestinal activity, CCK is widely expressed in the brain and has previously been shown to have stimulatory effects on LH release in the male rhesus monkey [44]. Furthermore, E2 has been shown to induce CCK receptor expression in the mouse and goat pituitary [45, 46].
In this manuscript, we have described an approach based on adenovirus-mediated gene transfer to enrich for a population of ovine gonadotropes with the ultimate goal of furthering our ability to investigate gonadotrope biology. We fully recognize the potential caveats associated with this approach, which include the inherent genetic variability of an outbred population and that extended culture prior to sorting via flow cytometry may well yield a population of cells that are phenotypically different from freshly isolated cells. Certainly, a long-term goal of our group is to devise a method of in vivo targeting of fluorophores specific to gonadotropes, which could be exploited subsequently upon isolation. Also, while not a methodological issue per se, the annotation of the sheep genome is not complete, and changes in expression of key genes may, as a consequence, be overlooked in an RNA-seq analysis in this species. Nonetheless, this approach provides for the first time an effective method for the enrichment of a gonadotrope cell population from a non-rodent species that allowed us to interrogate the transcription of sorted GFP+ gonadotropes in response to E2 treatment. Future studies directed at characterizing the temporal profile of the E2-regulated transcriptome in gonadotropes will allow for characterization of primary gene responses (e.g., immediate early genes) that contribute to subsequent changes in gene expression (e.g., GNRHR). Of interest then is how E2-regulated gene programs respond to important modifiers of HPG function, such as season, lactation, and metabolic changes associated with over- or undernutrition. Finally, while we have focused on gene expression, future studies could well be expanded to characterize epigenetic changes as well as patterns of protein expression and post-translational events.
Supplementary Material
Acknowledgements
The authors acknowledge Leslie Lea-Armstrong and the Colorado State University Flow Cytometry and Cell Sorting Facility. Additionally, the authors would like to thank Dr. Gregory Amberg for critical review of the manuscript.
Conference Presentation: Presented in part at the 48th Annual Meeting of the Society for the Study of Reproduction, 18–22 June 2015, San Juan, Puerto Rico.
Conflict of interest
The authors have declared that no conflict of interest exists.
References
- [1]. Berga S, Naftolin F. Neuroendocrine control of ovulation. Gynecol Endocrinol 2012; 28 (Suppl 1):9–13. [DOI] [PubMed] [Google Scholar]
- [2]. Turzillo AM, Nett TM. Regulation of GnRH receptor gene expression in sheep and cattle. J Reprod Fertil Suppl 1999; 54:75–86. [PubMed] [Google Scholar]
- [3]. Duval DL. Responsiveness of the ovine gonadotropin-releasing hormone receptor gene to estradiol and gonadotropin-releasing hormone is not detectable in vitro but is revealed in transgenic mice. Endocrinology 2000; 141:1001–1010. [DOI] [PubMed] [Google Scholar]
- [4]. Ordög T, Goldsmith JR, Chen MD, Connaughton MA, Hotchkiss J, Knobil E. On the mechanism of the positive feedback action of estradiol on luteinizing hormone secretion in the rhesus monkey. J Clin Endocrinol Metab 1998; 83:4047–4053. [DOI] [PubMed] [Google Scholar]
- [5]. Wildt L, Hausler A, Hutchsion JS, Marshall G, Knobil E. Estradiol as a gonadotropin releasing hormone in the rhesus monkey. Endocrinology 1981; 108:2011–2013. [DOI] [PubMed] [Google Scholar]
- [6]. Yasin M, Dalkin AC, Haisenleder DJ, Kerrigan JR, Marshall JC. Gonadotropin-releasing hormone (GnRH) pulse pattern regulates GnRH receptor gene expression: augmentation by estradiol. Endocrinology 1995; 136:1559–1564. [DOI] [PubMed] [Google Scholar]
- [7]. Hamernik DL, Clay CM, Turzillo A, Van Kirk EA, Moss GE. Estradiol increases amounts of messenger ribonucleic acid for gonadotropin-releasing hormone receptors in sheep. Biol Reprod 1995; 53:179–185. [DOI] [PubMed] [Google Scholar]
- [8]. Turzillo AM, Campion CE, Clay CM, Nett TM. Regulation of gonadotropin-releasing hormone (GnRH) receptor messenger ribonucleic acid and GnRH receptors during the early preovulatory period in the ewe. Endocrinology 1994; 135:1353–1358. [DOI] [PubMed] [Google Scholar]
- [9]. Davis TL, Whitesell JD, Cantlon JD, Clay CM, Nett TM. Does a nonclassical signaling mechanism underlie an increase of estradiol-mediated gonadotropin-releasing hormone receptor binding in ovine pituitary cells? Biol Reprod 2011; 85:770–778. [DOI] [PMC free article] [PubMed] [Google Scholar]
- [10]. Turzillo AM, Nolan TE, Nett TM. Regulation of gonadotropin-releasing hormone (GnRH) receptor gene expression in sheep: interaction of GnRH and estradiol. Endocrinology 1998; 139:4890–4894. [DOI] [PubMed] [Google Scholar]
- [11]. Moenter SM, Caraty A, Karsch FJ. The estradiol-induced surge of gonadotropin-releasing hormone in the ewe. Endocrinology 1990; 127:1375–1384. [DOI] [PubMed] [Google Scholar]
- [12]. Wu JC, Sealfon SC, Miller WL. Gonadal hormones and gonadotropin-releasing hormone (GnRH) alter messenger ribonucleic acid levels for GnRH receptors in sheep. Endocrinology 1994; 134:1846–1850. [DOI] [PubMed] [Google Scholar]
- [13]. Adams TE, Wagner TO, Sawyer HR, Nett TM. GnRH interaction with anterior pituitary. II. Cyclic AMP as an intracellular mediator in the GnRH activated gonadotroph. Biol Reprod 1979; 21:735–747. [DOI] [PubMed] [Google Scholar]
- [14]. Bokar JA, Keri RA, Farmerie TA, Fenstermaker RA, Andersen B, Hamernik DL, Yun J, Wagner T, Nilson JH. Expression of the glycoprotein hormone alpha-subunit gene in the placenta requires a functional cyclic AMP response element, whereas a different cis-acting element mediates pituitary-specific expression. Mol Cell Biol 1989; 9:5113–5122. [DOI] [PMC free article] [PubMed] [Google Scholar]
- [15]. Hamernik DL, Keri RA, Clay CM, Clay JN, Sherman GB, Sawyer HR, Nett TM, Nilson JH. Gonadotrope- and thyrotrope-specific expression of the human and bovine glycoprotein hormone alpha-subunit genes is regulated by distinct cis-acting elements. Mol Endocrinol 1992; 6:1745–1755. [DOI] [PubMed] [Google Scholar]
- [16]. Niswender GD, Reichert LE, Midgley AR, Nalbandov AV. Radioimmunoassay for bovine and ovine luteinizing hormone1. Endocrinology 1969; 84:1166–1173. [DOI] [PubMed] [Google Scholar]
- [17]. Thompson FN, Caudle AB, Kemppainen RJ, Nett TM, Brown J, Williams DJ. Thyroidal and prolactin secretion in agalactic mares. Theriogenology 1986; 25:575–580. [DOI] [PubMed] [Google Scholar]
- [18]. Livak KJ, Schmittgen TD. Analysis of relative gene expression data using real-time quantitative PCR and the 2 (−Delta Delta C(T)) method. Methods 2001; 25:402–408. [DOI] [PubMed] [Google Scholar]
- [19]. Bolger AM, Lohse M, Usadel B. Trimmomatic: a flexible trimmer for Illumina sequence data. Bioinformatics 2014; 30:2114–2120. [DOI] [PMC free article] [PubMed] [Google Scholar]
- [20]. Wu TD, Nacu S. Fast and SNP-tolerant detection of complex variants and splicing in short reads. Bioinformatics 2010; 26:873–881. [DOI] [PMC free article] [PubMed] [Google Scholar]
- [21]. Li H, Handsaker B, Wysoker A, Fennell T, Ruan J, Homer N, Marth G, Abecasis G, Durbin R. The sequence alignment/map format and SAMtools. Bioinformatics 2009; 25:2078–2079. [DOI] [PMC free article] [PubMed] [Google Scholar]
- [22]. Liao Y, Smyth GK, Shi W. FeatureCounts: an efficient general purpose program for assigning sequence reads to genomic features. Bioinformatics 2014; 30:923–930. [DOI] [PubMed] [Google Scholar]
- [23]. Robinson MD, McCarthy DJ, Smyth GK. edgeR: a bioconductor package for differential expression analysis of digital gene expression data. Bioinformatics 2010; 26:139–140. [DOI] [PMC free article] [PubMed] [Google Scholar]
- [24]. Macqueen J. Some methods for classification and analysis of multivariate observations In: Proceedings of 5th Berkeley Symposium on Mathematical Statistics and Probability. University of California Press; 281–297. [Google Scholar]
- [25]. Schurch NJ, Schofield P, Gierliński M, Cole C, Sherstnev A, Singh V, Wrobel N, Gharbi K, Simpson GG, Owen-Hughes T, Blaxter M, Barton GJ. How many biological replicates are needed in an RNA-seq experiment and which differential expression tool should you use? RNA 2016; 22:839–851. [DOI] [PMC free article] [PubMed] [Google Scholar]
- [26]. Anders S, Huber W. Differential expression analysis for sequence count data. Genome Biol 2010; 11:R106. [DOI] [PMC free article] [PubMed] [Google Scholar]
- [27]. Author T, Benjamini Y, Hochberg Y, Benjaminit Y. Controlling the false discovery rate: A practical and powerful approach to multiple controlling the false discovery rate: A practical and powerful approach to multiple testing. J R Stat Soc B 1995; 57:289–300. [Google Scholar]
- [28]. Clark EL, Bush SJ, McCulloch MEB, Farquhar IL, Young R, Lefevre L, Pridans C, Tsang HG, Wu C, Afrasiabi C, Watson M, Whitelaw CB et al. A high resolution atlas of gene expression in the domestic sheep (Ovis aries). PLoS Genet 2017; 13:e1006997. [DOI] [PMC free article] [PubMed] [Google Scholar]
- [29]. Albert I. The Biostar Handbook: A Beginner’s Guide to Bioinformatics, 1st ed. Biostar; 2016. https://biostar.myshopify.com/ [Google Scholar]
- [30]. Mi H, Thomas P. PANTHER pathway: an ontology-based Pathway database coupled with data analysis tools. Methods Mol Biol (Clifton, NJ) 2009; 563:123–140. [DOI] [PMC free article] [PubMed] [Google Scholar]
- [31]. Pagán YL, Srouji SS, Jimenez Y, Emerson A, Gill S, Hall JE. Inverse relationship between luteinizing hormone and body mass index in polycystic ovarian syndrome: investigation of hypothalamic and pituitary contributions. J Clin Endocrinol Metab 2006; 91:1309–1316. [DOI] [PubMed] [Google Scholar]
- [32]. Chosich J, Bradford AP, Allshouse AA, Reusch JEB, Santoro N, Schauer IE. Acute recapitulation of the hyperinsulinemia and hyperlipidemia characteristic of metabolic syndrome suppresses gonadotropins. Obesity (Silver Spring) 2017; 25:553–560. [DOI] [PMC free article] [PubMed] [Google Scholar]
- [33]. Edwards SA, Trotter J, Rivier J, Vale W. Flow cytometric separation of gonadotrophs from dispersed rat pituitaries using a fluorescent GnRH antagonist. Mol Cell Endocrinol 1983; 30:21–35. [DOI] [PubMed] [Google Scholar]
- [34]. Thorner MO, Borges JL, Cronin MJ, Keefer DA, Hellmann P, Lewis D, Dabney LG, Quesenberry PJ. Fluorescence activated cell sorting of functional anterior pituitary cells. Endocrinology 1982; 110:1831–1833. [DOI] [PubMed] [Google Scholar]
- [35]. Wu JC, Su P, Safwat NW, Sebastian J, Miller WL. Rapid, efficient isolation of murine gonadotropes and their use in revealing control of follicle-stimulating hormone by paracrine pituitary factors. Endocrinology 2004; 145:5832–5839. [DOI] [PMC free article] [PubMed] [Google Scholar]
- [36]. Wen S, Schwarz JR, Niculescu D, Dinu C, Bauer CK, Hirdes W, Boehm U. Functional characterization of genetically labeled gonadotropes. Endocrinology 2008; 149:2701–2711. [DOI] [PubMed] [Google Scholar]
- [37]. Childs GV. Cytochemical studies of multifunctional gonadotropes. Microsc Res Tech 1997; 39:114–130. [DOI] [PubMed] [Google Scholar]
- [38]. Childs GV. Development of gonadotropes may involve cyclic transdifferentiation of growth hormone cells. Arch Physiol Biochem 2002; 110:42–49. [DOI] [PubMed] [Google Scholar]
- [39]. Lee EJ, Thimmapaya B, Jameson JL. Stereotactic injection of adenoviral vectors that target gene expression to specific pituitary cell types: implications for gene therapy. Neurosurgery 2000; 46:1461–1468; discussion 1468-9. [DOI] [PubMed] [Google Scholar]
- [40]. Thompson IR, Kaiser UB. GnRH pulse frequency-dependent differential regulation of LH and FSH gene expression. Mol Cell Endocrinol 2014; 385:28–35. [DOI] [PMC free article] [PubMed] [Google Scholar]
- [41]. Edwards BS, Clay CM, Ellsworth BS, Navratil AM. Functional role of gonadotrope plasticity and network organization. Front Endocrinol (Lausanne) 2017; 8:223. [DOI] [PMC free article] [PubMed] [Google Scholar]
- [42]. Alim Z, Hartshorn C, Mai O, Stitt I, Clay C, Tobet S, Boehm U. Gonadotrope plasticity at cellular and population levels. Endocrinology 2012; 153:4729–4739. [DOI] [PMC free article] [PubMed] [Google Scholar]
- [43]. Gao Q, Sun L-L, Xiang F-F, Gao L, Jia Y, Zhang J-R, Tao H-B, Zhang J-J, Li W-J. Crybb2 deficiency impairs fertility in female mice. Biochem Biophys Res Commun 2014; 453:37–42. [DOI] [PubMed] [Google Scholar]
- [44]. Schreihofer DA, Golden GA, Cameron JL. Cholecystokinin (CCK)-induced stimulation of luteinizing hormone (LH) secretion in adult male rhesus monkeys: Examination of the role of CCK in nutritional regulation of LH secretion. Endocrinology 1993; 132:1553–1560. [DOI] [PubMed] [Google Scholar]
- [45]. Kim HJ, Gieske MC, Hudgins S, Kim BG, Krust A, Chambon P, Ko C. Estrogen receptor alpha-induced cholecystokinin type A receptor expression in the female mouse pituitary. J Endocrinol 2007; 195:393–405. [DOI] [PubMed] [Google Scholar]
- [46]. Ichimaru T, Matsuyama S, Ohkura S, Mori Y, Okamura H. Central cholecystokinin-octapeptide accelerates the activity of the hypothalamic gonadotropin-releasing hormone pulse generator in goats. J Neuroendocrinol 2003; 15:80–86. [DOI] [PubMed] [Google Scholar]
Associated Data
This section collects any data citations, data availability statements, or supplementary materials included in this article.