

Abstract
Background
Recurrent joint bleeding in hemophilia results in arthropathy and functional impairment. The relationship of arthropathy development and factor activity (FA) has not been reported in patients with FA levels <15%‐20%.
Methods
During the Centers for Disease Control and Prevention Universal Data Collection, joint range‐of‐motion (ROM) measurements were taken at each comprehensive visit. Data were extracted from male patients with hemophilia (PWH) age ≥2 years with baseline factor activity levels ≤40%, excluding those prescribed prophylaxis, and used to calculate a proportion of normal ROM (PN‐ROM) measure. Data were analyzed using regression models.
Results
There were 6703 eligible PWH with 30 102 visits. PN‐ROM declined with increasing age, and was associated with hemophilia severity, race/ethnicity, obesity, and viral illnesses. PWH ≥30 years old with fFA ≤2% and those ≥50 years old with FA ≤5% had mean PN‐ROM values >10% less than controls; those ≥40 years old with FA <1% had values >20% less than controls. In the multivariable analysis, subjects with <1% FA had a 0.43% greater decrease (−0.49 to −0.37, 95% confidence interval) in PN‐ROM each year relative to those with 16%‐40% factor activity. A less pronounced effect was seen with 1%‐5% or 6%‐9% FA.
Conclusion
The effect of FA on ROM loss is far greater than that of any of the other characteristics, especially with FA <10%. This emphasizes the need to maintain a high index of suspicion for arthropathy in individuals with moderate and low‐mild hemophilia.
Keywords: arthropathy, clotting factor, hemophilia, joint disease, range of motion
Essentials.
People with hemophilia who did not receive prophylaxis may reveal the accumulation of arthropathy over long periods of time at a given factor activity (FA).
Examining loss of joint range of motion (ROM) serves as one measure of arthropathy in people with hemophilia who have been followed longitudinally.
The magnitude of effect of FA on loss of joint ROM is far greater than any of the other patient characteristic, especially for patients with FA levels <10%.
The difference of the effect of the type of hemophilia, A versus B, on rate of ROM loss is about one tenth that of having severe disease.
1. INTRODUCTION
Congenital hemophilia A and B are rare X‐linked clotting factor deficiencies (factors VIII and IX, respectively) affecting 25 287 unique patients in the United States seen within the hemophilia treatment center (HTC) network. 1 , 2 For most patients with severe hemophilia (<1% residual factor activity [FA]), many with moderate disease (1%‐5%) and some with mild disease (>5%‐40%), spontaneous and traumatic bleeding predominantly in joints can result in synovial inflammation. 1 Cycles of recurrent bleeding and further inflammation ultimately impact soft tissue, cartilage, and bone, resulting in loss of joint movement, pain, and functional impairment. 3
Recommendations for routine infusions of factor concentrate (prophylaxis) in people with severe hemophilia have focused on converting a severe phenotype to a moderate one by maintaining FA >1% and thus spare joint damage. 1 , 4 Initiation of prophylaxis prior to joint bleeding (primary prophylaxis) is advocated for children to prevent joint bleeding and minimize damage, and is typically started around 9‐12 months of age to coincide with when toddlers start to walk. 1 , 4 , 5
However, studies have shown that even when patients initiate prophylaxis early, treating to a target of >1% does not prevent silent or overt bleeds and thus joint damage. In the Joint Outcome Study (JOS), US patients’ randomized to primary prophylaxis treatment (initiated in children 6‐30 months of age) still were at risk for overt joint bleeding.5 While the risk for bleeding was substantially lower for the prophylaxis group than those treated on demand, some of the patients with no clinical evidence of bleeds still had soft tissue changes in the knees/ankles/elbows on magnetic resonance imaging (MRI) scans and evidence of iron deposition over the initial 6‐year period. 5 Longer‐term follow‐up of the JOS through age 14 showed that children maintained on prophylaxis continue to have joint bleeds and accumulate joint changes on MRI. 6 In a single‐center study in Germany, similar MRI changes were also observed in asymptomatic ankles of boys with hemophilia A or B despite receiving early prophylaxis treatment. 7 However, prospective studies have not been conducted to identify the ideal FA profile to avoid joint damage.
Recent epidemiologic studies of patients with mild to moderate hemophilia treated with on‐demand therapy provide insights into the relationship of baseline FA and risk of bleeding. In a study of 433 patients with mild to moderate hemophilia A in the Netherlands, risk of bleeding declined 18% for every 1% increase in factor VIII (FVIII), and those >15% would not be expected to have joint bleeding. 8 Soucie et al 9 evaluated the association between joint bleeding and factor levels in people with mild to moderate hemophilia who were included in a large public health surveillance system in the United States, the Universal Data Collection (UDC) system, which was established by the Centers for Disease Control and Prevention (CDC) in 1998 in collaboration with the US Hemophilia Treatment Center Network (see Appendix 1). The patients included in that analysis were followed for up to 12 years and received on‐demand treatment. Regression model estimates derived from the study data predicted 1.4 and 0.6 bleeds/year (hemophilia A and B, respectively) at a FA of 15%, suggesting that target activity levels of 15% are unlikely to prevent all joint bleeding. Additionally, joint bleed rates for any given FVIII/factor IX (FIX) level were higher among people with hemophilia A than people with hemophilia B.
While avoidance of clinically evident bleeding is a short‐term objective, avoidance of arthropathy, pain, and functional impairment is the ultimate goal of routine treatment. In our previously published work using UDC data to examine range of motion (ROM) of joints among young males with hemophilia, we found that increasing severity of hemophilia, older age, and presence of an inhibitor were associated with a greater limitation in joint ROM. 10 A separate analysis of the UDC data documented an independent effect of adiposity. Young males (≤20 years) who were overweight or obese had progressively faster rates of joint mobility loss, particularly in the lower limbs, than those with a low or normal body mass index (BMI); these findings were not explained by differences in disease severity. 11
In the current analysis, we used the UDC surveillance data to further explore the impact of hemophilia severity and specifically FVIII/FIX activity on joint ROM as a surrogate for hemophilic arthropathy.
2. MATERIALS AND METHODS
UDC system methodologies have been well described. 12 Data were collected from providers in a network of comprehensive care centers for people with bleeding disorders located throughout the United States. Patients or parents of minor children gave consent for annual participation, and the project had both local and CDC Institutional Review Board oversight. Collection of UDC data was required for federally designated HTCs and supported by CDC grants to the HTCs.
Demographic and clinical data were collected using standardized forms. Data collected at the first UDC visit included month and year of birth, sex, self‐reported race and Hispanic ethnicity, health insurance type, factor deficiency type, and baseline FA level based on clinic records. During each subsequent UDC visit, measurements of height and weight were taken and data were collected on current prescribed treatment type and the results of any testing for inhibitors.
Additionally, at each UDC visit, ROM measurements were taken on each of 10 joints (shoulders, elbows, hips, knees, and ankles) by trained care providers using standardized methods. A blood specimen was obtained and was tested in the CDC laboratory for the presence of active HIV, hepatitis C, or hepatitis B (positive surface antigen) infection.
2.1. Study population and data analysis
Males ≥2 years of age with hemophilia A or B with baseline FA levels of ≤40% and with UDC visits during the period 1998‐2011 were eligible for inclusion in the current analysis. Those who had been prescribed prophylactic treatment and those with any evidence of an inhibitor (elevated inhibitor titer or immune tolerance treatment) at enrollment and any time during follow‐up were excluded.
Patient race was categorized as “white,” “black,” or “other.” Hispanic ethnicity was determined based on designation of race and ethnicity as either white Hispanic or black Hispanic. Information from each visit was used to categorize current health insurance status as “commercial,” “Medicare/Medicaid,” “other,” or “uninsured.” Heights and weights measured at each visit were converted to BMI by dividing the weight in kilograms by the height in meters squared. Current BMI was categorized based on defined values of BMI for adults 13 as “underweight” (<18.5), “normal” (18.5‐24.9), “overweight” (25.0‐29.9) or “obese” (≥30.0) or on the basis of growth charts for children and teens <20 years of age. 14
Using the ROM data collected for each subject, along with ROM data collected similarly on an unaffected general population without hemophilia, 15 we created a summary measure of the proportion of normal ROM (PN‐ROM) for each study participant at each visit as described previously. 11 Briefly, the measures from all 10 joints were combined, and this measure was divided by the similarly derived summary measure for 12‐ to 20‐year‐old males without bleeding disorders and no joint disease and multiplied by 100 to calculate for each subject a PN‐ROM measure that could be compared between study subjects. The normal ROM for 12‐ to 20‐year‐olds was used as the denominator for the PN‐ROM measure for each age group of the cases so that the resulting proportion was standardized and could be compared across all age groups. Because very young subjects have greater ROM than 12‐ to 20‐year‐olds, the PN‐ROM value for these subjects usually exceeded 100%. The selection of this approach was guided by our desire to compute a measure of the overall amount of ROM loss (no matter where it occurred) for each subject at every visit. These measures for all visits were used in the analysis to calculate a rate of ROM loss that could be compared across the factor activity spectrum adjusting for other variables.
2.2. Statistical analysis
Differences in the distribution of demographic and clinical characteristics between subjects with hemophilia A and those with hemophilia B were examined for statistical significance using chi‐square tests. Least square means of the PN‐ROM values for subjects in categories of these characteristics were compared using general linear regression.
We used a mixed model repeated measures linear regression approach to evaluate the effects of the various patient characteristics on the rate of ROM loss over time. Data collected from 2 to as many as 14 UDC visits for each subject were used. Because data collected repeatedly on the same subjects are likely to be correlated, we examined various models with different covariance structures and selected an autoregression structure based on diagnostic measures indicating the best model fit for the data. The output of this analysis consists of 2 estimates of the effect of each characteristic: (1) an estimate of the PN‐ROM at the intercept (the youngest age groups); and (2) an estimate of the rate of change in the PN‐ROM value for each year due to that characteristic alone (adjusted for all of the other characteristics in the model). All analyses used SAS version 9.3 (SAS Institute, Cary, NC) and P values ≤.05 or 95% confidence intervals that did not include 0 were considered to indicate statistical significance.
3. RESULTS
During the study period, there were 6703 eligible patients who had a total of 30 102 UDC visits. Study subjects had 1‐14 visits with a mean (median) of 4.5 4 visits per patient. Only 1.5% of patients had only 1 visit. The distributions of patient characteristics at baseline are shown in Table 1. One quarter of subjects had severe (<1% FA, 26.3%), and nearly one third had moderate disease (1%‐5% FA, 31.4%). About half were youth or teens (52.5%), 10% were either black or Hispanic, 57.4% had commercial health insurance, 44.7% were overweight or obese, 60% were infected with hepatitis C, and 13% with HIV.
Table 1.
Demographic and clinical characteristics at baseline for 6703 males by type of hemophilia
| Characteristic | Total N (%) | Hemophilia A | Hemophilia B | P value | ||
|---|---|---|---|---|---|---|
| N | % | N | % | |||
| Age group, y | ||||||
| 2‐8 | 1710 (25.5) | 1197 | 24.9 | 513 | 27.1 | .03 |
| 9‐19 | 1808 (27.0) | 1330 | 27.7 | 478 | 25.2 | |
| 20‐44 | 2162 (32.2) | 1568 | 32.6 | 594 | 31.3 | |
| 45‐64 | 851 (12.7) | 600 | 12.5 | 251 | 13.2 | |
| 65+ | 172 (2.6) | 112 | 2.3 | 60 | 3.2 | |
| Race | ||||||
| White | 5624 (83.9) | 3973 | 82.6 | 1651 | 87.1 | <.001 |
| Black | 688 (10.3) | 534 | 11.1 | 154 | 8.1 | |
| Other | 391 (5.8) | 300 | 6.3 | 91 | 4.8 | |
| Hispanic ethnicity | ||||||
| Yes | 752 (11.2) | 631 | 13.1 | 121 | 6.4 | <.001 |
| No | 5951 (88.8) | 4176 | 86.9 | 1775 | 93.6 | |
| Insurance | ||||||
| Commercial | 3848 (57.4) | 2778 | 57.8 | 1070 | 56.4 | <.001 |
| Medicaid/Medicare | 1911 (28.5) | 1469 | 30.6 | 442 | 23.3 | |
| Other | 459 (6.8) | 301 | 6.3 | 158 | 8.3 | |
| Uninsured | 442 (6.6) | 240 | 5.0 | 202 | 10.6 | |
| Body mass index | ||||||
| Underweight | 67 (1.0) | 49 | 1.0 | 18 | 1.0 | .90 |
| Normal | 3469 (51.8) | 2471 | 51.4 | 998 | 52.6 | |
| Overweight | 1605 (23.9) | 1164 | 24.2 | 441 | 23.3 | |
| Obese | 1395 (20.8) | 1007 | 21.0 | 388 | 20.5 | |
| Baseline factor activity level | ||||||
| <1 | 1762 (26.3) | 1368 | 28.5 | 394 | 20.8 | <.001 |
| 1‐2 | 833 (12.4) | 436 | 9.1 | 397 | 20.9 | |
| 3‐5 | 1270 (19.0 | 785 | 16.3 | 485 | 25.6 | |
| 6‐9 | 1006 (15.0) | 742 | 15.4 | 264 | 13.9 | |
| 10‐14 | 788 (11.8) | 605 | 12.6 | 183 | 9.6 | |
| 15‐24 | 720 (10.7) | 598 | 12.4 | 122 | 6.4 | |
| 25‐40 | 324 (4.8) | 273 | 5.7 | 51 | 2.7 | |
| HIV infection | ||||||
| Negative | 5843 (87.2) | 4055 | 84.4 | 1788 | 94.3 | <.001 |
| Positive | 860 (12.8) | 752 | 15.6 | 108 | 5.7 | |
| Hepatitis C infection | ||||||
| Negative | 2706 (40.4) | 2040 | 42.4 | 666 | 35.1 | <.001 |
| Positive | 3997 (59.6) | 2767 | 57.6 | 1230 | 64.9 | |
| Hepatitis B infectiona | ||||||
| Negative | 6555 (97.8) | 4695 | 97.7 | 1860 | 98.1 | .30 |
| Positive | 148 (2.2) | 112 | 2.3 | 36 | 1.9 | |
All proportions do not sum to 100% due to missing data.
Positive for hepatitis B surface antigen.
The distributions of nearly all of the characteristics differed by hemophilia type (Table 1). Compared to participants with hemophilia B, those with hemophilia A tended to be somewhat younger, a higher proportion were of minority race and ethnicity and more had government health insurance. Clinically, participants with hemophilia A were also more likely to be overweight or obese, less likely to have moderate disease, more likely to be HIV infected, but less likely to be infected with hepatitis C.
ROM was strongly associated with all of the studied patient characteristics (Table 2). Not surprisingly, PN‐ROM values declined with age and ranged from a mean of 105.7% of normal for the youngest to 85.2% of normal for the oldest subjects (P < .001). Blacks, Hispanics, and those with Medicare or Medicaid health insurance had significantly lower mean values for PN‐ROM than their respective comparators. Overweight and obese subjects and the few (~1%) who were underweight had lower PN‐ROM values than those of normal weight. With regard to clinical characteristics and based on unadjusted comparisons, those with hemophilia A had a significantly lower mean PN‐ROM at baseline than those with hemophilia B (Table 2). Subjects with FA of <1% had a marked lower PN‐ROM than those with factor levels of 1% or above. Subjects with each of the 3 studied infections had significantly lower PN‐ROM values than those who were uninfected.
Table 2.
Associations between demographic and clinical characteristics at baseline and the proportion of normal range of motion (ROM) for 6703 males with hemophilia
| Characteristic | Mean normal ROM, % |
|---|---|
| Age group, y | |
| 2‐8 | 105.7 |
| 9‐19 | 98.9 |
| 20‐44 | 89.0 |
| 45‐64 | 83.1 |
| 65+ | 85.2 |
| Race | |
| White | 95.3 |
| Black | 91.7 |
| Other | 97.8 |
| Hispanic ethnicity | |
| Yes | 94.7 |
| No | 98.2 |
| Insurance | |
| Commercial | 96.4 |
| Medicaid/Medicare | 92.6 |
| Other | 95.3 |
| Uninsured | 94.0 |
| Body mass index | |
| Underweight | 78.4 |
| Normal | 98.3 |
| Overweight | 92.3 |
| Obese | 91.3 |
| Hemophilia type | |
| A | 94.6 |
| B | 96.3 |
| Baseline factor activity level | |
| <1 | 86.5 |
| 1‐2 | 96.8 |
| 3‐5 | 97.7 |
| 6‐9 | 98.5 |
| 10‐14 | 99.2 |
| 15‐24 | 98.2 |
| 25‐40 | 97.7 |
| HIV infection | |
| Negative | 97.0 |
| Positive | 82.2 |
| Hepatitis C infection | |
| Negative | 100.8 |
| Positive | 86.5 |
| Hepatitis B infection | |
| Negative | 95.3 |
| Positive | 87.6 |
P < .001 for all comparisons.
Relations between PN‐ROM and the combination of age and baseline FA level for study subjects and for the referent normal population (4) are shown in Table 3. It is apparent that PN‐ROM values for most of the subjects were within 10% of the values for similarly aged males without a bleeding disorder or known joint disease. Only men with hemophilia who were ≥30 years of age with factor levels ≤2% and those ≥50 years old with factor levels ≤5% had mean PN‐ROM values >10% less than those of similarly aged males without hemophilia. Furthermore, men with hemophilia who were ≥40 years of age with factor levels <1% had PN‐ROM values >20% less than those of similarly aged men without hemophilia. The same data shown graphically in Figure 1A and 1B, separately for subjects with hemophilia A and B, demonstrate that the loss in PN‐ROM with age was linear, but the rate of loss varied by hemophilia severity with the steepest decline among subjects with severe disease. In addition, the overall magnitude of the decline appeared to be greater for subjects with hemophilia A than for those with hemophilia B.
Table 3.
Mean percentage of normal range of motion by age group and actor activity level for 6703 males with hemophilia and for males without bleeding disorders or known joint disease
| Age, y | Baseline factor activity level, % | |||||||
|---|---|---|---|---|---|---|---|---|
| <1 | 1 ‐ 2 | 3 ‐ 5 | 6 ‐ 9 | 10 ‐14 | 15‐24 | 25‐40 | Normal | |
| 2‐8 | 105 | 105 | 105 | 105 | 105 | 105 | 105 | 114 |
| 9‐19 | 96 | 99 | 99 | 99 | 99 | 99 | 99 | 102 |
| 20‐29 | 89 | 94 | 95 | 95 | 97 | 98 | 95 | 98 |
| 30‐39 | 81 | 86 | 92 | 92 | 94 | 96 | 93 | 99 |
| 40‐49 | 70 | 80 | 86 | 90 | 91 | 91 | 94 | 94 |
| 50‐69 | 63 | 78 | 83 | 87 | 88 | 88 | 86 | 92 |
| 70+ | 57 | 80 | 82 | 82 | 87 | 87 | 87 | NA |
| Normal |
| Within 10% of normal |
| >10 up to 20% below normal |
| >20% below normal |
| Insufficient data |
NA, not applicable.
Figure 1.
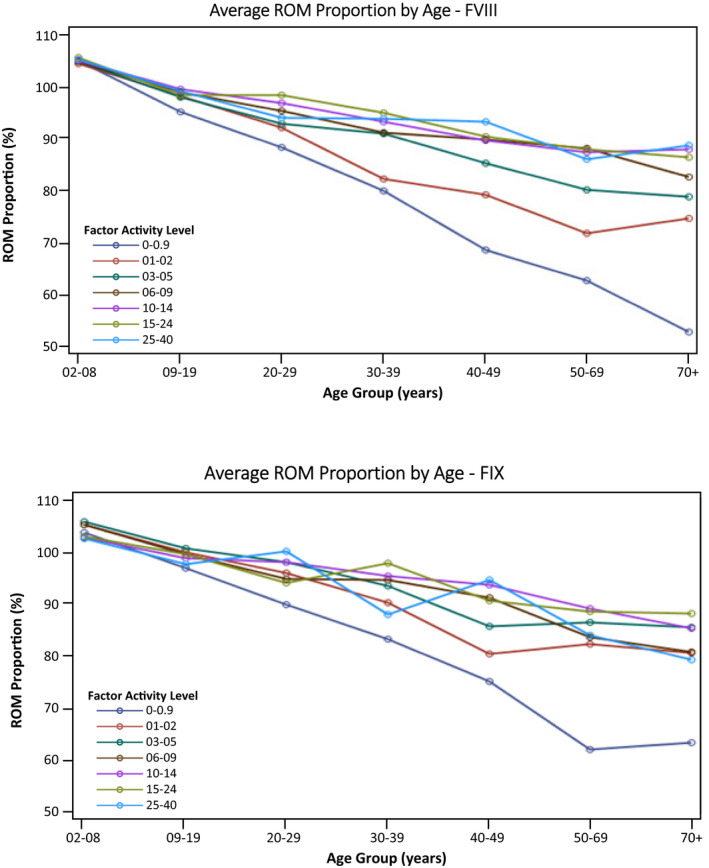
Average ROM proportion by age group based on baseline factor levels in patients not receiving prophylactic treatment of bleeding: (A) 4807 males with hemophilia A; (B) 1896 males with hemophilia B. FIX, factor IX; FVIII, factor VIII; ROM, range of motion
The results of a mixed model multivariable linear regression analysis using data from all 30 102 visits for the 6703 subjects are shown in Table 4. Among all of the studied demographic and clinical characteristics, only infection with hepatitis B or C did not contribute significantly to the model and were omitted from the final model. Two estimates were generated by the model for each characteristic: The first was an estimate of the effect of the characteristic on the initial value of PN‐ROM; the second was an estimate of the effect of the characteristic on the rate of change of the PN‐ROM per year of follow‐up.
Table 4.
Multivariable analysis of associations between demographic and clinical characteristics and initial PN‐ROM status and rate of PN‐ROM change over time among 6703 males with hemophilia
| Characteristic | Initial PN‐ROM status | Rate of PN‐ROM change | ||
|---|---|---|---|---|
| Parameter estimate | 95% CI | Parameter estimate | 95% CI | |
| Intercept | 105.3 | 103.0‐107.6 | ||
| Age, y | −0.35 | −0.4 to −0.3 | ||
| Hemophilia B vs A | 0.28 | −0.6 to 1.2 | 0.05 | 0.02 to 0.08 |
| Baseline factor level vs 16%‐40% | ||||
| <1 | 2 | 0.4‐3.5 | ‐0.43 | −0.47 to −0.4 |
| 1‐9 | 1.32 | 0.04‐2.6 | −0.12 | −0.16 to −0.09 |
| 10‐15 | 0.5 | −1.0 to 2.1 | −0.02 | −0.06 to 0.02 |
| Race vs white | ||||
| Black | −1.1 | −2.4 to 0.3 | −0.07 | −0.11 to −0.03 |
| Other | 1.4 | −0.1 to 3.0 | −0.06 | −0.12 to −0.001 |
| Hispanic ethnicity | 1.5 | 0.4 to 2.7 | −0.08 | −0.13 to −0.04 |
| Insurance vs. commercial | ||||
| Medicaid/Medicare | −1 | −1.6 – −0.4 | −0.02 | −0.03 to 0.0 |
| Other | −0.7 | −1.6 to 0.3 | 0.01 | −0.02 to 0.04 |
| Uninsured | 0.003 | −1.2 to 1.2 | −0.01 | −0.05 to 0.03 |
| Body mass index vs normal | ||||
| Underweight | 0.6 | −2.3 to 3.6 | −0.01 | −0.1 to 0.07 |
| Overweight | −1.6 | −2.1 to −1.1 | 0.02 | 0.0 to 0.03 |
| Obese | −3.9 | −4.5 to −3.3 | 0.03 | 0.01 to 0.05 |
| HIV infection | 0.6 | −1.5 to 2.6 | 0.06 | 0.01 to 0.11 |
Parameter estimates are interpreted as either a lesser (+) or greater (–) decrease in the rate of annual loss in the PN‐ROM due to that level of a characteristic relative to the reference level.
Abbreviations: CI, Confidence Interval; PN‐ROM, percentage of normal range of motion.
The intercept is the estimate of the PN‐ROM at the origin of the fitted regression line for subjects with the reference value for every characteristic. The value of the intercept (105.3% of normal) is the model estimate of the PN‐ROM for the youngest subjects with the referent hemophilia type (A), factor level (16%‐40%), white race, non‐Hispanic ethnicity, and so on. Parameter estimates for each level of characteristic can be added to the intercept to obtain the estimated PN‐ROM value for subjects with that characteristic.
Of more interest are the estimates for the rate of PN‐ROM change due to that characteristic shown in the third column of Table 4. These parameter estimates are interpreted as either a lesser or greater decrease (positive or negative sign, respectively) in the rate of annual loss in the PN‐ROM due to that level of a characteristic relative to the reference level. Adjusting for all of the characteristics in the model, subjects with <1% FA had a nearly 0.5% (0.43) significantly greater average decrease in PN‐ROM each year relative to those with factor activity levels of 16%‐40%. A similar significant effect was seen among subjects with factor activity levels of 1%‐9%; however, the magnitude of the excess decrease in the PN‐ROM (0.12) was only about one fourth that seen among those with severe hemophilia. FA levels from 10% to 15% did not significantly influence the rate of PN‐ROM change over time compared to those with FA levels >15%.
The average rate of loss of PN‐ROM was 0.05% less per year for subjects with hemophilia B than for those with hemophilia A. Other factors significantly associated with a decreased rate ROM loss included above‐normal BMI and HIV infection. Factors associated with an increased rate of ROM loss relative to their referent groups included black race, Hispanic ethnicity, and Medicare/Medicaid health insurance. In general, the magnitude of the differences in rates for these other factors was much less than that due to FA level (Table 4).
4. DISCUSSION
Joint‐related morbidity is a key concern in hemophilia. Recent large‐scale epidemiologic studies in patients treated without prophylaxis have demonstrated that the standard classification scheme for hemophilia severity may underestimate the complications experienced by people with mild to moderate hemophilia. This is supported by ongoing literature demonstrating the presence of joint disease and need for surgery in patients with mild hemophilia as they reach early adulthood, and perhaps exacerbated by the range of activities in which they are engaged without prophylaxis.
The prior analysis of UDC data demonstrated the relationship between FA and bleeding, with occasional bleeding noted at factor levels of up to 15%‐20%. 9 However, the observations dating back to Fischer et al 16 suggest that bleeding can be directly correlated with hemophilic arthropathy. In the first of these assessments of patients in the Netherlands, the authors showed that every 13 bleeds resulted in a 1‐point increase in the Pettersson radiographic score, and there was no “autonomous” progression in the absence of joint bleeding. When compared with the prior UDC study of FA and bleeding, 9 the current UDC study showed that the greatest impact on joint ROM was seen among participants with baseline factor levels of <1%. Further, the modeling suggests that participants with moderate hemophilia and lower range of mild hemophilia (5%‐9%) also experience an increased rate of loss of joint ROM that declines as the FA increases (Figure 1). Taken together, these 2 analyses of the UDC data set support the contention of Fischer et al 16 by demonstrating the association of joint ROM impact with baseline FA and the inherent associated bleeding risk. Findings from this study lend support to the clinical observation that with infrequent but ongoing bleeding rates over many years, patients may still develop hemophilic arthropathy.
While there remains ongoing disagreement on whether hemophilia A represents a more severe disease at any given factor level than hemophilia B, this analysis shows that hemophilia type may have only a limited impact on joint health (about one tenth) compared to having severe disease. The far greater effect of FA levels than hemophilia type on relevant clinical outcomes such as joint disease may be one reason for the difficulty in proving that hemophilia B has a less severe phenotype. In part, this may be the result of the differences in FVIII and FIX synthesis and where the inactive factors are stored and become activated in vivo. 17 Our data do not help resolve the differences in FVIII and FIX biology but demonstrate that the effect of FA carries much more significance in relation to joint ROM.
Ultimately, the focus of clinical management of hemophilia has been to ensure that patients with hemophilia grow to adulthood and older ages with preserved musculoskeletal function. Prophylaxis has likely dramatically reduced bleeding in the population with severe hemophilia, but data still suggest standard prophylaxis to a 1% trough target may not be sufficient to prevent bleeding. 5 , 7 Joint pathology directly relates to the number of bleeding events, 16 and in populations including those on prophylaxis, the presence of Pettersson scores of >21 is associated with significant health‐related quality‐of‐life impairment. 18 A recent study of nearly 2000 men in the United States with severe hemophilia, among whom nearly 40% were using continuous prophylaxis, found that the presence of joint disease was strongly associated with worse health‐related quality of life as measured by 2 standardized tools. 19 Multiple recent observational studies that included patient‐reported outcome assessments in mild to moderate hemophilia have also demonstrated pain, functional impairment, depression, and anxiety in adults not traditionally considered for early prophylaxis. 20 , 21 , 22 , 23 , 24 , 25 , 26 , 27 , 28 , 29 , 30
As enthusiasm builds for newer treatment options (extended half‐life factor, nonfactor, and gene therapy) that seek to modify a severe phenotype to a milder one, the issue of losing track of patients that have infrequent but significant joint bleeding is becoming a paramount clinical conundrum. Further, the choice of clinically meaningful prophylaxis peak or trough targets to cover the range of patient activities also becomes more significant; applying this approach to targeting nonfactor treatments that are not directly assessed by factor levels is speculative. In both cases, there is a tremendous need for large‐scale data across developed countries, including joint and functional assessments over the coming decades.
Several limitations should be considered when these results are evaluated. First, because patients using prophylaxis, and who may have had a more severe bleeding phenotype, were excluded, our results may have underestimated the amount of joint ROM loss experienced across the FA‐level spectrum for patients with both severe and nonsevere hemophilia. However, a previous study of bleeding rates in this same population revealed that there were patients with significant numbers of bleeds at every FA level. 9 Furthermore, a randomized trial found that prophylaxis begun after early childhood did not change the rate of arthropathy progression. 31 Therefore, the impact of this exclusion on the results of our study may have been minimal.
Second, although we relied on cross‐sectional data collected during annual visits to the HTC, we used ROM data collected from up to 14 visits to model the influence of various exposures on the rate of motion loss over time. In general, this analytic approach results in estimates that closely approximate those obtained from longitudinal studies; however, our results may have been influenced by nonlinear age effects that could not be accounted for in our models. 32
Third, the FA level that we used was the value reported at the first UDC visit as the “baseline” level according to the patient’s clinic record. Because the tests were performed locally and the testing date was not reported we were unable to assess the accuracy of the measures due to known interlaboratory variability 33 as well as the FA increases that occur with aging. 34 Nonetheless, the strength of FA level as a risk factor for joint outcomes was so strong that these variations were unlikely to have biased the results in any meaningful way.
Finally, the data collected in UDC provide limited information on joint‐specific bleeding or function; clinical assessment of functional outcomes was captured with a 5‐level categorical assessment of the patient’s overall activity level. UDC further captured use of adaptive devices (cane/crutches/walker or wheelchair) over the prior 6 months and the number of days of missed work/school in the prior year due to upper and lower extremity problems. However, UDC did not capture a comprehensive functional assessment (eg, Hemophilia Activities List [HAL]) that incorporates detailed activities associated with specific joints or the upper or lower extremities with which to correlate our analysis of composite PN‐ROM across all 10 joints assessed or drive a deeper joint‐specific (ankle/knee/elbow) ROM analysis. Therefore, the measure that we used in this study, while appropriate for measuring rate of ROM loss, lacks adequate detail to make assessments of the effects of FA and other characteristics on joint function, or the effect of FA on any specific joint. It is likely based on prior epidemiologic analyses including UDC data that patients with mild to moderate hemophilia may have only 1 or 2 joints that would be abnormal, 8 , 9 , 35 , 36 and as such the impact of particularly FA levels in the mild range on composite PN‐ROM may minimize the impact seen over the up to 12‐year time horizon in the UDC data set; thus, we are unable to speak to the extent of impact that FA on individual joints and what impairment is associated with the loss of PN‐ROM. Correlations between HAL, other patient‐reported outcomes, and hemophilia joint health score (which includes ROM) have been established in a recently published study of 381 adults in US HTCs. 20 , 37 , 38 In the context of the current focus on transitioning patients to a “milder phenotype” with new therapeutic approaches, there are opportunities in long‐term prospective studies moving forward to combine more detailed assessment of specific joints and functional tasks.
5. CONCLUSION
The effect of FA level on ROM loss appears far greater than that of other characteristics, especially for patients with FA levels <10%. Those with moderate and low‐mild hemophilia showed a lower rate of loss of ROM compared to those with severe hemophilia treated on demand. Exclusion of patients treated with prophylaxis at any time may reduce the magnitude of these results. This evidence emphasizes the need to maintain a high index of suspicion of substantial joint disease among older‐age individuals with moderate and low‐mild hemophilia treated on demand, with consideration of the role of secondary prophylaxis in this nonsevere population. Further, increased focus on children with nonsevere hemophilia should include consideration of prophylaxis to avoid even the very gradual development of arthropathy. The effect of hemophilia type (A vs B) on rate of ROM loss exists, but is about one tenth that of having severe disease and may be one reason for the difficulty in proving that hemophilia B has a less severe phenotype. As factor‐based prophylaxis regimens and future nonfactor treatments move toward creating a larger population with “mild” hemophilia, broader surveillance of clinical markers of joint health and functional impairment should become a more critical aspect in the coming decades and a potential priority for the US HTC network.
6. STUDY GROUP MEMBERS
The US Hemophilia Treatment Center Network (USHTCN) includes about 130 regionally organized hemophilia treatment centers. The CDC‐UDC Cooperative Agreement Grantees/Regional Directors of the 12 regions of the USHTCN at the time of final UDC data cleaning and research evaluations include: Doreen B. Brettler, New England Hemophilia Center, Worcester, MA; Christopher E. Walsh, Mount Sinai School of Medicine, New York, NY; Regina B. Butler, Children’s Hospital of Philadelphia, Philadelphia, PA; Paul Monahan, University of North Carolina at Chapel Hill, Chapel Hill, NC; Ruth Brown, Hemophilia of Georgia, Inc, Atlanta, GA; Ivan C. Harner, Hemophilia Foundation of Michigan, Ypsilanti, MI; Danielle L. Baxter, Great Lakes Hemophilia Foundation, Milwaukee, WI; Deborah L. Brown, Gulf States Hemophilia and Thrombophilia Center, Houston, TX; Brian M. Wicklund, Kansas City Regional Hemophilia Center, Kansas City, MO; Marilyn J. Manco‐Johnson, University of Colorado Hemophilia and Thrombosis Center, Aurora, CO; Diane J. Nugent, Children’s Hospital of Orange County, Orange, CA; Michael Recht, The Hemophilia Center at Oregon Health and Science University, Portland, OR. In addition to coordinating regional data collection, the Regional Coordinators from the 12 regions of the US HTCN validated specific data elements and categories to verify the precision of this study and include: Ann D. Forsberg, Mariam Voutsis, Danielle L. Deery, Steven Humes, Karen Droze, Suzanne Kapica, Kathryn Reese, John Drake, Becky Dudley, Judith R. Baker, Brenda K. Riske, and Robi Ingram‐Rich.
RELATIONSHIP DISCLOSURE
MW and MR are directors of HTCs that participated in the CDC‐UDC study. JMS has been the lead epidemiologist associated with the CDC‐UDC study and liaison with the CDC‐UDC Working Group and CDC‐UDC Joint Working Group.
AUTHOR CONTRIBUTIONS
MW, MR, JMS, NI, and DLC participated in the design of the analysis, interpretation of data, and writing/editing the manuscript.
DISCLAIMER
The findings and conclusions in this report are those of the authors and do not necessarily represent the official position of the Centers for Disease Control and Prevention.
Wang M, Recht M, Iyer NN, Cooper DL, Soucie JM. Hemophilia without prophylaxis: Assessment of joint range of motion and factor activity. Res Pract Thromb Haemost. 2020;4:1035–1045. 10.1002/rth2.12347
Handling Editor: Dr Neil Zakai.
REFERENCES
- 1. Srivastava A, Brewer AK, Mauser‐Bunschoten EP, Key NS, Kitchen S, Llinas A, et al. Guidelines for the management of hemophilia. Haemophilia. 2013;19(1):e1–47. [DOI] [PubMed] [Google Scholar]
- 2. Centers for Disease Control and Prevention HTC Population Profile ‐ January 2012 to March 2019. 2019. [Accessed 2017 September 7] Available from: https://www.cdc.gov/ncbddd/hemophilia/communitycounts/data‐reports/2019‐3
- 3. Roosendaal G, Lafeber FP. Pathogenesis of haemophilic arthropathy. Haemophilia. 2006;12(suppl 3):117–21. [DOI] [PubMed] [Google Scholar]
- 4. National Hemophilia Foundation Medical and Scientific Advisory Council Recommendation #241 Concerning Prophylaxis ‐ Regular Administration of Clotting Factor Concentrate to Prevent Bleeding. www.hemophilia.org: National Hemophilia Foundation; February 27, 2016. [Accessed 2017 July 26] Available from: https://www.hemophilia.org/sites/default/files/document/files/241Prophylaxis.pdf.
- 5. Manco‐Johnson MJ, Abshire TC, Shapiro AD, Riske B, Hacker MR, Kilcoyne R, et al. Prophylaxis versus episodic treatment to prevent joint disease in boys with severe hemophilia. N Engl J Med. 2007;357(6):535–44. [DOI] [PubMed] [Google Scholar]
- 6. Manco‐Johnson MJ, Manco‐Johnson ML, Blades TA, Funk S, Lane H, McRedmond K, et al. Long‐term orthopedic effects of delaying prophylaxis in severe hemophilia a until age 6 years: results of the joint outcome study continuation (JOSc). Blood. 2013;122(21):210–210. [Google Scholar]
- 7. Olivieri M, Kurnik K, Pfluger T, Bidlingmaier C. Identification and long‐term observation of early joint damage by magnetic resonance imaging in clinically asymptomatic joints in patients with haemophilia A or B despite prophylaxis. Haemophilia. 2012;18(3):369–74. [DOI] [PubMed] [Google Scholar]
- 8. den Uijl IE, Fischer K, Van Der Bom JG, Grobbee DE, Rosendaal FR, Plug I. Analysis of low frequency bleeding data: the association of joint bleeds according to baseline FVIII activity levels. Haemophilia. 2011;17(1):41–4. [DOI] [PubMed] [Google Scholar]
- 9. Soucie JM, Monahan PE, Kulkarni R, Konkle BA, Mazepa MA. The frequency of joint hemorrhages and procedures in nonsevere hemophilia A vs B. Blood Adv. 2018;2(16):2136–44. [DOI] [PMC free article] [PubMed] [Google Scholar]
- 10. Soucie JM, Cianfrini C, Janco RL, Kulkarni R, Hambleton J, Evatt B, et al. Joint range‐of‐motion limitations among young males with hemophilia: prevalence and risk factors. Blood. 2004;103(7):2467–73. [DOI] [PubMed] [Google Scholar]
- 11. Soucie JM, Wang C, Siddiqi A, Kulkarni R, Recht M, Konkle BA. The longitudinal effect of body adiposity on joint mobility in young males with Haemophilia A. Haemophilia. 2011;17(2):196–203. [DOI] [PubMed] [Google Scholar]
- 12. Soucie JM, McAlister S, McClellan A, Oakley M, Su Y. The universal data collection surveillance system for rare bleeding disorders. Am J Prev Med. 2010;38(4 suppl):S475–81. [DOI] [PubMed] [Google Scholar]
- 13. Centers for Disease Control and Prevention ‐ BMI for adults. [Accessed 2017 September 7] Available from: https://www.cdc.gov/healthyweight/assessing/bmi/adult_bmi/index.html
- 14. Centers for Disease Control and Prevention ‐ BMI for children and teens. [Accessed 2017 September 7] Available from: https://www.cdc.gov/healthyweight/assessing/bmi/childrens_bmi/about_childrens_bmi.html
- 15. Soucie JM, Wang C, Forsyth A, Funk S, Denny M, Roach KE, et al. Range of motion measurements: reference values and a database for comparison studies. Haemophilia. 2011;17(3):500–7. [DOI] [PubMed] [Google Scholar]
- 16. Fischer K, van Hout BA, van der Bom JG, Grobbee DE, van den Berg HM. Association between joint bleeds and Pettersson scores in severe haemophilia. Acta Radiol. 2002;43(5):528–32. [PubMed] [Google Scholar]
- 17. Franchini M, Mannucci PM. Haemophilia B is clinically less severe than haemophilia A: further evidence. Blood Transfus. 2018;16(2):121–2. [DOI] [PMC free article] [PubMed] [Google Scholar]
- 18. Fischer K, Bom JG, Mauser‐Bunschoten EP, Roosendaal G, Berg HM. Effects of haemophilic arthropathy on health‐related quality of life and socio‐economic parameters. Haemophilia. 2005;11(1):43–8. [DOI] [PubMed] [Google Scholar]
- 19. Soucie JM, Grosse SD, Siddiqi AE, Byams V, Thierry J, Zack MM, et al. The effects of joint disease, inhibitors and other complications on health‐related quality of life among males with severe haemophilia A in the United States. Haemophilia. 2017;23(4):e287–93. [DOI] [PMC free article] [PubMed] [Google Scholar]
- 20. Kempton CL, Recht M, Neff A, Wang M, Buckner TW, Soni A, et al. Impact of pain and functional impairment in US adults with haemophilia: Patient‐reported outcomes and musculoskeletal evaluation in the pain, functional impairment and quality of life (P‐FiQ) study. Haemophilia. 2018;24(2):261–70. [DOI] [PubMed] [Google Scholar]
- 21. Witkop M, Neff A, Buckner TW, Wang M, Batt K, Kessler CM, et al. Self‐reported prevalence, description and management of pain in adults with haemophilia: methods, demographics and results from the Pain, Functional Impairment, and Quality of life (P‐FiQ) study. Haemophilia. 2017;23(4):556–65. [DOI] [PubMed] [Google Scholar]
- 22. Baumann K, Hernandez G, Witkop M, Peltier S, Dunn S, Cutter S, et al. Impact of mild to severe hemophilia on engagement in recreational activities by US men, women, and children with hemophilia B: The Bridging Hemophilia B Experiences, Results and Opportunities into Solutions (B‐HERO‐S) study. Eur J Haematol. 2017;98(suppl 86):25–34. [DOI] [PubMed] [Google Scholar]
- 23. Buckner TW, Witkop M, Guelcher C, Frey MJ, Hunter S, Peltier S, et al. Management of US men, women, and children with hemophilia and methods and demographics of the Bridging Hemophilia B Experiences, Results and Opportunities into Solutions (B‐HERO‐S) study. Eur J Haematol. 2017;98(suppl 86):5–17. [DOI] [PubMed] [Google Scholar]
- 24. Cutter S, Molter D, Dunn S, Hunter S, Peltier S, Haugstad K, et al. Impact of mild to severe hemophilia on education and work by US men, women, and caregivers of children with hemophilia B: The Bridging Hemophilia B Experiences, Results and Opportunities into Solutions (B‐HERO‐S) study. Eur J Haematol. 2017;98(suppl 86):18–24. [DOI] [PubMed] [Google Scholar]
- 25. Witkop M, Lambing A, Divine G, Kachalsky E, Rushlow D, Dinnen J. A national study of pain in the bleeding disorders community: a description of haemophilia pain. Haemophilia. 2012;18(3):e115–9. [DOI] [PubMed] [Google Scholar]
- 26. Witkop M, Lambing A, Kachalsky E, Divine G, Rushlow D, Dinnen J. Assessment of acute and persistent pain management in patients with haemophilia. Haemophilia. 2011;17(4):612–9. [DOI] [PubMed] [Google Scholar]
- 27. Poon JL, Zhou ZY, Doctor JN, Wu J, Ullman MM, Ross C, et al. Quality of life in haemophilia A: Hemophilia Utilization Group Study Va (HUGS‐Va). Haemophilia. 2012;18(5):699–707. [DOI] [PubMed] [Google Scholar]
- 28. Curtis R, Baker J, Riske B, Ullman M, Niu X, Norton K, et al. Young adults with hemophilia in the U.S.: demographics, comorbidities, and health status. Am J Hematol. 2015;90(suppl 2):S11–6. [DOI] [PubMed] [Google Scholar]
- 29. Quon D, Reding M, Guelcher C, Peltier S, Witkop M, Cutter S, et al. Unmet needs in the transition to adulthood: 18‐ to 30‐year‐old people with hemophilia. Am J Hematol. 2015;90(suppl 2):S17–22. [DOI] [PubMed] [Google Scholar]
- 30. Witkop M, Guelcher C, Forsyth A, Hawk S, Curtis R, Kelley L, et al. Treatment outcomes, quality of life, and impact of hemophilia on young adults (aged 18–30 years) with hemophilia. Am J Hematol. 2015;90(suppl 2):S3–10. [DOI] [PubMed] [Google Scholar]
- 31. Manco‐Johnson MJ, Lundin B, Funk S, Peterfy C, Raunig D, Werk M, et al. Effect of late prophylaxis in hemophilia on joint status: a randomized trial. J Thromb Haemost. 2017;15(11):2115–24. [DOI] [PubMed] [Google Scholar]
- 32. Louis TA, Robins J, Dockery DW, Spiro A 3rd, Ware JH. Explaining discrepancies between longitudinal and cross‐sectional models. J Chronic Dis. 1986;39(10):831–9. [DOI] [PubMed] [Google Scholar]
- 33. Loomans JI, van Velzen AS, Eckhardt CL, Peters M, Makipernaa A, Holmstrom M, et al. Variation in baseline factor VIII concentration in a retrospective cohort of mild/moderate hemophilia A patients carrying identical F8 mutations. J Thromb Haemost. 2017;15(2):246–54. [DOI] [PubMed] [Google Scholar]
- 34. Lowe GD, Rumley A, Woodward M, Morrison CE, Philippou H, Lane DA, et al. Epidemiology of coagulation factors, inhibitors and activation markers: the Third Glasgow MONICA Survey. I. Illustrative reference ranges by age, sex and hormone use. Br J Haematol. 1997;97(4):775–84. [DOI] [PubMed] [Google Scholar]
- 35. den Uijl IE, Fischer K, Van Der Bom JG, Grobbee DE, Rosendaal FR, Plug I. Clinical outcome of moderate haemophilia compared with severe and mild haemophilia. Haemophilia. 2009;15(1):83–90. [DOI] [PubMed] [Google Scholar]
- 36. Den Uijl IE, Mauser Bunschoten EP, Roosendaal G, Schutgens RE, Biesma DH, Grobbee DE, et al. Clinical severity of haemophilia A: does the classification of the 1950s still stand? Haemophilia. 1950s;17(6):849–53. [DOI] [PubMed] [Google Scholar]
- 37. Batt K, Recht M, Cooper DL, Iyer NN, Kempton CL. Construct validity of patient‐reported outcome instruments in US adults with hemophilia: results from the Pain, Functional Impairment, and Quality of life (P‐FiQ) study. Patient Prefer Adherence. 2017;11:1369–80. [DOI] [PMC free article] [PubMed] [Google Scholar]
- 38. Kempton CL, Buckner TW, Fridman M, Iyer NN, Cooper DL. Factors associated with pain severity, pain interference, and perception of functional abilities independent of joint status in US adults with hemophilia: Multivariable analysis of the Pain, Functional Impairment, and Quality of Life (P‐FiQ) study. Eur J Haematol. 2018;100(suppl 1):25–33. [DOI] [PubMed] [Google Scholar]