

Abstract
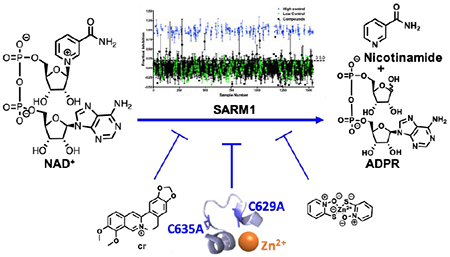
Sterile Alpha and Toll Interleukin Receptor Motif–containing protein 1 (SARM1) is a key therapeutic target for diseases that exhibit Wallerian–like degeneration; Wallerian degeneration is characterized by degeneration of the axon distal to the site of injury. These diseases include traumatic brain injury, peripheral neuropathy, and neurodegenerative diseases. SARM1 promotes neurodegeneration by catalyzing the hydrolysis of NAD+ to form a mixture of ADPR and cADPR. Notably, SARM1 knockdown prevents degeneration, indicating that SARM1 inhibitors will likely be efficacious in treating these diseases. Consistent with this hypothesis is the observation that NAD+ supplementation is axoprotective. To identify compounds that block the NAD+ hydrolase activity of SARM1, we developed and performed a high–throughput screen (HTS). This HTS assay exploits an NAD+ analog, etheno–NAD+ (ENAD) that fluoresces upon cleavage of the nicotinamide moiety. From this screen, we identified berberine chloride and zinc chloride as the first noncompetitive inhibitors of SARM1. Though modest in potency, the noncompetitive mode of inhibition, suggests the presence of an allosteric binding pocket on SARM1 that can be targeted for future therapeutic development. Additionally, zinc inhibition and site–directed mutagenesis reveals that cysteines 629 and 635 are critical for SARM1 catalysis, highlighting these sites for the design of inhibitors targeting SARM1.
Graphical Abstract
INTRODUCTION
Progressive axonal and neuronal degeneration (i.e., Wallerian degeneration) underlie many diseases, including traumatic brain injury, peripheral neuropathy and neurodegenerative diseases (e.g., Alzheimer’s disease, Parkinson’s disease, and Amyotrophic Lateral Sclerosis). These diseases account for extensive morbidity and mortality worldwide1 and their associated financial burden only continues to grow as the world population ages and there are no approved treatments; the average annual increase in mortality is 166% in the United States based on a population growth model.1, 2 Importantly, existing treatments are only palliative and focus on alleviating the cognitive and motor symptoms, rather than being curative, i.e. treating the disease to halt progression, which further impacts treatment costs.3
The dearth of treatment options is due in part to the fact that the neurodegeneration underlying these diseases was long thought to occur passively without molecular targets for therapeutic intervention.4 This view changed with the discovery of the WLDS mouse, a murine model that expresses a gain–of–function fusion protein that prevents degeneration.5–7 Discovery of the WLDS mutant reinvigorated efforts to uncover the molecular pathways that control neurodegeneration and identify suitable therapeutic targets. One such target is Sterile Alpha and Toll Interleukin Receptor Motif–containing protein 1 (SARM1). A role for SARM1 in neurodegeneration was first discovered in a screen for drosophila mutants that suppress Wallerian degeneration.8 Subsequent efforts revealed that SARM1 knockdown or knockout delays degeneration and this effect is conserved in drosophila, C. elegans, mice, and humans.8–10 Importantly, SARM1 knockout mice are protected from the degeneration triggered by traumatic brain injury, toxic neuropathy, optic nerve injury, and glaucoma.11–14
SARM1 is a 724 amino acid protein that consists of an N–terminal HEAT/Armadillo (ARM) domain, two tandem sterile alpha motif (SAM) domains, and a C–terminal toll interleukin receptor (TIR) domain (Figure 1A). Investigation into how SARM1 promotes neurodegeneration led to the discovery that SARM1, specifically the TIR domain, functions as an NAD+ glycohydrolase (Figure 1B). The SAM domains are thought to facilitate multimerization and the ARM domain is thought to negatively regulate the enzyme, although recent data showing that full length SARM1 is active, questions that initial hypothesis 15.
Figure 1. SARM1 Domain Architecture, Reaction, and Fluorescent Assay.
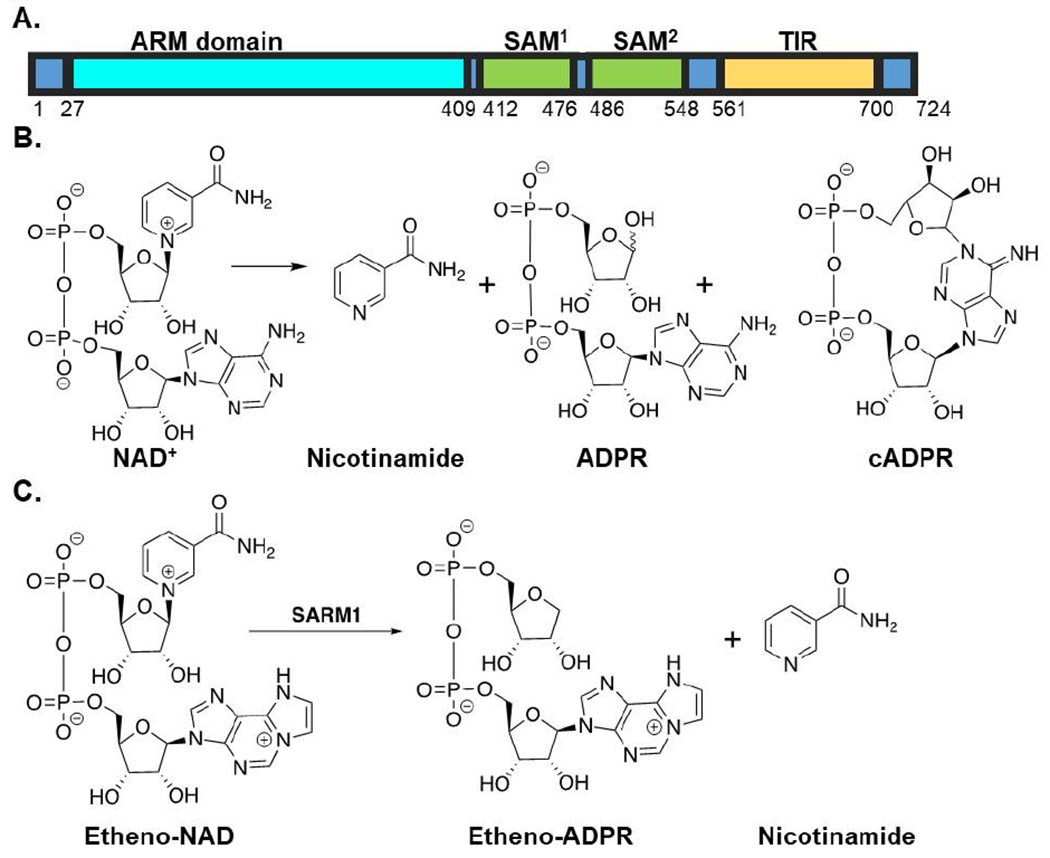
(A) Domain architecture of SARM1. (B) SARM1-mediated NAD+ hydrolase reaction. (C) Fluorescent assay applied in high–throughput screening efforts.
In cells and tissues, SARM1 activity is increased in response to injury or disease, leading to the depletion of NAD+ and degeneration of the distal axonal segment.16 Like SARM1 knockdown, NAD+ supplementation or the expression of nicotinamide mononucleotide adenylyl transferase 1 (NMNAT1), nicotinamide phosphoribosyltransferase (NAMPT), or nicotinamide riboside kinase (NRK) – which all result in increased NAD+ levels – is axoprotective, indicating that inhibitors targeting the NAD+ hydrolase activity of SARM1 will be efficacious in treating these disease types.10, 17, 18
To identify SARM1 inhibitors, we performed a high throughput screen using a previously reported assay that monitors the hydrolysis of etheno–NAD+ (ENAD).15 ENAD is an effective substrate analog (Km = 35 ± 15 μM, kcat = 0.05 ± 0.04 s−1 and kcat/Km = 1500 ± 400 M−1s−1) that fluoresces upon the release of nicotinamide.15 To provide proof–of–concept for this approach, we screened the Microsource US and International Drug Collection, which includes 1,280 compounds that have been clinically approved by the FDA. From these efforts, we identified berberine chloride and zinc chloride as micromolar inhibitors of SARM1. Importantly, these compounds are noncompetitive inhibitors, suggesting the existence of an allosteric binding pocket that can be targeted for further therapeutic development.
RESULTS AND DISCUSSION
Optimization of Fluorescent Assay for High–Throughput Screening.
To identify SARM1 inhibitors, we applied a previously described fluorescent assay that monitors the hydrolysis of ENAD, an NAD+ analog, to form EADPR and nicotinamide (Figure 1C).15 The release of nicotinamide, relieves internal quenching, which leads to an increase in fluorescence (λex = 330 nm, λem = 405 nm). Using our previously described assay conditions (50 mM NaH2PO4 pH 8.0 with 50 mM NaCl and 300 nM of the SARM1 TIR domain), we first miniaturized the assay 3–fold (from 60 μL to 20 μL) to conserve reagents. Next, we identified an ENAD concentration that provides a high signal: noise ratio but minimizes competition for the active site. For these studies, the fluorescence over time was monitored at several concentrations of ENAD (50, 75, and 100 μM) (Figure 2A). The resulting progress curves were linear for the first 60 min and showed a small concentration-dependent increase in activity. Based on this data, we opted to perform the assay at 75 μM ENAD as this concentration (~2.1x Km) provides an excellent signal: noise ratio and near ideal conditions to identify inhibitors that bind the active site. Since inhibitor stocks are dissolved in DMSO, we next evaluated the effect of DMSO on assay performance. For these studies, DMSO was added to the reaction mixture from 0 – 5% final concentration. Under all conditions, the reaction rates are nearly identical, indicating that DMSO does not materially impact assay performance (Figure 2B).
Figure 2. Optimization of Assay for High–Throughput Screening.
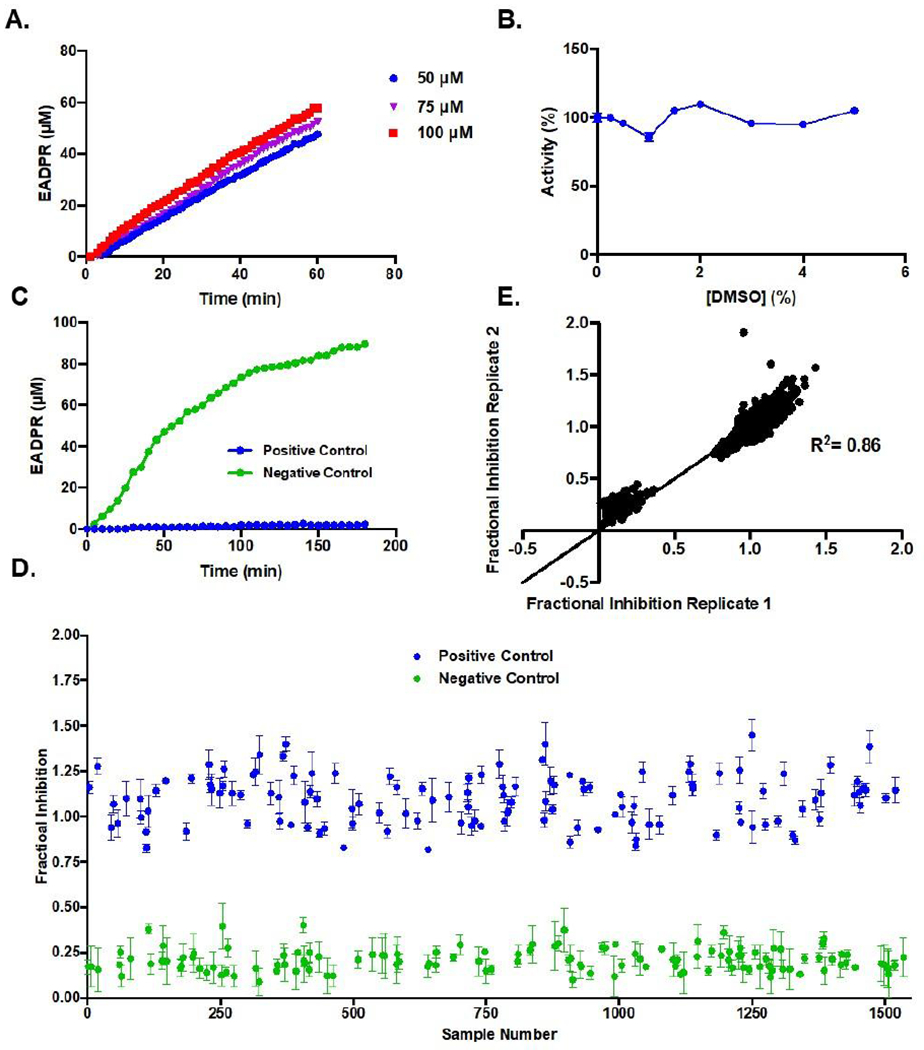
(A) Progress curves of EADPR produced over time at 50, 75, or 100 μM ENAD and 300 nM SARM1 TIR domain. (B) Effect of 0–5% DMSO on activity. (C) Progress curve showing an increase in EADPR over 3 h for positive and negative controls in miniaturized assay format (D) Random well scatter plot of positive and negative controls. (E) Correlation plot of controls.
Using our optimized assay conditions, we next sought to establish the dynamic range of the assay, and evaluate reproducibility and separation between positive and negative controls. For these studies, we used ZnCl2, a known SARM1 inhibitor,15 as a positive control and buffer alone as a negative (i.e., no inhibition) control. The controls were pre–incubated with the SARM1 TIR domain for 20 min to mimic the pre–incubation step that would occur during the screen. The reaction was then initiated by the addition of ENAD (75 μM final). A pre–incubation step was included to maximize the hit rate by providing a window of time for covalent or slow binding compounds to interact with SARM1 before introducing competition with the substrate. The fluorescence of the controls (16 each/plate) on the 3 plates was recorded on 3 different days for multiple time points (1 h, 2 h and 3 h). A representative time course is shown in Figure 2C. The EADPR produced over time remains linear until 1 h, after which it begins to plateau. As a result, time points for the high–throughput screen were taken at 1 h. A random–well scatter plot shows clear separation between the positive and negative controls (Figure 2D), demonstrating the robustness of the assay. Correlation plots further demonstrate that the assay shows sufficient reproducibility between plates with clustering of controls at the high and low ends of the linear fit (Figure 2E). The Z score, which is a statistical measurement of assay reproducibility, was 0.52, indicating sufficient reproducibility to proceed with the high–throughput screen.
High–Throughput Screen.
Having optimized the assay, we next screened the Microsource US and International Drug Collection. This validation library consists of 1,280 compounds approved by either the FDA or marketed in Europe or Asia. The screen was performed at 25 μM in triplicate. Note that we performed the screen with the SARM1 TIR domain in lysates because: (1) the SARM1 TIR domain is highly active in lysates whereas the purified enzyme is at least 800–fold less active;15 and (2) we reasoned that the complex nature of a cell lysate provides greater competition to select against promiscuous inhibitors and is in fact more representative of the cellular milieu. By this nature, we expected to identify inhibitors that show greater selectivity for SARM1.
The screen was performed as described above, with ZnCl2 as a positive control and buffer alone as a negative control. Controls and compounds were incubated with the SARM1 TIR domain for 20 min prior to the addition of ENAD to maximize compound–protein interactions. The fluorescence was recorded immediately after substrate addition and again after a 1 h incubation. Fractional inhibition values were then calculated and used to generate a random well scatter plot. As depicted in Figure 3A, there is clear separation between the positive and negative controls. The Z scores for all plates were > 0.5, with an average Z score of 0.61 (Figure 3B), indicating sufficient reproducibility and high confidence in hit identification. Comparison of two replicates for the same FDA source plate demonstrates high reproducibility of the assay for hit identification (R2 = 0.86) (Figure 3C).
Figure 3. Microsource US and International Drug Collection Compound Screen.
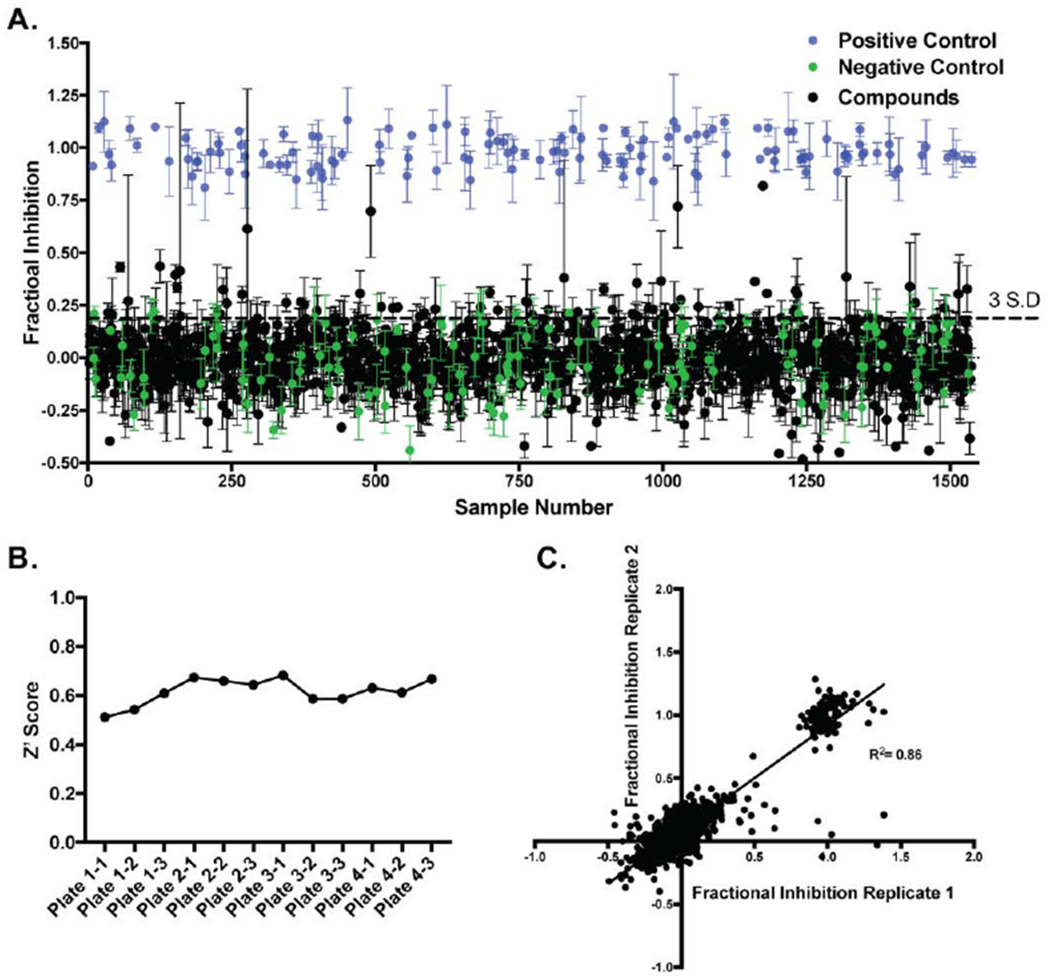
(A) High–throughput screen of the Microsource US and International Drug Collection, which contains 1,280 FDA–approved compounds, at 25 μM in triplicate. (B) Z’ Scores for the different plates. (C) Correlation between two replicate plates including controls.
Prioritization of Hits.
Based on percent inhibition, five inhibitors were selected for dose response studies (Table 1). These compounds, which were obtained from a secondary source (Sigma Aldrich), include pyrithone zinc with 72% inhibition, berberine chloride with 70% inhibition, phenazopyridine hydrochloride with 44% inhibition, nitroflurazone with 27% inhibition, and doxycycline hydrochloride with 26% inhibition. To evaluate the dose response, the inhibitors were varied from 0 – 200 μM at 50 μM ENAD and resulting IC50 values ranged from 20 μM for pyrithone zinc to 145 μM for both phenazopyridine hydrochloride and doxycycline (Table 1 and Figure 4).
Table 1.
Comparison of Inhibitor Potencya
| Percent Inhibition from Primary | IC50 (μM)a | Ki (μM)a | Inhibition Mechanisma | |
|---|---|---|---|---|
| Nitroflurazone | 27 | 90 ± 10 | 120 ± 20 | Noncompetitive |
| Phenazopyridine Hydrochloride | 44 | 145 ± 2 | 70 ± 10 | Competitive |
| Doxycycline Hydrochloride | 26 | 145 ± 2 | 280 ± 40 | Noncompetitive |
| Berberine Chloride | 70 | 140 ± 20 | 130 ± 10 | Noncompetitive |
| Pyrithone Zinc | 72 | 20 ± 2 | 15 ± 2 | Noncompetitive |
| Zinc Chloride | NA | 10 ± 1 | 3.3 ± 0.1 | Noncompetitive |
Values determined using bacterially expressed SARM1 TIR domain lysates.
Figure 4. Prioritization of Hits from FDA approved compound screen.

Dose responses of compounds identified from the high–throughput screen were obtained with bacterially expressed SARM1 TIR domain lysates (A) Nitroflurazone, (B) Phenazopyridine hydrochloride (C) Doxycycline hydrochloride, (D) Berberine chloride, and (E) Pyrithone Zinc.
The identification of berberine chloride was particularly interesting as this compound is extracted from a Chinese herb that has been used extensively to treat neurodegenerative diseases, including Alzheimer’s disease, Parkinson’s Disease, and traumatic brain injury.19–21 Our findings suggest that the beneficial effects of berberine chloride in these disease contexts could be in part through SARM1. Also, of note is the observation that pyrithone zinc, the active ingredient in drandruff shampoo, is a potent SARM1 inhibitor. The fact that the IC50 values for pyrithone zinc and ZnCl2 are similar (20 ± 2 μM vs. 10 ± 3 μM),15 suggests that they could act via a similar mechanism, but that the coordination complex is somehow dampening the inhibitory effects (Figure 4).
Determination of Mechanism of Inhibition.
Having confirmed that these five compounds inhibit SARM1, we next determined their inhibition mechanisms with the TIR domain (Figure 5, Table 1). For these studies, ENAD (0 – 400 μM) was varied at different concentrations of inhibitor. For nitroflurazone (0, 100, and 200 μM), a noncompetitive inhibition pattern was observed with a Ki of 120 ± 20 μM (Figure 5A). By contrast, phenazopyridine hydrochloride (0, 50, 100, and 200 μM) yielded a competitive inhibition pattern with a Ki of 70 ± 10 μM, indicating that phenazopyridine hydrochloride competes with ENAD for the active site of SARM1 (Figure 5B). Both doxycycline hydrochloride (0, 50, 100, and 200 μM) and berberine chloride (0, 50, 100, and 200 μM) yielded noncompetitive inhibition patterns with Ki values of 280 ± 40 μM and 130 ± 10 μM, respectively (Figure 5C–D). Inhibition by pyrithone zinc was also noncompetitive with a Ki of 15 ± 2 μM (Figure 6E). Notably, zinc shows a clear noncompetitive inhibition pattern with aKi of 3.3 ± 0.1 μM.15 This data suggests that inhibition with pyrithone zinc is similar to zinc alone.
Figure 5. Mechanism of Inhibition.
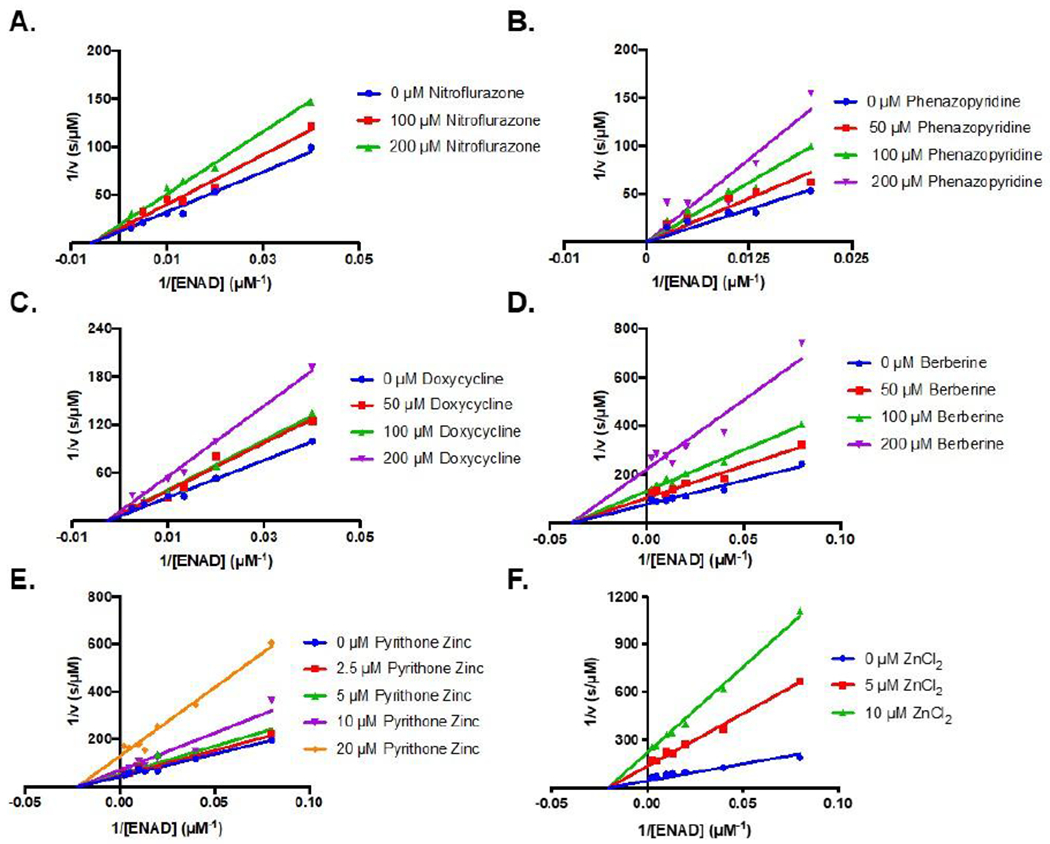
Lineweaver Burk plots of prioritized hits (A) Nitroflurazone, 0 – 200 μM, (B) Phenazopyridine hydrochloride, 0 – 200 μM, (C) Doxycycline hydrochloride 0 – 200 μM, (D) Berberine chloride 0 – 200 μM, (E) Pyrithone Zinc 0–20 μM, and (F) ZiCl2 0 – 10 μM. ENAD concentration was varied between 0 – 400 μM. Data were obtained with bacterially expressed SARM1 TIR domain lysates.
Figure 6. Inhibition of SARM1 by Berberine Chloride and Zinc Chloride.

(A) Dose responses for Berberine chloride with bacterially expressed TIR domain lysate, bacterially expressed SAM1-2TIR lysate, SAM1-2TIR in Expi293 lysate, and purified TIR domain. (B) Dose responses for ZnCl2 with TIR domain in bacterial lysates compared to purified TIR domain. (C) LC-MS time course of purified SARM1 TIR domain (20 μM) treated with 100 μM NAD+ without and with ZnCl2 (10 μM). ADPR, cADPR, and nicotinamide standards are shown (100 μM). (D) Peak area ratio of ADPR to cADPR for a series of three replicates in the absence and presence of ZnCl2 (E) Structure of the SARM1 TIR domain with C629 and C635 residues highlighted in blue (PDBID: 6o0q). (F) Activity of purified SARM1 TIR domain wildtype, C629A, and C635A (20 μM) with 1 mM ENAD.
Further characterization of Select SARM1 Inhibitors.
To confirm that berberine chloride is a bonafide SARM1 inhibitor, we evaluated its ability to inhibit SAM1-2TIR domain constructs expressed in either bacteria or mammalian Expi293 cells. With these constructs, IC50 values of 110 ± 10 μM and 77 ± 5 μM, respectively, were obtained (Figure 6, Table 2). Notably, these values are nearly identical to those obtained for the bacterially expressed TIR domain as well as the purified TIR domain where an IC50 value of 140 ± 20 μM was obtained (Figure 6, Table 2). We also determined whether zinc chloride could inhibit pure TIR domain. Notably, zinc inhibits pure enzyme with a similar IC50 value of 10 ± 1 μM (Figure 6, Table 2). In total, these data confirm that berberine chloride and zinc are bonafide SARM1 inhibitors.
Table 2.
IC50 values for Berberine chloride and Zinc chloride obtained using different constructs and expression systems
| IC50 (μM) | ||||
|---|---|---|---|---|
| Expression construct | Bacterial Lysate TIR domaina | Bacterial Lysate SAM1-2TIRb | Expi293 Lysate SAM1-2TIRc | Pure TIR domaind |
| Berberine Chloride | 140 ± 20 | 110 ± 10 | 77 ± 5 | 140 ± 30 |
| Zinc Chloride | 10 ± 3 | N.D. | N.D. | 10 ± 1 |
Experiments were performed with bacterially expressed TIR domain (300 nM) lysates and 50 μM ENAD.
Experiments were performed with bacterially expressed SAM1-2TIR domain (300nM) lysates and 50 μM ENAD.
Experiments were performed with mammalian Expi293 lysates expressing SAM1-2TIR domain (300 nM) and 50 μM ENAD.
Experiments were performed with purified TIR domain (20 μM) and 500 μM ENAD.
We next evaluated product formation using an LC-MS based assay that readily detects the formation of nicotinamide, ADPR, and cADPR (Figure 6C). Notably, the latter two species are formed at a ratio of approximately 20:1 (Figure 6D). In the presence of zinc, a slight decrease in the ADPRcADPR ratio was observed, but this decrease was not statistically significant (P value > 0.05), indicating that zinc does not significantly alter the ratio of products formed (Figure 6D). We next sought to investigate how zinc chloride inhibits SARM1. Given that zinc is thiophillic and the SARM1 specific (SS) loop is thought to be important for enzymatic activity,15, 22 we hypothesized that zinc binding to C629 and/or C635 in the SS loop could be responsible for the inhibitory effects of this metal ion. To investigate this possibility, we first generated the C629A and C635A mutants by site–directed mutagenesis and then evaluated their NAD+ hydrolase activity (Figure 6E). We found that both the C629A and C635A mutants were inactive under the conditions tested for wild type SARM1 (20 μM at 1 mM ENAD), indicating that they are critical for enzymatic activity. Given the lack of discernible activity, it was not possible to directly evaluate zinc inhibition of either mutant. Nonetheless, their critical role in catalysis strongly suggest that these residues also play a role in zinc coordination and inhibition.
CONCLUSIONS
This work describes the first HTS platform to identify inhibitors targeting SARM1. From a screen of the Microsource FDA approved compound library, we identified several micromolar SARM1 inhibitors including phenazopyridine hydrochloride, which acts as a competitive inhibitor. The structural similarity of the pyridine group in phenazopyridine hydrochloride with the nicotinamide moiety of NAD+, potentially enables the inhibitor to compete with NAD+ for the active site by mimicking this feature. This finding further suggests that pyridine mimetics may be promising SARM1 inhibitors and worthy of further investigation. In addition to this competitive inhibitor, we also identified several micromolar SARM1 inhibitors that exhibit noncompetitive modes of inhibition. These inhibitors include doxycycline hydrochloride, nitroflurazone, and most notably, berberine chloride and zinc. The identification of berberine chloride is particularly interesting given the extensive history of using this inhibitor for the treatment of diseases associated with neurodegeneration.
The discovery that Zn2+ acts as a low micromolar inhibitor of SARM1 is especially noteworthy. First from a technical standpoint, inhibition by zinc indicates that it is important to avoid zinc contamination in SARM1 preparations. Second, since SARM1 is a single substrate enzyme, the fact that zinc (and other compounds) act noncompetitively suggests the existence of an allosteric binding pocket on SARM1 that could be targeted for future therapeutic development. Finally, the observation that zinc and other thiophilic metals inhibit SARM115 indicates that one or more cysteines are important for enzyme activity and that they could be targeted to develop an irreversible SARM1 inhibitor. Interestingly, cysteines 629 and 635 are present in the SARM1 specific loop that is thought to endow SARM1 with its ability to hydrolyze NAD+. We found that C629A and C635A mutants lack any discernible NAD+ hydrolase activity, indicating that these residues are essential for catalysis and that zinc inhibition could be due to the metal ion coordinating to SARM1 at these residues.
In addition to identifying micromolar SARM1 inhibitors, we also established an HTS pipeline that can be applied for the identification of additional compounds. Given the strong links between SARM1 activation and diseases such as traumatic brain injury and peripheral neuropathy, we expect that this screening pipeline will prove useful in facilitating therapeutic development for these diseases.11, 12 The identification of potent SARM1 inhibitors could ultimately ameliorate the morbidity and mortality associated with neurodegenerative diseases, bolstering the importance of continued inhibitor screening efforts.
METHODS
Key Resources and Expression Constructs.
The protein used in this study, SARM1, is listed in Table 3. Key reagents and resources are listed in Table 4. Bacterial expression constructs encoding both the SAM1–2TIR domains (residues 412 – 724) and the TIR domain (residues 561 – 724) were generated previously15 and are listed in Table 4. For this work, a mammalian expression construct encoding both the SAM and TIR domains (SAM1–2TIR, residues 412 – 724) was also generated. To assemble this construct, the corresponding DNA sequence from a non–codon optimized SARM1 construct was amplified by PCR. The forward and reverse primers, which include BamHl and Xhol cut sites (IDT, 0.5 μM final; Table 4), were combined with template DNA (2 ng/μL) and 1 x NEBNext® Master Mix, which contains the Q5 high fidelity polymerase, deoxynucleotides, and 2 mM MgCl2. The insert DNA was amplified according to the following PCR protocol: (1) initial denaturation at 98 °C for 1 min, (2) denaturation at 98 °C for 30 s, (3) annealing at 54 – 56 °C for 45 s, (4) extension at 68 °C for 1 min and (5) final extension at 68 °C for 5 min. Steps 2–4 were repeated 30 times. The PCR products were purified (Qiagen QIAquick PCR Purification Kit) and digested with 40 units of BamHl and Xhol (NEB) in outsmart buffer for 1 h at 37 °C. The pcDNA3.1 (Hygro+) vector was treated similarly. DNA fragments were separated by agarose gel electrophoresis and DNA bands extracted (Qiagen Gel Extraction Kit). The PCR products were phosphorylated with T4 PNK (NEB) and then ligated into the pcDNA3. l(Hygro+) vector at 1:3 and 1:10 molar ratios of vector: insert at 16 °C overnight. The correct DNA sequence was confirmed by Sanger sequencing (Genewiz) using T7 and BGHR primers to sequence the entire gene.
Table 3.
Protein of Interest
| Protein | Uniprot ID | Link |
|---|---|---|
| SARM1 | Q6SZW1 | https://www.uniprot.org/uniprot/Q6SZW1 |
Table 4:
Key Resources1.
| Reagent or Resource | Source | Identifier | |
|---|---|---|---|
| 4-Chloronicotinamide | Matrix Scientific | 7418-70-4 | |
| 96-well Half Area Black Flat Bottom Polystrene NBS™ plate | Corning® | 3993 | |
| ADPR | Sigma Aldrich | A0752 | |
| ADPR cyclase | Sigma Aldrich | A9106, C7344 | |
| Berberine chloride | Sigma Aldrich | B-3251; PHR1502 | |
| C43 (DE3) | Sigma Aldrich | CMC0019 | |
| cADPR | Sigma Aldrich | C7344 | |
| Doxycycline hydrochloride | Sigma Aldrich | D3447 | |
| Kanamycin | Research Products International | 25389-94-0 | |
| Lysozyme | Sigma Aldrich | L6876 | |
| Nicotinamide | Sigma Aldrich | 72340 | |
| Nicotinamide 1,N6-ethenoadenine dinucleotide | Sigma Aldrich | N2630 | |
| Nitroflurazone | Sigma Aldrich | PHR1196 | |
| Phenazopyridine hydrochloride | Sigma Aldrich | 34076 | |
| Pierce™ EDTA-free protease inhibitor tablets | Thermo Fisher Scientific | A32955 | |
| Pyrithone zinc | Sigma Aldrich | PHR1401 | |
| Streptacin XT | IB A Life Sciences | 2-4010-025 | |
| Streptavidin Antibody | LI-COR Biosciences IR Dye 680RD | 976-68079 Lot #C60504-02 | |
| Talon Metal Affinity Resin | Takara | #635503 | |
| Halt Protease Inhibitor Cocktail | Thermo Fisher Scientific | 78429 | |
| Constructs | |||
| pET30a+ Strep-SAM1-2 TIR | 15 | ||
| pET30a+ Strep-TIR | 15 | ||
| Mammalian Flag-SAM1-2TIR For | IDT | CAGGATCCACCATGGACTACAAGGACGACGACGACAAGTGGAAGGAGGCCGAGGTTCAGACGTGGCTG | |
| Mammalian Flag-SAM1-2TIR Rev | IDT | TTGGAGGGTGCTGCACCCATGGGTCCAACCTAAACCCTCGAGCA | |
| C629A For | IDT | GCGCTGGATAAGGCTATGCAGGACCACGAT | |
| C629A Rev | IDT | CGCGACCTATTCCGATACGTCCTGGTGCTA | |
| C635A For | IDT | ATGCAGGACCACGATGCGAAGGACTGGGTG | |
| C635A Rev | IDT | TACGTCCTGGTGCTACGCTTCCTGACCCAC | |
See Table 2 from 15
Site–Directed Mutagenesis.
To generate the C629A and C635A mutants, the previously generated pET30a+ TIR domain construct was used as a template (Table 4). The plasmid was mutagenized by PCR by combining the forward and reverse primers (Table 4) with template DNA and 1xNEBNext® and following the amplification protocol described above. Site–directed mutagenesis was confirmed by Sanger sequencing (Genewiz).
Bacterial Expression of Recombinant SARM1 and Preparation of Lysate.
Recombinant SARM1 SAM1-2TIR and TIR domain constructs were bacterially expressed and purified as previously described.15 Briefly, chemically competent Escherichia coli C43 (DE3) cells were transformed with constructs encoding the SAM1-2TIR and TIR domains in the pET30a+ vector and grown at 37 °C overnight on Luria broth (LB) plates containing 50 μg/mL kanamycin. Colonies were selected, diluted in 5 mL of LB with 50 μg/mL kanamycin and amplified overnight. The next day, aliquots were combined 1:1 with glycerol and stored at −80 °C for later use. For expression, glycerol stocks were cultured in 5 mL of LB overnight at 37 °C. The next day these starter cultures were diluted 400–fold in LB containing 50 μg/mL kanamycin and grown at 37 °C overnight while shaking at 225 rpm. Once the culture reached an OD600 of 0.8, protein expression was induced via the addition of IPTG (0.5 mM final) and the incubation temperature was reduced to 16 °C for 16–18 h. Cells were then collected by centrifugation at 3,000 x g for 15 min. The supernatant was discarded and the pellet was resuspended in Lysis Buffer (100 mM Na3PO4 pH 8.0, 200 mM NaCl, 10 % glycerol, 0.01% Tween 20) supplemented with Pierce™ EDTA–free protease inhibitor tablets (Thermo Scientific). The cells were incubated with lysozyme (100 μg/mL) for 10 min on ice and then lysed by sonication (amplitude of 30 for 30 s oscillating for 1 s on and 1 s off for a series of 12 replicates) using a Fisher Scientific Sonic Dismembrator sonicator (FB–705). For experiments using bacterial lysates, purification was stopped at this point and the lysate stored at −80°C.
Determination of SARM1 Concentration in Lysates.
The concentration of SARM1 in the lysates was determined by quantitative western blotting as previously described.15 Briefly, serial dilutions of purified TIR domain protein (0 – 2 μM) were separated by SDS–PAGE along with lysate samples (1: 40 dilutions in duplicate). Next, proteins were transferred to nitrocellulose for western blotting. Protein was detected using a Streptavidin antibody (Table 2), which recognizes the N–terminal strep–tag. Band intensities were quantified (Licor) and used to generate standard curves, which were then applied to establish the concentration of SARM1 in the lysates.
Recombinant SARM1 Purification from Bacterial Expression.
Bacterial lysates were clarified at 15,000 x g for 30 min at 4 °C. The supernatant was applied to a Streptacin XT high capacity resin (IBA Life Sciences). The resin was then washed with Wash Buffer (50 mM HEPES pH 8.0 with 500 mM NaCl) and subsequently, the protein was eluted from the beads with Elution Buffer (50 mM HEPES pH 8.0, 500 mM NaCl and 50 mM Biotin). The eluent was then concentrated to 2 mL and injected on to a HiLoad Superdec SUP75 (or SUP200) size exclusion column for further purification using 50 mM HEPES pH 8.0 and 150 mM NaCl as the running buffer. Pure protein was then concentrated by centrifugation at 4,500 x g using Amicon centrifugal filters. The concentration of purified protein was determined using the Bradford assay.
Transfection of SARM1 into Mammalian Cells and Preparation of Lysate.
The pcDNA3.1 (Hygro+) SAM1-2TIR construct was used to transfect mammalian Expi293™ cells. Briefly, Expi293™ cells were diluted to 3 * 106 cells/mL with fresh Expi293™ Expression Medium. The pcDNA3.1 SAM1-2TIR DNA construct was combined with ExpiFectamine™ 293 in Opti–MEM™ I Reduced Serum Medium prior to addition to cells (1 μg/mL final). Cells were incubated on an orbital shaker at 37 °C in a humidified environment with 8% CO2 for ~24 h. ExpiFectamine™ 293 Transfection Enhancer 1 and 2 were then added to the media and the cells were further incubated for 48 h at 37 °C. Cells were then pelleted by centrifugation at 1,050 x g for 5 min, resuspended in 1x PBS with protease inhibitors (Halt), and lysed by sonication (amplitude of 6 for 10 s on and 10 s off for a series of 5 replicates). The lysate was clarified by centrifugation at 15,000 x g for 30 min at 4 °C and the presence of SARM1 was confirmed by western blot. This lysate was stored at −80 °C and thawed for further experiments where specified.
Initial Optimization of High Throughput Inhibitor Screen.
Miniaturization and Optimization ofENAD Concentration.
The ENAD assay was first miniaturized to a 20 μL reaction volume in 384–well format from the original 60 μL reaction volume in 96–well plates.15 To validate these conditions, we used bacterial lysates generated from cells expressing the SARM1 TIR domain. Briefly, lysate was added to Reaction Buffer (50 mM NaH2PO4 pH 8.0 with 50 mM NaCl), such that the concentration of the TIR domain was 600 nM in 10 μL. The enzyme was pre-incubated with an additional 2 μL of buffer for 20 min at RT to mimic incubation with 10x inhibitors. Next, the reaction was initiated by the addition of several ENAD concentrations (50, 75, 100, and 200 μM, 8 μL). Etheno–ADPR (EADPR) production was monitored by florescence (λex= 330 nm, λem= 405 nm) at 15 s intervals for 1 h using a PerkinElmer EnVision 2104 Multilabel Reader.
Effect of DMSO on Activity.
To assess the effect of DMSO on assay performance, SARM1 TIR (600 nM in 10 μL) was incubated with increasing concentrations of DMSO (0.5 – 5 % final, 2 μL) in Reaction Buffer. After a 20 min pre–incubation, the reaction was initiated by the addition of ENAD (75 μM final, 8 μL) and the fluorescence (λex = 330 nm, λem= 405 nm) was monitored as described above. The fluorescent signal was converted into molarity by generating a standard curve. Briefly, fixed concentrations of ENAD (0–400 μM) were treated with excess ADP–ribosyl cyclase (Sigma Aldrich #A9106) and the reaction allowed to go to completion as evidenced by a plateau in the fluorescence over time graph. The peak fluorescence intensities at each EADPR concentration were plotted against EADPR concentration to establish a standard curve.
Reproducibility of Controls.
To assess reproducibility and separation between controls, we used ZnCl2, a known SARM1 inhibitor, as a positive control and buffer as a negative control.15 A single–channel liquid handler (Microflo Microplate Dispenser) was first used to dispense SARM1 (600 nM in 10 μL, 300 nM final) into black 384–well plates. Then, either ZnCl2 (2 mM final, 2 μL) or Reaction Buffer (2 μL) were added to the plate using a multi–channel liquid handler (Beckman Coulter Flying Reagent Dispenser). These assays were pre–incubated for 20 min at RT, at which point the single–channel liquid handler was used to dispense ENAD (75 μM final, 8 μL) for a final reaction volume of 20 pL and mix the contents via an S-formation shake for 10 s. EADPR formation was monitored via fluorescence (λex = 330 nm, λem= 405 nm) at 1 h, 2 h, and 3 h. The fluorescent signal was converted to molarity using an EADPR standard curve. This assay was repeated on three independent days on three separate plates. Positive and negative controls were run in 16 replicates on each end of the plate (total of 32) and Z scores were then calculated at each time point using equation 1,
| (1), |
where μ is the mean and σ is the standard deviation.
High–Throughput Screen.
Having optimized the assay conditions, we then screened 1,280 FDA–approved compounds in triplicate (Microsource US and International Drug Collection). As above, the bacterial cell lysate containing SARM1 TIR was diluted to 600 nM using Reaction Buffer. This SARM1 TIR lysate (300 nM final) was then dispensed into black 384–well plates using the single–channel liquid handler. Next, the multi–channel liquid handler was used to add inhibitors (25 μM final, 2μL), buffer (2 μL) or ZnCl2 (2 mM final, 2 μL). The reaction mixtures were incubated at RT for 20 min, at which point, the single–channel liquid handler was used to add ENAD (75 μM final, 8 μL) and mix the solution in an S–formation shake for 10 s. Fluorescence readings (λex = 330 nm, λem = 405 nm) were taken immediately post–substrate addition and after a 1 h incubation at RT. Initial readings were used to blank the final fluorescent readings and fractional inhibition values calculated. For ease of analysis, the fractional inhibition with the positive control, ZnCl2, was set at 1 and the negative control was set at 0. Therefore, the calculated fractional inhibition for the compounds falls between 0 and 1. The fractional inhibition of the controls and compounds were then plotted on a randomized-well activity scatter plot using GraphPad Prism Software.
Prioritization of Hits.
Compound response curves were generated using the fluorescent ENAD assay. Briefly, SARM1 TIR domain lysate was used at a working concentration of 300 nM in Reaction Buffer and inhibitors were independently varied from 0–100 μM. The solutions were incubated at RT for 20 min prior to initiation of the reaction with ENAD (50 μM final). The formation of EADPR was then monitored via fluorescence (λex = 330 nm, λem = 405 nm) at 15 s intervals for 15 min as described above. The data were converted to velocity and then normalized to the activity without inhibitor. IC50 values were calculated by fitting the normalized inhibition data to equation 2,
| (2), |
in GraphPad prism. [I] is the concentration of inhibitor, IC50 is concentration of the inhibitor at half the maximum enzymatic activity, and fractional activity of SARM1 is the percent activity at the respective inhibitor concentration.
Dose response studies were also performed for bacterially expressed and mammalian expressed SAM1-2TIR and purified bacterially expressed TIR domain. For these experiments, bacterially expressed SAM1-2TIR (300 nM final), mammalian expressed SAM1-2TIR (300 nM final), and purified TIR domain (20 μM final) were incubated with various concentrations of berberine chloride (0 – 500 μM). Purified TIR domain (20 μM) was also treated with various concentrations of zinc chloride (0 – 20 μM). The reactions were performed in Reaction Buffer (60 μL final reaction volume) and the solutions were incubated at RT for 20 min prior to initiating the reaction with ENAD (50 μM final for lysates, 500 μM final for purified protein). Formation of EADPR over time was measured at 15 s intervals for 1 h as described above. The data were converted to velocity as described above and then normalized to the activity without inhibitor. IC50 values were calculated by fitting the normalized inhibition data to equation 2 in GraphPad Prism.
Determination of Mechanism of Inhibition.
The specific mechanism of inhibition was also determined. For these studies, inhibitors were independently varied as follows: berberine chloride (0, 50, 100, and 200 μM final), nitroflurazone (0, 100, and 200 μM final), phenazopyridine hydrochloride (0, 50, 100, and 200 μM final), doxycycline hydrochloride (0,50, 100, and 200 μM final), pyrithone zinc (0, 2.5, 5, 10, and 20 μM final) and zinc (0, 5, and 10 μM final). For these assays, SARM1 TIR domain (300 nM) lysates were incubated with inhibitor for 20 min at RT. Reactions were then initiated by the addition of ENAD (0 – 400 μM final) and EADPR formation was monitored at 15 s intervals for 1 h as described above. The initial velocities were compiled to produce Michaelis Menten curves at each inhibitor concentration and fit to equations for competitive (eq 3), noncompetitive (eq 4), and uncompetitive inhibition (eq 5),
| (3), |
| (4), |
| (5), |
using GraphPad Prism. is the intercept Kii and Ki is the slope Ki. The best fits were determined on the basis of a combination of visual and quantitative analysis.
LC–MS based assay.
ADPR, cADPR, and nicotinamide standards were prepared at 100 μM in Reaction Buffer. Purified SARM1 TIR domain (20 μM) was treated with 100 μM NAD+ in Reaction Buffer for 3 h at room temperature alone or with ZnCl2 (10 μM) in triplicate. Samples (10 μL) were injected onto an InfinityLab Poroshell 120 EC-18 column (4.6 x 50 mm, 2.7 mircron, Agilent #699975–902T) at a flow rate of 0.4 mL/min. Metabolites were eluted with a gradient of 100% H2O with 0.01% formic acid from 0 to 6 min, 90% H2O with 0.01% formic acid and 10% acetonitrile with 0.1% formic acid from 12 to 14 min, and then 100% H2O with 0.01% formic acid from 14 to 20 min. The metabolites were detected with a quadrupole mass spectrometer (Agilent, G6120B single quad, ESI source, 1260 Infinity HPLC) in the positive ion mode. The absorbance at 254 nm was plotted over time for the standards, SARM1 treated with NAD+, and SARM1 treated with NAD+ and zinc chloride. Peak area ratios for ADPR to cADPR were quantified and plotted in GraphPad Prism. A student’s t–test was performed for the ADPR to cADPR peak area ratios in the presence and absence of zinc chloride (P value = 0.4).
Evaluation of Mutants.
Purified wildtype, C629A, and C635A SARM1 TIR domain were independently incubated at 20 μM with 1 mM ENAD in Reaction Buffer. Formation of EADPR over time was measured at 15 s intervals for 2 h as described above. The data were converted to velocity as described above and plotted in GraphPad Prism.
Acknowledgments
Funding Sources
This work was supported by in part by institutional funds provided by the University of Massachusetts Medical School, NIH grant R35 GM118112 (P.R.T.), and F31NS108610 (H.S.L.).
Footnotes
Publisher's Disclaimer: This is a PDF file of an unedited manuscript that has been accepted for publication. As a service to our customers we are providing this early version of the manuscript. The manuscript will undergo copyediting, typesetting, and review of the resulting proof before it is published in its final form. Please note that during the production process errors may be discovered which could affect the content, and all legal disclaimers that apply to the journal pertain.
Declaration of interests
The authors declare that they have no known competing financial interests or personal relationships that could have appeared to influence the work reported in this paper.
References:
- (1).Lilienfeld DE, and Perl DP (1993) Projected neurodegenerative disease mortality in the United States, 1990-2040, Neuroepidemiology 12, 219–228. [DOI] [PubMed] [Google Scholar]
- (2).Prince MJ, Wu F, Guo Y, Gutierrez Robledo LM, O’Donnell M, Sullivan R, and Yusuf S (2015) The burden of disease in older people and implications for health policy and practice, Lancet 385, 549–562. [DOI] [PubMed] [Google Scholar]
- (3).Low JA, Pang WS, Chan DK, and Chye R (2003) A palliative care approach to end-stage neurodegenerative conditions, Ann Acad Med Singapore 32, 778–784. [PubMed] [Google Scholar]
- (4).Loring HS, and Thompson PR (2019) Emergence of SARM1 as a Potential Therapeutic Target for Wallerian-type Diseases, Cell Chem Biol. [DOI] [PMC free article] [PubMed] [Google Scholar]
- (5).Lunn ER, Perry VH, Brown MC, Rosen H, and Gordon S (1989) Absence of Wallerian Degeneration does not Hinder Regeneration in Peripheral Nerve, Eur J Neurosci 1, 27–33. [DOI] [PubMed] [Google Scholar]
- (6).Fox GB, and Faden AI (1998) Traumatic brain injury causes delayed motor and cognitive impairment in a mutant mouse strain known to exhibit delayed Wallerian degeneration, J Neurosci Res 53, 718–727. [DOI] [PubMed] [Google Scholar]
- (7).Wang MS, Davis AA, Culver DG, and Glass JD (2002) WldS mice are resistant to paclitaxel (taxol) neuropathy, Ann Neurol 52, 442–447. [DOI] [PubMed] [Google Scholar]
- (8).Osterloh JM, Yang J, Rooney TM, Fox AN, Adalbert R, Powell EH, Sheehan AE, Avery MA, Hackett R, Logan MA, MacDonald JM, Ziegenfuss JS, Milde S, Hou YJ, Nathan C, Ding A, Brown RH Jr., Conforti L, Coleman M, Tessier-Lavigne M, Zuchner S, and Freeman MR (2012) dSarm/Sarm1 is required for activation of an injury-induced axon death pathway, Science 337, 481–484. [DOI] [PMC free article] [PubMed] [Google Scholar]
- (9).Gerdts J, Summers DW, Sasaki Y, DiAntonio A, and Milbrandt J (2013) Sarm1-mediated axon degeneration requires both SAM and TIR interactions, J Neurosci 33, 13569–13580. [DOI] [PMC free article] [PubMed] [Google Scholar]
- (10).Gerdts J, Brace EJ, Sasaki Y, DiAntonio A, and Milbrandt J (2015) SARM1 activation triggers axon degeneration locally via NAD(+) destruction, Science 348, 453–457. [DOI] [PMC free article] [PubMed] [Google Scholar]
- (11).Henninger N, Bouley J, Sikoglu EM, An J, Moore CM, King JA, Bowser R, Freeman MR, and Brown RH Jr. (2016) Attenuated traumatic axonal injury and improved functional outcome after traumatic brain injury in mice lacking Sarm1, Brain 139, 1094–1105. [DOI] [PMC free article] [PubMed] [Google Scholar]
- (12).Geisler S, Doan RA, Strickland A, Huang X, Milbrandt J, and DiAntonio A (2016) Prevention of vincristine-induced peripheral neuropathy by genetic deletion of SARM1 in mice, Brain 139, 3092–3108. [DOI] [PMC free article] [PubMed] [Google Scholar]
- (13).Fernandes KA, Mitchell KL, Patel A, Marola OJ, Shrager P, Zack DJ, Libby RT, and Welsbie DS (2018) Role of SARM1 and DR6 in retinal ganglion cell axonal and somal degeneration following axonal injury, Exp Eye Res 171, 54–61. [DOI] [PMC free article] [PubMed] [Google Scholar]
- (14).Howell GR, Soto I, Libby RT, and John SW (2013) Intrinsic axonal degeneration pathways are critical for glaucomatous damage, Exp Neurol 246, 54–61. [DOI] [PMC free article] [PubMed] [Google Scholar]
- (15).Loring HS, Icso JD, Nemmara VV, and Thompson PR (2020) Initial Kinetic Characterization of Sterile Alpha and Toll/Interleukin Receptor Motif-Containing Protein 1, Biochemistry 59, 933–942. [DOI] [PMC free article] [PubMed] [Google Scholar]
- (16).Essuman K, Summers DW, Sasaki Y, Mao X, DiAntonio A, and Milbrandt J (2017) The SARM1 Toll/Interleukin-1 Receptor Domain Possesses Intrinsic NAD(+) Cleavage Activity that Promotes Pathological Axonal Degeneration, Neuron 93, 1334–1343 e1335. [DOI] [PMC free article] [PubMed] [Google Scholar]
- (17).Sasaki Y, Nakagawa T, Mao X, DiAntonio A, and Milbrandt J (2016) NMNAT1 inhibits axon degeneration via blockade of SARM1-mediated NAD(+) depletion, Elife 5. [DOI] [PMC free article] [PubMed] [Google Scholar]
- (18).Wang JT, Medress ZA, Vargas ME, and Barres BA (2015) Local axonal protection by WldS as revealed by conditional regulation of protein stability, Proc Natl Acad Sci USA 112, 10093–10100. [DOI] [PMC free article] [PubMed] [Google Scholar]
- (19).Huang M, Chen S, Liang Y, and Guo Y (2016) The Role of Berberine in the Multi-Target Treatment of Senile Dementia, Curr Top Med Chem 16, 867–873. [DOI] [PubMed] [Google Scholar]
- (20).Ahmed T, Gilani AU, Abdollahi M, Daglia M, Nabavi SF, andNabavi SM (2015) Berberine and neurodegeneration: A review of literature, Pharmacol Rep 67, 970–979. [DOI] [PubMed] [Google Scholar]
- (21).Durairajan SS, Liu LF, Lu JH, Chen LL, Yuan Q, Chung SK, Huang L, Li XS, Huang JD, and Li M (2012) Berberine ameliorates beta-amyloid pathology, gliosis, and cognitive impairment in an Alzheimer’s disease transgenic mouse model, Neurobiol Aging 33, 2903–2919. [DOI] [PubMed] [Google Scholar]
- (22).Summers DW, Gibson DA, DiAntonio A, and Milbrandt J (2016) SARM1-specific motifs in the TIR domain enable NAD+ loss and regulate injury-induced SARM1 activation, Proc Natl Acad Sci USA 113, E6271–E6280. [DOI] [PMC free article] [PubMed] [Google Scholar]