Abstract
Background
Vascular cognitive impairment and dementia (VCID) and Alzheimer’s disease are predominant diseases among the aging population resulting in decline of various cognitive domains. Diffusion weighted MRI (DW-MRI) has been shown to be a promising aid in the diagnosis of such diseases. However, there are various models of DW-MRI and the interpretation of diffusion metrics depends on the model used in fitting data. Most previous studies are entirely based on parameters calculated from a single diffusion model.
New Method
We employ a data fusion framework wherein diffusion metrics from different models such as diffusion tensor imaging, diffusion kurtosis imaging and constrained spherical deconvolution model are fused using well known blind source separation approach to investigate white matter microstructural changes in population comprising of controls and VCID subgroups. Multiple comparisons between subject groups and prediction analysis using features from individual models and proposed fusion model are carried out to evaluate performance of proposed method.
Results
Diffusion features from individual models successfully distinguished between controls and disease groups, but failed to differentiate between disease groups, whereas fusion approach showed group differences between disease groups too. WM tracts showing significant differences are superior longitudinal fasciculus, anterior thalamic radiation, arcuate fasciculus, optic radiation and corticospinal tract.
Comparison with existing method
ROC analysis showed increased AUC for fusion (AUC=0.913, averaged across groups and tracts) compared to that of uni-model features (AUC=0.77) demonstrating increased sensitivity of proposed method.
Conclusion
Overall our results highlight the benefits of multi-model fusion approach, providing improved sensitivity in discriminating VCID subgroups.
1. Introduction
Vascular cognitive impairment and dementia (VCID) is a category which includes subjects with Alzheimer’s disease (AD), subcortical ischemic vascular disease (SIVD) and mixed dementia (MX). Cognitive decline which is widespread among aging population is caused mainly by dementia [1]. Neurodegenerative diseases such as AD and SIVD are known to be the main contributors of dementia in such a population [2]. Progressive memory loss associated with deficits in other cognitive functions are widely investigated symptoms associated with AD [3]. On the other hand, vascular pathology contributes to cognitive decline in SIVD [4]. The overlapping symptoms in AD and SIVD present a challenge to differential diagnoses based on symptoms. However, the pathogenesis is different in these two conditions. Cerebral small vessel disease exhibiting extensive white matter (WM) damage is the dominant cause behind VCID [5]. Identifying imaging biomarkers to discriminate between VCID subgroups is the focus of this study [6]. While SIVD is reported to have vascular disease associated with large WM lesions, MX possess both AD and vascular pathologies. Diagnosing the right disease subgroup is critical in selecting treatment appropriate for the existing pathology.
Diffusion weighted magnetic resonance imaging (DW-MRI) provides a non-invasive mapping of underlying brain microstructure by quantifying the diffusion of water molecules. Modeling techniques for DW-MRI range from conventional single compartment models to advanced multi-compartment ones. Advanced models aim at either overcoming the limitations of conventional models or to come up with new sensitive quantitative metrics. Diffusion tensor imaging (DTI) assumes Gaussian diffusion and models it with a diffusion tensor [7]. The DTI derived metrics, mean diffusivity (MD), fractional anisotropy (FA), axial diffusivity (AxD) and radial diffusivity (RD) are sensitive to brain pathology [8]. Increased MD and decreased FA implicate axonal loss and demyelination [9]. The limitations of the DTI model include the assumption of Gaussian diffusion and single diffusion orientation in a voxel.
The diffusion kurtosis imaging (DKI) technique is an extension of DTI, with the diffusion being non-Gaussian [10]. Mean kurtosis (MK), axial kurtosis (AK) and radial kurtosis (RK) are the main DKI derived metrics [11]. Though DKI parametric maps look similar to FA maps in terms of intensity patterns, DKI outperforms DTI with higher sensitivity [12]. Another diffusion model is the constrained spherical deconvolution (CSD) model which fits the diffusion weighted signal defined as a convolution product of fiber orientation distribution (FOD) function and single response function of a coherent fiber [13]. This model has the advantage of defining multiple fiber populations with different directions within a voxel. Fiber tracts can be calculated based on the direction of the of the FOD peaks [14]. Fiber specific metrics such as track density imaging and average pathlength maps can be calculated based on CSD model [15, 16].
DTI and DKI techniques have been used previously to study dementia subjects [8, 11, 17]. While DTI studies were based on both regional or whole brain (WB) analysis and structural connectivity analysis, most of DKI works were reported on regional analysis. In DTI studies, MD, FA and RD were demonstrated to show regional and whole brain differences between VCID and controls [18, 19]. Connectivity based analysis showed reductions in specific WM fiber tracts [20–23]. The WM tracts shown to be affected varied across these studies. On the other hand, in DKI studies, reduced values of MK and RK were reported in WM regions clinically related to axonal loss. These studies also demonstrated increased sensitivity of DKI metrics in probing WM integrity compared to DTI [24, 25]. Altered values of DTI and DKI metrics have been correlated to cognitive decline in VCID [25–27]. In AD, diffusion metrics were significantly correlated with a decline of memory function, while in SIVD, diffusion metrics correlated with decline in executive and attention. Tractwise metrics can be helpful in discriminating different disease groups (SIVD, MX and AD), because different WM tracts are involved with each cognitive domain. Generation of WM fiber tracts involves usage of a tractography algorithm based on a diffusion model [28]. Tractography using DTI model suffers the limitation of handling crossing fiber regions [29, 30]. CSD model overcomes these limitations [31]. CSD based fiber tracking has been utilized previously to study brain structural connectivity between cortical regions [32–39]. Some studies have calculated tract specific metrics, such as track density imaging (TDI), average pathlength map (APM) [40] and track weighted DTI metrics [41]. These measures showed differences in both whole brain tractograms and specific WM tracts between AD and controls [42–44].
In neuroimaging, multi-variate methods available for fusing data from different modalities have been recently reviewed [45, 46]. In the methods reviewed, the modalities are typically distinct, such as fMRI and DTI or EEG and structural MRI. We present the first attempt to use diffusion derived metrics from multiple models combined via a data fusion technique. Here we apply fusion to data collected from one diffusion modality but modeled by three different diffusion models. We fuse data provided by the DTI, DKI, and CSD models (i.e. multi-model in contrast to multimodal fusion). We apply the multiset canonical correlation analysis plus joint independent component analysis (mCCA+jICA) approach to perform the fusion [47]. The outputs of mCCA+jICA are maximally spatially independent joint components and their corresponding mixing coefficients represent their weight in approximating the white matter tract. Another key difference in our mCCA+jICA application is that we apply the method to find maximally spatially independent components within specific white matter tracts rather than searching for independent components in the whole brain. This data-driven method divides a relatively large white matter tract to a small number of spatial components which are then tested for group differences in mixing coefficients between different pairs of subject groups. Though the newer diffusion models have some advantages as compared to the older methods, we believed that every model has a unique way of representing the diffusion which are more interpretable based on the region of interest, such as DTI holds good for isotropic voxels, DKI in regions with anisotropic diffusion and CSD in voxels with crossing fibers. Moreover, when these models were tested independently, the uni-model results showed varying significant results in different tracts between different groups. Hence, we wanted to explore if the fusion of different models would result in combining the efficiency of all 3 models bringing out improved sensitivity.
2. Materials and methods
2.1. Participants
Participants belong to a University of New Mexico (UNM) cohort who were recruited for the study of cognitive decline and white matter abnormalities related to VCID. VCID patients were categorized into subcortical ischemic vascular disease (SIVD), multiple infarcts, mixed dementia (MX), leukoaraiosis and Alzheimer’s disease (AD). Subjects selected from the UNM cohort for this work include 35 healthy controls (HC) and 47 patients belonging to SIVD=12, MX=11 and AD=24. Table 1 lists subjects demographics. Clinical diagnosis into disease categories were based on patient health history, WM changes, cerebrospinal fluid (CSF) and blood-based biomarkers.
Table 1.
Subject Demographics
| Groups | HC | SIVD | MX | AD |
|---|---|---|---|---|
| Subjects (N) | 35 | 12 | 11 | 24 |
| Age (Mean±SD) | 64±10 | 64±8 | 77±3 | 69±7 |
| Gender (M:F) | 18:17 | 6:6 | 7:4 | 13:11 |
Patients with the diagnosis of SIVD generally have small vessel disease secondary to hypertension, diabetes, hyperlipidemia, and sleep apnea. They often have asymmetric hyperreflexia and impaired balance with a tendency to fall. There may be lacunar strokes in the white matter. Progression tends to be slow with gradual enlargement of the white matter lesions. CSF shows increase in albumin index (ratio of albumin in CSF to that in blood), and amyloid-β1–42 /amyloid- β1–40 ratio and phosphoTau in the CSF are normal. MX patients that have evidence of AD as shown in reduced amyloid-β1–42 /amyloid- β1–40 ratio in the CSF along with elevated phospho-tau181. In addition, they have white matter lesions, indicating that that they have both AD and SIVD. Clinically, they have reduced memory function similar to AD and increased albumin ratio similar to SIVD.
2.2. DW-MRI acquisition and preprocessing
All MRI scans are performed on a Siemens 3T TIM Trio scanner with a 32-channel coil. The MPRAGE and the FLAIR sequences were 3D sequences with 1mm isotropic resolution. The diffusion data was collected with three different protocols with slightly different maximum b-value and each with three gradient shells. The experiments done on the 32-channel coil used a CMRR multi-band sequence, which enabled us to collect more gradient directions in a reasonable experiment time and the data was collected in opposing phase encoding directions to permit distortion correction. The data has been combined from experiments with b = (0, 800, 1600, 2400 s/mm2), TR = 4000ms, TE = 108 ms, with b = (0, 1000, 2000, 3000 s/mm2) TR = 4000ms, TE = 108 ms, and with b = (0, 500, 1000, 2000 s/mm2), TR = 4000ms, TE = 102ms. All these experiments were done with a multi-band sequence with MB factor = 3 and an acquisition time of 13 min. Distortion corrections was performed by Topup/FSL [48], followed by eddy current and motion corrections using FSL.
2.3. Multiple DW-MRI models
DTI and DKI model parameters were calculated using the DIPY software [49] resulting in 6 independent DTI tensor elements and 21 independent kurtosis parameters. CSD model fitting was carried out using MRtrix3 software [14]. CSD fitting involves a pipeline of processing methods including bias correction, response function generation, upsampling, computation of fiber orientation distribution (FOD) amplitude and intensity normalization. MRtrix3 performs bias field correction using ANTS N4 algorithm [50]. Response function for each of 3 tissue types, WM, gray matter (GM) and CSF estimated using ‘msmt_5tt’ algorithm [51]. The bias corrected images were upsampled to an isotropic voxel size of 1.3 mm for better anatomical contrast. Multi-shell multi-tissue CSD fitting with maximum harmonic degree of 8 was carried out and the resultant FOD images containing 45 spherical coefficients were intensity normalized. The FOD images were registered to a Montreal Neurological Imaging (MNI) space based on a common FA MNI template as reference using non-linear registration, initialized using the 6 motion parameters estimated from linear registration provided by FSL [52].
2.4. WM tracts and mask generation
The next step in the processing pipeline was to generate WM tracts of interest in order to compute the features in regions corresponding to WM tracts. WM tracts were delineated using probabilistic tractography based on maximum peaks determined via CSD based FOD coefficients. Dynamic seeding with ‘ACT’ based tractography using iFOD2 algorithm [53] as provided in MRtrix3 was used for generating whole brain tractogram with 20 million tracks. SIFT method was used to reduce the total number of tracks to 2 million in final tractogram [54]. Specific WM tracts of interest were extracted from WB tractogram by defining inclusion and exclusion region of interests pertaining to each tract as described in [55, 56].
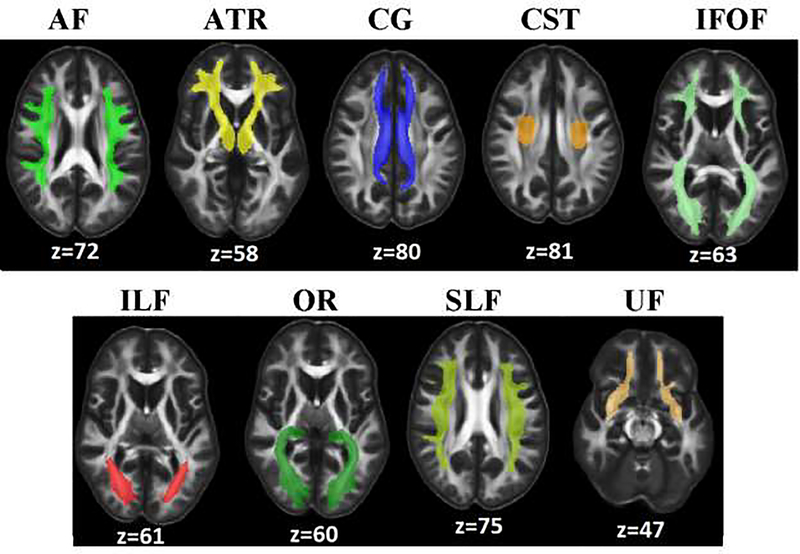
The major tracts identified for this study were arcuate fasciculus (AF), anterior thalamic radiation (ATR), cingulum (CG), cortico-spinal tract (CST), inferior fronto-occipital fasciculus (IFOF), inferior longitudinal fasciculus (ILF), superior longitudinal fasciculus (SLF), optic radiation (OR), and uncinate fasciculus (UF). We focused on major WM tracts of interest based on the literature of VCID studies [17, 23, 57]. The data-driven regions were overlaid on an atlas to identify previously implicated tracts which lead to the selection of 9 tracts for the study. Owing to the inter-subject variation in the number of voxels occupied by each of the tracts, a common mask across all subjects was generated for every WM tract. This alleviates the bias due to variation in the tract densities between subjects in the later stage of analysis when features to be extracted from tracts. A common mask was generated based on the number of fibers passing through voxels in the tracts. Voxels having less than 5 fibers were considered as outliers and those voxels were removed from the corresponding tract. The resultant tracts were combined across subjects and voxels with top 75% of the fiber densities were selected finally for mask. The procedure was repeated for every tract and common masks were generated for all WM tracts.
2.5. Multi-model feature extraction
Parametric maps derived from different diffusion models form the features for statistical analysis. MD, FA, AxD and RD were the DTI features and MK, AK and RK were obtained from DKI. Likewise, the features derived from CSD model were TDI and APM. TDI maps quantify the number of fibers or streamlines passing through each voxel. APM defines the average length of all fibers passing through each voxel which can be calculated by dividing the total length of all fibers in a voxel by TDI value of the corresponding voxel. DTI and DKI maps were registered to MNI space to enable extraction of feature values from tracts of interest. Since the WB tractogram was already in MNI space, registration of CSD features to MNI was not required. DTI, DKI and CSD measures underlying WM tracts were extracted by overlaying the parametric maps on masks generated for WM tracts. Intensity normalization was carried out on feature level to alleviate the differences in the intensity scale between various features to make suitable for statistical testing. The mean value for the z-score calculation was computed from the relevant feature values of a representative subset of healthy controls. This was done to make sure that the feature values were picked up from voxels belonging to normal brain tissues and not the abnormal ones which may have altered diffusion values due to disease condition.
2.6. Fusion framework
A joint blind source separation model combining 2 multivariate methods, canonical correction analysis and independent component analysis first reported by Sui et.al., [47] for multi-task brain imaging fusion was adopted in this work for fusion of multiple models. This method is referred to as mCCA+jICA in this paper and is available in the fusion ICA toolbox (FIT; http://trendscenter.org/software). The nine different features, MD, FA, AxD, RD, MK, AK, RK, TDI and APM were fused for every tract to find the independent components along with mixing coefficients. The feature sets were reshaped to form single dimensional vector per subject, demeaned and normalized to unit variance, resulting in 9 vectors for each subject. The final matrix for fusion was formed by horizontally stacking the feature vectors from each model to get a matrix with number of rows = number of subjects and number of columns = number of features x number of voxels. Thus, forming a matrix of 82 rows corresponding to subjects. The feature vectors were concatenated for all subject groups. mCCA+jICA reduces the data initially using mCCA method followed by ICA for decomposition into independent components. In this study 8 components per feature were estimated using infomax algorithm. The number of independent components was estimated using minimum description length criterion [58] and the implementation was an integral part of FIT toolbox. The spatial components were z-score normalized. The mixing coefficients of the spatial components were tested for significant group differences between subject groups. Fig. 1 depicts the entire processing workflow including defining of individual features to fusion features and statistical analysis.
Fig.1.
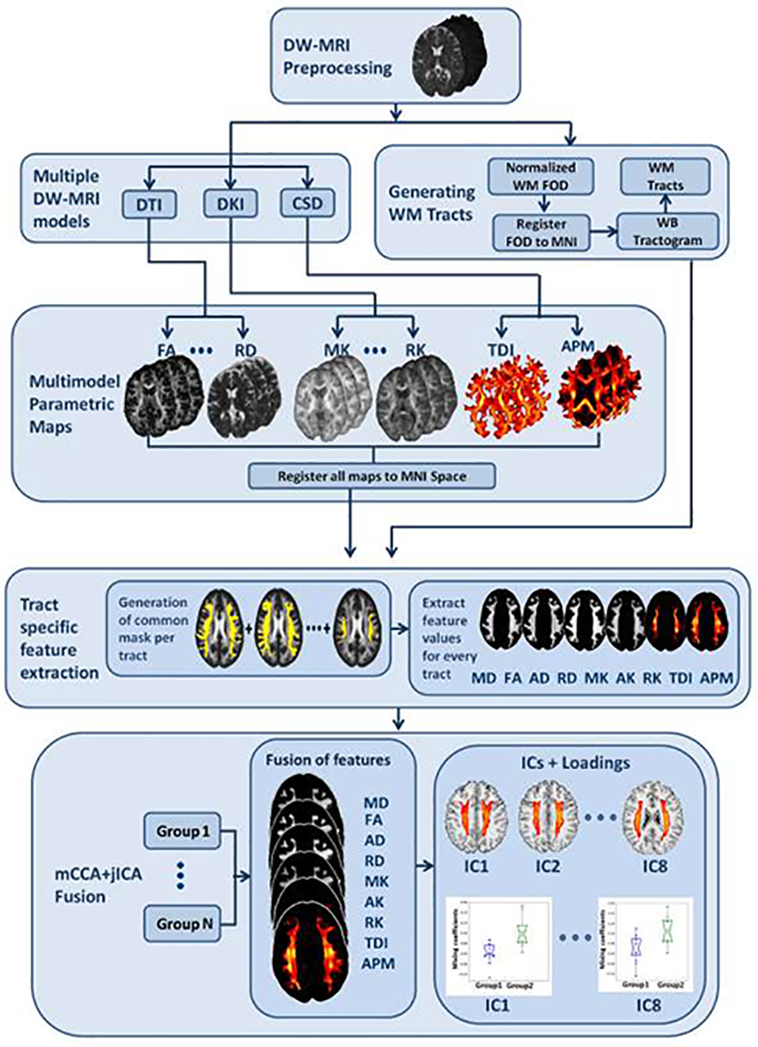
Figure illustrating the workflow of proposed diffusion MRI multi-model fusion approach
2.7. Statistical Analysis
The main aim of this study is to identify differences between subject groups, specifically to discriminate between disease groups such as SIVD, MX and AD. Statistical tests were performed using Python Scipy statistics toolbox. Age and gender effects were tested initially by forming groups based on age categories and gender categories to confirm no differences due to age and gender. A two-tailed Kruskal-Wallis test was carried out for each feature separately to analyze significant differences among multiple groups. Subsequent post-hoc analysis using Mann-Whitney U test was done to analyze group differences between pairwise groups. Four subject groups lead to 6 pairwise comparisons involving 3 pairs with healthy controls against disease group and remaining 3 pairs among disease groups (HC-SIVD, HC-MX, HC-AD, SIVD-MX, SIVD-AD and MX-AD).
The group differences thus obtained with individual model features (referred to as uni-model approach hereafter) were compared with those obtained from multi-model fusion analysis. In case of fusion features, similar multiple group comparisons using Kruskal-Wallis and Mann Whitney U tests were carried out for the mixing coefficients. The spatial maps corresponding to the significant mixing coefficients are indicators of regions with significant microstructural changes. In statistical tests of both uni-model and multi-model approaches, the corrections were accounted for multiple tests considering the various subject groups, WM tracts, diffusion features and independent components. The multiple comparisons corrections were done based on positive FDR method [59] and the significant features were identified based on the computed q-value measures. Sensitivity analyses including effect sizes and ROC AUC were performed following the statistical tests to evaluate the sensitivity of the proposed method. Effect sizes were computed and compared for both uni-model and fusion approaches. Finally, a ROC analysis was performed to predict the probabilities of subjects belonging to correct disease group to evaluate the sensitivity of the proposed fusion method. This was done using a one vs. rest logistic regression with stratified cross validation. Area under curve values were reported for identifying each subject group from the rest.
3. Results
The results of the study including both uni-model and multi-model approaches were detailed in the following subsections. Initially the WM tracts delineated for all the subjects were assessed for outliers which may be due to data noise or the tractography algorithm, based on which generic masks were generated for every tract (Fig. 2). The masks thus defined make the uniform selection of voxels across subjects. Moreover, it also eliminates the possible inclusion of tract regions in ventricles or other non-WM regions due to enlarged ventricles and presence of WM lesions in diseased subjects. We analyzed the characteristics of uni-model features to identify the gaps in discriminating the groups which formed the motivation behind proposing multi-model fusion approach. In this context, the diffusion features from individual models were studied tractwise for the 4 subject groups as a first step followed by fusion analysis, focusing mainly on discriminating between disease groups even though HC were included for preliminary tests.
Fig.2.
Figure showing the masks for each of the 9 tracts analysed in the study. AF-Arcuate fasciculus; ATR-Anterior thalamic radiation; CG-Cingulum; CST-Corticospinal tract; IFOF-Inferior fronto-occipital fasciculus; ILF-Inferior longitudinal fasciculus; OR-Optic radiation; SLF-Superior longitudinal fasciculus; UF-Uncinate fasciculus
3.1. . Uni-model results
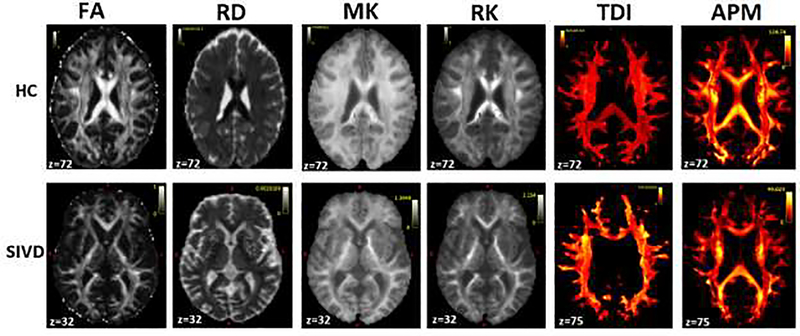
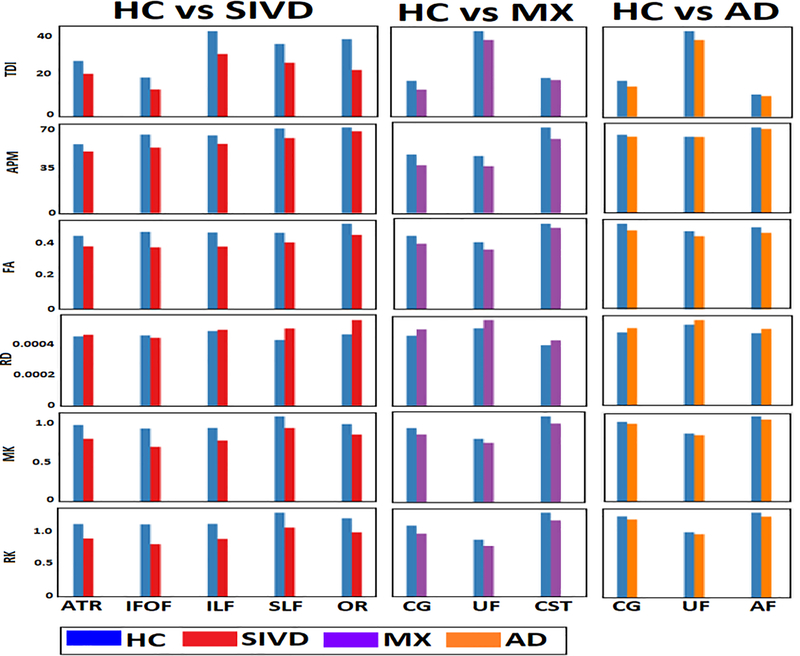
The maps of diffusion features (2 features selected from each model for display purpose) for fusion are displayed in Fig. 3 for a single subject representative of HC and SIVD. Differences in the contrast between HC and SIVD could be noticed visually for the individual features. In detail, the quantitative differences seen in terms of tracts and the diffusion features are shown in Fig. 4. The plot illustrates the differences in the mean values (over each WM tract) of the original diffusion features taken before z-score normalization. This preliminary analysis showed differences between HC and VCID subgroups for uni-model features. Features from all 3 diffusion models showed differences between HC and SIVD in 5 WM tracts, viz., ATR, IFOF, ILF, SLF and OR. Similar differences were noticed in 3 tracts namely CG, CST and UF between HC and MX whereas AF, CG and UF showed differences between HC and AD (Fig. 5). Among the DTI features, MD, FA and RD showed differences. In case of DKI, MK and RK and in CSD, both TDI and APM showed noticeable differences.
Fig. 3.
Parametric maps of 6 features, FA and RD derived from DTI; MK and RK derived from DKI; TDI and APM from CSD are shown for representative subjects belonging to HC (first row) and SIVD (second row).
Fig. 4.
Mean values of diffusion features computed on WM tracts is plotted for comparing HC against SIVD, MX and AD to identify significant tracts showing differences for each VCID subgroup. The original diffusion values were plotted in this figure. ATR, IFOF, ILF, SLF and OR showed differences between HC and SIVD; CG, UF and CST showed between HC and MX and, CG, UF and AF showed between HC and AD.
Fig.5.
Figure showing WM tracts overlaid in a common FA MNI Template (tracts shown for a representative subject, Left Panel: HC and SIVD; Middle Panel: HC and MX; Right Panel: HC and AD) show reductions in fiber population in diseased subject as compared to that of HC, this matches with the mean value differences in TDI and APM seen in Fig. 3. Only the tracts showing differences for all features are presented in this figure.
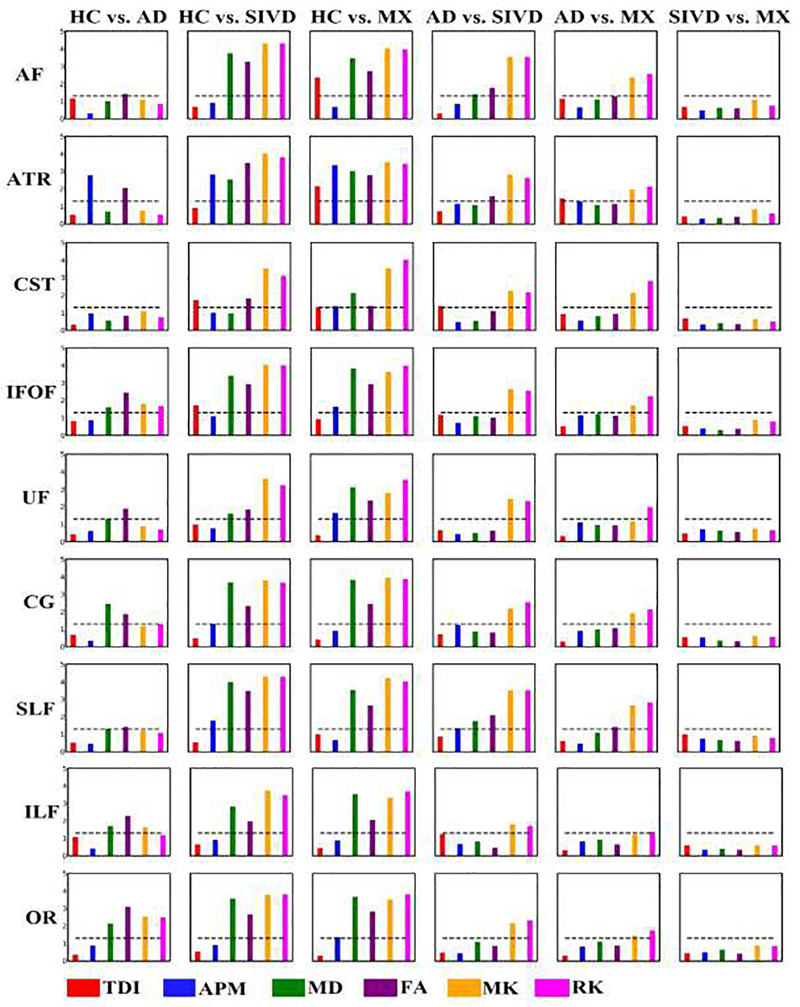
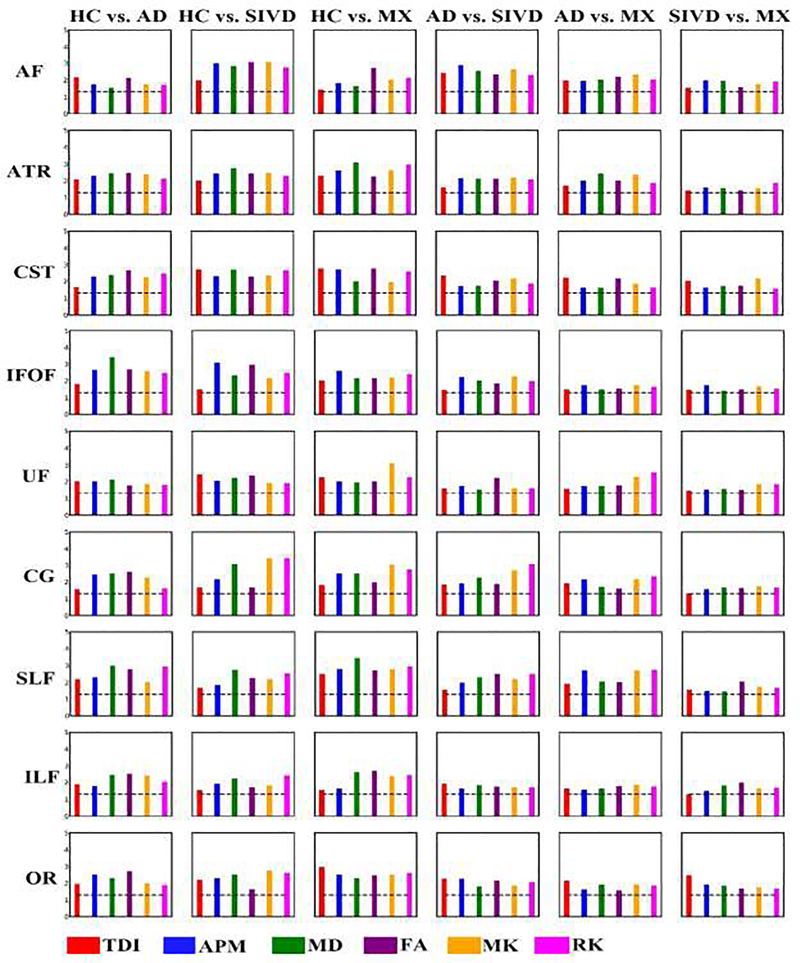
Multiple comparisons between groups showed significant differences between all pairs of subject groups except SIVD vs. MX and only DKI features MK and RK, showed differences in cases of AD vs. SIVD and AD vs. MX. The q-values were obtained as a result of corrections for multiple comparisons and hence, q-value of 0.05 was considered significant. Fig. 6 shows the q-value plots for 6 comparisons for 6 features, MD, FA, MK, RK, TDI and APM, for each of the tracts. Few features AD, RD and AK were omitted as the results were similar or insignificant, to make the plot readable and compact. -log10(q-value) was plotted along y-axis to make the y-axis range in integers and the black dotted lines correspond to significant q-value. As shown in the figure, none of the features discriminate between SIVD and MX. Additionally, very few features showed differences between AD vs. SIVD and AD vs. MX. To overcome these limitations, a different approach which combines the information from various models is required to efficiently distinguish between VCID subgroups, especially SIVD vs. MX.
Fig.6.
Results of group differences between pairwise groups using individual features tested on 9 WM tracts. Each column represents a pair of subject groups and each row represents WM tract. Each bar plot is for a specific diffusion feature. Y-axis values plotted were –log10(q-value). (q-value <0.05 is considered significant). Dotted line is an indicator of significant q-value, the bars above which are significant.
3.2. Multi-model fusion results
Features from 3 diffusion models were fused using mCCA+jICA for each of the 9 identified WM tracts. Resultant independent components (ICs) along with corresponding loading parameters for each subject per feature were analyzed for every tract to identify the ICs revealing significant differences. P-values captured from non-parametric tests between loadings of pair of subject groups helped in evaluating discriminating ability of fused features and also to identify tracts being affected due to disease pathology. Results similar to Fig. 6 were shown in Fig. 7 for ICs within tracts obtained with fusion. As mentioned before, mCCA+jICA provide 8 ICs for each feature. In Fig. 7, the q-value for the IC with the smallest q-value is shown.
Fig.7.
Results of group differences between pairwise groups using mixing coefficients tested on 9 WM tracts. Each column represents a pair of subject groups and each row represents WM tract. Each bar plot is for a specific diffusion feature. Y-axis values plotted were –log10(q-value). (q-value <0.05 is considered significant). Dotted line is an indicator of significant q-value, the bars above which are significant.
Results show that fusion results outperform individual model features in discriminating between groups, especially in cases of pairs dealing with comparison between disease groups such as SIVD-MX, SIVD-AD and MX-AD. Individual features could not differentiate SIVD and MX due to overlapping diffusion patterns between SIVD and MX. This was also the case with SIVD vs. AD and MX vs. AD where very few features and tracts showed discriminating results in uni-model approach. This demonstrates that utilizing the diffusion features directly aids in diagnosing patients from controls but may not help in diagnosing different subgroups of VCID which is critical for the clinicians to decide on the treatment and to understand treatment effects. Moreover, results from Fig. 7 manifest the specific tracts significant in each pair. SIVD and MX showed significant differences in all tracts and q-values are comparatively nearer to significance for most of the features and tracts. All tracts discriminated SIVD and AD. Relatively higher number of features showed differences between MX and AD as compared to uni-model case. AF, ATR, SLF and CG revealed more discriminating features between MX and AD.
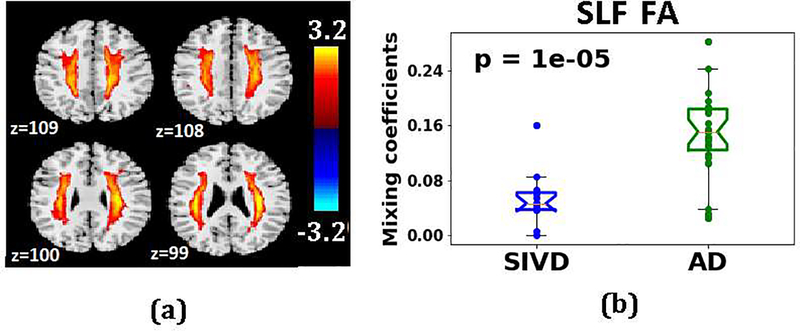
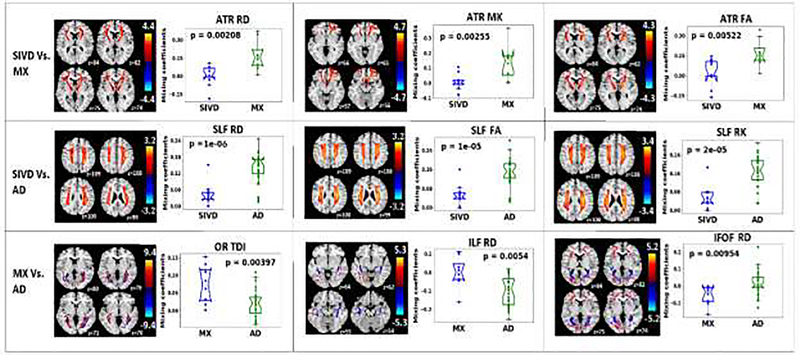
Fig. 8 displaying a representative result from the mCCA+jICA algorithm is shown to describe the spatial maps and corresponding mixing coefficients obtained from fusion. The map can be considered a weighted seed region, with the loading parameters reflecting a spatial regression parameter. The loading parameters thus convey the degree to which the entire component is ‘expressed’ in any given individual. Thus, it is reasonable to conclude, based on group differences, that the component has a lower weighting in the other group, which suggests microstructural changes. The component with the least p-value implies the regions with significant differences between the corresponding groups and hence those components were highlighted in this paper. Fig. 8a shows the IC for the feature FA on the SLF tract (representative 4 slices) and the corresponding bar plots (Fig. 8b) for the differences in the mixing coefficients between SIVD and AD. Regions in the IC with higher values contribute more to the group difference shown in Fig. 8b. In this example the high IC values emphasize the parts of the SLF tract that are important for the group difference. Fig. 9 shows the fusion results in diagnosing the 3 difficult pairs, SIVD-MX, SIVD-AD and MX-AD (Fig. 9). The three components with smallest p-values and the corresponding group difference bar plots for each pair are shown in Fig. 9. The p-values shown here are the uncorrected values and the corresponding corrected q-values were significant. The first row corresponding to pair SIVD-MX includes IC1 of DTI measure RD for WM tract ATR, IC7 of DKI measure MK for ATR and IC1 of DTI measure FA for ATR. This reveals that SIVD and MX vary in ATR. The results between SIVD and AD shown in second row include IC4 of RD for SLF, IC5 of FA for SLF and IC3 for RK for SLF, indicating differences were dominant in SLF. Last row between MX and AD include IC6 of TDI for OR, IC7 of RD for ILF and IC6 of RD for IFOF.
Fig.8.
Result of mCCA+jICA fusion performed between SIVD and AD on 9 features from SLF tract is shown for IC5. (a) Spatial Maps depicting the subregions (red colored voxels) in SLF tract where significant differences using IC5 of DTI feature, FA were seen. (b) Mixing coefficients for IC5 of FA are plotted for SIVD and AD, group testing on the mixing coefficients between SIVD and AD resulted in a p-value of 1e-05. FA values were lower in SIVD compared to AD. Color bar indicates the z-score range of the spatial components.
Fig.9.
Result of mCCA+jICA fusion performed between SIVD and AD on 9 features from SLF tract is shown for IC5. (a) Spatial Maps depicting the subregions (red colored voxels) in SLF tract where significant differences using IC5 of DTI feature, FA were seen. (b) Mixing coefficients for IC5 of FA are plotted for SIVD and AD, group testing on the mixing coefficients between SIVD and AD resulted in a p-value of 1e-05. FA values were lower in SIVD compared to AD. Color bar indicates the z-score range of the spatial components.
Spatial components in Fig. 9 were carefully studied to understand the pattern of changes (increase or decrease) of diffusion measure between the corresponding groups based on sign of numerical values of IC and mixing coefficients (Table. 2). Spatial components have to be interpreted as follows: Higher mixing coefficients in group1 indicates group1 has higher feature values than group2 in positive red colored regions and group1 has lesser values than group2 in negative blue colored regions, when comparing between group1 and group2. This holds true for positive mixing coefficients and the reverse applies for negative mixing coefficients. Based on this, the inferences made were summarized in Table. 2. Differences between SIVD and MX in regions of ATR tract indicate higher RD values in MX and lower MK and FA values in SIVD. Similarly, higher RD values in AD and lower MK and FA values in SIVD were inferred from differences between SIVD and AD.
Table 2.
Summary of inferences drawn from Fig. 8
| Pair | First IC | Second IC | Third IC |
|---|---|---|---|
| SIVD vs. MX | ATR RD | ATR MK | ATR FA |
| Increase in MX | Decrease in MX | Decrease in SIVD | |
| SIVD vs. AD | SLF RD | SLF FA | SLF RK |
| Increase in AD | Decrease in SIVD | Decrease in SIVD | |
| MX vs. AD | OR TDI | ILF RD | IFOF RD |
| Decrease in both MX and AD in different fibers | Increase in both MX and AD in different fibers | Increase in both MX and AD in different fibers |
3.3. Sensitivity analysis
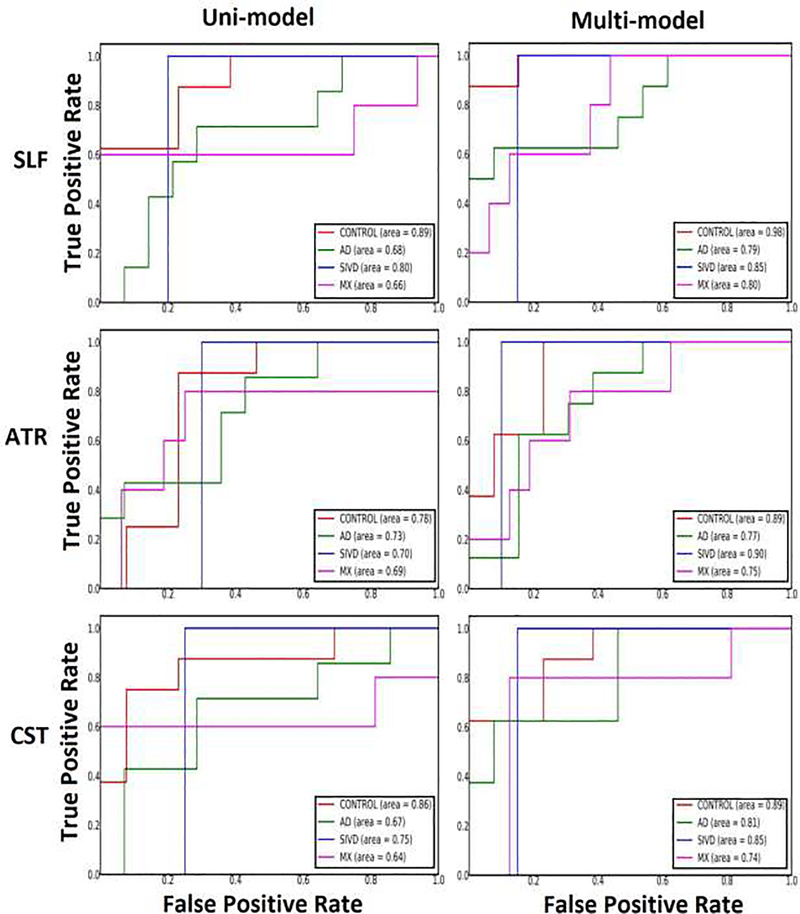
ROC analysis performed on uni-model and multi-model features showed the improved sensitivity of proposed fusion approach as compared to uni-model method. One vs. rest logistic regression was fitted to the training set to handle the case of multiple classes for finding probabilities of predicting each of the classes. The 4 subject groups, HC, SIVD, MX and AD form the 4 classes. Stratified cross validation with 10-fold was carried out to calculate the prediction probabilities of the disease groups efficiently without any bias associated with the imbalanced sample sizes of classes. Feature set for uni-model case comprised of 9 diffusion features (MD,FA,AD,RD,MK,AK,RK,TDI,APM). The feature vector corresponding to a single subject defined as [μ1 μ2 … μ9]t, where μi denotes the mean value computed over voxels of tract t for ith diffusion feature. The prediction is repeated for each of the 9 tracts. Likewise, the feature vector for fusion model corresponding to a single subject defined as []t, where denotes mixing coefficient of ith diffusion feature of independent component j for tract t. The component j for each of the diffusion feature was selected based on the component with the least p-value obtained from the Kruskal-Wallis multiple comparison done before, reported in section 3.2. The sensitivity and specificity values computed using logistic regression were used to find the area under curve (AUC) values via ROC curves. AUC values for predicting each of the 4 subject groups were recorded for all 9 tracts separately. AUC values demonstrate the increased accuracy of fusion approach with average AUCs of 0.9 for HC, 0.87 for SIVD, 0.79 for MX and 0.83 for AD which is higher than average AUCs of 0.83 for HC, 0.75 for SIVD, 0.67 for MX and 0.71 for AD (averaged across tracts). Representatives ROC curves are shown for tracts SLF, ATR and CST for uni-model and multi-model methods (Fig. 10). The main advantage of fusion approach could be seen in predicting the disease groups, specifically AD and MX for which the AUCs were lower for uni-model case and a noticeable improvement is seen for fusion method. AF, ATR, CST, SLF and OR showed higher AUCs for identifying individual disease groups.
Fig.10.
ROC Curves are shown for representative tracts SLF (top row), ATR (middle row) and CST (bottom row). Left column shows curves for uni-model and right column for multi-model fusion methods. SLF has highest AUC for predicting MX; ATR has highest AUC for predicting SIVD and CST has highest AUC for predicting AD.
Effect sizes based on Cohen’s d for quantifying the differences between SIVD and MX were calculated for each of the diffusion features. The effect sizes for uni-model approach were in the range of d=0.43–0.67 with MD and MK had the highest effect size of 0.61 and 0.67 respectively. On the other hand, effect sizes for multi-model case showed significantly higher values, in the range of d=0.71–0.82 with FA, MK and TDI of effect sizes 0.79, 0.82 and 0.76 respectively. The tracts SLF, ILF, CST and OR showed greater differences between SIVD and MX. SIVD and MX comparison was considered here as a representative case of hard to discriminate pair.
4. Discussion
The main aim of this study is to investigate the efficacy of diffusion MRI parameters in discriminating subgroups of VCID. This is the first work to report on fusion of multi-model diffusion MRI and to discriminate between subgroups, SIVD, MX and AD based on WM tract specific features. The main advantage of multimodal fusion lies in the use of complementary information across various modalities and exploiting the shared connections between them. Our results clearly demonstrate the superior performance of multi-model fusion. We believe that the proposed fusion approach will be of greater use as a sensitive marker in diagnosing WM abnormalities.
WM integrity in aging related brain disorders were characterized well with the help of DW-MRI. The related studies mainly fall in either regional based analysis or connectivity analysis [57]. In regional based category, diffusion metrics extracted from whole brain or specific brain regions like WM hyperintensities (WMHs) were examined. Due to the inconsistent findings across these studies, structural connectivity based analysis have been widely reported recently as outperforming regional analysis [20, 21, 60, 61]. WM disconnection contributing to the clinical symptoms in VCID is the reason behind success of connectivity studies. This forms the motivation in adopting fiber tract based analysis in the current work, because of its close relationship to connectivity between cortical regions. Connectivity is explored by delineating WM fiber tracts and subsequently estimating tract specific diffusion features.
Group comparisons performed using individual diffusion features from each model revealed significant results in discriminating healthy controls and disease groups. SIVD and MX showed increased changes in diffusion values as compared to changes in AD which is in par with the published literature stating WMHs are prevalent in SIVD and MX than AD [62]. P-values obtained between controls and diseased groups suggest the affected WM tracts. SLF, CST, AF, ILF and OR were the tracts affected in SIVD and MX, whereas AD showed disturbances in OR, IFOF and UF. This relates to the varying cognitive functions affected in SIVD, MX and AD. Past studies indicate decline of executive speed and attention in VCID and memory loss in AD [27, 63–65]. The different tracts affected in SIVD (MX) and AD may also be linked to different cognitive domains.
Though the differences seen in specific tracts related to specific subgroup could not be directly correlated with ay of the past studies due to lack of studies involving discriminating such a set of VCID subgroups namely SIVD, MX and AD, the identified tracts of interest were largely congruent with the major WM tracts reported in the studies related to VCID in general [36, 57, 66–68]. The specific tracts showing differences in SIVD and MX are mainly superior and inferior longitudinal fasciculus which are known to be late myelinating fibers as reported by Benitez et.al., [69]. Similar findings were also reported by Douaud et.al., [42] related to SLF in subjects with mild cognitive impairment. On the other hand, the tracts associated with AD namely OR, IFOF and UF may indicate a possible implication of the affected connections related to memory network. These findings were in alignment with those reported in the past studies showing diffusion alterations in IFOF and UF [36, 42].
The main limitation in utilizing individual features was the poor performance in differentiating between disease groups. SIVD and MX groups posed a challenge in differentiating, owing to the highly overlapping diffusion metrics. Likewise, pairs SIVD-AD and MX-AD too showed significant differences in very few tracts. DKI metrics, MK and RK showed least p-values for these pairs as compared to other models. On the whole, DTI and DKI metrics showed improved performance as compared to CSD metrics.
Despite numerous studies reported fusing of multimodality features using mCCA+jICA, the new contribution in this work is fusion of features from multiple DW-MRI models. Multi-model results showed discrimination between SIVD and MX and differences in more tracts and features for SIVD-AD and MX-AD compared to the use of a single model. There are a few limitations of this study. The sample size was small in disease groups. Although it is interesting that even with a small sample the features obtained after mCCA+jICA had improved sensitivity to group differences in the disease groups. In the future with the increased number if subjects we can reconfirm whether these observations continue to hold. The study mainly depends on the metrics extracted from fiber tracts. Hence accuracy of the fiber tracking algorithm impacts the overall results. The sensitivity of the method to the fiber tracking algorithms has not been studied. Only few features from each model were incorporated in this work despite of the larger scope of features that could be defined in each model. Successive works with more features in future may be useful for prediction analysis. Moreover, the study involved only 9 WM tracts, we plan to repeat the analysis for more tracts going forward. As is common practice [47, 70–72], we discuss only the selected the components showing the significant differences between the groups rather than the components without any differences. For these components, we further identify the regional differences in smaller regions relative to the whole brain. This way of looking at smaller regions in terms of components is not possible with the uni-model method and that is an added advantage. Despite all the drawbacks, the proposed method served the study aim by leveraging the identification of tracts affected in specific subgroups.
5. Conclusions
The present study demonstrates that mCCA+jICA fusion increased the sensitivity in discriminating various subgroups of VCID by fusing features from three different diffusion models. Tract specific prediction analysis revealed major tracts being affected as ATR, CST, SLF, AF and OR. DTI and DKI metrics outperformed CSD measures. The performance of proposed approach evaluated by means of sensitivity scores demonstrated the benefit of employing fusion technique. Thus, the proposed fusion approach could be used as potential method for classification of VCID subgroups.
Acknowledgments
Funding
This work was supported by NIH grants UH3 NS100598 (MarkVCID), RO1 NS052305, RO1 NS068048, and DHHS/NIH/NCRR #UL1TR001449.
Footnotes
Declaration of interests: None
References
- 1.Guermazi A, et al. , Neuroradiological findings in vascular dementia. Neuroradiology, 2007. 49(1): p. 1–22. [DOI] [PubMed] [Google Scholar]
- 2.T O’Brien J, et al. , Vascular cognitive impairment. The Lancet Neurology, 2003. 2(2): p. 89–98. [DOI] [PubMed] [Google Scholar]
- 3.Snyder HM, et al. , Vascular contributions to cognitive impairment and dementia including Alzheimer’s disease. Alzheimer’s & Dementia, 2015. 11(6): p. 710–717. [DOI] [PMC free article] [PubMed] [Google Scholar]
- 4.O’Sullivan M, Imaging small vessel disease: lesion topography, networks, and cognitive deficits investigated with MRI. Stroke, 2010. 41(10_suppl_1): p. S154–S158. [DOI] [PubMed] [Google Scholar]
- 5.Van Norden AG, et al. , Causes and consequences of cerebral small vessel disease. The RUN DMC study: a prospective cohort study. Study rationale and protocol . BMC neurology, 2011. 11(1): p. 29. [DOI] [PMC free article] [PubMed] [Google Scholar]
- 6.Wardlaw JM, et al. , Neuroimaging standards for research into small vessel disease and its contribution to ageing and neurodegeneration. The Lancet Neurology, 2013. 12(8): p. 822–838. [DOI] [PMC free article] [PubMed] [Google Scholar]
- 7.Le Bihan D, et al. , Diffusion tensor imaging: concepts and applications. Journal of Magnetic Resonance Imaging: An Official Journal of the International Society for Magnetic Resonance in Medicine, 2001. 13(4): p. 534–546. [DOI] [PubMed] [Google Scholar]
- 8.Lyoubi-Idrissi A, et al. , Diffusion magnetic resonance imaging in cerebral small vessel disease. Revue neurologique, 2017. 173(4): p. 201–210. [DOI] [PubMed] [Google Scholar]
- 9.Madden DJ, Bennett IJ, and Song AW, Cerebral white matter integrity and cognitive aging: contributions from diffusion tensor imaging. Neuropsychology review, 2009. 19(4): p. 415. [DOI] [PMC free article] [PubMed] [Google Scholar]
- 10.Lu H, et al. , Three-dimensional characterization of non-gaussian water diffusion in humans using diffusion kurtosis imaging. NMR in Biomedicine: An International Journal Devoted to the Development and Application of Magnetic Resonance In vivo, 2006. 19(2): p. 236–247. [DOI] [PubMed] [Google Scholar]
- 11.Steven AJ, Zhuo J, and Melhem ER, Diffusion kurtosis imaging: an emerging technique for evaluating the microstructural environment of the brain. American journal of roentgenology, 2014. 202(1): p. W26–W33. [DOI] [PubMed] [Google Scholar]
- 12.Arab A, et al. , Principles of diffusion kurtosis imaging and its role in early diagnosis of neurodegenerative disorders. Brain research bulletin, 2018. 139: p. 91–98. [DOI] [PubMed] [Google Scholar]
- 13.Tournier JD, Calamante F, and Connelly A, Robust determination of the fibre orientation distribution in diffusion MRI: non-negativity constrained super-resolved spherical deconvolution. Neuroimage, 2007. 35(4): p. 1459–72. [DOI] [PubMed] [Google Scholar]
- 14.Tournier JD, Calamante F, and Connelly A, MRtrix: Diffusion tractography in crossing fiber regions. International Journal of Imaging Systems and Technology, 2012. 22(1): p. 53–66. [Google Scholar]
- 15.Calamante F, et al. , Track-density imaging (TDI): super-resolution white matter imaging using whole-brain track-density mapping. Neuroimage, 2010. 53(4): p. 1233–43. [DOI] [PubMed] [Google Scholar]
- 16.Raffelt DA, et al. , Investigating white matter fibre density and morphology using fixel-based analysis. Neuroimage, 2017. 144(Pt A): p. 58–73. [DOI] [PMC free article] [PubMed] [Google Scholar]
- 17.Urresta FL, Medina DA, and Gaviria M, Diffusion MRI studies in vascular cognitive impairment and dementia. Brazilian Journal of Psychiatry, 2003. 25(3): p. 188–191. [DOI] [PubMed] [Google Scholar]
- 18.van Norden AG, et al. , Diffusion tensor imaging and cognition in cerebral small vessel disease: the RUN DMC study. Biochimica et Biophysica Acta (BBA)-Molecular Basis of Disease, 2012. 1822(3): p. 401–407. [DOI] [PubMed] [Google Scholar]
- 19.Lawrence AJ, et al. , Mechanisms of cognitive impairment in cerebral small vessel disease: multimodal MRI results from the St George’s cognition and neuroimaging in stroke (SCANS) study. PLoS One, 2013. 8(4): p. e61014. [DOI] [PMC free article] [PubMed] [Google Scholar]
- 20.Papma JM, et al. , Cerebral small vessel disease affects white matter microstructure in mild cognitive impairment. Human brain mapping, 2014. 35(6): p. 2836–2851. [DOI] [PMC free article] [PubMed] [Google Scholar]
- 21.Lawrence AJ, et al. , Structural network efficiency is associated with cognitive impairment in small-vessel disease. Neurology, 2014. 83(4): p. 304–311. [DOI] [PMC free article] [PubMed] [Google Scholar]
- 22.Tuladhar AM, et al. , Structural network efficiency predicts conversion to dementia. Neurology, 2016. 86(12): p. 1112–1119. [DOI] [PMC free article] [PubMed] [Google Scholar]
- 23.Tuladhar AM, et al. , Structural network connectivity and cognition in cerebral small vessel disease. Human brain mapping, 2016. 37(1): p. 300–310. [DOI] [PMC free article] [PubMed] [Google Scholar]
- 24.Xu S, et al. , Assessment of severity of leukoaraiosis: a diffusional kurtosis imaging study. Clinical imaging, 2016. 40(4): p. 732–738. [DOI] [PubMed] [Google Scholar]
- 25.Zhong G, et al. , Better correlation of cognitive function to white matter integrity than to blood supply in subjects with leukoaraiosis. Frontiers in aging neuroscience, 2017. 9: p. 185. [DOI] [PMC free article] [PubMed] [Google Scholar]
- 26.Nitkunan A, et al. , Multimodal MRI in cerebral small vessel disease: its relationship with cognition and sensitivity to change over time. Stroke, 2008. 39(7): p. 1999–2005. [DOI] [PubMed] [Google Scholar]
- 27.van Norden AG, et al. , Cognitive function in small vessel disease: the additional value of diffusion tensor imaging to conventional magnetic resonance imaging: the RUN DMC study. J Alzheimers Dis, 2012. 32(3): p. 667–76. [DOI] [PubMed] [Google Scholar]
- 28.Mukherjee P, et al. , Diffusion tensor MR imaging and fiber tractography: theoretic underpinnings. AJNR Am J Neuroradiol, 2008. 29(4): p. 632–41. [DOI] [PMC free article] [PubMed] [Google Scholar]
- 29.Tournier JD, Mori S, and Leemans A, Diffusion tensor imaging and beyond. Magn Reson Med, 2011. 65(6): p. 1532–56. [DOI] [PMC free article] [PubMed] [Google Scholar]
- 30.Farquharson S, et al. , White matter fiber tractography: why we need to move beyond DTI. J Neurosurg, 2013. 118(6): p. 1367–77. [DOI] [PubMed] [Google Scholar]
- 31.Tournier JD, et al. , Direct estimation of the fiber orientation density function from diffusion-weighted MRI data using spherical deconvolution. Neuroimage, 2004. 23(3): p. 1176–85. [DOI] [PubMed] [Google Scholar]
- 32.Wright DK, et al. , Changes in Apparent Fiber Density and Track-Weighted Imaging Metrics in White Matter following Experimental Traumatic Brain Injury. J Neurotrauma, 2017. 34(13): p. 2109–2118. [DOI] [PubMed] [Google Scholar]
- 33.Gajamange S, et al. , Fibre-specific white matter changes in multiple sclerosis patients with optic neuritis. NeuroImage: Clinical, 2018. 17: p. 60–68. [DOI] [PMC free article] [PubMed] [Google Scholar]
- 34.Ziegler E, et al. , Mapping track density changes in nigrostriatal and extranigral pathways in Parkinson’s disease. Neuroimage, 2014. 99: p. 498–508. [DOI] [PMC free article] [PubMed] [Google Scholar]
- 35.Genc S, et al. , White matter alterations at pubertal onset. Neuroimage, 2017. 156: p. 286–292. [DOI] [PubMed] [Google Scholar]
- 36.Mito R, et al. , Fibre-specific white matter reductions in Alzheimer’s disease and mild cognitive impairment. Brain, 2018. 141(3): p. 888–902. [DOI] [PubMed] [Google Scholar]
- 37.Banfi C, et al. , White matter alterations and tract lateralization in children with dyslexia and isolated spelling deficits. Human brain mapping, 2019. 40(3): p. 765–776. [DOI] [PMC free article] [PubMed] [Google Scholar]
- 38.Grazioplene RG, et al. , Connectivity-enhanced diffusion analysis reveals white matter density disruptions in first episode and chronic schizophrenia. NeuroImage: Clinical, 2018. 18: p. 608–616. [DOI] [PMC free article] [PubMed] [Google Scholar]
- 39.Mürner-Lavanchy IM, et al. , White matter microstructure is associated with language in children born very preterm. NeuroImage: Clinical, 2018. 20: p. 808–822. [DOI] [PMC free article] [PubMed] [Google Scholar]
- 40.Pannek K, et al. , The average pathlength map: a diffusion MRI tractography-derived index for studying brain pathology. Neuroimage, 2011. 55(1): p. 133–41. [DOI] [PubMed] [Google Scholar]
- 41.Calamante F, et al. , A generalised framework for super-resolution track-weighted imaging. Neuroimage, 2012. 59(3): p. 2494–503. [DOI] [PubMed] [Google Scholar]
- 42.Douaud G, et al. , DTI measures in crossing-fibre areas: increased diffusion anisotropy reveals early white matter alteration in MCI and mild Alzheimer’s disease. Neuroimage, 2011. 55(3): p. 880–90. [DOI] [PMC free article] [PubMed] [Google Scholar]
- 43.Doan NT, et al. , Dissociable diffusion MRI patterns of white matter microstructure and connectivity in Alzheimer’s disease spectrum. Sci Rep, 2017. 7: p. 45131. [DOI] [PMC free article] [PubMed] [Google Scholar]
- 44.Schouten TM, et al. , Individual classification of Alzheimer’s disease with diffusion magnetic resonance imaging. Neuroimage, 2017. 152: p. 476–481. [DOI] [PubMed] [Google Scholar]
- 45.Calhoun VD and Sui J, Multimodal fusion of brain imaging data: A key to finding the missing link(s) in complex mental illness. Biol Psychiatry Cogn Neurosci Neuroimaging, 2016. 1(3): p. 230–244. [DOI] [PMC free article] [PubMed] [Google Scholar]
- 46.Sui J, et al. , A review of multivariate methods for multimodal fusion of brain imaging data. J Neurosci Methods, 2012. 204(1): p. 68–81. [DOI] [PMC free article] [PubMed] [Google Scholar]
- 47.Sui J, et al. , Three-way (N-way) fusion of brain imaging data based on mCCA+jICA and its application to discriminating schizophrenia. Neuroimage, 2013. 66: p. 119–32. [DOI] [PMC free article] [PubMed] [Google Scholar]
- 48.Smith SM, et al. , Advances in functional and structural MR image analysis and implementation as FSL. Neuroimage, 2004. 23 Suppl 1: p. S208–19. [DOI] [PubMed] [Google Scholar]
- 49.Garyfallidis E, et al. , Dipy, a library for the analysis of diffusion MRI data. Frontiers in neuroinformatics, 2014. 8: p. 8. [DOI] [PMC free article] [PubMed] [Google Scholar]
- 50.Avants BB, Tustison N, and Song G, Advanced normalization tools (ANTS). Insight j, 2009. 2: p. 1–35. [Google Scholar]
- 51.Jeurissen B, et al. , Multi-tissue constrained spherical deconvolution for improved analysis of multi-shell diffusion MRI data. Neuroimage, 2014. 103: p. 411–26. [DOI] [PubMed] [Google Scholar]
- 52.Jenkinson M, et al. , Improved optimization for the robust and accurate linear registration and motion correction of brain images. Neuroimage, 2002. 17(2): p. 825–841. [DOI] [PubMed] [Google Scholar]
- 53.Smith RE, et al. , Anatomically-constrained tractography: improved diffusion MRI streamlines tractography through effective use of anatomical information. Neuroimage, 2012. 62(3): p. 1924–38. [DOI] [PubMed] [Google Scholar]
- 54.Smith RE, et al. , SIFT2: Enabling dense quantitative assessment of brain white matter connectivity using streamlines tractography. Neuroimage, 2015. 119: p. 338–351. [DOI] [PubMed] [Google Scholar]
- 55.Oishi K, et al. , Atlas-based whole brain white matter analysis using large deformation diffeomorphic metric mapping: application to normal elderly and Alzheimer’s disease participants. Neuroimage, 2009. 46(2): p. 486–499. [DOI] [PMC free article] [PubMed] [Google Scholar]
- 56.Zhang Y, et al. , Atlas-guided tract reconstruction for automated and comprehensive examination of the white matter anatomy. Neuroimage, 2010. 52(4): p. 1289–1301. [DOI] [PMC free article] [PubMed] [Google Scholar]
- 57.Raja R, Rosenberg G, and Caprihan A, Review of diffusion MRI studies in chronic white matter diseases. Neuroscience letters, 2018. [DOI] [PMC free article] [PubMed] [Google Scholar]
- 58.Li YO, Adalı T, and Calhoun VD, Estimating the number of independent components for functional magnetic resonance imaging data. Human brain mapping, 2007. 28(11): p. 1251–1266. [DOI] [PMC free article] [PubMed] [Google Scholar]
- 59.Storey JD, The positive false discovery rate: a Bayesian interpretation and the q-value. The Annals of Statistics, 2003. 31(6): p. 2013–2035. [Google Scholar]
- 60.Metoki A, et al. , Mnemonic function in small vessel disease and associations with white matter tract microstructure. Neuropsychologia, 2017. 104: p. 1–7. [DOI] [PMC free article] [PubMed] [Google Scholar]
- 61.Reijmer YD, et al. , Small vessel disease and cognitive impairment: The relevance of central network connections. Human brain mapping, 2016. 37(7): p. 2446–2454. [DOI] [PMC free article] [PubMed] [Google Scholar]
- 62.Rosenberg GA, et al. , A Multimodal Approach to Stratification of Patients with Dementia: Selection of Mixed Dementia Patients Prior to Autopsy. Brain Sci, 2019. 9(8). [DOI] [PMC free article] [PubMed] [Google Scholar]
- 63.O’Sullivan M, et al. , Diffusion tensor MRI correlates with executive dysfunction in patients with ischaemic leukoaraiosis. J Neurol Neurosurg Psychiatry, 2004. 75(3): p. 441–7. [DOI] [PMC free article] [PubMed] [Google Scholar]
- 64.Reijmer YD, et al. , Small vessel disease and cognitive impairment: The relevance of central network connections. Hum Brain Mapp, 2016. 37(7): p. 2446–54. [DOI] [PMC free article] [PubMed] [Google Scholar]
- 65.Biesbroek JM, et al. , Microstructure of Strategic White Matter Tracts and Cognition in Memory Clinic Patients with Vascular Brain Injury. Dement Geriatr Cogn Disord, 2017. 44(5–6): p. 268–282. [DOI] [PMC free article] [PubMed] [Google Scholar]
- 66.Lim JS, et al. , Differential white matter connectivity in early mild cognitive impairment according to CSF biomarkers. PLoS One, 2014. 9(3): p. e91400. [DOI] [PMC free article] [PubMed] [Google Scholar]
- 67.Rasero J, et al. , Group-Level Progressive Alterations in Brain Connectivity Patterns Revealed by Diffusion-Tensor Brain Networks across Severity Stages in Alzheimer’s Disease. Front Aging Neurosci, 2017. 9: p. 215. [DOI] [PMC free article] [PubMed] [Google Scholar]
- 68.Lee SH, et al. , Tract-based analysis of white matter degeneration in Alzheimer’s disease. Neuroscience, 2015. 301: p. 79–89. [DOI] [PMC free article] [PubMed] [Google Scholar]
- 69.Benitez A, et al. , White matter tract integrity metrics reflect the vulnerability of late-myelinating tracts in Alzheimer’s disease. NeuroImage: Clinical, 2014. 4: p. 64–71. [DOI] [PMC free article] [PubMed] [Google Scholar]
- 70.Sui J, et al. , Combination of Resting State fMRI, DTI, and sMRI Data to Discriminate Schizophrenia by N-way MCCA + jICA. Front Hum Neurosci, 2013. 7: p. 235. [DOI] [PMC free article] [PubMed] [Google Scholar]
- 71.Qi S, et al. , Multimodal Fusion With Reference: Searching for Joint Neuromarkers of Working Memory Deficits in Schizophrenia. IEEE Trans Med Imaging, 2018. 37(1): p. 93–105. [DOI] [PMC free article] [PubMed] [Google Scholar]
- 72.Lottman KK, et al. , Four-way multimodal fusion of 7 T imaging data using an mCCA+jICA model in first-episode schizophrenia. Hum Brain Mapp, 2018. 39(4): p. 1475–1488. [DOI] [PMC free article] [PubMed] [Google Scholar]


