

ABSTRACT
Background
Iron deficiency can result in hyporetinolemia and hepatic vitamin A (VA) sequestration.
Objectives
We used model-based compartmental analysis to determine the impact of iron repletion on VA metabolism and kinetics in iron-deficient rats.
Methods
At weaning, Sprague-Dawley rats were assigned to either a VA-marginal diet (0.35 mg retinol equivalent/kg) with adequate iron (35 ppm, control group [CN]) or reduced iron (3 ppm, iron-deficient group [ID–]), with an equivalent average body weight for each group. After 5 wk, n = 4 rats from each group were euthanized for baseline measurements of VA and iron indices, and the remaining rats (n = 6 CN, n = 10 ID–) received an intravenous injection of 3H-labeled retinol in an emulsion as tracer to initiate the kinetic study. On day 21 after dosing, half of the ID– rats were switched to the CN diet to initiate iron repletion, referred to as the iron-repletion group (ID+). From the time of dosing, 34 serial blood samples were collected from each rat over a 92-d time course. Plasma tracer and tissue tracee data were fitted to 6- and 4-compartment models, respectively, to analyze the kinetic behavior of VA in all groups.
Results
Our mathematical model indicated that ID– rats exhibited a nearly 6-fold decrease in liver VA secretion and >4-fold reduction in whole-body VA utilization, compared with CN rats, whereas these perturbed kinetic behaviors were notably corrected in ID+ rats, close to those from the CN group.
Conclusions
Iron repletion can remove the inhibitory effect that iron deficiency exerts on hepatic mobilization of VA and restore retinol kinetic parameters to values similar to that of never-deficient CN rats. Together with improvements in iron and VA indices, our results suggest that restoration of an iron-adequate diet is sufficient to improve VA kinetics after a previous state of iron deficiency.
Keywords: iron deficiency, iron repletion, vitamin A metabolism, interaction between iron and vitamin A, WinSAAM, compartmental model, vitamin A mobilization, vitamin A utilization, animal model, hyporetinolemia
See corresponding article on page 1989.
Introduction
Model-based compartmental analysis, combined with tracer kinetic techniques, has been used to study the metabolism of a variety of substances, including cholesterol, glucose, zinc, and calcium, in both human and animal subjects (1–6). In addition, compartmental analysis has been recognized as a powerful tool to understand vitamin A (VA) kinetics under different physiological conditions and life stages (7–12).
More specifically, to better understand the possible interactions between iron and VA metabolism, model-based compartmental analysis has been used in previous studies to investigate the impact of iron deficiency on VA metabolism in rats (13). Results have indicated that iron deficiency caused a sequestration of VA in the liver and a reduction in serum retinol, perhaps due to inhibited liver secretion of VA in iron deficiency.
In the current study, we used model-based compartmental analysis to further explore the effect of iron status on VA metabolism and kinetics in a rat model. We hypothesized that improved iron status, through restoration of a diet containing adequate dietary iron, can correct the perturbed VA kinetic behaviors in rats with pre-existing iron deficiency. In other words, we hypothesized that iron repletion can halt the hepatic sequestration of VA and activate its export from the liver, which in turn can further improve the plasma VA status. In our companion article, we have shown that plasma retinol reduction and hepatic VA sequestration induced by iron deficiency can be improved by dietary iron repletion in rats (14). The purpose of our detailed kinetic study was to explore the specific physiological changes in VA metabolism that are responsible for the corrective effects of iron repletion on perturbed VA status. Results from the current study could contribute to a better understanding of the potential interactions between VA metabolism and iron status at the whole-body level as well as at the specific organ level. Moreover, results may also serve as a starting point to further investigate the underlying mechanism of the observed interactions between these 2 essential micronutrients of public health concern.
Methods
Animals and diets
Briefly, lactating Sprague-Dawley rats with 10 pups each (Charles River Laboratory) were fed a modified VA marginal (0.35 mg retinol equivalents/kg diet) AIN93G diet (Research Diets) (15) that contained a normal concentration of iron (35 mg iron equivalents/kg diet). This VA content in our customized diet was based on our previous experience that this amount was able to maintain the rat body VA status in a marginal condition over a long period of time. After weaning, pups were randomly assigned to 2 dietary groups: the VA marginal diet (control group [CN]; n = 10) or a VA marginal but iron-deficient diet (3 mg iron equivalents/kg diet, iron-deficient group [ID–]; n = 14). A pair-feeding approach, as described by Rosales et al. (16), was used to guarantee that body weight gain and VA intake were the same level between groups. All the animal protocols were approved by the Institutional Animal Use and Care Committee of The Pennsylvania State University.
Preparation of 11, 12-[3H]retinol-labeled emulsion
The dose preparation method was modified from the approach developed by Green et al. (17) and described in (14). Briefly, a known amount of 11, 12-[3H]retinol (Perkin-Elmer) was dissolved in Tween 20 (Sigma-Aldrich) and PBS (Mediatech) to make the injection emulsion, which contained ∼16.7 μCi/mL.
Kinetic studies
After 5 wk of dietary treatment, 4 rats from each group were euthanized on day 0 to determine baseline concentrations of iron and VA in serum and liver. The remaining rats (n = 6 for CN, n = 10 for ID–) were anesthetized and administrated with [3H]retinol-labeled emulsion (0.1 mL/100 g body weight), through tail vein catheterization, to initiate the kinetic study. Anesthesia was removed after injection and rats remained on their assigned diet after dose administration. On day 21, half the rats in the ID– group (n = 5) were switched to the VA marginal diet that contained a normal amount of iron (iron-repletion group [ID+]).
Blood samples were collected from each rat via the tail vein at 34 time points from 12 min until 92 d after dosing. Plasma was separated and frozen until analysis. After the final tail vein bleeding on day 92, rats were euthanized with CO2; the liver and spleen were collected and stored at –80°C, and plasma was separated and stored at –20°C until analysis. Results for the biochemical analysis of iron and VA in plasma and tissues at baseline and the end of the study are presented in (14).
Radioactivity measurement
Tracer concentration in plasma samples (20–300 μL) was measured by liquid scintillation spectrometry (Beckman Coulter) to a 2-sigma error of 1% or for a maximum of 200 min, using Scintiverse (Fisher Chemical) as scintillation fluid, as described earlier (11).
Kinetic data calculations
The fraction of the injected dose in plasma (FDp) at each sampling time for each rat was calculated as radioactivity (dpm) in plasma divided by dpm injected. Plasma radioactivity was calculated from the measured tracer concentration in plasma × estimated plasma volume, where plasma volume was estimated as 0.035 mL/g body weight. The total radioactivity administered to each rat was calculated based on the measured dpm/mL in the injected emulsion × injected volume; a correction was applied to each dose based on the radioactivity remaining in the needle and catheter used for injection. The geometric mean of FDp at each sampling time for each group was calculated and used in mathematical modeling.
Model development and kinetic parameters
The Windows version of the Simulation, Analysis, and Modeling software (WinSAAM) was used to analyze plasma retinol kinetic data in light of the compartmental model shown in Figure 1 (18). This model was adapted from 1 previously developed to describe VA kinetics in ID– rats (13).
FIGURE 1.
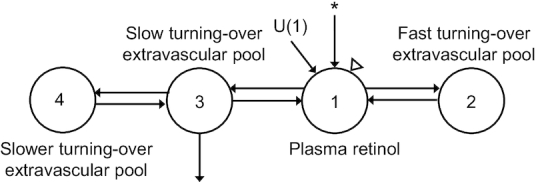
Compartmental model describing vitamin A kinetics. Model is adapted from a previous study (13). Compartments are represented by circles, the asterisk indicates the site of injection of [3H]retinol-labeled plasma, the triangle indicates the site of sampling, and U(1) indicates the input of retinol to plasma from the diet.
Plasma tracer response data (geometric mean FDp compared with time for each group) and initial estimates for the fractional transfer coefficients [L(I, J)s] and initial conditions adopted from the previous model were then entered into a WinSAAM input file; a fractional SD (FSD) of 0.1 was assigned to the plasma data as a weighting factor. During the modeling process, the values for model parameters and the model structure were adjusted to obtain a close fit between the observed data and model-predicted values based on visual inspection. We developed nonsteady state growth models for each group (CN, ID–, and ID+) to reflect changes in VA kinetics resulting from animal growth and altered iron status. The model for the ID– group was developed using data from rats fed an iron-deficient diet, which was 10 rats up to day 21 and then 5 rats from day 21 to day 92; for the ID+ group, parameters were the same until day 21 and then based on data for 5 rats that were switched to the iron-replete diet after day 21. Once satisfactory fits were obtained for each group, nonlinear regression analysis was performed in WinSAAM to determine final values for the L(I, J)s and their statistical uncertainties. Parameters were considered well-identified if their FSD was <0.2. Model-predicted compartment mass and other related parameters, such as transfer rates [R(I, J)s] and disposal rate, were determined (17).
Results
Plasma retinol tracer kinetics
The geometric mean of the FDp for the 3 groups are plotted in Figure 2. Note that rats in the ID– and ID+ groups received the same dietary treatment for the first 21 d after dose administration so their data were combined during this period (Figure 2A, B). Curves for the combined ID– rats bent at a higher point than CN rats after day 1, which may indicate a more rapid recycling of tracer to plasma. Once iron repletion was started on day 21, the curve for the ID+ group started to diverge from the ID– rats, suggesting that there was a higher tracer concentration in plasma for ID+ rats (Figure 2C).
FIGURE 2.
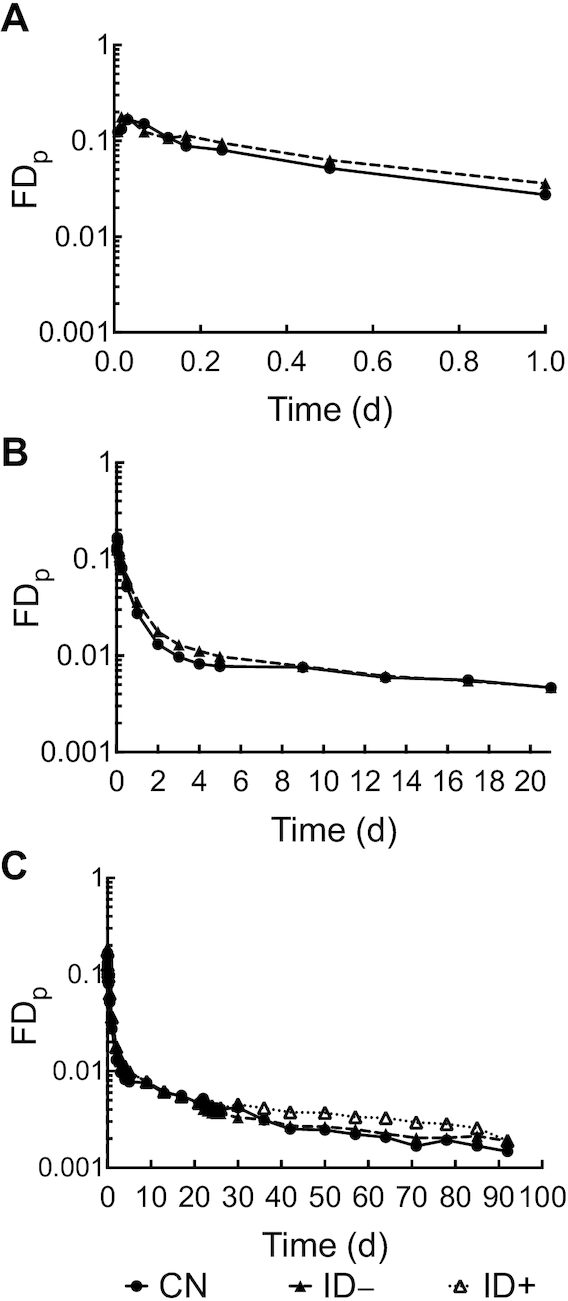
Fraction of injected dose in plasma compared with time (d) after intravenous injection of 3H-labeled retinol emulsion in rats. (A) The short-term plot (1 d), (B) the medium-term plot (21 d), and (C) the long-term plot (92 d). Data are presented as group geometric mean, n = 5–6 rats/group. CN, control group; FDp, fraction of injected dose in plasma; ID–, iron-deficient group; ID+, iron-repletion group.
Model development for tracer and parallel tracee model
Since rats were growing and iron status was changing over the duration of this study, we assumed nonsteady state conditions for modeling, using both tracer data to develop a model for labeled retinol and tracee data for VA masses measured in various tissues as a parallel model. The working model for the tracer (Figure 3) is a 6-compartment model in which compartment 11 represents the site of entry for 3H-labeled retinol and the flow from compartment 11 to compartment 12 represents liver processing of the injected dose, which is similar to hepatic uptake and processing of chylomicron remnants. Loss from compartment 12 represents biliary secretion from the liver to the digestive tract. Movement from compartment 12 to compartment 1 represents hepatic secretion of retinol bound to retinol-binding proteing (RBP) into the plasma pool, whereas compartments 2, 3, and 4 represent extravascular pools that exchange VA with plasma retinol rapidly (compartment 2), more slowly (compartment 3), and even more slowly (compartment 4). Irreversible loss (VA utilization) from the system is from compartment 4. The parallel tracee model (Figure 4) is a simplified 4-compartment model that does not include compartments for injection of tracer or for liver processing. Since unlabeled VA is assumed to have the same kinetic behavior as the tracer, fractional transfer coefficients in the tracee model were set up as dependent variables that had the same value as corresponding parameters in the tracer model.
FIGURE 3.

Proposed 6-compartment model for vitamin A tracer kinetics in rats. Compartments are represented by circles, arrows indicate the transfer of tracer material from 1 compartment into another compartment. The asterisk indicates the site of 3H-labeled retinol emulsion injection, U(1) indicates the dietary input of retinol into plasma, and the triangle indicates the site of sample collection.
FIGURE 4.
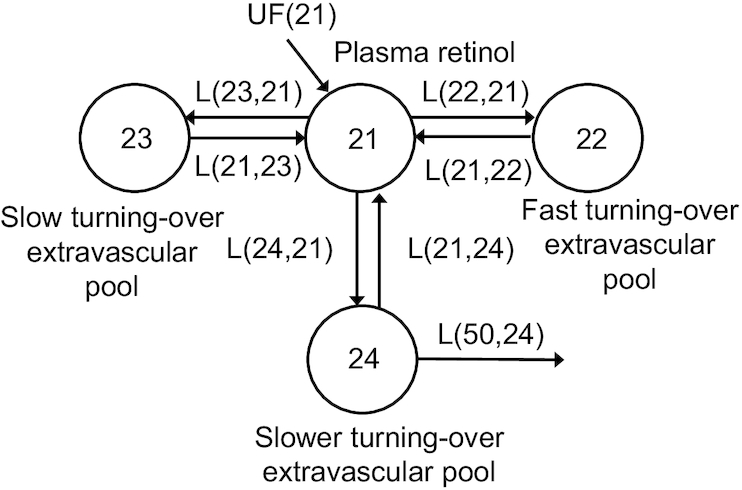
Proposed 4-compartment model for vitamin A tracee kinetics in rats. Compartments are represented by circles, arrows indicate the transfer of tracee material from 1 compartment into another compartment. The UF(21) indicates the constant input of dietary vitamin A into the system.
With the understanding that different groups were under different physiological conditions, we used different strategies to develop the model for each group. Specifically, for CN rats, although both plasma retinol concentrations and liver VA mass (Figure 5B) were relatively constant over time, the plasma retinol pool size increased with time due to body weight gain (and thus an increase in plasma volume) (Figure 5C). For ID– rats, as iron deficiency developed, the model accounted for a continuously increasing liver VA mass as well as an increase in plasma VA mass that was relatively smaller compared with CN and ID+ rats (Figure 5B, C). Indeed, ID– rats showed the slowest increase of liver VA mass and, at the end of the study, had the lowest estimated plasma VA mass compared with CN and ID+ rats. By contrast, plasma VA mass was comparable in the ID+ and ID– rats for the first 21 d, then it increased more rapidly in the ID+ group, reaching a final estimate that was closer to the value for the CN group. The CN group, in contrast to ID- and ID+ rats, exhibited a fairly constant increase in the mass of VA in the plasma pool, and this mass remained at the highest concentration among all 3 groups throughout the study. For the ID+ rats from day 21 when iron repletion was initiated, we hypothesized that repletion can lead to increased mobilization of VA from the liver, along with increased VA utilization because of an elevated plasma VA concentration in the ID+ rats. Therefore, L(1,4) and L(30,4) (Figure 6A, 7A), representing the fractional transfer of hepatic VA to plasma and fractional irreversible loss of VA from the body, respectively, were set up as dependent variables with values that changed after 21 d using quadratic equations. The final model exhibited a good fit to the tracer data and it successfully predicted an increase in liver VA mass before iron repletion with subsequent reduction, presumably related to improved iron status due to iron repletion (Figure 5).
FIGURE 5.

Fit of model-predicted value and observed data compared with time (d) after intravenous injection of 3H-labeled vitamin A emulsion in rats. (A) Fit of tracer model from plasma view, (B) fit of liver corresponded tracee model, and (C) fit of plasma corresponded tracee model. Data points are presented as group geometric mean, n = 5–6 rats/group. Lines represent model-predicted value. CN, control group; FDp, fraction of injected dose in plasma; ID–, iron-deficient group; ID+, iron-repletion group; VA, vitamin A.
FIGURE 6.
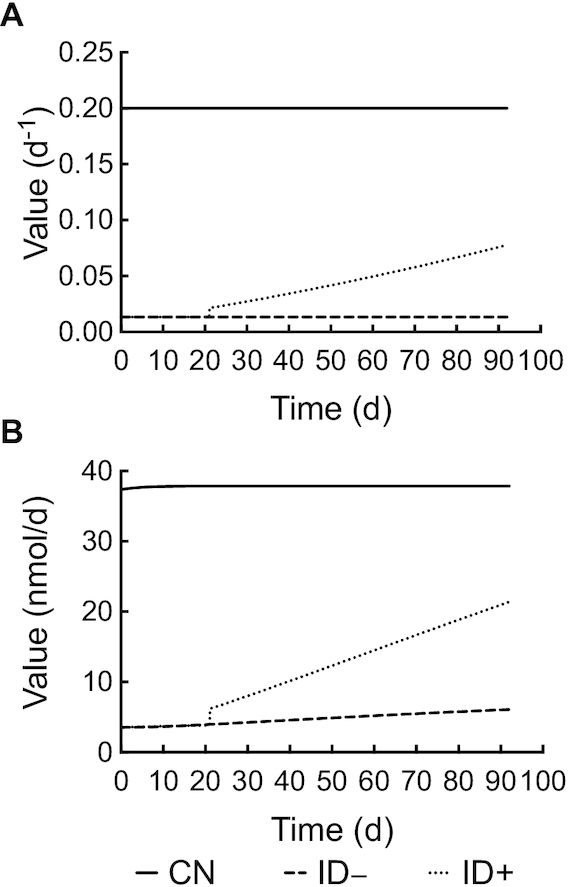
Model-calculated parameter value compared with time (d) after intravenous injection of 3H-labeled vitamin A emulsion in rats. (A) Model-calculated L(1,4) value over time and (B) model-calculated R(1,4) value over time. CN, control group; ID–, iron-deficient group; ID+, iron-repletion group.
FIGURE 7.
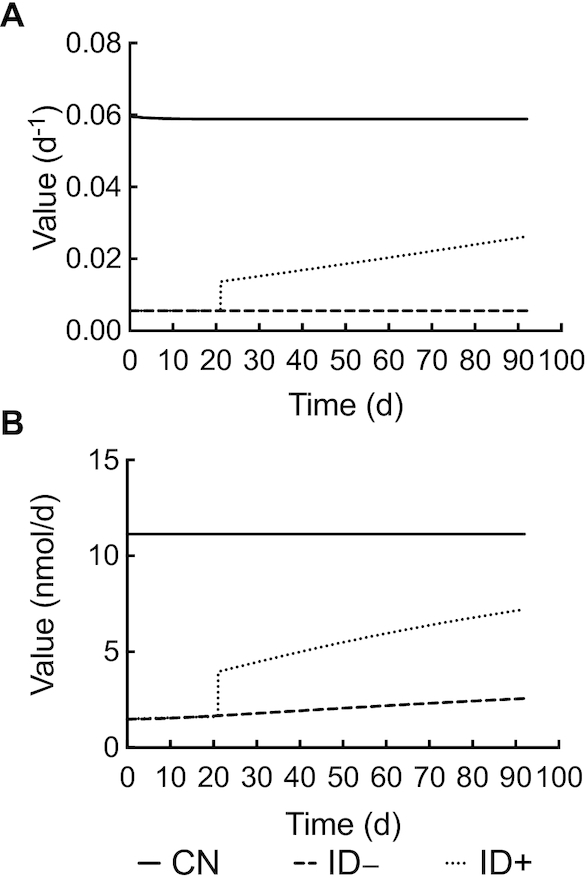
Model-calculated parameter value compared with time (d) after intravenous injection of 3H-labeled vitamin A emulsion in rats. (A) Model-calculated L(30,4) value over time and (B) model-calculated R(30,4) value over time. CN, control group; ID–, iron-deficient group; ID+, iron-repletion group.
Model-derived kinetic parameters
Kinetic parameters of interest are shown in Table 1. Results showed that L(1,2), the turnover of VA from the fast turning-over extravascular pool to plasma each day, and L(1,3), the turnover from the slower turning-over pool, were >2-fold greater in ID– rats than in CN rats, indicating a more rapid initial turnover of VA into plasma, which was also indicated by the higher tracer level after the first peak in the plasma tracer response curve (Figure 2). On the contrary, the value for L(1,4), corresponding to the hepatic secretion of retinol into plasma, was >15 times higher in CN than ID– rats. In the case of ID+ rats, L(1,4) was time-dependent, gradually increasing as iron repletion progressed (Figure 6A). The model-calculated values for R(1,4), shown in Figure 6B for the 3 groups, represented the VA mass transferred from compartment 4 to compartment 1 each day, calculated as the mass of compartment 4 × L(1,4). The daily output of VA from the liver in ID– rats increased gradually as a result of the continuous accumulation of liver VA; however, with an almost 20 times smaller L(1,4), the highest liver secretion of VA in ID– rats was less than one-fifth of that in the CN rats (6.08 compared with 37.87 nmol/d). In contrast, for the ID+ rats, although their liver VA storage gradually declined after iron repletion began, the elevation in L(1,4) in this group indicates that the mobilization of VA from their liver kept increasing over time. At the end of the study, the transfer of VA from compartment 1 to compartment 4, R(1,4), in ID+ rats reached nearly 60% of the rate in CN rats (21.38 compared with 37.87 nmol/d), and was >300% of the rate in the ID– group (21.38 compared with 6.08 nmol/d).
TABLE 1.
Fractional transfer coefficients for the 6-compartment models of vitamin A metabolism in CN, ID–, and ID+ rats1
| Value (FSD)3 | |||
|---|---|---|---|
| L(I,J)2 | CN (day−1) | ID– (day−1) | ID+ (day−1) |
| L(1,2) | 9.69 (0.09) | 23.19 (0.06) | 23.19 |
| L(1,3) | 0.091 (0.05) | 0.249 (0.03) | 0.2489 |
| L(1,4), before day 21 | 0.200 (0.01) | 0.013 (0.02) | 0.013 |
| L(1,4), after day 21 | 0.200 (0.01) | 0.013 (0.02) | L(1,4) = -P(1)*T*T + P(2)*T + P(3)5 |
| L(30,4), before day 21 | 11.13/F244 | 0.006 (0.04) | 0.006 |
| L(30,4), after day 21 | 11.13/F244 | 0.006 (0.04) | L (30,4) = -P(5)*T*T + P(6)*T + P(7)5 |
CN, control group; ID–, iron-deficient group; ID+, iron-repletion group.
L(I, J)s represent the fraction of vitamin A in compartment J that is transferred to compartment I each day, data shown here are model-predicted values of each parameters with model-estimated FSDs in parentheses.
FSD, fractional SD.
F24 is the model-predicted compartment mass for compartment 24.
Two quadratic equations define L(1,4) and L (30, 4) as time-dependent variables, where P(1), P(2), P(3), P(5), P(6), and P(7) are 2.23 × 10⁻⁶, 5.42 × 10⁻⁴, 8.99 × 10⁻³, 1.72 × 10⁻⁷, 1.57244 × 10⁻⁴, and 1.03 × 10⁻², respectively. T, time (d) after dosing.
Another interesting physiological parameter is the VA disposal rate, which is indicated by the rate of irreversible utilization of VA and is represented by R(30,4) in our model, and the fractional irreversible loss of VA mass from the body, represented by L(30,4) in our model. Based on conventional wisdom (19–21), it is assumed that utilization is tightly controlled and that it changes only if plasma retinol concentrations change. Thus, we made R(30,4) constant in CN rats, with L(30,4) thus varying over a small range because the pool size was nearly constant in this group, as shown in Figure 5B. In ID+ rats, another quadratic equation was used to characterize the change in L(30,4) after iron repletion. The model-calculated value for L(30,4) in ID+ rats is shown in Figure 7A. Although L(30,4) decreased slightly over time in CN rats, it was still >10 times higher than that in ID– rats (0.0589 compared with 0.0056). After iron repletion (day 21), L(30,4) in the ID+ group started to increase and reached a final value at about half of that in CN rats (0.0262 compared with 0.0589) and nearly 5 times higher than that in ID– rats (0.0262 compared with 0.0056). Results for R(30,4) over time in the 3 groups are plotted in Figure 7B. This parameter increased >1.7 times in ID– rats throughout the study, which is consistent with the nearly 2-fold increase in liver VA mass, but the final value for R(30,4) was still >75% lower than in CN rats (2.56 compared with 11.13 nmol/d). On the other hand, R(30,4) in ID+ rats increased more rapidly after iron repletion due to the large and continuous increase in L(30,4), which overrode the effect of decreased VA mass in the storage pool. The final value of R(30,4) in ID+ rats was 7.21 (nmol/d), between that for CN and ID– rats but closer to the value for the CN group.
Discussion
By applying model-based compartmental analysis to the tracer response profile in plasma, along with quantitative results for VA concentration and mass obtained from biochemical measures, we developed models for the labeled tracer in company with parallel models for the tracee, to describe the VA kinetics in all 3 groups of rats. A satisfactory fit of our models to the data was obtained in each case as shown in Figure 5. Firstly, when comparing the geometric mean of the plasma tracer response data, FDp, we noticed a higher value in the ID– group in comparison to the CN rats from 1 to 5 d. From previous reports, the FDp at those early time points represents the recycling of VA from the extravascular pools to plasma, which is directly associated with liver VA status (20, 21). Therefore, this higher FDp in ID– rats suggested a more rapid turnover of VA from the extravascular pools to plasma compared with the turnover in CN rats, and usually would have indicated a relatively lower liver VA storage. However, from the biochemical measures, the actual amount of VA residing in the liver was greater than CN rats. In this scenario, we speculate that although more VA accumulated in the liver of ID– rats, its utilization or mobilization was somehow blocked due to the poor iron status. Therefore, even though the absolute VA mass present in the liver of the ID– rats was higher, its existence could not be effectively detected/sensed by the body because of the restricted availability.
Next, as well as the tracer model, the tracee model successfully predicted the dynamic changes in VA mass in plasma and liver, and thus supported our hypothesis. Our model predicted gradual increases in VA mass in the plasma pool in all 3 groups of rats (Figure 5C). With the significantly reduced plasma retinol concentration in ID– rats, this group exhibited the lowest plasma VA mass from model prediction. In contrast, although rats in the ID+ and ID– groups were by design essentially identical at the start of the iron-repletion period, the plasma retinol concentration in the ID+ group increased to a level similar to the CN group at the end of the study after dietary iron repletion; thus, the elevated plasma retinol concentration, in addition to the expansion in plasma volume, served as a stronger driving force for the greater increase in total VA mass in the plasma of the ID+ group compared with the ID– group.
Although the model showed a constant increase in plasma VA mass in the CN rats, model-predicted liver VA mass in the CN group barely changed throughout the study, indicating these rats were in a state of VA balance. This result was in agreement with our experience that under normal physiological conditions, the consumption of a “VA marginal” diet is sufficient to maintain body VA status in a balanced state for rats with adequate preloaded liver VA storage (20). On the contrary, for ID– rats, the model predicted a continuous accumulation of hepatic VA mass, suggesting a limited mobilization of hepatic VA into the plasma, which could be responsible for the lower plasma retinol concentration in these ID– rats. More interestingly, in agreement with our hypothesis that the constraint causing liver sequestration of VA would be removed with improved body iron status in ID+ rats, our model predicted a parabola-like curve to describe the dynamic change in liver VA mass in ID+ rats. In more detail, this model prediction included an early increasing period corresponding to the iron-deficient status, similar to what we observed in the ID– rats, and a later decline phase in response to iron repletion (Figure 5B). It is noteworthy that, based on the model prediction, the decrease in liver VA mass did not occur simultaneously with the initiation of iron repletion, but rather took some time. Accumulation of liver VA in ID+ rats continued but at a slower rate for about another 3–4 wk before accumulation started to decline. This delay in liver VA kinetics in response to iron repletion was consistent with the time needed for rats to fully recover from their iron deficiency by dietary iron repletion (22), which suggested that completely restored iron status was required to effectively and efficiently stimulate the hepatic mobilization of VA. Moreover, for all the tracee models of the liver compartment in these 3 groups of rats, model-estimated values matched nearly perfectly with our analytical results, suggesting that model-based compartmental analysis is a powerful and reliable tool for body VA storage estimation.
From our model-predicted results (Figure 6), compared with CN rats, ID– rats exhibited large-scale decreases in L(1,4) and R(1,4), indicating that abnormal iron status would inhibit liver VA secretion, which would further lead to overaccumulation of liver VA and suboptimal plasma VA status. On the contrary, continuous increases in L(1,4) and R(1,4) were observed in ID+ rats after the initiation of iron repletion, ending with final values that were >3-fold greater than for ID– rats and closer to the values for CN rats. Since dietary iron content was the only experimental variable for ID+ rats before and after iron repletion, changes in L(1,4) and R(1,4) must directly reflect the impact of dietary iron intake and related changes in iron status on the mobilization of VA from the liver into plasma. In other words, when fed a diet replete with dietary iron, ID+ rats were released from the hepatic sequestration of VA and were able to upregulate its secretion from the liver into plasma, which in turn facilitated the normalization of plasma retinol concentration.
Parameters describing the irreversible loss/utilization of VA were also regulated in response to body iron status. In CN rats, the fractional irreversible loss of VA mass from the body (L[30,4]) was fairly constant, along with the unchanged rate constant R(30,4), both remained the highest value among the 3 experimental groups. These model predictions were in agreement with our knowledge of VA metabolism, wherein the body senses the plasma retinol concentration as a signal of its VA status, and further adjusts the metabolism/utilization of VA accordingly (20, 21). Thus, with the well-controlled plasma retinol concentration in CN rats, VA utilization was very stable. In comparison, the utilization of VA in ID– rats was downregulated as plasma retinol became lower. Repletion of these rats with dietary iron reversed this impairment and the plasma retinol concentration increased. This suggests that improved plasma VA status may be recognized by the body as a positive signal to upregulate VA utilization to its normal steady state.
In conclusion, by applying tracer kinetics and model-based compartmental analysis, our study demonstrated that iron deficiency caused a continuous accumulation of VA in the liver storage pool along with a reduction in the plasma retinol pool, even when the content of VA in the diet was adequate to maintain a steady state in the absence of iron deficiency. This phenomenon was associated with a dramatic decrease in the hepatic mobilization of VA and a downregulation of whole-body VA utilization. When dietary iron was reintroduced at an adequate concentration, these conditions were reversed: the secretion of VA from the liver increased, which in turn restored the plasma retinol concentration and reactivated whole-body VA utilization. These findings suggest that iron deficiency produces a “false negative signal” of body VA status, perturbing whole-body VA kinetics in a way that is similar to changes observed under suboptimal VA conditions, and that this abnormality of VA kinetics can be effectively reversed through dietary iron repletion.
Acknowledgments
The authors’ responsibilities were as follows—YL: designed and conducted research, analyzed data, and wrote the manuscript; C-HW conducted research; MHG: assisted with data analysis and interpretation; ACR: designed research and has primary responsibility for the final content; and all authors: read and approved the final manuscript.
Notes
Supported by The Pennsylvania State University Graduate Program in Nutritional Sciences and NIH HD-066982.
Author disclosures: The authors report no conflicts of interest.
Abbreviations used: CN, control group; FDp, fraction of the injected dose in plasma; FSD, fractional SD; ID–, iron-deficient group; ID+, iron-repletion group; VA, vitamin A; WinSAAM, Windows version of the Simulation, Analysis, and Modeling software.
Contributor Information
Yaqi Li, Department of Nutritional Sciences, The Pennsylvania State University, University Park, PA, USA.
Cheng-Hsin Wei, Molecular Pharmacology Program and Cancer Research Technology Program, Frederick National Laboratory for Cancer Research, Frederick, MD, USA.
Michael H Green, Department of Nutritional Sciences, The Pennsylvania State University, University Park, PA, USA.
A Catharine Ross, Department of Nutritional Sciences, The Pennsylvania State University, University Park, PA, USA.
References
- 1. Birge SJ, Peck WA, Berman M, Whedon GD. Study of calcium absorption in man: a kinetic analysis and physiologic model. J Clin Invest. 1969;48(9):1705–13. [DOI] [PMC free article] [PubMed] [Google Scholar]
- 2. Lowe NM, Shames DM, Woodhouse LR, Matel JS, Roehl R, Saccomani MP, Toffolo G, Cobelli C, King JC. A compartmental model of zinc metabolism in healthy women using oral and intravenous stable isotope tracers. Am J Clin Nutr. 1997;65(6):1810–9. [DOI] [PubMed] [Google Scholar]
- 3. Miller LV, Krebs NF, Hambidge KM. A mathematical model of zinc absorption in humans as a function of dietary zinc and phytate. J Nutr. 2007;137(1):135–41. [DOI] [PMC free article] [PubMed] [Google Scholar]
- 4. Smith FR, Dell RB, Noble RP, Goodman DS. Parameters of the three-pool model of the turnover of plasma cholesterol in normal and hyperlipidemic humans. J Clin Invest. 1976;57(1):137–48. [DOI] [PMC free article] [PubMed] [Google Scholar]
- 5. Goodman DS, Deckelbaum RJ, Palmer RH, Dell RB, Ramakrishnan R, Delpre G, Ramakrishnan R, Delpre G, Beigel Y, Cooper M. Cholesterol turnover and metabolism in two patients with abetalipoproteinemia. J Lipid Res. 1983;24(12):1605–11. [PubMed] [Google Scholar]
- 6. Duarte JM, Morgenthaler FD, Lei H, Poitry-Yamate C, Gruetter R. Steady-state brain glucose transport kinetics re-evaluated with a four-state conformational model. Front Neuroenergetics. 2009;1:6. [DOI] [PMC free article] [PubMed] [Google Scholar]
- 7. Lewis KC, Green MH, Underwood BA. Vitamin A turnover in rats as influenced by vitamin A status. J Nutr. 1981;111(7):1135–44. [DOI] [PubMed] [Google Scholar]
- 8. Cifelli CJ, Green JB, Wang Z, Yin S, Russell RM, Tang G, Green MH. Kinetic analysis shows that vitamin A disposal rate in humans is positively correlated with vitamin A stores. J Nutr. 2008;138(5):971–7. [DOI] [PubMed] [Google Scholar]
- 9. Kelley SK, Nilsson CB, Green MH, Green JB, Hakansson H. Mobilization of vitamin A stores in rats after administration of 2,3, 7,8-tetrachlorodibenzo-p-dioxin: a kinetic analysis. Toxicol Sci. 2000;55(2):478–84. [DOI] [PubMed] [Google Scholar]
- 10. Gieng SH, Green MH, Green JB, Rosales FJ. Model-based compartmental analysis indicates a reduced mobilization of hepatic vitamin A during inflammation in rats. J Lipid Res. 2007;48(4):904–13. [DOI] [PubMed] [Google Scholar]
- 11. Tan L, Wray AE, Green MH, Ross AC. Retinol kinetics in unsupplemented and vitamin A-retinoic acid supplemented neonatal rats: a preliminary model. J Lipid Res. 2014;55(6):1077–86. [DOI] [PMC free article] [PubMed] [Google Scholar]
- 12. Hodges JK, Tan L, Green MH, Ross AC. Vitamin A supplementation increases the uptake of chylomicron retinyl esters into the brain of neonatal rats raised under vitamin A-marginal conditions. J Nutr. 2016;146(9):1677–83. [DOI] [PMC free article] [PubMed] [Google Scholar]
- 13. Jang JT, Green JB, Beard JL, Green MH. Kinetic analysis shows that iron deficiency decreases liver vitamin A mobilization in rats. J Nutr. 2000;130(5):1291–6. [DOI] [PubMed] [Google Scholar]
- 14. Li Y, Wei C-H, Xiao X, Green MH, Ross AC. Perturbed vitamin A status induced by iron deficiency was corrected by iron repletion in rats. J Nutr. 2019. [DOI] [PMC free article] [PubMed] [Google Scholar]
- 15. Reeves PG, Nielsen FH, Fahey GC Jr. AIN-93 purified diets for laboratory rodents: final report of the American Institute of Nutrition ad hoc writing committee on the reformulation of the AIN-76A rodent diet. J Nutr. 1993;123(11):1939–51. [DOI] [PubMed] [Google Scholar]
- 16. Rosales FJ, Jang JT, Pinero DJ, Erikson KM, Beard JL, Ross AC. Iron deficiency in young rats alters the distribution of vitamin A between plasma and liver and between hepatic retinol and retinyl esters. J Nutr. 1999;129(6):1223–8. [DOI] [PubMed] [Google Scholar]
- 17. Green MH, Green JB. Experimental and kinetic methods for studying vitamin A dynamics in vivo. Methods Enzymol. 1990;190:304–17. [DOI] [PubMed] [Google Scholar]
- 18. Wastney ME. Investigating Biological Systems using Modeling: Strategies and Software. San Diego: Academic Press; 1999. xiv, p. 382. [Google Scholar]
- 19. Kelley SK, Green MH. Plasma retinol is a major determinant of vitamin A utilization in rats. J Nutr. 1998;128(10):1767–73. [DOI] [PubMed] [Google Scholar]
- 20. Green MH, Green JB. Vitamin A intake and status influence retinol balance, utilization and dynamics in rats. J Nutr. 1994;124(12):2477–85. [DOI] [PubMed] [Google Scholar]
- 21. Green MH, Green JB, Lewis KC. Variation in retinol utilization rate with vitamin A status in the rat. J Nutr. 1987;117(4):694–703. [DOI] [PubMed] [Google Scholar]
- 22. Beard JL, Burton JW, Theil EC. Purified ferritin and soybean meal can be sources of iron for treating iron deficiency in rats. J Nutr. 1996;126(1):154–60. [DOI] [PubMed] [Google Scholar]