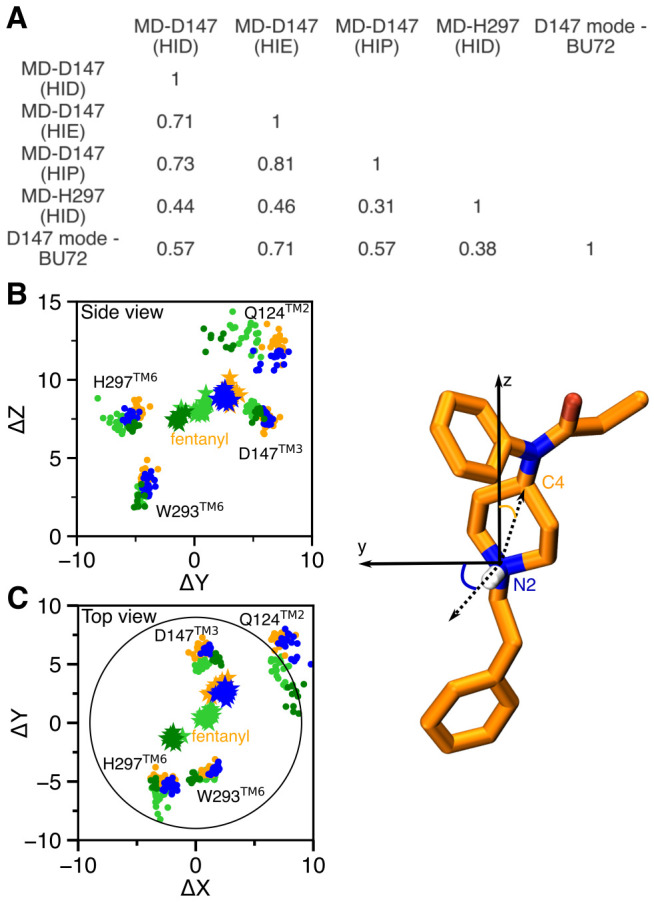
Figure 5. Contact similarity and spatial relationship between the D147- and H297-binding modes.

A. Tanimoto coefficients (Tc) calculated using the binary contacts (details see Methods and Protocols). Tc ranges from 0 to 1, where 1 indicates identical mOR residues are involved in fentanyl binding in both simulations. B, C. Locations of fentanyl (stars) and critical amino acids (circles) plotted on the (Y,Z) and (X,Y) planes. A data points are sampled every 10 ns. The center of mass of mOR is set to origin. The data from MD-D147(HID), MD-D147(HIE), and MD-D147(HIP) are colored light green, orange, and blue, respectively, while the data from MD-H297(HID) are colored dark green. The z axis is the membrane normal, while the x axis is defined by the N2-H vector.
