

Abstract
The present study aimed to evaluate the value of serum amyloid A (SAA) in coronavirus disease 2019 (COVID-19) and compared the efficacy of SAA and C-reactive protein (CRP) in predicting the severity and recovery of COVID-19. A retrospective study was conducted on COVID-19 patients hospitalized in Wuhan No. 1 Hospital (Hubei, China) from January 21, 2020 to March 4, 2020. A two-way ANOVA analysis was used to compare the serum CRP and SAA levels between mild group and severe group during hospitalization days. Linear regression was used to analyze the relationship between the serum CRP, SAA levels and treatment days in recovered patients. The Logistic regression analysis and the area under curve (AUC) were calculated to determine the probability for predicting the severity and recovery of COVID-19. The severe group displayed higher CRP and SAA levels compared with the mild group during hospitalization (P<0.001). Logistic regression indicated that SAA and CRP were independent risk factors for the severity of COVID-19. The corresponding AUC of CRP and SAA values for severity of COVID-19 were 0.804 and 0.818, respectively. Linear regression analysis revealed that CRP and SAA levels were negatively correlated with treatment days in recovered patients (r=-0.761, -0.795, respectively). Logistic regression demonstrated that SAA was an independent factor for predicting the recovery of COVID-19. However, CRP could not predict the recovery of COVID-19. The corresponding AUC of SAA for the recovery of COVID-19 was 0.923. The results of the present study indicated that SAA can be considered to be a biomarker for predicting the severity and recovery of COVID-19.
Keywords: coronavirus disease 2019, severe acute respiratory syndrome coronavirus 2, serum amyloid A, C-reactive protein
Introduction
The current study outlines an outbreak of severe acute respiratory syndrome coronavirus 2 (SARS-CoV-2) infection caused the coronavirus disease 2019 (COVID-19) that was firstly reported in Wuhan, Hubei Province, China. COVID-19 rapidly spread to other cities in China and across the world subsequent to the initial outbreak (1,2). On January 30, 2020, the International Health Regulations Emergency Committee of World Health Organization (WHO) declared that the epidemic caused by the new coronavirus had become a ‘public health emergency of international concern’ (3). WHO subsequently declared a pandemic as the number of infections increased exponentially around the world.
As of April 3, 2020, the number of confirmed COVID-19 infections worldwide was 972,303 and number of deaths was 50,322, with a total of 213,600 confirmed cases and 4,793 deaths being reported in the United States of America (4). Currently, with the rapid spread of COVID-19 around the world, researchers are rapidly increasing the development of vaccines and screening of effective therapeutic drugs (5,6). Despite this, the number of new cases and deaths is still increasing with the evolution of the outbreak. The cytokine storm, which can lead to acute respiratory distress syndrome (ARDS) or multiple-organ failure, is an important factor that causes COVID-19 exacerbation or mortality (7). It is particularly important to diagnosis COVID-19 early and identify biomarkers that can predict the severity and recovery of the disease.
Serum amyloid A (SAA) is a plasma component and the precursor of amyloid. SAA is an acute-phase protein and is mainly produced by the liver in response to proinflammatory cytokines that are secreted by the activated monocytes (8). SAA serves an important role in inflammation and relates to the severity of inflammation (8). Yip et al (9) suggested that SAA could monitor the extent of pneumonia in severe acute respiratory syndrome (SARS) using protein chip array profiling. Currently, there are few reports about the relationship between SAA and COVID-19. The aims of the present study were to evaluate the value of SAA in COVID-19, and compare the efficacy of SAA and C-reactive protein (CRP) in predicting the severity and recovery of COVID-19.
Materials and methods
Patients and study design
The study was reviewed and approved by Institutional Review Board of Wuhan No.1 Hospital. The participants in the retrospective study were patients diagnosed with COVID-19 at Wuhan No.1 Hospital located in the Qiaokou District. Data were collected from patients hospitalized from January 21, 2020 to March 4, 2020. Upon admission, the patients were diagnosed with COVID-19 using reverse transcription-quantitative (RT-q) PCR, according to WHO guidance (10). During hospitalization, 3 ml fasting venous blood was collected in the morning, and the serum sample was separated via high-speed centrifugation at room temperature for 10-15 min at 2,000 x g. The serum CRP and SAA levels were measured via immunoturbidimetry using a Siemens BN-II analyzer (Siemens Healthineers) and immunofluorescence chromatography using an AFS2000A analyzer (Henan Wayray Biotech Co., Ltd.), respectively. The inclusion criteria were as follows: i) A positive COVID-19 nucleic acid test; ii) A lung CT exhibiting multiple patchy ground glass shadows or other typical manifestations of both lungs; iii) Serum CRP and SAA levels detected at least three times during hospitalization. The exclusion criteria were as follows: i) Positive tests for other pathogens such as Tuberculosis, Mycoplasma; ii) Those diagnosed with autoimmune disorders; iii) Those diagnosed with arthritic diseases; iv) Cancer patients and those with severe underlying diseases; v) Patients with severe cognitive impairment who cannot follow instructions to complete the treatment; vi) Individuals with missing critical data. A total of 35 patients were enrolled in the present study. Patient characteristics are presented in Table I.
Table I.
Clinical characteristics of 35 patients with COVID-19 upon admission.
| Variables | Total (n=35) | Mild group (n=22) | Severe group (n=13) | P-value |
|---|---|---|---|---|
| Age, years | 47.94±15.00 | 40.77±9.06 | 60.08±15.51 | <0.001 |
| Sex (n, %) | ||||
| Male | 13 (37.1) | 11 (50.0) | 2 (15.4) | 0.070 |
| Female | 22 (62.9) | 11 (50.0) | 11 (84.6) | |
| Signs and symptoms on admission (n, %) | ||||
| Fever | 28 (80.0) | 18 (81.8) | 10 (76.9) | >0.999 |
| Cough | 21 (60.0) | 10 (45.5) | 11 (84.6) | 0.034 |
| Expectoration | 9 (25.7) | 3 (13.6) | 6 (46.2) | 0.050 |
| Sore throat | 9 (25.7) | 6 (27.3) | 3 (23.1) | >0.999 |
| Dizziness and headache | 10 (28.6) | 9 (40.9) | 1 (7.7) | 0.055 |
| Muscle soreness | 16 (45.7) | 9 (40.9) | 7 (53.8) | 0.503 |
| Fatigue | 13 (37.1) | 9 (40.9) | 4 (30.8) | 0.721 |
| Inappetence | 13 (37.1) | 9 (40.9) | 4 (30.8) | 0.721 |
| Chest tightness | 2 (5.7) | 0 (0) | 2 (15.4) | 0.131 |
| Shortness of breath | 5 (14.3) | 1 (4.5) | 4 (30.8) | 0.052 |
| Diarrhea | 2 (5.7) | 1 (4.5) | 1 (7.7) | >0.999 |
| Comorbidity (n, %) | ||||
| Hyperlipidemia | 1 (2.9) | 1 (4.5) | 0 (0) | >0.999 |
| Diabetes | 3 (8.9) | 0 (0) | 3 (23.1) | 0.044 |
| Hypertension | 5 (14.3) | 0 (0) | 5 (38.5) | 0.004 |
| COPD | 1 (2.9) | 0 (0) | 1 (7.7) | 0.371 |
| Cerebrovascular disease | 1 (2.9) | 0 (0) | 1 (7.7) | 0.371 |
| Chronic hepatitis B virus infection | 2 (5.7) | 2 (9.1) | 0 (0) | 0.519 |
Data were expressed as mean ± standard deviation. P values indicated differences between severe group and mild group. COVID-19, coronavirus disease 2019; COPD, chronic obstructive pulmonary disease.
Detection of SARA-CoV-2
A throat swab was obtained from each patient. A total of 200 µl throat swab from each patient was used to extract total RNA. On the basis of the manufacturer's protocol, total RNA was extracted using the Viral Nucleic Acid isolation kit (cat. no. SDK60104) from BioPerfectus Technologies. To target the nucleocapsid (N) and open reading frame lab (ORF1ab) genes, the SARS-CoV-2 Fluorescent PCR kit was used (cat. no. GN7103109; Maccura Biotechnology, Co., Ltd.), according to the manufacturers protocol. The thermocycling conditions of RT-qPCR were as follows: 55˚C for 15 min and 95˚C for 2 min, followed by 40 cycles of amplification at 95˚C for 15 sec and 58˚C for 35 sec. The primers were as follows: N forward, 5'-GGGGAACTTCTCCTGCTAGAAT-3' and reverse, 5'-CAGACATTTTGCTCTCAAGCTG-3'; ORF1ab forward, 5'-CCCTGTGGGTTTTACACTTAA-3' and reverse, 5'-ACGATTGTGCATCAGCTGA-3'. Negative and positive control samples were included in the SARS-CoV-2 Fluorescent PCR kit. The result was judged based on the absolute cycle threshold (Ct) value of each sample. The test results of SARS-CoV-2 were reported as positive (Ct ≤38) and negative (Ct >38) (11). The nucleic acid test was considered positive if the results of the samples were positive. If results were negative, the samples would be taken once a day for the next 2 days.
Data collection
Clinical information, including clinical symptoms, medical history, laboratory blood routine, and serum CRP and SAA levels were collected 1-2 days after admission. The patients were divided into mild and severe groups according to the WHO guidance (10). The mild group had clinical symptoms of fever, fatigue, cough, anorexia, malaise, muscle pain, sore throat, dyspnea, nasal congestion and headache. The severe group had respiratory distress, respiratory rate (RR) ≥30 beats/min in a resting state, a mean oxygen saturation of ≤93% and an arterial blood oxygen partial pressure (PaO2)/oxygen concentration (FiO2) ≤300 mmHg. The criteria for clinical recovery was at least two consecutive negative RT-PCR tests and ameliorated clinical symptoms.
Statistical analysis
Continuous variables of normal distribution were expressed as the mean ± standard deviation and parameters between the mild and severe group were compared using an independent sample t-test. Continuous variables of skewed distribution were presented as the median [interquartile range (IQR)] and the parameters between the mild and severe group were compared using a Mann-Whitney U test. Categorical values were expressed as frequencies, and the differences were analyzed using Fisher's exact test. A two-way ANOVA analysis was used to compare the serum CRP and SAA levels between the mild and severe group. The Logistic regression analysis and the area under curve (AUC) of the receiver operator characteristic (ROC) curve were calculated to determine the probability for predicting the severity of COVID-19. The optimal cut-off points to predict the severity of COVID-19 were determined by Youden's index of ROC (12). Linear regression was used to analyze the relationship between the serum CRP, SAA levels and treatment days in recovered patients. The Logistic regression analysis and the AUC of the ROC curve were calculated to determine the probability for predicting the recovery of COVID-19. The optimal cut-off points to predict the recovery of COVID-19 were determined by Youden's index of ROC. P<0.05 was considered to indicate a statistically significant difference. All analyses were performed using SPSS 23.0 software (IBM Corp.).
Results
Clinical characteristics of patients with COVID-19 on admission
Within the 35 hospitalized patients included, 13 (37.1%) and 22 (62.9%) cases were categorized into severe and mild groups, respectively. The mean age of patients was 47.9±15.0 years old, and 13 (37.1%) cases were male (Table I). Compared with the mild group, the severe group was significantly older (mean age 60.1±15.5 years vs. 40.8±9.1 years; P<0.001) and was more likely to exhibit a cough [11 (84.6%) vs. 10 (45.5%)], diabetes [3 (23.1%) vs. 0 (0%)], hypertension [5 (38.5%) vs. 0 (0%); Table I]. The most common symptoms of illness onset were fever (80.0%), cough (45.8%), muscle soreness (45.7%), fatigue (37.1%), inappetence (37.1%), dizziness and headache (28.6%), expectoration (25.7%), sore throat and (25.7%), shortness of breath (14.3%), chest tightness (5.7%) and diarrhea (5.7%).
Laboratory findings of patients with COVID-19 on admission
The lymphocyte count in the severe group was significantly lower compared with the mild group. Among them, the lymphocyte count in the severe group was lower than the normal range, while the lymphocyte count of the mild group was within the normal range (Table II). The eosinophil count was lower compared with the normal range, but there was no significant difference in the two groups. The serum CRP and SAA levels of the patients were above the upper bound of the normal range, and they were significantly higher in the severe group. The counts of white blood cell, platelet, neutrophil and monocyte were normal for all patients, and there were no significant difference in the two groups (Table II).
Table II.
Laboratory data, CRP and SAA of 35 patients with COVID-19 upon admission.
| Variable | Normal range | Total | Mild group | Severe group | P-value |
|---|---|---|---|---|---|
| White blood cell count (x109/l) | 3.50-9.50 | 4.50±1.78 | 4.80±1.31 | 4.00±2.36 | 0.204 |
| Platelet count (x109/l) | 125-350 | 165.69±55.86 | 158.59±49.4 | 177.69±65.73 | 0.336 |
| Neutrophil count (x109l) | 1.8-6.3 | 3.03±1.63 | 3.14±1.22 | 2.85±2.21 | 0.620 |
| Lymphocyte count (x109/l) | 1.1-3.2 | 1.01±0.36 | 1.15±0.34 | 0.76±0.26 | 0.001 |
| Monocyte count (x109/l) | 0.1-0.6 | 0.42±0.23 | 0.47±0.21 | 0.35±0.24 | 0.155 |
| Eosinophil count (x109/l) | 0.02-0.52 | 0.01(0.01,0.04) | 0.01(0.01,0.03) | 0.01(0,0.08) | 0.832 |
| CRP (mg/l) | 0.0-5.0 | 21.12±23.92 | 12.95±11.08 | 34.93±32.84 | 0.035 |
| SAA (mg/l) | 0.0-10.0 | 110.03±61.04 | 89.78±54.75 | 144.29±57.33 | 0.009 |
Data were expressed as mean ± standard deviation and median (IQR); P-values for differences between two groups were obtained by independent sample t-test or Mann-Whitney U test. CRP, C-reactive protein; SAA, serum amyloid A.
Dynamic changes of CRP and SAA in patients with COVID-19
Two-way ANOVA analysis demonstrated that disease severity had statistical significance at the SAA level (F=7.789; P=0.006) and CRP level (F=16.110; P<0.001) (data not shown). The severe group exhibited higher CRP and SAA levels than the mild group. Dynamic changes of CRP and SAA levels were presented in Fig. 1. As presented in Fig. 2, Linear regression analysis demonstrated that the CRP and SAA levels were negatively correlated with treatment days in recovered patients (r=-0.761, -0.795, respectively).
Figure 1.
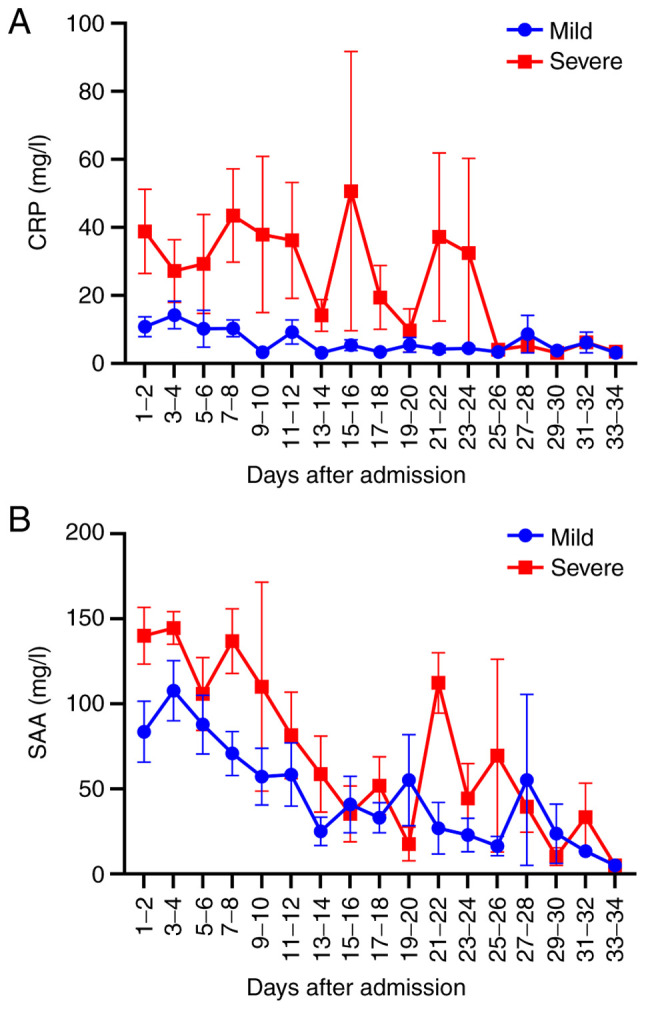
Dynamic changes of (A) CRP and (B) SAA levels in the mild and severe group during hospitalization. CRP, C-reactive protein; SAA, serum amyloid A.
Figure 2.

The (A) CRP, (B) SAA levels were negatively correlated with treatment days in recovered patients. Linear correlation analysis (r) and P-values were provided in each graph. CRP, C-reactive protein; SAA, serum amyloid A.
Effects of CRP and SAA on the occurrence of the severe COVID-19
The severe COVID-19 was used as the dependent variable (yes=1, no=0), and CRP and SAA were used as independent variables for Logistic regression analysis. CRP [OR=1.052 (95% CI 1.007, 1.099), P=0.023], SAA [OR=1.019 (95% CI 1.000, 1.038), P=0.049] were independent risk factors for the severity of COVID-19 (Table III). The regression equation used was: Logit (P)=-4.692+0.051(CRP)+0.019(SAA), which was statistically significant (χ2=17.04, P<0.001 (data not shown), and the prediction accuracy was 74.3%.
Table III.
Analysis on the occurrence of severe COVID-19 in CRP and SAA.
| Value | B | SE | Wald | P-value | OR (95% CI) |
|---|---|---|---|---|---|
| CRP | 0.051 | 0.022 | 5.161 | 0.023 | 1.052 (1.007, 1.099) |
| SAA | 0.019 | 0.010 | 3.872 | 0.049 | 1.019 (1.000, 1.038) |
| Constant | -4.692 | 1.742 | 7.258 | 0.007 |
B, regression coefficient; SE, standard error; OR, odd ratio; CI, confidence interval; CRP, C-reactive protein; SAA, serum amyloid A; COVID-19, coronavirus disease 2019.
The ROC curve was used to analyze the early-warning efficiency and the optimal prediction threshold of COVID-19 intensification. The corresponding AUC of CRP and SAA was 0.804 and 0.818, respectively (Fig. 3). The optimum critical point of CRP and SAA was 29.5 and 157.9 mg/l, respectively (Table IV), which was the upper limit of mild COVID-19. When CRP was over 29.5 mg/l, the severity of COVID-19 could be predicted, with sensitivity and the specificity of 61.5 and 90.9%, respectively. The severity of COVID-19 was predicted when SAA was over 157.9 mg/l, with the sensitivity and the specificity of 84.6 and 77.4%, respectively.
Figure 3.
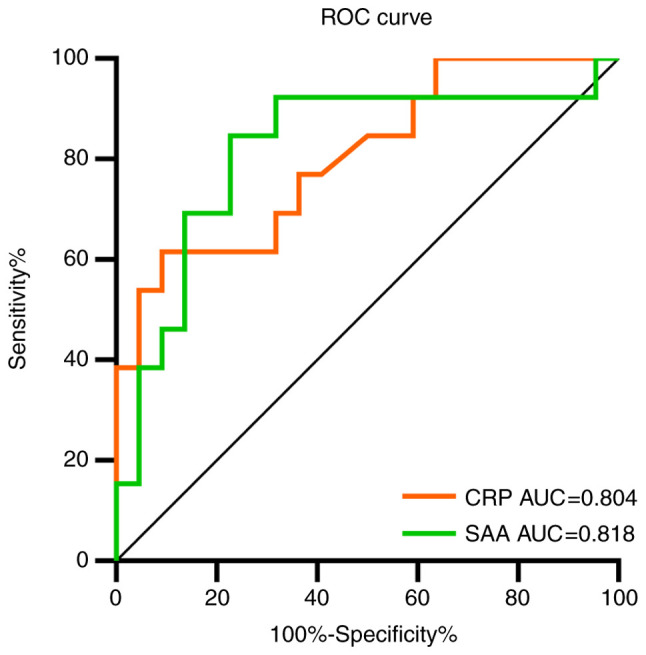
ROC curves comparing the CRP and SAA to predict the severity of COVID-19. ROC, receiver operator characteristic; CRP, C-reactive protein; SAA, serum amyloid A; COVID-19, coronavirus disease 2019; AUC, area under curve.
Table IV.
Analysis of the effectiveness of CRP and SAA for predicting the occurrence of the severe COVID-19.
| Value | CRP | SAA |
|---|---|---|
| Sensitivity % | 61.5 | 84.6 |
| Specificity % | 90.9 | 77.4 |
| Youden index % | 52.5 | 61.9 |
| Cut-off points | >29.5 | >157.9 |
CRP, C-reactive protein; SAA, serum amyloid A; COVID-19, coronavirus disease 2019.
Effects of CRP and SAA for predicting the recovery of COVID-19
The recovered COVID-19 was used as the dependent variable (yes=1, no=0), and CRP and SAA were used as independent variables for Logistic regression analysis. SAA [OR=0.968 (95% CI 0.945, 0.990), P=0.005] was an independent factor for predicting the recovery of COVID-19. However, CRP [OR=0.791 (95% CI 0.615, 1.016), P=0.067] could not predict the recovery of COVID-19 (Table V).
Table V.
Analysis CRP and SAA for predicting the recovery of COVID-19.
| Value | B | SE | Wald | P-value | OR (95% CI) |
|---|---|---|---|---|---|
| CRP | -0.235 | 0.128 | 3.361 | 0.067 | 0.791 (0.615, 1.016) |
| SAA | -0.033 | 0.012 | 7.776 | 0.005 | 0.968 (0.945, 0.990) |
| Constant | 3.249 | 0.864 | 14.155 | 0.000 |
B, regression coefficient; SE, standard error; OR, odd ratio; CI, confidence interval; CRP, C-reactive protein; SAA, serum amyloid A; CI, confidence interval.
The ROC curve was used to analyze the early-warning efficiency and the optimal prediction threshold of COVID-19 amelioration. The corresponding AUC of SAA was 0.923 (Fig. 4). The optimum critical point of SAA was 27.7 mg/l, which was the upper limit of recovered patients. When SAA was over 27.7 mg/l, the recovery of COVID-19 could be predicted, with a sensitivity and specificity of 84.4 and 90.3% respectively.
Figure 4.
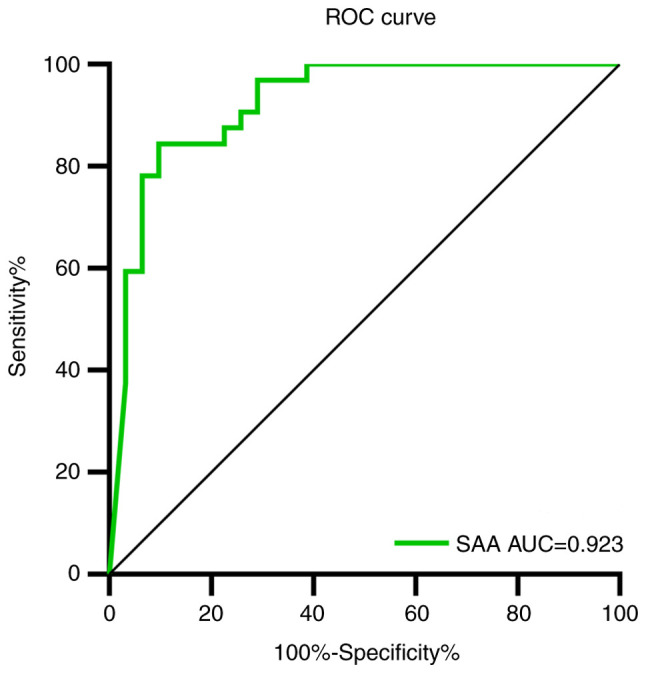
ROC curve of SAA to predict the recovery of COVID-19. ROC, receiver operator characteristic; SAA, serum amyloid A; COVID-19, coronavirus disease 2019.
Discussion
The current study reported a cohort of 35 patients with laboratory confirmed COVID-19. Within this cohort, the severe group was older and had more comorbidities (such as diabetes, hypertension) compared with the mild group, which was consistent with previous research (13-17). Fever, cough, muscle soreness, fatigue, inappetence, dizziness and headache were the most common symptoms in patients with COVID-19, and a cough was more common in the severe group compared with the mild group. The primary symptoms were fever (80.0%) and cough (60.0%), which are consistent with the results of recent research (18,19).
The present study reported the results of blood routine, and inflammation-related biomarkers of the patients with COVID-19 upon hospital admission. The results indicated that white blood cell, platelet, neutrophil, monocyte and eosinophil counts were not significantly different between the severe group and the mild group. White blood cell (severe group, 4.80±1.31x10⁹/l; mild group, 4.00±2.36x10⁹/l) and neutrophil (severe group, 3.14±1.22x10⁹/l; mild group, 2.85±2.21x10⁹/l) counts were close to the bottom of the normal range. Lymphocyte counts were significantly lower in the severe group. Eosinophil counts of the two groups were lower than the normal range. These results suggested that a substantial decrease in the total number of lymphocytes indicated that coronavirus consumed many immune cells and inhibited the body's cellular immune function (20,21). CRP and SAA levels were significantly higher in the severe group upon admission. The high CRP level was consistent with the results gained by a recent study (22).
A two-way ANOVA result indicated the CRP and SAA levels of the severe group were higher compared with the mild group. Logistic regression analysis revealed that CRP and SAA levels could predict severe COVID-19. ROC curve was used to analyze the efficiency of CRP and SAA for predicting severe COVID-19. The AUC of CRP and SAA were 0.804 and 0.818, respectively, which were both higher than 0.800, indicating a high prediction efficiency. The optimal cut-off point for CRP and SAA were 29.5 and 157.9 mg/l, both of which had high sensitivity and specificity, indicating that the cut-off point can be used to guide early clinical warnings of severe COVID-19. In addition, the AUC of SAA was higher compared with CRP, demonstrating that SAA was more efficient in predicting severe COVID-19 than CRP.
A Linear regression result indicated the CRP and SAA levels were negatively correlated with treatment days in the recovered patients. Logistic regression results showed that the P-value of CRP was 0.067, close to 0.05. It was hypothesized that CRP may also be able to predict the recovery of COVID-19. Due to the small sample size, CRP had no significance in the current study. In future, the sample size should be expanded to further verify the role of CRP in predicting COVID-19 rehabilitation. However, although the sample size was small, SAA was indicated to significantly predict recovery of COVID-19. These results suggested that SAA was more accurate to reflect the recovery of patients with COVID-19 than CRP. A ROC curve was used to analyze the efficiency of SAA in predicting the recovery of COVID-19. The AUC of SAA was 0.923, which confirmed the high prediction efficiency. The optimal cut-off point for SAA was 27.7 mg/l, with high sensitivity (84.4%) and specificity (90.3%), indicating that the cut-off point could be used to distinguish whether the patient had recovered and reached the discharge standard. The majority of diagnostic tests exhibit false positives. The false-positive results were expected to increase with i) decreasing sample size; ii) increasing pursuit of novelty; iii) various forms of multiple testing and researcher flexibility; and iv) incorrect P-values (23). Therefore, it was necessary to combine multiple testing methods for diagnosis to reduce misdiagnosis in the clinic. This test was not used for the diagnosis of the severity and recovery of COVID-19, and instead provided early warning information for clinician to judge the outcome of the disease.
The current study has a number of limitations. First, the sample size was relatively small in a single center, and a large sample with multicenter data should be used to validate the results of the current study. Second, data of healthy patients were lacking as blank controls due to the outbreak of the epidemic. Finally, the current study was retrospective as not every patient could be hospitalized in time for corresponding treatment in severe epidemic areas. Due to the shortage in medical service in the early stage of outbreak, some patients were self-isolated at home and could not be admitted immediately. Therefore, the CRP and SAA levels may have been affected upon admission. These limitations need to be overcome in further research. However, the primary results of the current study provided moderate yet important information that can be used to predict COVID-19 outcome.
In conclusion, the CRP and SAA levels were higher in the severe group, and SAA was more efficient in predicting severe COVID-19 than CRP. For recovered patients, the CRP and SAA levels were negatively correlated with treatment days, and SAA had a high prediction efficiency for the recovery of COVID-19. These results indicated that SAA may be considered to be a biomarker for predicting the severity and recovery of COVID-19. Therefore, SAA can be used for early warning of a poor outcome from COVID-19, as well as monitoring the recovery process, which has important clinical value.
Acknowledgements
Not applicable.
Funding
No funding was received.
Availability of data and materials
The datasets used and/or analyzed during the current study are available from the corresponding author on reasonable request.
Authors' contributions
JF, PH and DZ designed the current study. JF, SZ, QY and RH collected the clinical and laboratory data. PH, HL and YY analyzed the data. JF, PH, SZ and DZ wrote the manuscript. All authors read and approved the final manuscript.
Ethics approval and consent to participate
The current study was approved by the Institutional Review Board of Wuhan No. 1 Hospital. All data were anonymized to comply with the provisions of personal data protection legislation. Due to the retrospective nature of this study and due the fact that only historical medical data were collected, written informed consent was not required.
Patient consent for publication
Not applicable.
Competing interests
The authors declare that they have no competing interests.
References
- 1.Huang C, Wang Y, Li X, Ren L, Zhao J, Hu Y, Zhang L, Fan G, Xu J, Gu X, et al. Clinical features of patients infected with 2019 novel coronavirus in Wuhan, China. Lancet. 2020;395:497–506. doi: 10.1016/S0140-6736(20)30183-5. [DOI] [PMC free article] [PubMed] [Google Scholar]
- 2.Zhu N, Zhang D, Wang W, Li X, Yang B, Song J, Zhao X, Huang B, Shi W, Lu R, et al. A novel coronavirus from patients with pneumonia in China, 2019. N Engl J Med. 2020;382:727–733. doi: 10.1056/NEJMoa2001017. [DOI] [PMC free article] [PubMed] [Google Scholar]
- 3. World Health Organization: Statement on the second meeting of the international health regulations (2005) emergency committee regarding the outbreak of novel coronavirus (2019-nCoV), 2020. [Google Scholar]
- 4. World Health Organization: Coronavirus disease 2019 (COVID-19) situation report-74, 2020. [Google Scholar]
- 5.Calina D, Docea AO, Petrakis D, Egorov AM, Ishmukhametov AA, Gabibov AG, Shtilman MI, Kostoff R, Carvalho F, Vinceti M, et al. Towards effective COVID-19 vaccines: Updates, perspectives and challenges (Review) Int J Mol Med. 2020;46:3–16. doi: 10.3892/ijmm.2020.4596. [DOI] [PMC free article] [PubMed] [Google Scholar]
- 6.Nitulescu GM, Paunescu H, Moschos SA, Petrakis D, Nitulescu G, Ion GND, Spandidos DA, Nikolouzakis TK, Drakoulis N, Tsatsakis A. Comprehensive analysis of drugs to treat SARS-CoV-2 infection: Mechanistic insights into current COVID-19 therapies (Review) Int J Mol Med. 2020;46:467–488. doi: 10.3892/ijmm.2020.4608. [DOI] [PMC free article] [PubMed] [Google Scholar]
- 7.Ye Q, Wang B, Mao J. The pathogenesis and treatment of the ‘Cytokine Storm’ in COVID-19. J Infect. 2020;80:607–613. doi: 10.1016/j.jinf.2020.03.037. [DOI] [PMC free article] [PubMed] [Google Scholar]
- 8.Vietri L, Fui A, Bergantini L, d'Alessandro M, Cameli P, Sestini P, Rottoli P, Bargagli E. Serum amyloid A: A potential biomarker of lung disorders. Respir Investig. 2020;58:21–27. doi: 10.1016/j.resinv.2019.09.005. [DOI] [PubMed] [Google Scholar]
- 9.Yip TT, Chan JW, Cho WC, Yip TT, Wang Z, Kwan TL, Law SC, Tsang DN, Chan JK, Lee KC, et al. Protein chip array profiling analysis in patients with severe acute respiratory syndrome identified serum amyloid a protein as a biomarker potentially useful in monitoring the extent of pneumonia. Clin Chem. 2005;51:47–55. doi: 10.1373/clinchem.2004.031229. [DOI] [PMC free article] [PubMed] [Google Scholar]
- 10. World Health Organization: Clinical management of severe acute respiratory infection (SARI) when COVID-19 disease is suspected: Interim guidance, 13 March 2020, 2020. [Google Scholar]
- 11.Livak KJ, Schmittgen TD. Analysis of relative gene expression data using real-time quantitative PCR and the 2(-Delta Delta C(T)) method. Methods. 2001;25:402–408. doi: 10.1006/meth.2001.1262. [DOI] [PubMed] [Google Scholar]
- 12.Hajian-Tilaki K. The choice of methods in determining the optimal cut-off value for quantitative diagnostic test evaluation. Stat Methods Med Res. 2018;27:2374–2383. doi: 10.1177/0962280216680383. [DOI] [PubMed] [Google Scholar]
- 13.Li K, Wu J, Wu F, Guo D, Chen L, Fang Z, Li C. The clinical and chest CT features associated with severe and critical COVID-19 pneumonia. Invest Radiol. 2020;55:327–331. doi: 10.1097/RLI.0000000000000672. [DOI] [PMC free article] [PubMed] [Google Scholar]
- 14.Wang Z, Yang B, Li Q, Wen L, Zhang R. Clinical features of 69 cases with coronavirus disease 2019 in Wuhan, China. Clin Infect Dis. 2020;71:769–777. doi: 10.1093/cid/ciaa272. [DOI] [PMC free article] [PubMed] [Google Scholar]
- 15.Wu C, Chen X, Cai Y, Xia J, Zhou X, Xu S, Huang H, Zhang L, Zhou X, Du C, et al. doi: 10.1001/jamainternmed.2020.0994. Risk factors associated with acute respiratory distress syndrome and death in patients with coronavirus disease 2019 pneumonia in Wuhan, China. JAMA Intern Med 180: 1-11, Mar 13, 2020 (Online ahead of print). [DOI] [PMC free article] [PubMed] [Google Scholar]
- 16.Yang X, Yu Y, Xu J, Shu H, Xia J, Liu H, Wu Y, Zhang L, Yu Z, Fang M, et al. Clinical course and outcomes of critically ill patients with SARS-CoV-2 pneumonia in Wuhan, China: A single-centered, retrospective, observational study. Lancet Respir Med. 2020;8:475–481. doi: 10.1016/S2213-2600(20)30079-5. [DOI] [PMC free article] [PubMed] [Google Scholar]
- 17.Zhou F, Yu T, Du R, Fan G, Liu Y, Liu Z, Xiang J, Wang Y, Song B, Gu X, et al. Clinical course and risk factors for mortality of adult inpatients with COVID-19 in Wuhan, China: A retrospective cohort study. Lancet. 2020;395:1054–1062. doi: 10.1016/S0140-6736(20)30566-3. [DOI] [PMC free article] [PubMed] [Google Scholar]
- 18.Wang D, Hu B, Hu C, Zhu F, Liu X, Zhang J, Wang B, Xiang H, Cheng Z, Xiong Y, et al. Clinical characteristics of 138 hospitalized patients with 2019 novel coronavirus-infected pneumonia in Wuhan, China. JAMA. 2020;323:1061–1069. doi: 10.1001/jama.2020.1585. [DOI] [PMC free article] [PubMed] [Google Scholar]
- 19.Yu P, Zhu J, Zhang Z, Han Y, Huang L. doi: 10.1093/infdis/jiaa077. A familial cluster of infection associated with the 2019 novel coronavirus indicating potential person-to-person transmission during the incubation period. J Infect Dis, Feb 18, 2020 (Online ahead of print). [DOI] [PMC free article] [PubMed] [Google Scholar]
- 20.de Wit E, van Doremalen N, Falzarano D, Munster VJ. SARS and MERS: Recent insights into emerging coronaviruses. Nat Rev Microbiol. 2016;14:523–534. doi: 10.1038/nrmicro.2016.81. [DOI] [PMC free article] [PubMed] [Google Scholar]
- 21.Gao Y, Li T, Han M, Li X, Wu D, Xu Y, Zhu Y, Liu Y, Wang X, Wang L. Diagnostic utility of clinical laboratory data determinations for patients with the severe COVID-19. J Med Virol. 2020;92:791–796. doi: 10.1002/jmv.25770. [DOI] [PMC free article] [PubMed] [Google Scholar]
- 22.Chan JF, Yuan S, Kok KH, To KK, Chu H, Yang J, Xing F, Liu J, Yip CC, Poon RW, et al. A familial cluster of pneumonia associated with the 2019 novel coronavirus indicating person-to-person transmission: A study of a family cluster. Lancet. 2020;395:514–523. doi: 10.1016/S0140-6736(20)30154-9. [DOI] [PMC free article] [PubMed] [Google Scholar]
- 23.Forstmeier W, Wagenmakers EJ, Parker TH. Detecting and avoiding likely false-positive findings-a practical guide. Biol Rev Camb Philos Soc. 2017;92:1941–1968. doi: 10.1111/brv.12315. [DOI] [PubMed] [Google Scholar]
Associated Data
This section collects any data citations, data availability statements, or supplementary materials included in this article.
Data Availability Statement
The datasets used and/or analyzed during the current study are available from the corresponding author on reasonable request.