Abstract
Purpose
Single‐photon emission computed tomography (SPECT) is a noninvasive imaging modality, used in myocardial perfusion imaging. The challenges facing the majority of clinical SPECT systems are low sensitivity, poor resolution, and the relatively high radiation dose to the patient. New generation systems (GE Discovery, DSPECT) dedicated to cardiac imaging improve sensitivity by a factor of 5–8. This improvement can be used to decrease acquisition time and/or dose. However, in the case of ultra‐low dose (~3 mCi) injections, acquisition times are still significantly long, taking 10–12 min. The purpose of this work is to investigate a new gamma camera design with 21 hemi‐ellipsoid detectors each with a pinhole collimator for cardiac SPECT for further improvement in sensitivity and resolution and reduced patient exposures and imaging times.
Methods
To evaluate the resolution of our hemi‐ellipsoid system, GATE Monte‐Carlo simulations were performed on point‐sources, rod‐sources, and NCAT phantoms. For average full‐width‐half‐maximum (FWHM) equivalence with base flat‐detector, the pinhole‐diameter for the curved hemi‐ellipsoid detector was found to be 8.68 mm, an operating pinhole‐diameter nominally expected to be ~3 times more sensitive than state‐of‐the‐art systems. Rod‐sources equally spaced within the region of interest were acquired with a 21‐detector system and reconstructed with our multi‐pinhole (MPH) iterative OSEM algorithm with collimator resolution recovery. The results were compared with the results of a state‐of‐the‐art system (GE Discovery) available in the literature. The system was also evaluated using the mathematical anthropomorphic NCAT (NURBS‐based Cardiac Torso; Segars et al. IEEE Trans Nucl Sci. 1999;46:503–506) phantom with a full (clinical)‐dose acquisition (25 mCi) for 2 min and an ultra‐low dose acquisition of 3 mCi for 5.44 min. The estimated left ventricle (LV) counts were compared with the available literature on a state‐of‐the‐art system (DSPECT). FWHM of the LV wall on MPH‐OSEM‐reconstructed images with collimator resolution recovery was estimated.
Results
On acquired rod‐sources, the average resolution (FWHM) after reconstruction with resolution recovery in the entire region of interest (ROI) for cardiac imaging was on the average 4.44 mm (±2.84), compared to 6.9 mm (±1 mm) reported for GE Discovery (Kennedy et al., J Nucl Cardiol. 2014:21:443–452). For NCAT studies, improved sensitivity allowed a full‐dose (25 mCi) 2‐min acquisition (Ell8.68mmFD) which yielded 3.79 M LV counts. This is ~3.35 times higher compared to 1.13 M LV counts acquired in 2 min for clinical full dose for state‐of‐the‐art DSPECT. The increased sensitivity also allowed an ultra‐low dose acquisition protocol (Ell8.68 mmULD), 3 mCi (eight times less injected dose) in 5.44 min. This ultra‐low dose protocol yielded ~1.23 M LV counts which was comparable to the full‐dose 2‐min acquisition for DSPECT. The estimated NCAT average FWHM at the LV wall after 12 iterations of the OSEM reconstruction was 4.95 and 5.66 mm around the mid‐short‐axis slices for Ell8.68mmFD and Ell8.68mmULD, respectively.
Conclusion
Our Monte‐Carlo simulation studies and reconstruction suggest using (inverted wineglass sized) hemi‐ellipsoid detectors with pinhole collimators can increase the sensitivity ~3.35 times over the new generation of dedicated cardiac SPECT systems, while also improving the reconstructed resolution for rod‐sources with an average of 4.44 mm in region of interest. The extra sensitivity may be used for ultra‐low dose imaging (3 mCi) at ~5.44 min for comparable clinical counts as state‐of‐the‐art systems.
Keywords: curved detectors, high‐performance cardiac SPECT, multi‐pinhole cardiac SPECT
1. Introduction
Cardiac SPECT is an important noninvasive modality to assess myocardial perfusion, ischemic defects, abnormal heart wall motion, etc., with ~7 million patients/yr undergoing nuclear cardiology scans in the USA. However, of all the diagnostic imaging modalities, nuclear medicine is the second highest contributor of radiation exposure to the general public, behind computed tomography (CT).1, 2, 3 Cardiac SPECT contributes about half of this exposure. Standard Anger camera‐based systems with parallel‐hole collimators in clinic utilize a 10–12 min ~25 mCi stress study followed by a second‐day ~15 mCi rest study, spanning 16–20 min, leading to patient motion, patient discomfort, and inefficient hospital workflow. Patient motion may cause misdiagnosis due to motion‐induced artifacts in reconstruction and misalignment of transmission and emission reconstructed images.4, 5, 6, 7
A new generation of dedicated cardiac SPECT systems with improved sensitivity of 5–8 times8, 9, 10, 11, 12, 13, 14, 15, 16, 17 over standard clinical systems has emerged. The sensitivity improvement depends on several factors, such as patient size and activity uptake, field of view, and baseline system geometry to compare with. Most of the second‐generation dedicated cardiac designs place detectors close to the body, focusing on a region of interest around the heart. Nakazato et al.9, Erlandsson et al.11, and Gambhir et al.12 analyzed the dynamic SPECT (DSPECT) system, which uses parallel‐hole collimation. The planar sensitivity improvement of DSPECT, compared to a general‐purpose SPECT camera, was 5.5 times, and for tomographic reconstruction, the improvement was 4.6–7.9 times for the heart region.11 The acquisition time for clinical studies was 5.5 times shorter (2 min for DSPECT vs 11 min for the general‐purpose system).12 Nakazato et al.9 acquired ~8M LV counts in 14 min with DSPECT and about 1.13 M LV counts in 2 min. The GE Discovery system has a configuration of 19 stationary pinhole‐collimated detectors placed around the heart in proximity. The configuration of the detector‐pinhole units is approximately that of an L‐shape. The GE system, having no moving parts, allows dynamic SPECT imaging as well as reducing the servicing costs. Esteves et al.16 studied the GE Discovery Nuclear Medicine 530c (DNM) on 168 patients. The rest and stress acquisition times were 4 and 2 min, respectively, for the GE Discovery system and 14 and 12 min, respectively, for a standard dual detector SPECT camera (S‐SPECT), implying 3.5–6 times sensitivity gain.
The new‐generation dedicated cardiac systems enable “stress‐first” SPECT protocols with lower doses and obviate the need for subsequent rest studies if stress studies are normal (~60% of cases).2, 3, 18, 19, 20 This has been shown to reduce radiation exposures to patients and associated personnel,3 but acquisitions take about 10–14 min.2, 3, 9, 18, 19, 20 Additionally, these new cameras are not yet prevalent, with standard Anger camera‐based systems still used for the vast majority of patients.
We proceeded to explore if we can design a higher sensitivity cardiac SPECT system (Dey21, 22) in order to reduce patient exposures and image acquisition times. The main idea is to use curved detectors to improve resolution. The improved resolution can then be traded with improved sensitivity using a larger pinhole‐diameter.22
Dey22 previously explored a theoretical hemi‐paraboloid system with analytical forward system acquisition simulation of point‐sources, yielding 2.26 times sensitivity improvement over a base flat‐detector system for equivalent average FWHM. We did a preliminary exploration of the hemi‐ellipsoid detector shape23 and estimated that further performance improvement is possible compared to a hemi‐paraboloid shape of the same base diameter and height (because of higher magnification in the center over a larger angular sector).
The goal of this work is to rigorously evaluate the resolution and sensitivity of a system with 21 hemi‐ellipsoid detectors in reconstruction space, with Monte‐Carlo simulations of point/rod‐sources and NCAT phantom, and compare the performances with existing literature on state‐of‐the‐art systems such as GE Discovery system24 and DSPECT.9
2. Materials and methods
The main idea behind using a curved detector instead of a flat one for MPH SPECT is explained in a previous work,22 briefly summarized here. Assuming that the pinholes will be close to the body surface for best sensitivity, we show (Fig. 3 in manuscript22) that once the object depth from pinhole aperture and angle of acceptance is fixed by application, curved detectors, as opposed to flat detectors, will allow for more detector area and better packing factor for a compact geometry of detectors. An inverted wineglass‐shaped detector collimated by pinhole will improve magnification in the central section and improve resolution compared to a flat detector. The parameters for collimator height “a” were investigated in that work22 in depth. For this work, we used the parameter determined in that paper22 allowing for large field of view (200 mm at depth of 150 mm from pinhole, which is approximately our depth of interest for the heart).
In this work, we investigate a full system with 21 hemi‐ellipsoid curved detectors (the NPH21b200 system described in Ref. 23) using GATE (Geant4 Application for Tomographic Emission25) simulations and analyze the performance compared to state‐of‐the‐art clinical systems. The hemi‐ellipsoid detector system is termed ellipsoid system for simplicity here onward. The Gate version used was 7.0.
First, we compared the full‐width‐half‐maximum (FWHM) vs pinhole‐diameter for a single hemi‐ellipsoid detector with pinhole collimation and a single base flat‐detector with the same pinhole collimation, using point‐sources simulated with GATE. The pinhole‐diameter was varied over a range. This gives a system geometry‐independent “raw” comparison points, between the two detectors (Ellipsoid vs Flat). Also importantly, this gives a higher sensitivity operating point or a higher pinhole‐diameter setting for the Ellipsoid detector for equivalent average acquisition resolution to the flat detector.
For this operating point (based on equivalence in average resolution with base flat‐detector), we performed full‐system resolution analysis. Resolution analysis requires full‐system acquisition and evaluation in reconstructed space. Therefore, in the next step, we obtained GATE simulations of 21 projections for our hemi‐ellipsoid MPH system for a series of rod‐sources in our volume of interest (VOI) (similar to GE Discovery system resolution evaluation24). We compared the FHWM of our system with the GE system. As done for GE Discovery evaluation,24 the collimator blur is compensated in iterative reconstruction.
Finally, in a third step, we obtained GATE simulations for the mathematical anthropomorphic NCAT (NURBS‐based Cardiac Torso)26 phantom with a full (clinical)‐dose acquisition and estimated the LV counts and compared FWHM of LV wall in the reconstructed images. We also simulated an ultra‐low dose acquisition of ~3 mCi (as in other low‐dose studies9, 18, 19, 20) for the Ellipsoid detector system (with a high‐sensitive diameter setting) for comparison. Each step and associated substeps is explained in details below.
2.A. GATE point‐sources simulation comparison between a single ellipsoid and flat detector, each collimated by a pinhole
Our scintillator detector design is that of a hemi‐ellipsoidal shape (referred to as an Ellipsoid detector) with a CsI crystal of 6 mm thickness, 80 mm diameter, and 120 mm height [Fig. 1(a)]. For an initial rudimentary resolution sensitivity analysis (FWHM vs pinhole‐diameter), point source simulations were compared between the collimated Ellipsoid crystal in Fig. 1(a) and its base flat‐detector system in Fig. 1(b).
Figure 1.
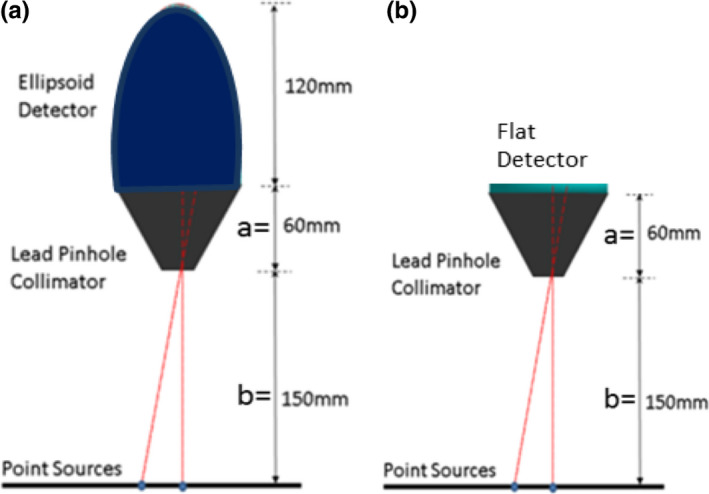
GATE simulation setup using (a) Ellipsoid detector and (b) Flat‐detector, and point‐sources located at 150 mm from the pinhole aperture. [Color figure can be viewed at wileyonlinelibrary.com]
The GATE simulations included photoelectric and Compton interactions. Only photons detected with energies within a 10% window around the photopeak of 140.5 keV are stored. The GATE simulations include pinhole penetration effects, scatter, and attenuation. All the GATE simulations mentioned in this work were done on a high‐performance cluster (HPC) at Louisiana State University.
The simulations were obtained for seven different diameters from 4 mm to 10 mm, in steps of 1 mm, for both the Ellipsoid and Flat detector. For each pinhole‐diameter, nine point‐sources were placed on a plane 150 mm depth below the pinhole‐diameter at 10 mm intervals from the center to the edge at radial distance 80 mm. The acquired counts obtained at the detector were binned to 1 mm3 detector voxel resolution. The detector counts were backprojected to a plane at 150 mm depth (where the center of the region of interest, the heart, is expected to be located) and FWHM was calculated.
We plotted the average FWHM (average of the FWHM of the nine point‐sources evaluated from the center to the edge of the detector) vs pinhole‐diameter as well as the sensitivity vs average FWHM. These plots allowed us to extract the higher pinhole‐diameter setting obtainable for the Ellipsoid system for similar average acquisition resolution as a flat detector with 5 mm pinhole‐diameter. This analysis provides us a higher sensitive pinhole‐diameter operating point for our system.
The full‐system resolution is to be determined in reconstruction space after collimator resolution recovery. In the subsequent sections, we describe our system configuration geometry with 21 of these detector‐pinhole units spatially arranged around the region of interest, our GATE evaluation of the full system using arrays of rod‐sources in region of interest, and comparison to the GE Discovery system.24
2.B. Configuration geometry and reconstruction algorithm
2.B.1. Geometry
We adopted the stationary 21‐detector‐pinhole configuration geometry with pinholes described as NPH21b200 in Ref. 23. Briefly, the 21 detectors collimated with pinholes are distributed on three arcs of a spherical surface (shown in a volume rendering superposed on the NCAT phantom, in Fig. 1(a) in Ref. 23). Each detector‐pinhole is separated from the nearest one by at least a 1 cm buffer, the closest point between adjacent units being at the base of the crystal. The top arc has six pinhole‐detector units, the middle arc (most sensitive zone) has nine, and the last arc has six. The geometry was determined heuristically; it was ensured that the NCAT heart region is well within the FOV and each detector‐pinhole unit is able to image the entire heart without truncation. All pinholes’ central axes point toward the heart region such that they converge to a point at a distance of 200 mm below the surface, beyond the heart on the NCAT phantom shown in Fig. 2. This is called the “iso‐center” of the geometry for convenience.
Figure 2.
The pinhole axes meet at the point (called the “iso‐center”) indicated by arrow, 200 mm below their diameters. Note that the liver is omitted for better visualization. [Color figure can be viewed at wileyonlinelibrary.com]
We tested this geometry in GATE simulations of rod‐sources and NCAT, with the Ellipsoid detectors (called Ellipsoid detector system) mounted on pinholes. We considered two settings of pinhole: (a) a 5‐mm diameter pinhole similar to GE Discovery,24 expected to achieve a clinical level of counts, and (b) the high sensitivity setting of pinhole‐diameter determined by the analysis of imaging point‐sources with singleton detector‐pinhole units described in Section 2.A. While we show the analysis later (in Results), for clarity of presentation, the high‐sensitive diameter was determined to be 8.68 mm.
The GATE system simulations of NCAT and rod‐sources took over 500K CPU hours (and over 6 months) in the HPC cluster.
2.B.2. MPH reconstruction
A MPH MLEM/OSEM reconstruction algorithm developed by Dey10, 23, 27 was used to reconstruct the rod‐sources and the NCAT phantom acquired in simulations by GATE. The sampling was voxel based (ray casting‐based regular sampling of each voxel). The algorithm compensated for collimator resolution, pinhole sensitivity, and attenuation due to intervening body tissue.10, 23, 27 The collimator resolution was compensated by sampling of the pinhole.28 The pinhole‐diameter sampling interval was 0.38 mm in two directions. The NCAT phantoms were reconstructed using OSEM by choosing subsets of 3 from 21 projections. The approximate speedup between MLEM and OSEM was a factor of 6.
2.C. Resolution comparison to GE discovery system: multiple (21) detector‐pinhole GATE rod‐source ellipsoid detector system simulations and reconstructions
Following the methodology for evaluation of the GE Discovery system24 for a fair comparison, we imaged a rod‐source phantom with background activity and reconstructed the images with collimator resolution recovery. We evaluated the FWHM in three‐dimensional (3D) at the reconstructed rod‐sources and interpolated over 3D volume to obtain the FHWM over the entire VOI. The VOI was an oval of dimension 200, 180, and 180 mm such that NCAT heart voxels were well inside the VOI. The rod‐sources were of diameter 1 mm and length 2 mm, spaced 30 mm in each direction. Radioactivity of 2 MBq was simulated for each rod‐source. The simulations were performed for Ellipsoid system with 5 mm pinhole‐diameter (clinical sensitivity) as well as the 8.68 mm diameter pinhole (high‐sensitive setting, determined by Section 2.A). The detector binning was 3 mm in each direction. The images were then reconstructed using MPH MLEM reconstruction. The reconstruction voxel size is 2 mm in each direction. FWHM was estimated in X, Y, and Z, and the maximum value [worst case (WC)] of these (FWHM_WC) was noted. The values were trilinearly interpolated to obtain the FHWM_X, FWHM_Y, FWHW_Z, FWHM_WC at every point on the VOI. To compare with the GE system presentation, the interpolated values of these four parameters were shown in the central axial and central coronal slices for an iteration where values have more or less converged. Additionally, we presented the information in the sagittal slice. We also presented the overall average (over all acquired rod‐source points) and the standard deviation across iterations.
2.D. GATE NCAT simulations’ comparison between ellipsoid and flat detector systems
To simulate a realistic uptake of Tc‐99 m in the heart, liver, lungs, and background in GATE, source phantoms for each organ were created separately using the NCAT software. The heart, liver, lung, and background relative activities were 100,50,5, and 10. An attenuation map for NCAT was also generated. For a full‐injected dose of 25 mCi, the uptake in the heart source phantom is assumed to be 0.5 mCi (which is about a 0.3 mCi or 1.2% in the LV region).29 Therefore, the activity per voxel is scaled such that a total of 0.5 mCi were simulated in the heart region voxels. Each of the 21 projections was obtained by acquiring the data for 120 s. The three organs (heart, liver, lungs) and the background were acquired in parallel. A 72‐h wall time on the HPC cluster required the division of each simulation into smaller units of time and activity. For example, for the liver, three sets of activity and 12 sets of time (10 s each) were required.
The GATE events detected by each of the 21 CsI detectors from the different organs were added and binned into detector voxels of 3 mm size. These projections were the “measurement” inputs for the MLEM reconstruction algorithm to obtain the final reconstructed image. The full‐dose data were acquired for Ellipsoid detector systems with 5 mm (referred to as Ell5mmFD) and 8.68 mm diameter pinholes (Ell8.68mmFD). The Ellipsoid 8.68 mm pinhole‐diameter was also obtained for low dose of 3 mCi (consistent with clinical protocols2, 3, 18, 19, 20). Since the sensitivity is about 3.06 times higher and the dose was reduced 8.3 times, the acquisition time was increased to 5.44 min (2 min × 8.33/3.06) to get similar level of counts. The ultra‐low dose acquisition is referred in short as Ell8.68mmULD. Note that since the acquisition counts approximately linearly scales with the input Bq per voxel and with time, this case can be alternately thought of as a 2‐min acquisition with ~8.2 mCi injected dose.
2.D.1. Overall left ventricle sensitivity
The heart‐only counts for the system were acquired for all three acquisitions and corrected for LV only and compared to DSPECT data available in the literature.9
2.D.2. Resolution analysis on NCAT reconstructions
The all‐organ acquisitions were reconstructed using the MPH‐OSEM, with 4.67 mm resolution voxel size. FWHM analysis was done on the short‐axis slices before application of clinical smoothing.30 The clinical smoothing filter was a 3D Butterworth filter as in the literature.31 The order of the filter is 5 with a cutoff parameter of 0.185, consistent with a reconstruction voxel size of 4.67 mm.
The LV intensity was extracted in different profiles around the short‐axis slices.30 To reduce effects of noise, each profile consisted of the average of three neighboring profiles. Four profiles, two vertical (superior and inferior) and two horizontal (anterior and posterior), were extracted for ten short‐axis slices. The corresponding profile from the corresponding short‐axis slice of the oriented NCAT phantom was extracted. The normalized NCAT profile was convolved with a Gaussian and the best fit of the resulting signal to the normalized reconstructed profile was found iteratively using Matlab (Mathworks, Natick, MA) function fmincon. The normalization was important to eliminate the effect of any reconstruction bias. The FWHM of the best‐fit Gaussian was found and the average FWHM (of four profiles) for each slice was calculated. Rather than tabulating FWHM for all ten slices, we further averaged over three slices for each of the following three regions: mid‐short‐axial region, toward base, and toward the apex and tabulated the average regional results for the three different systems: Ell5mmFD, Ell8.68mmFD, and Ell8.68mmULD.
2.D.3. Short and long axes and polar map
The reconstructed datasets from the GATE simulations were clinically smoothed and displayed in short‐axis and two long‐axis slices as well as polar maps for Ell5mmFD, Ell8.68mmULD, and Ell8.68mmFD. The original NCAT was also similarly smoothed and polar mapped for comparison. Each polar map is displayed scaled to the maximum in the heart.
2.D.4. Bias and variance
Using GATE for large‐scale simulations for noise analysis is prohibitive. Hence, we performed bias–variance analysis with analytical forward simulations and reconstruction. While the analytical method does not estimate the scatter, for Tc99 m, the scatter is expected to be relatively low.31 Poisson noise was added (similar to past work29, 32) to near noiseless analytical projections. Twenty noise realizations were reconstructed with 4.67 mm voxel size.
The same NCAT phantom distributions that were used for GATE simulations were used for the bias–variance study. The bias and variance were calculated as described in Ref. 29, 32. For each iteration, percent bias was calculated as the percent error from the NCAT value averaged across the noise ensemble and over the LV voxels. Similarly, variance was calculated over the noise ensemble and LV voxels.
3. Results
3.A. GATE point source simulations: comparison for a single pinhole‐collimated ellipsoid and flat detector
Figure 3(a) plots the average FWHM vs pinhole‐diameter for the seven diameter settings with flat and ellipsoid detectors. We immediately see that the FWHM increases at a steeper rate (therefore faster loss of resolution) with pinhole‐diameter for the Flat detector compared to the Ellipsoid detector. The polyfit interpolation (MATLAB, Mathworks, MA) to fit the data is also displayed, showing a linear trend for Flat and Ellipsoid. Figure 3(b) plots the data as sensitivity (normalized vs the 5 mm‐pinhole‐diameter) vs average FWHM. The relationship is nonlinear (approximately quadratic) for both, with the sensitivity showing steeper rate of improvement for the Ellipsoid detector. As detailed later, the 5 mm setting Ellipsoid acquired a clinical level of counts in GATE for the NCAT phantom. We see in Fig. 3(a) that at 8.68 mm diameter, the Ellipsoid detector system had similar raw acquisition resolution as the 5 mm Flat detector system, at the depth of 150 mm (center of region of interest). Similarly, from Fig. 3(b), for the same average resolution for the Ellipsoid detector, we expect about a 3.06 times sensitivity improvement with respect to the Flat detector with 5 mm pinhole‐diameter.
Figure 3.
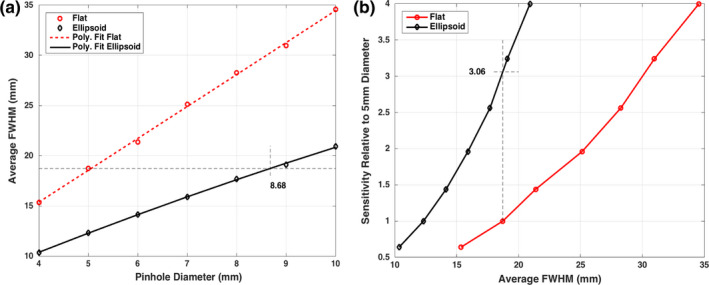
Plots of GATE simulation results: (a) Average full‐width‐half‐maximum plotted against pinhole‐diameter. Ellipsoid case is interpolated to show that, for same average resolution for 5 mm diameter for the Flat detector case, an 8.68 mm diameter may be used for the Ellipsoid case. (b) Sensitivity with respect to 5 mm diameter case (i.e., d2/25) is plotted vs the average FWHM from GATE measurements. These imply a 3.06 times sensitivity improvement. [Color figure can be viewed at wileyonlinelibrary.com]
This provides us with an operating point of 8.68 mm diameter for the Ellipsoid detector system for further studies with a point source and NCAT phantom and allows us to investigate system resolution after reconstruction with the collimator resolution recovery. In the next section, we will compare the Ellipsoid 8.68 mm with GE Discovery FWHM reported in the literature.
3.B. Rod source resolution analysis post‐reconstruction and comparison to GE discovery system
The array of rod‐sources in the VOI was imaged, reconstructed with collimator resolution recovery, and FWHM extracted as described in Section 2.C. To compare with the GE Discovery system,24 we show the interpolated FWHM values (X, Y, Z and WC) in axial, coronal, and sagittal slices, in Figs. 4(a)–4(c), respectively.
Figure 4.
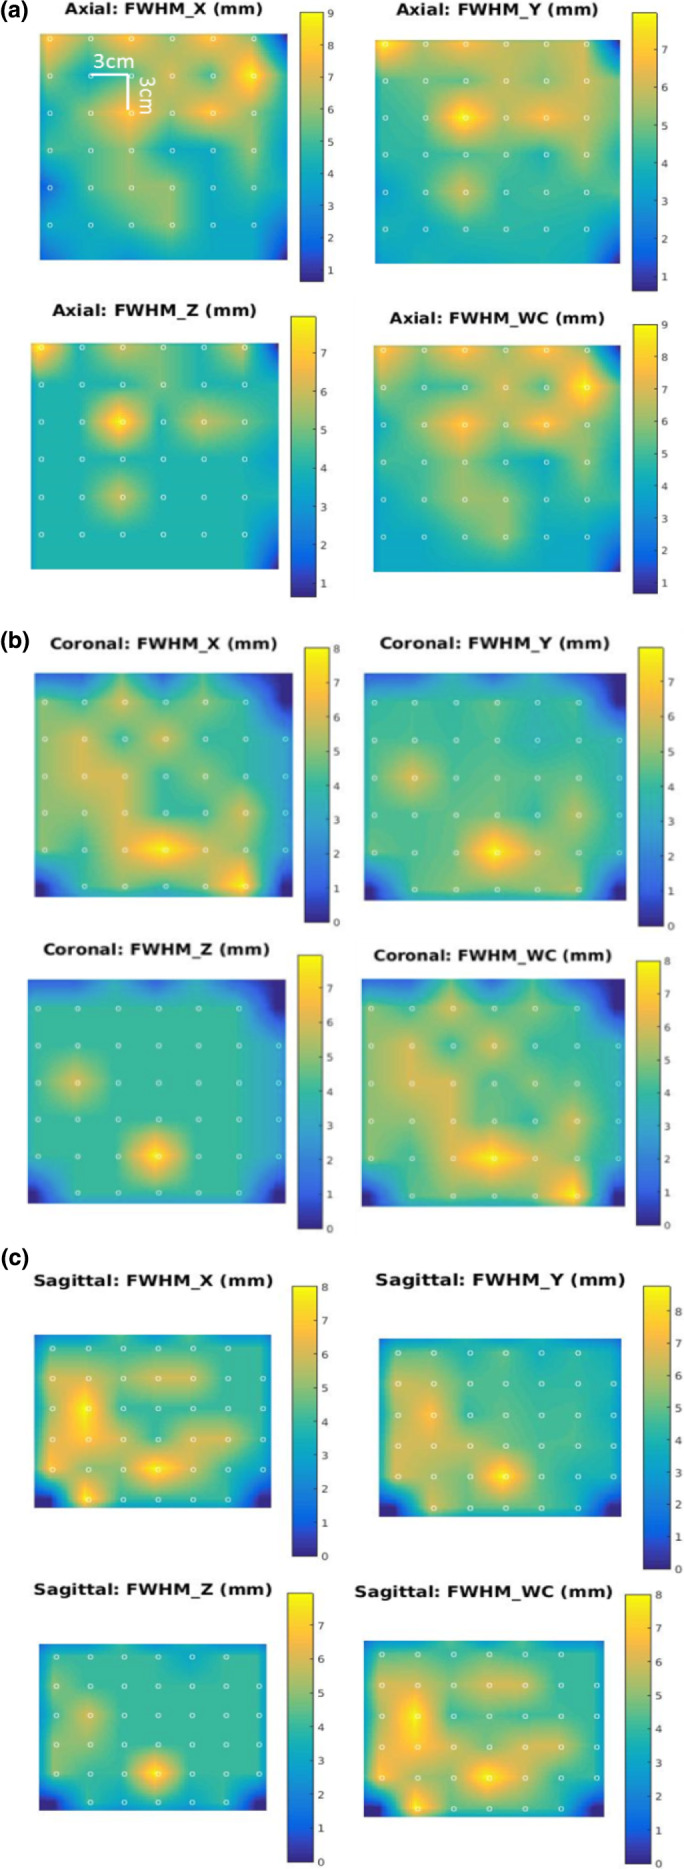
Full‐width‐half‐maximum (mm) results for Rod Phantom simulations are shown for X, Y, Z and the worst case for Ell8.68mm system for the 70th iteration of reconstruction. Images show interpolated values for (a) mid‐axial slice, (b) mid‐coronal, and (c) midsagittal slices. The dots represent the acquisition points (spaced 30 mm apart in each direction). [Color figure can be viewed at wileyonlinelibrary.com]
The average FWHM vs iteration in Fig. 5 shows Ell5mm converges to similar values as Ell8.68mm but slower. At 300 iterations, the convergence is less than 1.5% (measured by percent difference at each iteration from mean of last ten iterations), while similar results are achieved for Ell8.68mm at around 118 iterations. The slower convergence for the higher acquired resolution case (Ell5mm) is expected since resolution recovery typically takes longer for a source acquired with higher resolution setting compared to a lower resolution acquisition. The one standard deviation error bars are shown on the respective plots.
Figure 5.
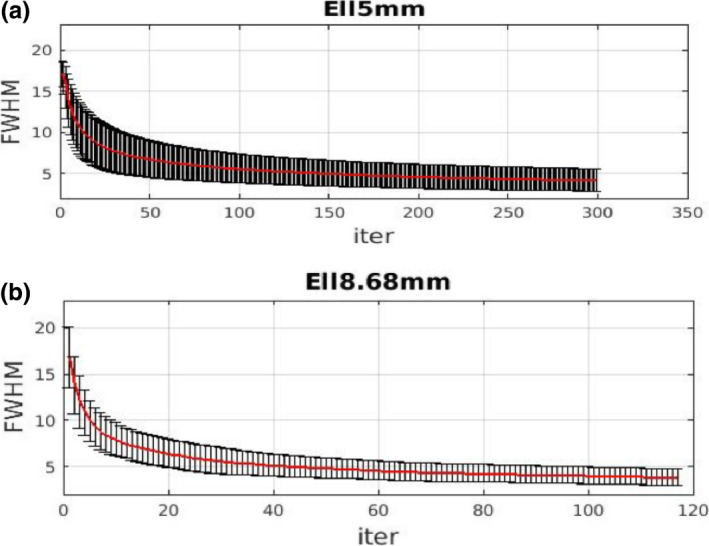
Average overall full‐width‐half‐maximum (over volume of interest) with standard deviation error bar plotted with respect to iteration. (a) Ell5mm, (b) Ell8.68mm. The two cases are stopped at iterations with similar levels of convergence (about 1.5%). [Color figure can be viewed at wileyonlinelibrary.com]
The average values and standard deviation in X, Y, Z over all the acquired points in the VOI are shown in Table 1 for the Ell5mm and Ell8.68mm (at 300th and 118th iterations, respectively). Compared to GE Discovery results,24 the FWHM are, in general, significantly lower for the Ellipsoid detector system. The overall average for the Ell8.86mm system is 4.44 mm as opposed to 6.9 mm reported for the GE Discovery system24 indicating the higher resolution in addition to higher sensitivity of our proposed system.
Table 1.
full‐width‐half‐maximum (FWHM) for reconstructed rod‐sources
| System | Average FWHM (mm) | Overall | ||
|---|---|---|---|---|
| X | Y | Z | ||
| Ell5mm | 4.21 (±1.42)a | 3.82 (±1.49) | 3.49 (±1.41) | 3.84 (±2.49) |
| Ell8.68mm | 4.84 (±1.68) | 3.97 (±1.95) | 4.52 (±1.21) | 4.44 (±2.84) |
| GE discovery 24 | 7.1 (±1.1) | 7.1 (±1.0) | 6.5 (±0.7) | 6.9 (±1) |
Quantities in brackets are the standard deviations.
Considering the postcollimator resolution recovery for the Ell5mm and Ell8.68mm cases, the average FWHM in the Y dimension is similar (within 4%), but there is about 15% difference in X and about 29.5% difference in Z. Overall, the difference is about 15.6% worse for the 8.68 mm case than the 5 mm case.
Note that the FHWM analysis of the rod‐sources is limited by the 2 mm voxel size of the reconstructed datasets.
3.C. NCAT simulation and reconstruction
Full‐system 21 projections for Ellipsoid 5 mm and Ellipsoid 8.68 mm (Ell5mmFD and Ell8.68mmFD) were acquired for 2 min assuming a full injected dose of 25 mCi (or 0.5 mCi in the heart region). The Ellipsoid system with 8.68 mm pinhole‐diameter was also acquired for 5.44 min assuming 3 mCi injected dose or 0.06 mCi in the heart region (Ell8.68mmULD).
Table 2 shows the all organ counts (from liver, heart, lungs), just the heart counts, and the estimated LV counts for the three systems. The LV counts are estimated to be 59% of the heart (based on the ratio of the sum of the activity for the LV and that of heart voxels of the NCAT phantom). Extrapolating from data for a full‐dose 14‐min acquisition,9 a 2 min acquisition for DSPECT will produce ~1.13MC (million counts) in the LV. Thus, our results indicate that the Ell5mmFD (Ellipsoid system with pinhole‐diameter 5 mm and full injected dose) have sensitivities slightly better than or comparable to the DSPECT.9 For Ell8.68ULD (Ellipsoid system with pinhole‐diameter 8.68 mm and ultra‐low injected dose of 3 mCi), the LV counts are ~1.23 M, which is slightly higher than the DSPECT,9 one of the most sensitive systems currently. For Ell8.68mmFD (full dose 8.68 mm pinhole aperture), the LV count was 3.79 M or about 3.35 times higher than DSPECT case. This is summarized in Table 3.
Table 2.
Acquired system counts for NCAT in GATE
| System | All organs | Heart‐only counts | Estimated LV counts | |||
|---|---|---|---|---|---|---|
| Total counts (M) | Average counts/proj (K) | Total counts (M) | Average counts/proj (K) | Total counts (M) | Average counts/proj (K) | |
| Ell5mmFD (Ellipsoid 5 mm, Full dose, 2 min) | 5.99 | 285.40 | 2.30 | 109.67 | 1.37 | 65.18 |
| Ell8.68mmULD (Ellipsoid 8.68 mm with 8.33 times less dose, 5.44 min) | 5.42 | 258.20 | 2.08 | 99.28 | 1.24 | 59 |
| Ell8.68mmFD (Ellipsoid 8.68 mm Full dose 2 min) | 13.14 | 625.51 | 6.38 | 303.81 | 3.79 | 180.67 |
Table 3.
Summary of estimated LV counts
| Ell8.68mm 3 mCi, 5.44 min | Ell8.68mm 25 mCi, 2 min | DSPECT9 25 mCi, 2 min |
|---|---|---|
| 1.24 Million | 3.79 Million | 1.13 Million |
Table 4 shows the FWHM analysis (explained in Section 2.D) on NCAT short‐axis slices for the three systems. Mid‐short‐axis slice was the average FWHM over three slices around and including the mid‐axial slice and four profiles each. Note that before the Gaussian fit, each profile sums three adjacent lines to reduce noise. Similarly, the values are obtained for the base region and the apex region. Note that the FHWM analysis of the NCAT reconstructions is limited by the 4.67 mm voxel size of the reconstructed datasets. We observe that these FWHM values are consistent with those obtained with rod‐sources. They are slightly higher as expected with the higher voxel size of reconstruction.
Table 4.
NCAT short‐axis slice full‐width‐half‐maximum (FWHM) analysis (after 12 OSEM iterations)
| Average FWHM (mm) | |||
|---|---|---|---|
| Ell5mmFD | Ell8.68mmULD | Ell8.68mmFD | |
| Mid‐short‐axial | 3.83 | 5.66 | 4.95 |
| Near‐base | 4.30 | 5.74 | 5.62 |
| Near‐apex | 4.37 | 6.39 | 6.69 |
The short axis and long axes slices are shown at 12th OSEM iteration in Fig. 6 after applying a clinical level of smoothing (fifth‐order 3D Butterworth, 0.185 cutoff). The 12th OSEM iteration (approximately 72 MLEM) was chosen qualitatively as additional iterations increased the noise without a perceptible change in image quality.
Figure 6.
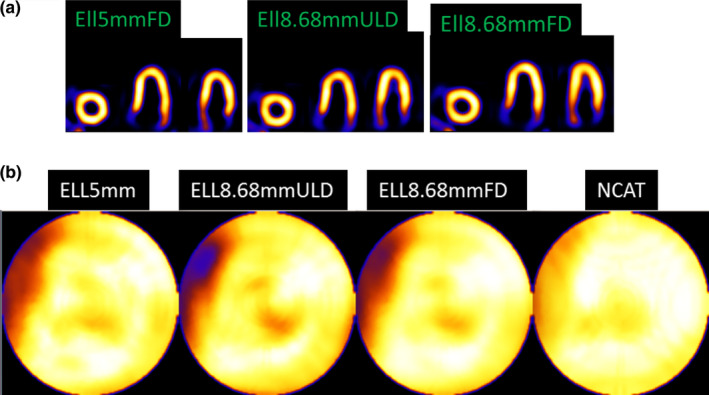
(a) Reconstructed and reoriented slices after 12 OSEM iterations and clinical levels of smoothing for Ell5mmFD (full dose, 5 mm diameter), Ell8.68mmULD (ultra‐low dose, 8.68 mm diameter), and Ell8.68mmFD (full dose, 8.68 mm diameter). (b) Polar maps are shown for smoothed Ellipsoid detector systems and NCAT phantom smoothed by the same amount. All (including smoothed NCAT) have the septal wall thinning (white arrow) as present for other geometries and reconstructions.7, 28 Note that the mapping procedure expands the base region, spreading out small artifacts. [Color figure can be viewed at wileyonlinelibrary.com]
In Fig. 6(a), we also included a Flat detector case with 8.68 mm pinhole‐diameter. We note that the flat detector results are according to our geometry and should not be assumed to be similar to GE system which has different geometrical dimensions and configurations of the detector‐pinhole units.
The polar maps are also shown in Fig. 6(b). The NCAT phantom is similarly smoothed and its polar map is shown for comparison. The Ellipsoid systems follow the shape of the NCAT phantom well and Ell8.68mmFD shows least noise and best match overall to smoothed NCAT.
Note that, in Fig. 6(b), there is a septal and apical cooling (present for all the cases — including, to a smaller extent, the smoothed NCAT). These are due to the well‐known wall thinning of the NCAT phantom, present to different extents for reconstructions for other systems as well.29, 32 For the septal reduced count region near the base, the polar mapping process itself (opening/flattening the ellipsoid) significantly enlarges the artifact. Near the region of consideration, the narrowing of the NCAT wall results in a partial volume effect (PVE). We observed that for the Ellipsoid 8.68mmULD, this PVE artifact was higher. Therefore, we investigated this case further. For the Ell8.68mmULD case, we increased the sampling via subdividing each voxel. Using our method in Ref. 27, we subdivided by a factor of 2 in two directions in the planes horizontally below each pinhole and by a factor of 1 along the axial direction. This reduced the PVE artifact, as shown in Fig. 7.
Figure 7.
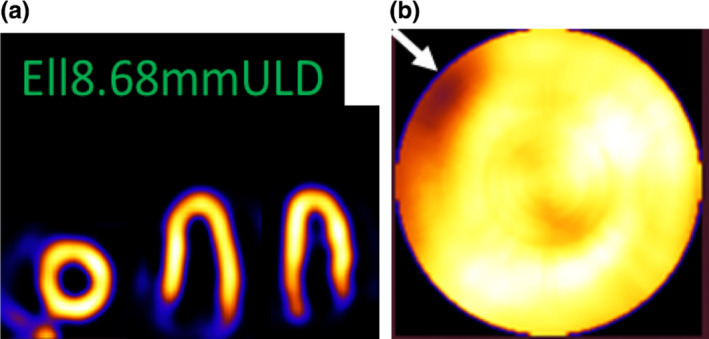
Ell8.68mmULD reconstructed with voxel subdivision of factor of 2 in two directions. (a) Short‐axis and two long‐axis slices and (b) Polar map. The artifact (white arrow) is much reduced (see white arrow) from case in Fig. 6. [Color figure can be viewed at wileyonlinelibrary.com]
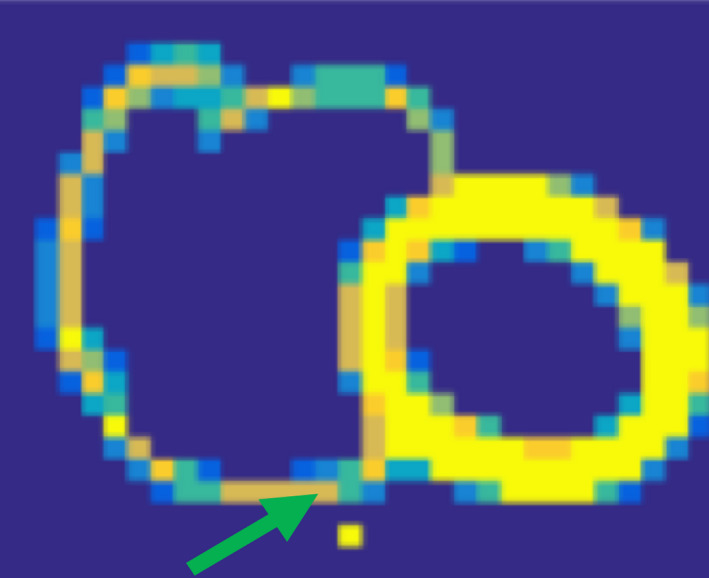
In Figs. 8(a) and 8(b), we also showed a flat detector case reconstructed with resolution recovery (and voxel subdivision similar to Fig. 7) with a 5 mm pinhole‐diameter. We immediately note that the image resolution is worse than the Ellipsoid 5 or 8.68 mm cases (FD or ULD). Additionally, we have some reduced count inhomogeneity in the inferior wall, perhaps due to PVE and extra‐cardiac activity.32 It is noted that the flat detector at 5 mm pinhole‐diameter results is in accordance with our system geometry and should not be assumed to be identical to the GE system, which has different geometrical configurations and dimensions of the detector‐pinhole units.
Figure 8.
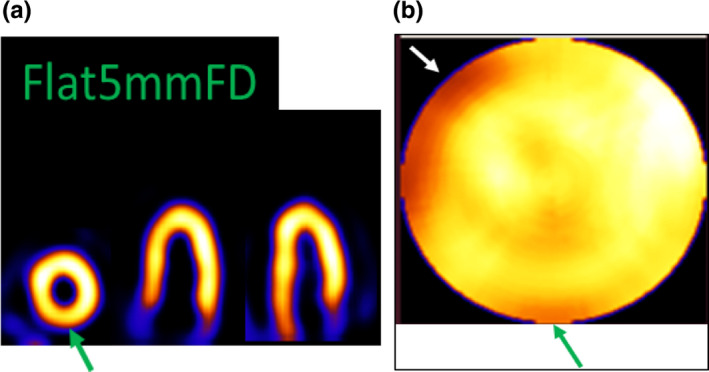
Flat5mFD reconstructed with voxel subdivision of factor of 2 in two directions. (a) Short‐axis and two long‐axis slices and (b) polar map. The green arrow shows a count reduction in inferior wall. [Color figure can be viewed at wileyonlinelibrary.com]
To fully appreciate the truncation effects (mainly in the extra‐cardiac activity such as liver), we have included a full coronal slice in Fig. 9. To reduce noise for display purposes, a light two‐dimensional smoothing was applied to the slice. The 3 × 3 kernel was 1 in center and 0.25 elsewhere and then normalized before application.
Figure 9.
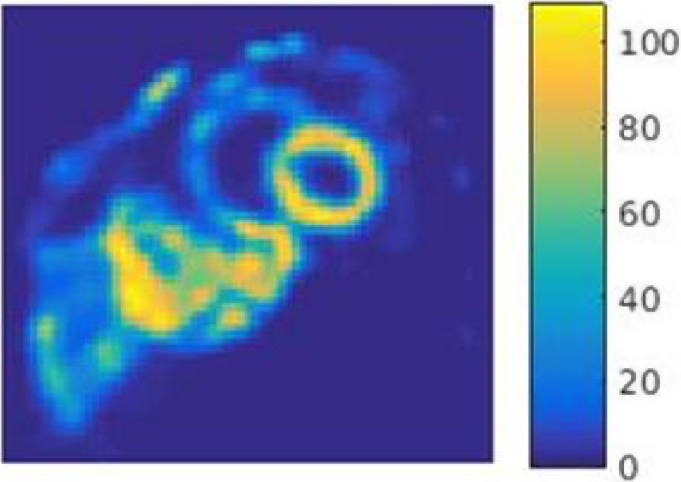
A full coronal slice shown to visualize truncation effects of extra‐cardiac activity such as liver. A light 2D smoothing with a weighted and normalized 3 × 3 kernel is applied for displaying the noisy data. [Color figure can be viewed at wileyonlinelibrary.com]
Gate simulations included pinhole penetration effects. However, analytical simulations showed that, given our collimator geometry (annular lead cone of ~1 cm thickness), penetration through the pinhole was negligible (<1%) and first‐order correction showed imperceptible changes in the quality of reconstructed images.
Finally, bias vs iterations and variance vs iterations are shown for analytical forward simulations and the MPH iterative reconstruction with resolution recovery in Fig. 10. The biases roughly converge as expected due to resolution recovery. Ell5mmFD was noisier than Ell8.68mmULD, even though they have similar counts. This can be potentially explained by the lower resolution acquisition for Ell8.68mmULD and resolution recovery. This is consistent with the slightly higher resolution for Ell5mmFD for rod‐sources and short‐axis slices for NCAT.
Figure 10.
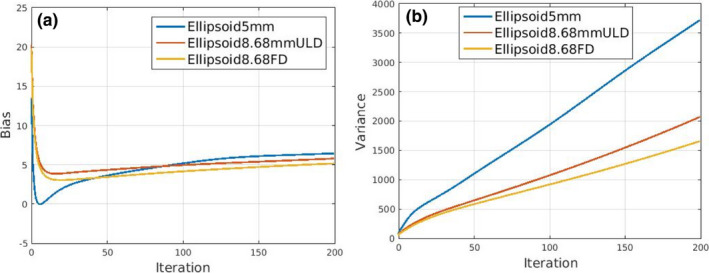
(a) Bias vs iterations and (b) variance vs iterations of the three systems Ell5mmFD, Ell8.68mmULD, and Ell8.68mmFD. [Color figure can be viewed at wileyonlinelibrary.com]
In summary, the Ellipsoid detector system setting with 8.68 mm diameter pinholes can acquire similar counts as a clinical system for an ultra‐low dose injection of 3 mCi in 5.44 min or 3.35 times higher counts for full‐dose 2 min. The rod‐source analyses show an average of ~4.44 mm resolution within VOI for the ellipsoid detector system with 8.68 mm diameter pinholes.
4. Discussion and future work
We showed (Tables 1, 2, 3, 4) that the Ellipsoid detector system setting with 8.68 mm diameter pinholes achieves a higher sensitivity as well as similar or better resolution than state‐of‐the‐art systems. Note that the system has stationary arrangement of detector‐pinhole units, thus can be used for dynamic SPECT imaging where the additional sensitivity will be useful.
Since our system configuration geometry (arrangement of 21 detector‐pinholes) and other system parameters are different from clinical MPH GE Discovery system, we compared the FWHMs of the ellipsoid system (with different pinholes and dose/time) directly with a clinical GE Discovery system in reconstruction space with the comprehensive data available from the literature.
For this work, the depth of interaction is assumed to be resolved (to within 3 mm or half the crystal thickness33), and GATE events are binned to 3 mm voxel‐size detector. The curved nature of the detector promises to be helpful in lateral as well as depth positioning.34 We are building a GEANT4‐based look‐up‐table (LUT) algorithm to recover the depth of interaction for a possible light readout for a system.
One of the drawbacks of a MPH dedicated system such as ours or the GE Discovery system is that the resolution is not uniform throughout the field of view as apparent in our Fig. 4 and GE system performance.24 The primary reason for this variation is the different object distances for the different pinholes. The differences are exacerbated by the fact that the object distances are smaller, compared to say all‐purpose Anger gamma cameras. The smaller distances contribute to sensitivity improvement for the dedicated cameras compared to the all‐purpose Anger gamma cameras. The impact of the FWMH variation on an extended object like the heart and particularly on a cardiac lesion detection task, while not expected to be significant, will have to be evaluated thoroughly in the future.
For this study, the NCAT phantom is assumed to be stationary. However, similar to clinical acquisitions with other systems, the proposed acquisition times of 2 min (full dose) or 5.44 min (ultra‐low dose) will include motion blur due to breathing. Steps may need to be taken to estimate the motion and correct for it within reconstruction, similar to our prior work.32
In this work, NCAT CT map was used to estimate the attenuation for correction. In practice, we will require a CT system adjacent to the SPECT to obtain the attenuation map.
As with the GE Discovery and DSPECT system, patient placement for such compact geometry systems is important and will be investigated in the future. The alignment will be performed with 30 s scout scans and real‐time 3D reconstruction (to distinguish the liver and heart counts). Postreconstruction, the alignment will be adjusted so that the heart area is well within the FOV.
The hemi‐ellipsoid detector crystal volume is 156275.38 mm3, about 3.91 times higher than having a flat disk at the base. The detectors are stationary, reducing maintenance cost. The one‐time manufacturing cost of building the detector and readout is weighed against the dose and/or potential diagnostic benefits to the patient over the lifetime of the system. The high sensitivity and stationary design enables dynamic SPECT. The stationary design also reduces maintenance cost.
5. Conclusion
Our Monte‐Carlo simulation studies and reconstruction suggest that using (inverted wineglass sized) hemi‐Ellipsoid detectors with pinhole collimators can increase the sensitivity about three times over the new generation of dedicated cardiac SPECT systems (and more than an order of magnitude over standard clinical systems) with average system resolution at 4.44 mm over the VOI, after resolution recovery in reconstruction. The extra sensitivity may be used for ultra‐low dose imaging (3 mCi) at ~5.44 min, potentially benefitting millions of patients. Also, the stationary geometry and fast acquisition will allow for dynamic imaging where the extra sensitivity will be particularly useful.
Acknowledgments
We wish to thank Hanif Soysal (graduate student, Medical Physics, LSU), for proofreading this document. This work was funded in parts by NHLBI grant R21 HL102574 and LSU College of Science and the Department of Physics & Astronomy. The contents are solely the responsibility of the authors and do not represent the official views of the institutes or university. The authors have no conflicts to disclose. The GATE simulations in this study were executed at the High Performance Computing Cluster Facility, Louisiana State University.
References
- 1. Hall EJ, Giaccia AJ. Radiobiology for the Radiologist, 7th edn. Philadelphia, PA: Wolters Kluwer Health; 2011. [Google Scholar]
- 2. Einstein AJ, Moser KW, Thompson RC, Cerqueira MD, Henzlova MJ. Radiation dose to patients from cardiac diagnostic imaging. Circulation. 2007;116:1290–1305. [DOI] [PubMed] [Google Scholar]
- 3. Duvall WL, Guma KA, Kamen J, et al. Reduction in occupational and patient radiation exposure from myocardial perfusion imaging: impact of stress‐only imaging and high‐efficiency SPECT camera technology. J Nucl Med. 2013;54:1251–1257. [DOI] [PubMed] [Google Scholar]
- 4. Mukherjee JM, Johnson KL, McNamara JE, King MA. Quantitative study of rigid‐body and respiratory motion of patients undergoing stress and rest cardiac SPECT imaging. IEEE Trans Nucl Sci. 2010;57:147–155. [DOI] [PMC free article] [PubMed] [Google Scholar]
- 5. Mukherjee JM, Hutton BF, Johnson KL, Pretorius PH, King MA. An evaluation of data‐driven motion estimation in comparison to the usage of external‐surrogates in cardiac SPECT imaging. Phys Med Biol. 2013;58:7625–7646. [DOI] [PMC free article] [PubMed] [Google Scholar]
- 6. Mitra J, McNamara J, Johnson K, Dey J, King MA. Estimation of rigid‐body and respiratory motion of the heart from marker‐tracking data for SPECT motion correction. IEEE Trans Nucl Sci. 2009;56:147–155. [DOI] [PMC free article] [PubMed] [Google Scholar]
- 7. Dey J, Segars WP, Pretorius PH, King MA. Effect of non‐alignment/alignment of attenuation map without/with emission motion correction in cardiac SPECT/CT. IEEE Trans Nucl Sci. 2015;62:1813–1824. [DOI] [PMC free article] [PubMed] [Google Scholar]
- 8. Slomka PJ, Patton JA, Berman DS, Germano G. Advances in technical aspects of myocardial perfusion SPECT imaging. J Nucl Cardiol. 2009;16:255–276. [DOI] [PubMed] [Google Scholar]
- 9. Nakazato R, Berman DS, Hayes SW, et al. Myocardial perfusion imaging with a solid‐state camera: simulation of a very low dose imaging protocol. J Nucl Med. 2013;54:373–379. [DOI] [PMC free article] [PubMed] [Google Scholar]
- 10. Chan C, Dey JI, Grobshtein Y, et al. The impact of system matrix dimension on small FOV SPECT reconstruction with truncated projections. Med Phys. 2016;43:213–224. [DOI] [PMC free article] [PubMed] [Google Scholar]
- 11. Erlandsson K, Kacperski K, van Gramberg D, Hutton BH. Performance evaluation of D‐SPECT: a novel SPECT system of nuclear cardiology. Phys Med Biol. 2009;54:2635–2649. [DOI] [PubMed] [Google Scholar]
- 12. Gambhir SS, Berman DS, Ziffer J, et al. A novel high‐sensitivity rapid‐acquisition single‐photon cardiac imaging camera. J Nucl Med. 2009;50:635–643. [DOI] [PubMed] [Google Scholar]
- 13. Volokh L, Lahat C, Binyamin E, Blevis I. Myocardial perfusion imaging with an ultra‐fast cardiac SPECT camera – a phantom study. In: Proceedings of IEEE NSS‐MIC, Dresden, Germany, 4636‐4639, Oct 19‐25; 2008.
- 14. Blevis I, Tsukerman L, Volokh L, Hugg J, Jansen F, Bouhnik JP. CZT Gamma Camera with Pinhole Collimator: Spectral Measurements. In: Proceedings of IEEE NSS‐MIC, Dresden, Germany, 4931‐4932, Oct 19‐25, 2008.
- 15. Volokh L, Hugg J, Blevis I, Asma E, Jansen F, Manjeshwar R. Effect of detector energy response on image quality of myocardial perfusion SPECT. In: Proceedings of IEEE NSS‐MIC, Dresden, Germany, 4043‐4036, Oct 19‐25; 2008.
- 16. Esteves FP, Raggi P, Folks RD, et al. Novel solid‐state‐detector dedicated cardiac camera for fast myocardial perfusion imaging: multicenter comparison with standard dual detector cameras. J Nucl Cardiol. 2009;16:927–934. [DOI] [PMC free article] [PubMed] [Google Scholar]
- 17. Diagnostic and Interventional Cardiology . Recent Advances in Cardiac Nuclear Imaging Technology. Accessed on 23rd October 2018, https://www.dicardiology.com/article/recent-advances-cardiac-nuclear-imaging-technology
- 18. Duvall WL, Savino JA, Levine EJ, et al. A comparison of coronary CTA and stress testing using high‐efficiency SPECT MPI for the evaluation of chest pain in the emergency department. J. Nucl Cardiol. 2014;21:305–318. [DOI] [PubMed] [Google Scholar]
- 19. Duvall WL, Hiensch RJ, Levine EJ, Croft LB, Henzlova MJ. The prognosis of a normal Tl‐201 stress‐only SPECT MPI study. J Nucl Cardiol. 2012;19:914–921. [DOI] [PubMed] [Google Scholar]
- 20. Des Prez RD, Dahlberg ST, Einstein AJ, et al. Stress‐only myocardial perfusion imaging, ASNC clinical update. J Nucl Cardiol. 2009;16:329. [Google Scholar]
- 21. Dey J, Glick SJ. SPECT Camera Design. Patent No., US 8,519,351 B2, Aug 27, 2013.
- 22. Dey J. Improvement of performance of cardiac SPECT camera using curved detectors with pinholes. IEEE Trans Nucl Sci. 2012;59:334–347. [DOI] [PMC free article] [PubMed] [Google Scholar]
- 23. Kalluri K, Bhusal N, Shumilov D, et al. Multi‐pinhole cardiac SPECT performance with hemi‐ellipsoid detectors for two geometries. In: Proceedings of IEEE NSS‐MIC, Oct; 2015.
- 24. Kennedy JA, Israel O, Frenkel A. 3D iteratively reconstructed spatial resolution map and sensitivity characterization of a dedicated cardiac SPECT camera. J Nucl Cardiol. 2014;21:443–452. [DOI] [PubMed] [Google Scholar]
- 25. Jan S, Santin G, Strul D, et al. GATE ‐ Geant4 application for tomographic emission: a simulation toolkit for PET and SPECT. Phys Med Biol. 2004;49:4543–4561. [DOI] [PMC free article] [PubMed] [Google Scholar]
- 26. Segars WP, Lalush DS, Tsui BMW. A realistic spline‐based dynamic heart phantom. IEEE Trans Nucl Sci. 1999;46:503–506. [Google Scholar]
- 27. Dey J. Comparing different geometries and reconstruction algorithms for multiple pinhole cardiac SPECT using NCAT. In: Proceedings of 2011 IEEE NSS‐MIC, 4051‐4058, Oct; 2011.
- 28. Feng B, Chen M, Bai B, et al. Modeling of the point‐spread‐function by numerical calculations in single‐pinhole and multi‐pinhole SPECT reconstruction. IEEE Trans Nucl Sci. 2010;57:173–180. [Google Scholar]
- 29. Dey J, King MA. Theoretical and numerical study of MLEM and OSEM reconstruction algorithms for motion correction in emission tomography. IEEE Trans Nucl Sci. 2009;56:2739–2749. [DOI] [PMC free article] [PubMed] [Google Scholar]
- 30. El Fakhri G, Buvat I, Todd‐Pokreopek A, Di Paola R. Relative impact of scatter, collimator response, attenuation and finite spatial resolution corrections in cardiac SPECT. J Nucl Med. 2000;41:1400–1408. [PubMed] [Google Scholar]
- 31. Narayanan MV, King MA, Pretorius PH, et al. Human‐observer receiver‐operating‐characteristic evaluation of attenuation, scatter, and resolution compensation strategies for 99mTc myocardial perfusion imaging. J Nucl Med. 2003;44:1725–1734. [PubMed] [Google Scholar]
- 32. Dey J, Segars WP, Walvick RP, et al. Estimation and correction of cardiac respiratory motion in presence of limited angle effects due to irregular respiration in SPECT. Med Phys. 2010;37:6453–6465. [DOI] [PMC free article] [PubMed] [Google Scholar]
- 33. Bettiol M, Preziosi E, Cinti MN, et al. A depth‐of‐interaction encoding method for SPECT monolithic scintillation detectors. In: 18th International Workshop on Radiation Imaging Detectors, JInstr, 10, C12054; 2016.
- 34. Dey J, Bhusal N, Matthews K, et al. Point‐Source Measurements using a Dome Shaped CsI Detector for Cardiac SPECT. In: Presented 2017 IEEE NSS‐MIC, Atlanta, Georgia, Oct; 2017.


