

Abstract
Two myo-inositol derivatives having an Nα,Nε-diacetyl-L-lysine (Ac2Lys) moiety linked to the inositol 1-O-position through a self-cleavable linker and a metabolically stable 2-azidoethyl group linked to the inositol 3-O- and 4-O-positions, respectively, were designed and synthesized. The Ac2Lys moiety blocking the inositol 1-O-position required for GPI biosynthesis was expected to be removable by a combination of two enzymes, histone deacetylase (HDAC) and cathepsin L (CTSL), abundantly expressed in cancer cells, but not in normal cells, to transform these inositol derivatives into biosynthetically useful products with a free 1-O-position. As a result, it was found that these inositol derivatives could be incorporated into the glycosylphosphatidylinositol (GPI) biosynthetic pathway by cancer cells, but not by normal cells, to express azide-labeled GPIs and GPI-anchored proteins on cell surfaces. Consequently, this study has established a novel strategy and new molecular tools for selective metabolic labeling of cancer cells, which should be useful for various biological studies and applications.
Keywords: glycosylphosphatidylinositol, glycolipid, inositol derivative, metabolic engineering, labeling, cancer
Graphical Abstract
This study has established a new strategy and new molecular tools for selective metabolic labeling of inositol on cancer cells, which should be useful for cancer targeting and study of GPI-anchored proteins.
Introduction
Glycosylphosphatidylinositols (GPIs) are complex glycolipids attached to the C-terminus of some membrane proteins during the post-translational process.1 In mammals, approximately one to two percent of translated proteins are GPI-attached.2 GPIs help anchor proteins onto the cell surface through inserting their lipid tails into the outer leaflet of the cell membrane.3, 4 Apart from membrane insertion, GPI anchors may also impart great flexibility for target proteins to function properly as signal or recognition molecules. Thus, GPI-anchored proteins (GPI-APs) have been shown to play a key role in various physiological and pathological processes,5, 6 such as signal transduction, cell differentiation and adhesion, immune recognition, and tumor metastasis.7–11 Defects in GPI anchor biosynthesis have been demonstrated to be associated with disorders. For example, impaired GPI linkage to the decay accelerating factor (DAF) molecule in red blood cells results in paroxysmal nocturnal hemoglobinuria (PNH) in humans.12
The core structure of GPI anchors, as shown in Figure 1, consists of a phosphatidylinositol (PI) moiety and a tetrasaccharide motif, Manα(1→2)Manα(1→6)Manα(1→4)GlcNα(1→, linked to the myo-inositol 1-O- and 6-O-positions, respectively, as well as a phosphoethanolamine (PEA) group linked to the 6-O-position of the terminal Man unit. Proteins are appended to this conserved PEA group.13–15 Whereas the GPI core structure is conserved in all eukaryotes, different lipid chains and additional modifications of the core glycan with sugar chains and PEA groups were identified in GPI anchors derived from different species and cell types and from different GPI-APs to represent their structural diversity.16 GPI biosynthesis is independent of protein biosynthesis and involves over 20 specific enzymes.17 Such a complex biosynthetic pathway and varied structures of GPIs are indicative of the diverse functions that they may have.6, 18
Figure 1.
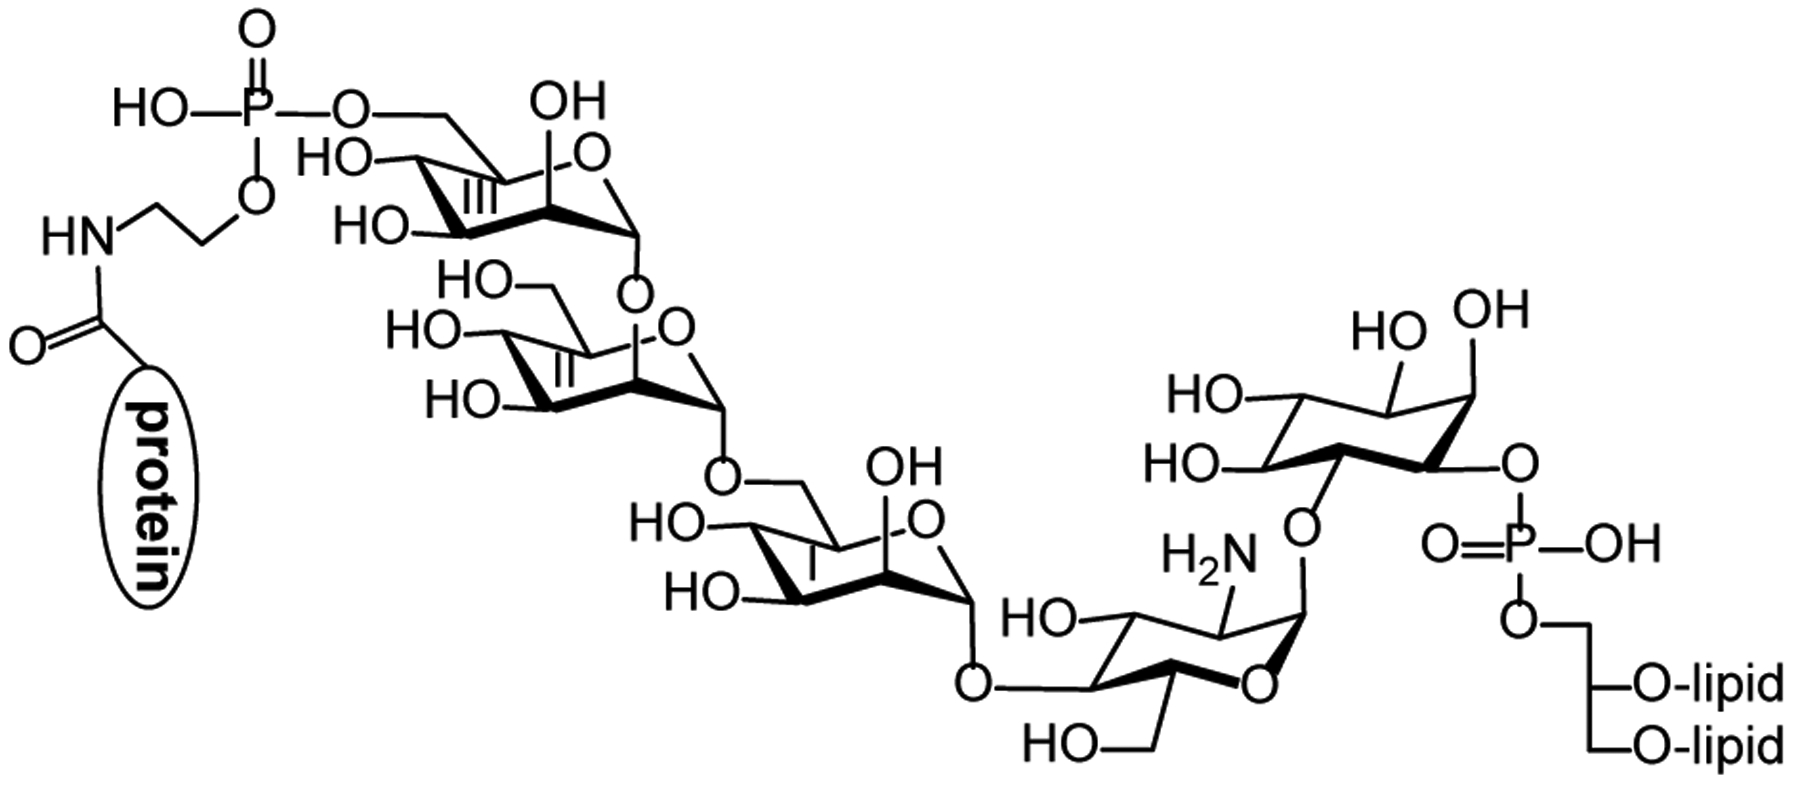
GPI-APs carrying the GPI core structure
GPI-APs are produced by a transamidation reaction between the independently biosynthesized GPI anchors and to-be-anchored proteins.15, 19 This process is catalyzed by an enzyme known as GPI transamidase (GPI-T), a complex multiple subunit enzyme. In recent years, it has been shown that GPI-T is overexpressed in tumors such as breast cancer, bladder cancer and colon cancer.20–24 Moreover, a direct correlation between GPI-T overexpression and elevated GPI-AP levels has been established in many human tumors.20, 21, 25 Although the exact role of GPI-APs in tumorigenesis is yet to be discovered, it seems promising to explore GPI-APs as potential biomarkers or use them as targets for developing novel cancer diagnostics and therapeutics.
However, due to the amphiphilic nature of GPI-APs and their low abundance, great structural diversity and membrane association on the cell surface, GPI-AP identification and isolation from live cells remain challenging to date. In literature, both detergent and enzyme-based methods have been explored for GPI-AP isolation with only limited success.26 A non-destructive method using an azide-modified galactosamine derivative to metabolically engineer and tag GPI anchors was developed for the isolation and investigation of GPI-APs.27 However, this method was constrained by its narrow applicability scope to only a subset of GPI-APs that have an additional galactosamine modification on their GPI core structure.
Our group has recently reported a strategy using partially or fully acetylated inositol analogs bearing an azido group at the 3-O- and 4-O-positions, respectively, as GPI precursors for metabolic engineering of GPI-APs on live cells. Azide-labeled GPI-APs expressed on the cell surface were then modified with a fluorescent probe or a biotin molecule as the affinity tag via click chemistry for their detection and isolation.28 This technique can have some advantages over other techniques. For example, the occurrence of inositol on the cell surface is relatively restricted to GPI anchors, making the labeling technique relatively specific for GPI-APs. In addition, the bioorthogonal click reaction may have improved selectivity and reduced cross-reactivity compared to the reactions of antibodies and lectins. However, like other reported techniques, this strategy would label GPI-APs on various cell types indiscriminately.
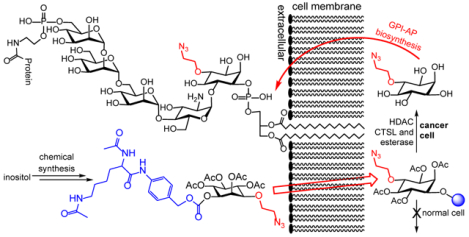
The present work aimed to develop a new metabolic engineering method for selective labeling of GPI-APs on cancer cells. In this regard, we proposed to utilize a 3-O- or 4-O-azidoalkyl inositol derivative with its 1-O-position masked with a group that can be removed only in cancer cells for GPI metabolic engineering. As the phosphatidyl moiety is attached to the inositol 1-O-position in GPIs, we anticipated that masking this position would prevent normal cells from incorporating the inositol derivative into GPI biosynthesis. In contrast, cancer cells would be able to deprotect the 1-O-position of the inositol derivative via a cancer-specific enzymatic process and incorporate the product in GPI biosynthesis (Figure 2). Consequently, metabolic engineering and labeling of GPI-APs by such inositol derivatives would be specific for cancer cells.
Figure 2:

Selective labeling of GPIs and GPI-APs on cancer cells through metabolic engineering using an inositol derivative having the 1-O-position protected with a functional group that can be selectively removed by enzymes especially expressed by cancer cells to facilitate the incorporation of the tagged inositol in the GPI biosynthetic pathway.
Results and Discussion
Inositol derivatives designed for selective metabolic engineering of cancer cell.
To explore the above hypothesis for cancer cell-specific GPI/GPI-AP labeling, we designed and synthesized two inositol derivatives 1 and 2 (Scheme 1) having a 2-azidoethyl group linked to the myo-inositol 3-O- and 4-O-positions, respectively, and the 1-O-position protected with an Nα,Nε-diacetyl-L-lysine (Ac2Lys) moiety via a self-cleavable linker, p-aminobenzyl alcohol (PABA).29, 30 The remaining positions of inositol were acetylated to help improve their lipophilicity and thereby their cell permeability. It was anticipated that once getting inside cancer cell, the Ac2Lys moiety in Ac2Lys-inositol conjugates 1 and 2 would be removed by a combination of two enzymes, that is, histone deacetylase (HDAC) and cathepsin L (CTSL). HDAC and CTSL are abundantly expressed by and mainly present in the cytoplasm of various cancer cells, which is the rationale why Ac2Lys can be utilized to design cancer-selective prodrugs or sugar derivatives for cell glycan engineering.31–33 Subsequently, the exposed PABA linker would degrade spontaneously to yield inositol derivatives 3 and 4 with free 1-O-position. In the meantime, the O-acetyl groups in 3 and 4 or 1 and 2 would be removed by esterases and lipidases in cells34 to release 5 and 6 (Scheme 1), respectively, which can be incorporated into the core structure of biosynthetic GPI anchors. In contrast, owing to the limited expression of HDAC and CTSL in normal cells, they could not deprotect the 1-O-position of 1 and 2, thus preventing their incorporation into the GPI biosynthetic pathway.
Scheme 1:
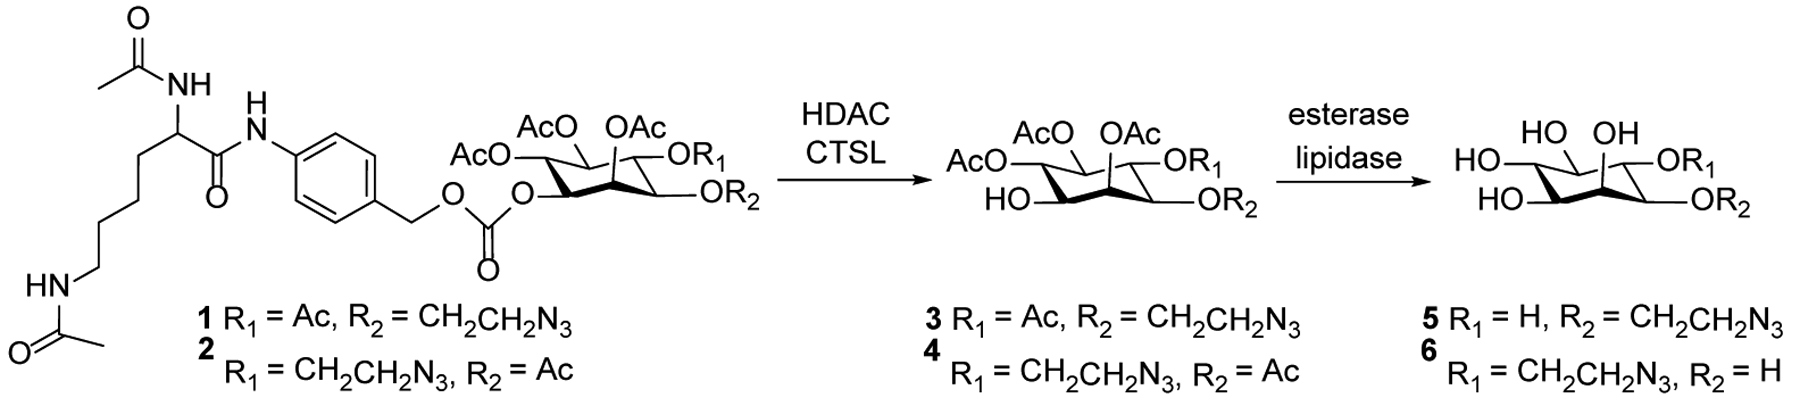
Structures of proposed Ac2Lys-inositol conjugates 1 and 2 and the enzymatic reactions required to convert them into inositol derivatives that can be used by cells to biosynthesize labeled GPIs and GPI-APs
Chemical synthesis of Ac2Lys-inositol conjugates 1 and 2.
These syntheses commenced with the conversion of myo-inositol into its optically pure derivatives 7 and 8 (Scheme 2) according to the reported procedure.28 Hydrolysis of the strained trans-ketal in 7 under mildly acidic conditions was regioselective, which was followed by allylation to generate 9. Subsequent hydrolysis of the remaining ketal group in 9 afforded diol 10 in an excellent yield. To distinguish the 1-O- and 2-O-positions in 10, we attempted first tin complex-directed alkylation employing various alkyl halides, but these reactions turned out to be very complex with the formation of deallylation side products. Alternatively, we attempted the selective orthoester ring-opening strategy.35, 36 Consequently, 10 was converted into orthoester through reaction with trimethyl orthoacetate in the presence of para-toluenesulfonic acid. Trifluoroacetic acid (TFA)-catalyzed orthoester ring-opening was proved to be highly regioselective to provide 11 in an impressive 98% yield over two steps. The acetylation site was verified by the proton NMR spectrum of 11, in which a significant downfield shift of the 2-H proton (equatorial, JH1,H2 = JH2,H3 = 2.5 Hz) signal as a result of acetylation was observed. Subsequently, a flexible levulinic (Lev) group was installed to temporarily protect the 1-O-position in 11, which was followed by swapping of all the allyl groups with acetyl groups in two separate steps, including [Cp-Ru(CH3CN)3]PF6/quinaldic acid-mediated deallylation37 and then acetylation to generate 13 smoothly. Finally, the Lev group in 13 was selectively removed with hydrazine acetate to provide key intermediate 4. Intermediate 3 was efficiently prepared from 8 following the same protocol (Scheme 2).
Scheme 2.
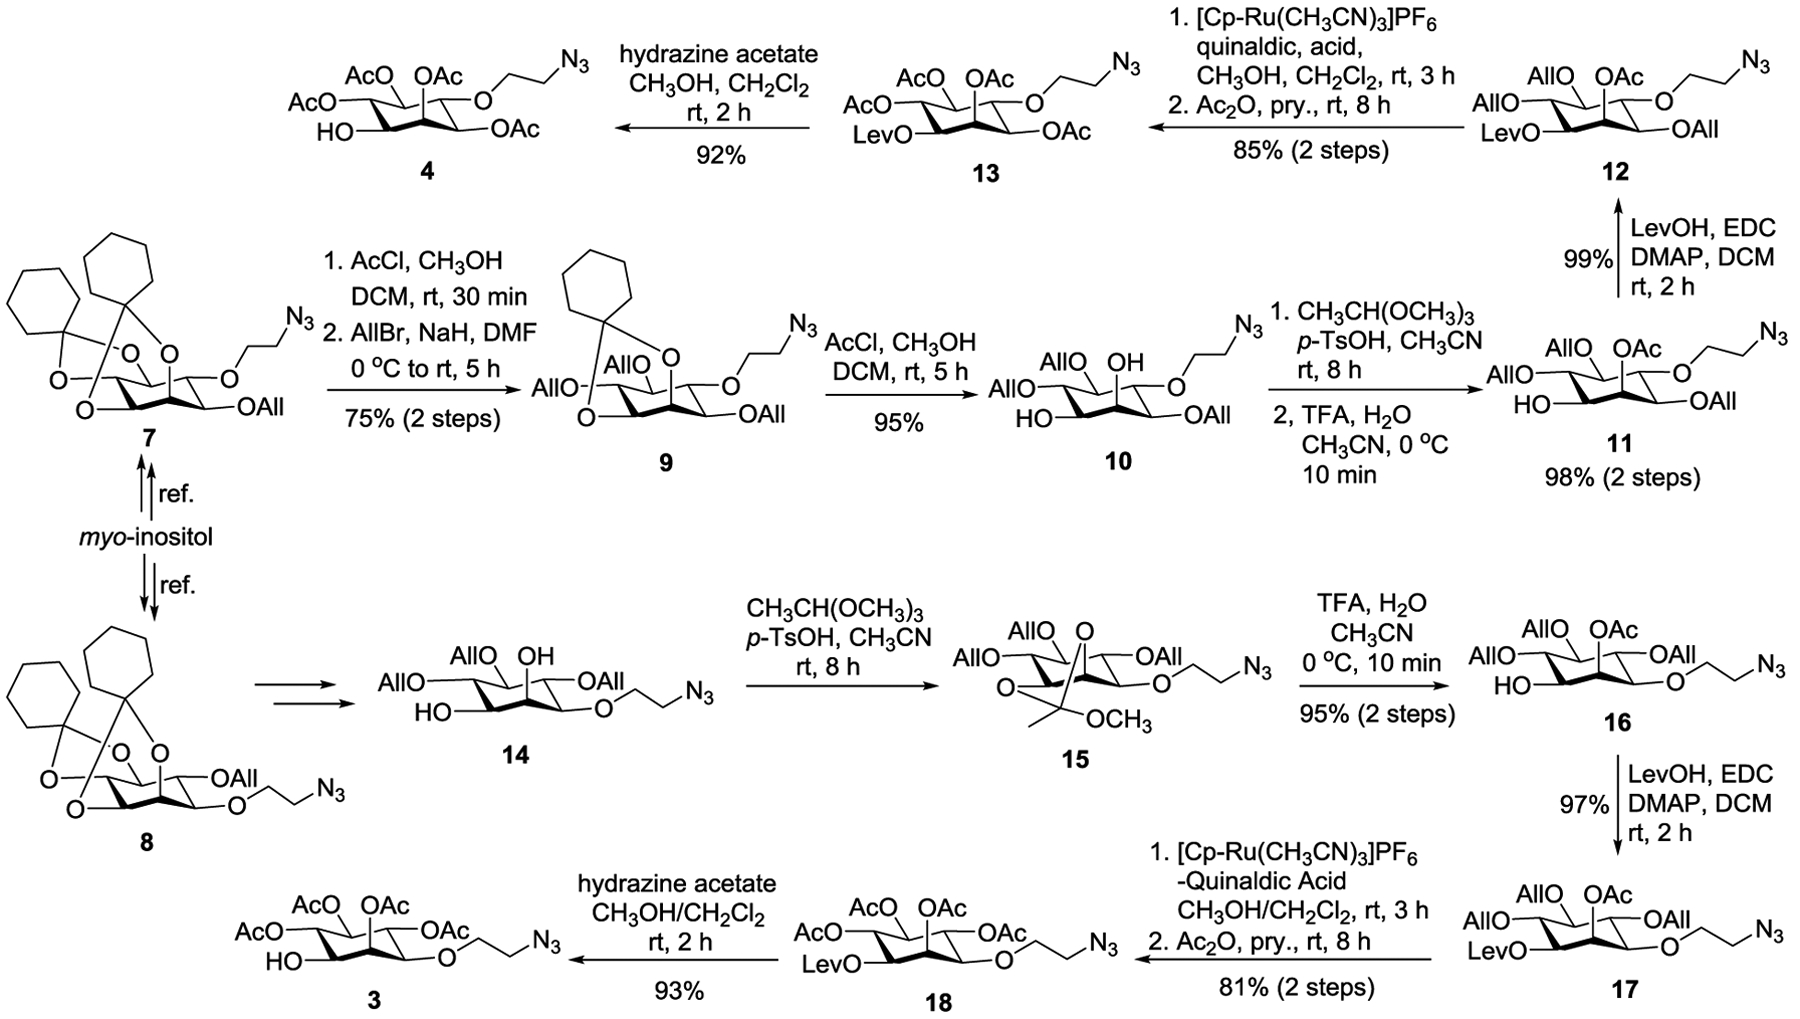
Preparation of the key intermediates 3 and 4
Finally, the resultant inositol derivatives 3 and 4 were coupled with the Ac2Lys moiety through PABA (Scheme 3). For this purpose, 3 and 4 were transformed into activated esters 19 and 20 by reacting with para-nitrophenyl chloroformate. In the meantime, Ac2Lys 21 was linked to PABA in the presence of hexafluorophosphate azabenzotriazole tetramethyl uronium (HBTU) and N,N-diisopropylethylamine (DIPEA) to yield 22. Eventually, 19 and 20 were conjugated with 22 at 60 °C to produce the synthetic targets 1 and 2 in very good yields (80–82%).
Scheme 3.
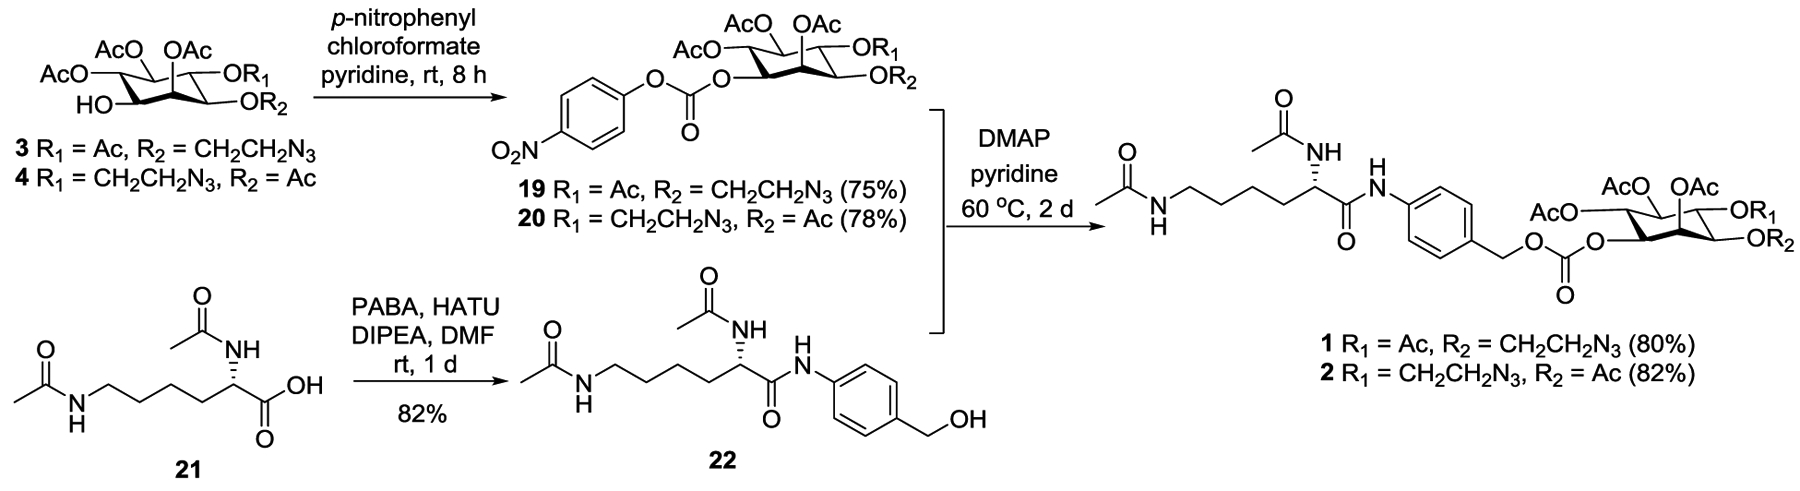
Efficient completion of desired precursors 1 and 2
Metabolic engineering of cells to express labeled GPIs/GPI-APs.
Since compounds 3 and 4 are novel inositol derivatives, their activities to metabolically engineer GPI labeling of cells needed to be confirmed. For this purpose, we treated MCF-7 cell, a human breast cancer cell line, with 3 and 4 (200 μM) or PBS (the control) individually. After 48 h of incubation, the cells were subjected to strain-promoted azide-alkyne cycloaddition (SPAAC) reaction employing a dibenzocyclooctyne-fluorophore conjugate, DBCO-Cy5, to label the metabolically modified GPIs for their detection by flow cytometry. The results in Figure 3A showed that cells treated with 3 and 4 had a significant (P < 0.05) increase in the mean fluorescence intensity (MFI) when compared to the control group of cell treated with PBS. This study suggested that MCF-7 cell could efficiently uptake 3 and 4 and incorporate them in the biosynthetic pathway of GPI anchors for their metabolic engineering. Furthermore, compounds 3 and 4 seemed to have comparable labeling efficiency (P > 0.05).
Figure 3:
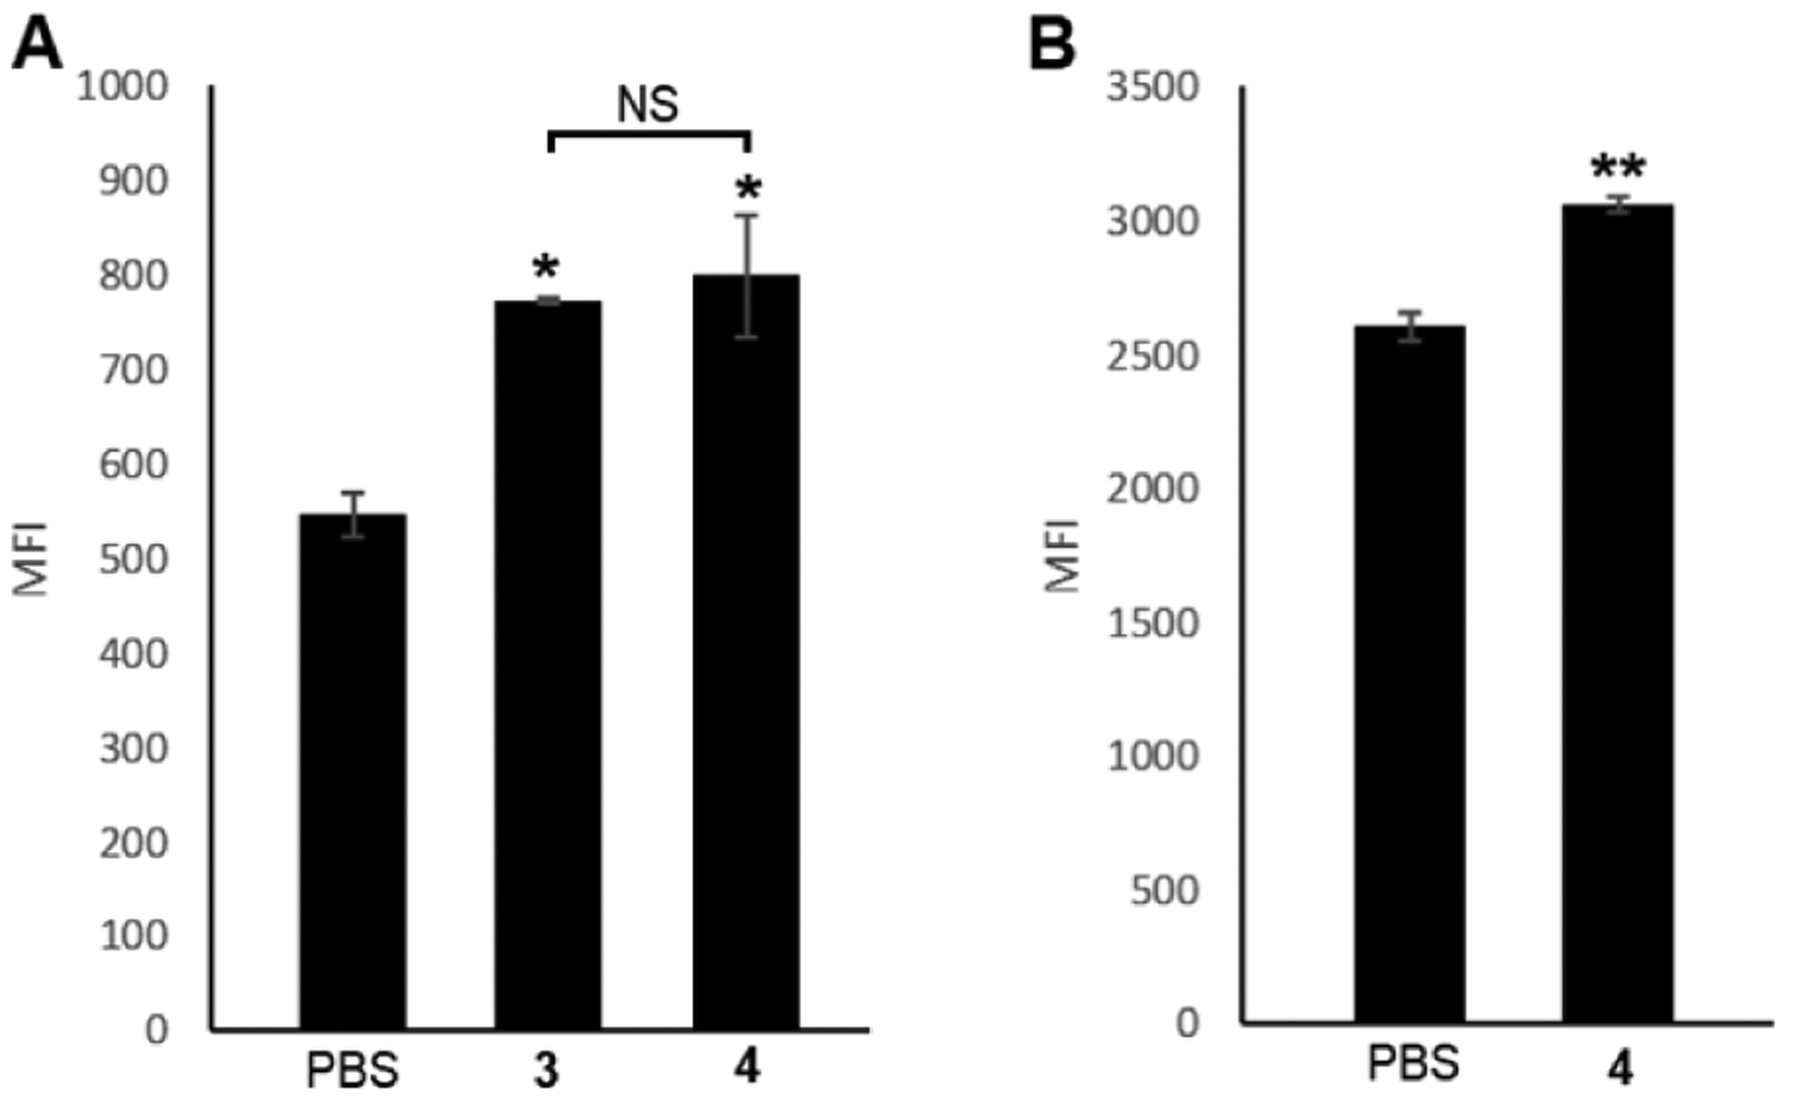
Flow cytometry results of (A) MCF-7 cancer cell and (B) IMR-90 normal cell after treatments with PBS (control) or compound 3 or 4 (200 μM, 48 h) and then with DBCO-Cy5 (1 h). Data are presented as mean ± standard deviation of two parallel experiments and analyzed by two-tailed student’s t test: *statistically different (P ≤ 0.05) from the PBS group; **statistically very different (P ≤ 0.01) from the PBS group; NS, no significant difference (P > 0.05).
Next, we tested the metabolic engineering of GPIs on normal cells using the modified inositol derivative. Because 3 and 4 exhibited similar activity, we chose to test 4 only, and IMR-90 cell, a human fibroblast cell line, was selected as the noncancerous cell model.31 The results in Figure 3B demonstrated that IMR-90 cell could also utilize 4 efficiently to express modified GPI anchors. Therefore, it was confirmed that azido inositol derivatives 3 and 4 could be utilized by both cancer and normal cells to label GPI anchors on the cell surface.
Subsequently, we examined the activities of our Ac2Lys-azido inositol conjugates, 1 and 2, to engineer cell expression of modified GPI anchors so as to find out whether they would have some selectivity for cancer cell over normal cell. Since enzymatic conversion of 1 and 2 into functional GPI labeling probes 5 and 6 in cells depends on the expression levels of both HDAC and CTSL, we chose to carry out this assessment using several cancerous and noncancerous cell lines. The two noncancerous cell lines were IMR-90 and HEK293. IMR-90 cell was reported to have low expression levels of both HDAC and CTSL;31 HEK293 cell has been used as a control cell line with low or non-tumorigenic properties in numerous studies, although there has been no report with regard to the expression levels of HDAC and CTSL in HEK293 cell. After IMR-90 cell was incubated with 1 or 2 for 48 h, the azide-modified GPIs expressed on cells were labeled with a fluorophore through reaction with DBCO-Cy5, as described above, which was followed by flow cytometry analysis. As expected, no significant change in fluorescence intensity between these and the control groups was observed (Figures 4A and 4B). Similar results were obtained with HEK293 cell for both 1 and 2 (supplementary Figure S1). This study confirmed that the labeling of GPIs on normal cells with 1 or 2 was restricted, probably because their 1-O-position was blocked by Ac2Lys that could not be removed in cells lacking HDAC and CTSL29 to prohibit their incorporation in the GPI biosynthetic pathway.
Figure 4:
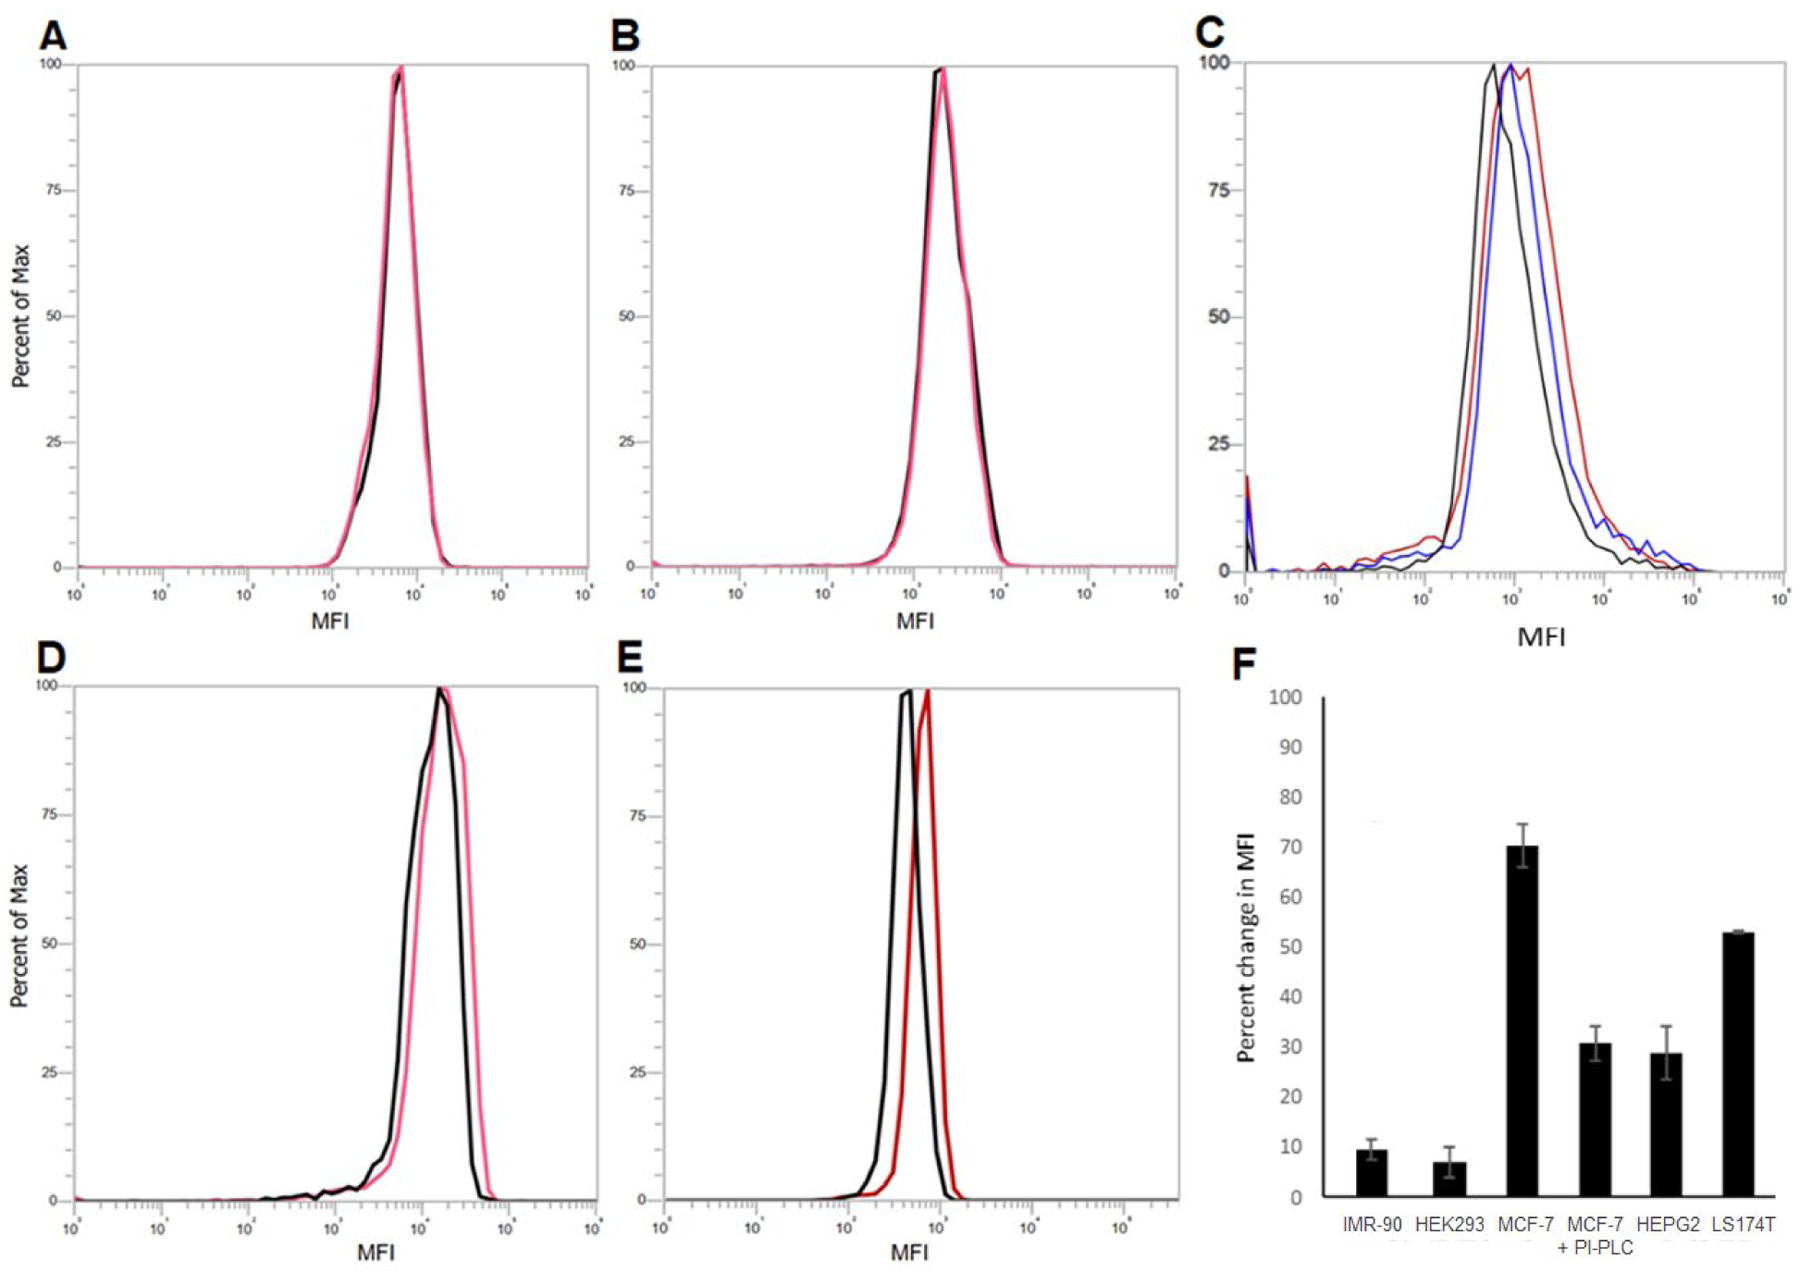
Flow cytometry results of various cells treated with 200 μM of 1 or 2 or with 200 μM of 1 plus PI-PLC against cells treated with PBS (the control groups, black) for 48 h, followed by click reaction with DBCO-Cy5 (50 μM, 37 °C, 1 h). (A) IMR-90 cell treated with 1 (red); (B) IMR-90 cell treated with 2 (red); (C) MCF-7 cell treated with 1 (red) or with 1 plus PI-PLC (blue); (D) HepG2 cell treated with 1 (red); (E) LS174T cell treated with 1 (red); (F) the percentage changes in MFI for various cell groups. More than 10,000 events were recorded for each experiment. The data are represented as mean ± standard deviation of three replicate experiments.
The human breast cancer cell line MCF-7, human hepatocyte carcinoma cell line HepG2, and human colon adenocarcinoma cell line LS174T were chosen to evaluate the activity of 1 and 2 to metabolically engineer GPIs on cancer cell. It has been shown that cancer cells express high levels of HDAC and CTSL;31 moreover, increased levels of GPI-APs are associated with tumorigenicity of human breast carcinoma20, 21 and colon adenocarcinoma.29, 38 It was shown that under the above-described conditions, treating MCF-7 cell with 1 and 2 resulted in a significant increase in MFI as compared to the control and that 1 and 2 had similar activity (Figure 4C, red and supplementary Figure S2). Furthermore, 1 and 2 caused a similar MFI increase as azido inositol derivatives 3 and 4 having a free 1-O-position. We have also disclosed that the MFI increase was dependent on the concentration of 1 and higher concentration induced slightly greater MFI increase (supplementary Figure S3). However, 1 caused significant cytotoxicity at concentrations higher than 400 μM.
To verify that the-above observed cell labeling was indeed due to metablic engineering of cells to express azide-modified GPIs and GPI-APs, we then incubated the 1-treated MCF-7 cells with phosphatidylinositol-specific phospholipase C (PI-PLC), an enzyme that can specifically catalyze GPI hydrolysis39, 40 and was utilized to detach GPIs from the cell surface to verify their existence,41 followed by reaction with DBCO-Cy5 as described above. Flow cytometry results (Figures 4C and 4F) revealed that the MFI of cells treated with 1 and PI-PLC (Figure 4C, blue) was significantly lower than that of cells without PI-PLC treatment (Figure 4C, red). This study provided the direct proof confirming that GPIs/GPI-APs on cells were indeed modified to carry the azido groups upon treatment with 1. However, similar to metabolic glycan engineering,42 it is likely that other inositol-containing molecules on the cell surface were also modified upon treatment with 1. Nevertheless, this would not affect the application of this method to GPI/GPI-AP study as there is no report yet that other inositol-containing molecules are attached to proteins and, moreover, some of them such as many inositol phospholipids43, 44 have phosphorylations at their inositol 3-O- and 4-O-positions, which are not available in 1 and 2 to prohibit the incorporation of 1 and 2 into these molecules.
Similar to MCF-7 cell, after treatment with 1 and 2, HepG2 cell showed a significant increase in MFI compared to the control groups and the increase was comparable to that induced by inositol derivative 4 having a free 1-O-position (Figure 4D and supplementary Figure S4). As 1 and 2 had similar activity for both MCF-7 and HepG2 cells, we tested 1 only for the metabolic engineering of LS174T cell, for which a significant increase in MFI was also observed (Figure 4E).
Fluorescence microscopy analysis was performed to further verify the flow cytometry results. As depicted in Figure 5A, after treatments with azido intisitol-Ac2Lys conjugate 1 (200 μM) and DBCO-Cy5, MCF-7 cell exhibited intensive red fluorescence. In contrast, 1-treated normal IMR-90 cell was not stained by DBCO-Cy5 (Figure 5B).
Figure 5:
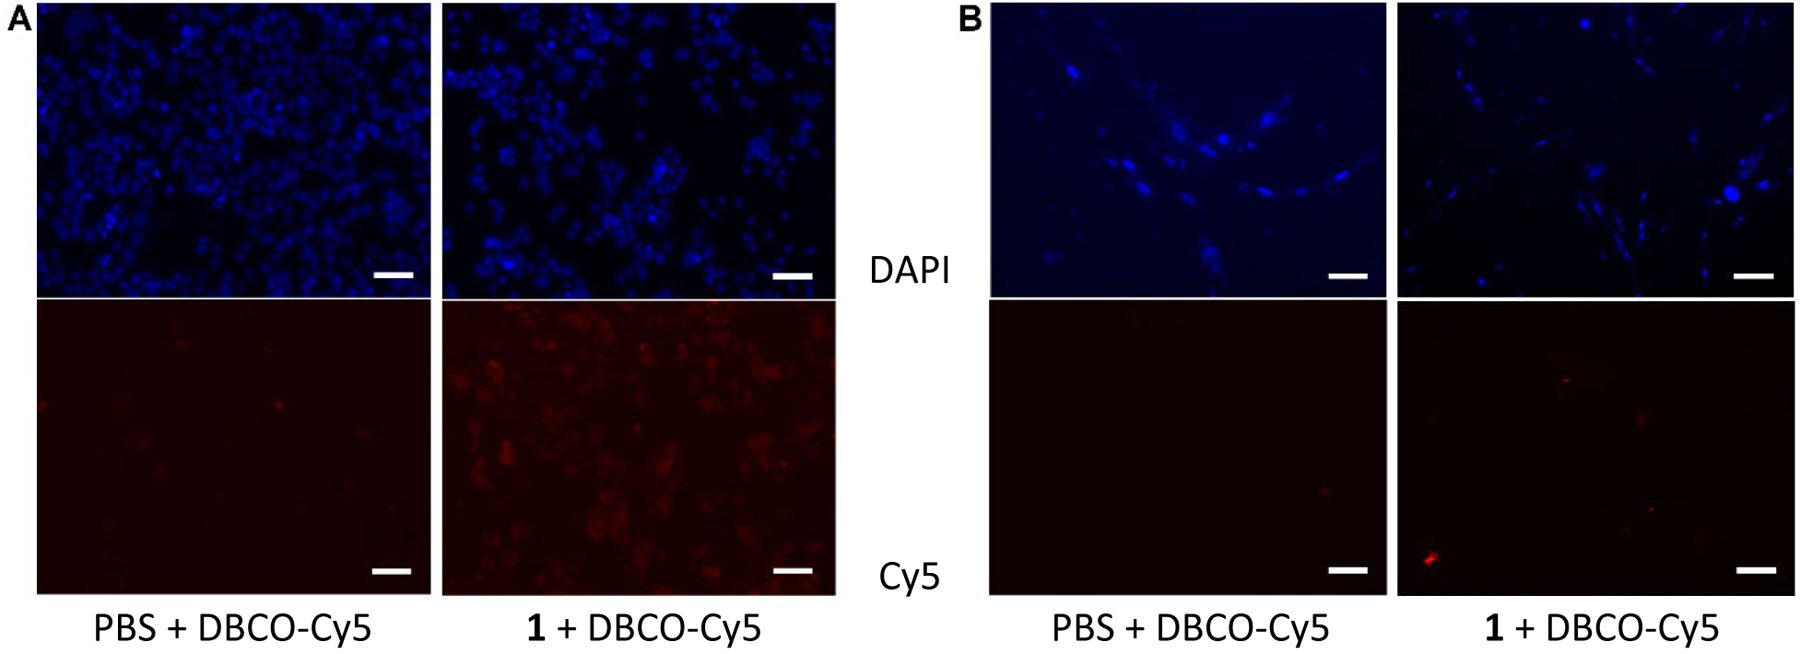
Fluorescence microscopy images of MCF-7 cell (A) and IMR-90 cell (B) treated with PBS + DAPI + DBCO-Cy5 (left) and 200 μM of 1 + DAPI + DBCO-Cy5 (right) observed under different wavelengths to detect DAPI (top) or Cy5 (bottom). Scale bars for the images: 50 μm.
Conclusion
We have developed an efficient method for the synthesis of myo-inositol derivatives 1 and 2, which were designed to have a metabolically stable 2-azidoethyl group linked to the inositol 3-O- and 4-O-positions, respectively, and an Ac2Lys moiety masking the 1-O-position. The remaining hydroxyl groups of the inositol residue were protected with acetyl groups to reduce the polarity of resultant compounds and thereby increase their cell permeability. It was anticipated that the acetyl groups would be readily removable by lipidases/esterases abundantly expressed in all types of cells but the Ac2Lys moiety could be removed only under the combined actions of HDAC and CTSL that are overexpressed in cancer cell.29, 31–33 As a result, it would be cancer cell, instead of normal cell, that would convert 1 and 2 into unprotected inositol derivatives 5 and 6 to reveal the 1-O-position. Since the inositol 1-O-position is not only involved in but absolutely necessary for GPI and GPI-AP biosynthesis, 1 and 2 should be selective for metabolic engineering of GPIs and GPI-APs on cancer cell. In addition, it has been proved that cancer cells have higher permeability than normal cells, which can help further enhance the efficacy and selectivity of 1 and 2 for cancer cell metabolic engineering. Biological assays using a number of cancerous and noncancerous cell lines verified that both 1 and 2 could be accepted by cancer cells, but not by normal cells, to incorporate azide-labeled inositol into GPIs/GPI-APs. In addition, it was found that 1 and 2 had comparable activity as 3 and 4 with a free 1-O-position for metabolic engineering of cancer cell. The MFI shift observed in the FACS analysis of cells having GPIs/GPI-APs metabolically engineered using 1 and 2 and subsequently labeled with a fluorophore was significant, but it was relatively small compared to the MFI shift observed with cell surface glycan metabolic engineering. A plausible explanation for this difference was because of the much lower expression levels of GPIs/GPI-APs than that of glycans on the cell. Similarly, the difference in MFI shift observed for different cancer cells might indicate their different expression levels of GPI-APs, in addition to the potential difference in their efficiency to uptake and incorporate the inositol derivatives. It was difficult to imagine that it was only determined by the latter. In conclusion, we have developed the first molecular tools that can be used to selectively engineer various cancer cells to express labeled GPIs/GPI-APs. This can be exploited in cancer diagnosis and targeted therapy, which is currently pursued in our laboratory.
Experimental Section
General chemical procedures.
Reagents and chemicals were purchased from commercial sources and were used as received without further purification unless otherwise noted. Molecular sieve 4Å (MS 4Å) was flame-dried under vacuum and cooled to room temperature (rt) under a N2 atmosphere immediately before use. TLC was carried out on Silica Gel 60Å F254 plates and detections were achieved with a UV detector and/or by charring with 10% H2SO4 in EtOH (v/v). Mass spectrometry (MS) was recorded on a high resolution ESI-TOF or a normal resolution MALD-TOF machine. NMR spectra were recorded on a 500 or 600 MHz machine with chemical shifts reported in ppm (δ) downfield from internal tetramethylsilane (TMS) and DHO references. Signals are described as s (singlet), d (doublet), t (triplet) or m (multiplet), and coupling constants are reported in Hz.
3,5,6-tri-O-Allyl-4-O-azidoethyl-1,2-O-cyclohexylidene-D-myo-inositol (9):
A solution of 3-O-allyl-4-O-azidoethyl-1,2:5,6-di-O-cyclohexylidene-D-myo-inositol (7, 740 mg, 1.65 mmol) and acetyl chloride (56 μL) in CH3OH-CH2Cl2 (v/v, 1/3, 80 mL) was stirred at rt for 10 min. After the reaction was quenched with triethylamine, the solution was concentrated under reduced pressure. The obtained intermediate was dissolved in 20 mL of anhydrous DMF, and then NaH (264 mg, 6.6 mmol) and AllBr (570 μL, 6.6 mmol) were added at 0 °C under a N2 atmosphere. Five hours later, the reaction was quenched with saturated aq. NaCl solution and diluted with ethyl acetate (EtOAc). The organic layer was washed with water and brine, dried with Na2SO4 and then concentrated in vacuo. The residue was purified by silica gel column chromatography (EtOAc-hexane 1:5) to give 9 (555 mg, 75% for 2 steps) as colorless syrup. Rf = 0.60 (EtOAc-hexane 1:3). 1H NMR (500 MHz, CDCl3) δ: 6.02–5.92 (m, 3 H, All), 5.35–5.28 (m, 3 H, All), 5.22–5.16 (m, 3 H, All), 4.38–4.20 (m, 7 H), 4.03 (t, J = 9.0 Hz, 1 H), 3.98–3.90 (m, 2 H, -OCH2CH2), 3.64 (t, J = 9.0 Hz, 1 H), 3.57–3.52 (m, 2 H), 3.42–3.40 (m, 2 H, -CH2CH2N3), 3.19 (t, J = 9.0 Hz, 1 H), 1.79–1.54 (m, 8 H), 1.47–1.44 (m, 1 H), 1.38–1.32 (m, 1 H). 13C NMR (125 MHz, CDCl3) δ: 135.29, 135.22, 134.96, 117.56, 116.72, 110.41, 82.30, 81.57, 81.21, 78.55, 74.18, 73.83, 72.96, 72.17, 71.63, 51.37, 37.46, 35.24, 25.02, 23.89, 23.54. HR ESI-TOF MS (m/z): calcd for C23H36N3O6 [M + H]+ 450.2604, found 450.2612.
3,5,6-tri-O-Allyl-4-O-azidoethyl-D-myo-inositol (10):
To a solution of 9 (500 mg, 1.11 mmol) in CH3OH-CH2Cl2 (v/v, 1/2, 18 mL) was slowly added AcCl (180 μL). After the reaction was stirred at rt for 5 h, it was quenched with Et3N and concentrated. The residue was subjected to flush silica gel column chromatography (EtOAc-hexane 1:1) to provide 10 (390 mg, 95%) as colorless syrup. Rf = 0.55 (EtOAc-hexane 12:1). 1H NMR (500 MHz, CDCl3) δ: 6.01–5.92 (m, 3 H, All), 5.32–5.19 (m, 6 H, All), 4.43–4.39 (m, 1 H), 4.36–4.15 (m, 6 H), 3.98–3.89 (m, 2 H), 3.64 (t, J = 9.5 Hz, 2 H), 3.43–3.38 (m, 3 H), 3.28–3.19 (m, 2 H), 2.66 (s, 1 H, -OH), 2.63 (s, 1 H, -OH). 13C NMR (125 MHz, CDCl3) δ: 135.07, 134.97, 134.49, 117.67, 117.19, 116.68, 82.57, 81.94, 80.63, 79.28, 74.32, 74.26, 71.99, 71.64, 71.45, 69.06, 51.45. HR ESI-TOF MS (m/z): calcd for C17H27N3O6Na [M + Na]+ 392.1798, found 392.1802.
2-O-Acetyl-3,5,6-tri-O-allyl-4-O-azidoethyl-D-myo-inositol (11):
To a solution of 10 (355 mg, 0.96 mmol) in CH3CN (13 mL) was added trimethyl orthoacetate (1.23 mL, 9.6 mmol) and p-TSA (18 mg, 0.096 mmol). After the reaction was stirred at rt for 8 h, it was quenched with Et3N and concentrated. The residue was dissolved in CH3CN-H2O (v/v, 16/1, 8.5 mL) and mixed with TFA (60 μL) at 0 °C. The solution was stirred for 10 min, diluted with toluene, and concentrated. The residue was subjected to silica gel column chromatography (EtOAc-hexane 1:1) to afford 11 (387 mg, 98% for 2 steps) as colorless syrup. Rf = 0.50 (EtOAc-hexane 1:1). 1H NMR (500 MHz, CDCl3) δ: 6.02–5.85 (m, 3 H, All), 5.59 (t, J = 2.0 Hz, 1 H, H-2), 5.34–5.26 (m, 3 H, All), 5.20–5.17 (m, 3 H, All), 4.42–4.35 (m, 2 H), 4.31 (dd, J = 12.0, 6.0 Hz, 1 H), 4.25 (dd, J = 12.0, 6.0 Hz, 1 H), 4.17 (dd, J = 12.0, 6.0 Hz, 1 H), 4.02–3.96 (m, 2 H), 3.91–3.86 (m, 1 H), 3.53–3.49 (m, 3 H), 3.40 (t, J = 5.0 Hz, 1 H), 3.34 (dd, J = 10.0, 2.5 Hz, 1 H), 3.27–3.23 (m, 1 H), 2.44 (s, 1 H, -OH), 2.13 (s, 3 H, -Ac). 13C NMR (125 MHz, CDCl3) δ: 170.39, 134.93, 134.83, 134.33, 117.55, 117.22, 117.01, 82.61, 82.31, 80.94, 77.59, 74.54, 74.26, 72.06, 71.01, 69.91, 69.26, 51.41, 20.99. HR ESI-TOF MS (m/z): calcd for C19H29N3O7Na [M + Na]+ 434.1903, found 434.1917.
2-O-Acetyl-3,5,6-tri-O-allyl-4-O-azidoethyl-1-O-levulinoyl-D-myo-inositol (12):
To a solution of 11 (258 mg, 0.63 mmol) in CH2Cl2 (6 mL) were added LevOH (218.5 mg, 1.88 mmol), EDC (361.6 mg, 1.88 mmol) and DMAP (15.3 mg, 0.12 mmol). After the reaction mixture was stirred at rt for 3 h, it was concentrated and the residue was subjected to silica gel column chromatography (EtOAc-hexane 1:2) to afford 12 (316 mg, 99%) as colorless syrup. Rf = 0.55 (EtOAc-hexane 1:1). 1H NMR (500 MHz, CDCl3) δ: 6.02–5.84 (m, 3 H, All), 5.55 (t, J = 2.5 Hz, 1 H, H-2), 5.33–5.15 (m, 6 H, All), 4.77 (dd, J = 9.0, 2.5 Hz, 1 H, H-1), 4.34 (d, J = 6.0 Hz, 2 H), 4.27 (dd, J = 12.5, 5.5 Hz, 1 H), 4.21 (dd, J = 12.5, 5.5 Hz, 1 H), 4.12 (dd, J = 12.5, 5.5 Hz, 1 H), 4.01–3.88 (m, 3 H), 3.69 (t, J = 10.0 Hz, 1 H), 3.55 (t, J = 9.5 Hz, 1 H), 3.40–3.36 (m, 3 H), 3.30 (t, J = 9.5 Hz, 1 H), 2.82–2.49 (m, 4 H), 2.19 (s, 3 H), 2.12 (s, 3 H, -Ac). 13C NMR (125 MHz, CDCl3) δ: 206.64, 171.92, 169.96, 134.92, 134.89, 134.11, 117.63, 117.10, 116.73, 82.22, 81.70, 78.76, 74.83, 74.33, 72.08, 71.58, 71.14, 67.82, 51.37, 37.85, 29.79, 27.88, 20.86. HR ESI-TOF MS (m/z): calcd for C24H35N3O9Na [M + Na]+ 532.2271, found 532.2269.
2,3,5,6-tetra-O-Acetyl-4-O-azidoethyl-1-O-levulinoyl-D-myo-inositol (13):
After a solution of [Cp-Ru(CH3CN)3]PF6 (42.63 mg, 0.1 mmol) and quinaldic acid (17 mg, 0.1 mmol) in 5 mL of CH3OH was stirred at rt for 30 min, a solution of 12 (250 mg, 0.49 mmol) in 5 mL of CH2Cl2 was added slowly. The reaction was kept at rt for 3 h, until TLC indicated its completion. The solution was concentrated under reduced pressure and the residue was purified by flush silica gel column chromatography (CH3OH-CH2Cl2 1:15) to give a product as syrup. It was re-dissolved in pyridine (6 mL), followed by addition of acetic anhydride (462 μL, 4.9 mmol). After the solution was stirred at rt for 8 h, it was concentrated and the residue was subjected to silica gel column chromatography (EtOAc-hexane 1:1) to give 13 (215 mg, 85% for 2 steps) as colorless syrup. Rf = 0.55 (EtOAc-hexane 2:1). 1H NMR (500 MHz, CDCl3) δ: 5.56 (t, J = 2.5 Hz, 1 H, H-2), 5.44 (t, J = 10.0 Hz, 1 H, H-6), 5.18 (t, J = 10.0 Hz, 1 H, H-5), 5.11 (dd, J = 10.5, 2.5 Hz, 1 H, H-1), 5.03 (dd, J = 10.0, 2.5 Hz, 1 H, H-3), 3.89 (t, J = 10.0 Hz, 1 H, H-4), 3.79–3.70 (m, 2 H, -OCH2CH2), 3.34–3.30 (m, 2 H, -CH2CH2-N3), 2.81–2.38 (m, 4 H, -Lev), 2.19 (s, 3 H), 2.16 (s, 3 H), 2.10 (s, 3 H), 2.07 (s, 6 H). 13C NMR (125 MHz, CDCl3) δ: 205.91, 171.11, 170.33, 169.68, 169.45, 169.35, 77.38, 72.15, 71.41, 70.23, 69.61, 68.51, 68.43, 50.98, 37.56, 29.65, 27.56, 20.76, 20.68, 20.64, 20.62. HR ESI-TOF MS (m/z): calcd for C21H29N3O12Na [M + Na]+ 538.1649, found 538.1658.
2,3,5,6-tetra-O-Acetyl-4-O-azidoethyl-D-myo-inositol (4):
To a solution of 13 (338 mg, 0.66 mmol) in CH3OH/CH2Cl2 (v/v, 1/10, 6.6 mL) was added hydrazine acetate (121 mg, 1.31 mmol). After the solution was stirred at rt for 2 h, it was diluted with CH2Cl2 and washed with aqueous NaHCO3 and brine, dried over anhydrous Na2SO4, and concentrated. The residue was subjected to flush silica gel column chromatography (EtOAc-hexane 1:1) to give 4 (36.8 mg, 82%) as a white foamy solid. Rf = 0.35 (EtOAc-hexane 1:1). 1H NMR (500 MHz, CDCl3) δ: 5.06 (t, J = 2.5 Hz, 1 H, H-2), 5.26 (t, J = 10.0 Hz, 1 H), 5.15 (t, J = 10.0 Hz, 1 H), 4.93 (dd, J = 10.5, 3.0 Hz, 1 H, H-3), 3.91–3.87 (m, 1 H), 3.86–3.78 (m, 2 H, -OCH2CH2), 3.76–3.70 (m, 1 H), 3.37–3.27 (m, 2 H, -CH2CH2-N3), 2.33 (d, J = 7.0 Hz, 1 H, -OH), 2.21 (s, 3 H, -Ac), 2.12 (s, 3 H, -Ac), 2.11 (s, 3 H, -Ac), 2.08 (s, 3 H, -Ac). 13C NMR (125 MHz, CDCl3) δ: 171.23, 170.16, 169.80, 169.64, 77.46, 72.81, 71.98, 71.51, 70.99, 70.75, 68.68, 50.99, 20.85, 20.82, 20.74, 20.72. HR ESI-TOF MS (m/z): calcd for C16H23N3O10Na [M + Na]+ 440.1281, found 440.1294.
2-O-Acetyl-4,5,6-tri-O-allyl-3-O-azidoethyl-D-myo-inositol (16):
Compound 16 (550 mg, 95% for 2 steps) was prepared from 14 (520 mg, 1.41 mmol) by the same procedure described for the synthesis of 11. Rf = 0.45 (EtOAc-hexane 1:1). 1H NMR (600 MHz, CDCl3) δ: 6.01–5.94 (m, 3 H, All), 5.60 (t, J = 2.4 Hz, 1 H, H-2), 5.34–5.25 (m, 3 H, All), 5.22–5.15 (m, 3 H, All), 4.45 (dd, J = 12.0, 5.4 Hz, 1 H), 4.37–4.32 (m, 2 H), 4.31–4.20 (m, 3 H), 3.85–3.80 (m, 1 H), 3.66–3.61 (m, 1 H), 3.60 (t, J = 9.6 Hz, 1 H), 3.55 (d, J = 6.0 Hz, 2 H), 3.40–3.25 (m, 4 H), 2.42 (s, 1 H, -OH), 2.15 (s, 3 H, -Ac). 13C NMR (150 MHz, CDCl3) δ: 170.52, 135.19, 134.98, 134.86, 117.24, 116.95, 116.69, 82.76, 81.25, 80.94, 79.43, 74.62, 74.50, 74.29, 69.88, 69.28, 69.22, 51.17, 20.91. HR ESI-TOF MS (m/z): calcd for C19H29N3O7Na [M + Na]+ 434.1903, found 434.1915.
2-O-Acetyl-4,5,6-tri-O-allyl-3-O-azidoethyl-1-O-levulinoyl-D-myo-inositol (17):
Compound 17 (400 mg, 97%) was prepared from 16 (333 mg, 0.81 mmol) by the same procedure described for the synthesis of 12. Rf = 0.60 (EtOAc-hexane 1:1). 1H NMR (600 MHz, CDCl3) δ: 6.00–5.94 (m, 3 H, All), 5.55 (t, J = 2.4 Hz, 1 H, H-2), 5.31–5.24 (m, 3 H, All), 5.19–5.15 (m, 3 H, All), 4.77 (dd, J = 10.2, 2.4 Hz, 1 H, H-1), 4.33–4.25 (m, 5 H), 4.21 (dd, J = 12.6, 5.4 Hz, 1 H), 3.77–3.74 (m, 1 H), 3.69–3.65 (m, 2 H), 3.62 (t, J = 9.6 Hz, 1 H), 3.37–3.24 (m, 4 H), 2.82–2.48 (m, 4 H, -Lev), 2.19 (s, 3 H), 2.13 (s, 3 H, -Ac). 13C NMR (150 MHz, CDCl3) δ: 206.05, 171.96, 170.08, 135.16, 134.99, 134.95, 117.01, 116.70, 116.69, 82.39, 80.69, 78.76, 78.70, 74.79, 74.62, 74.37, 71.55, 69.46, 67.91, 51.06, 37.85, 29.74, 27.91, 20.76. HR ESI-TOF MS (m/z): calcd for C24H35N3O9Na [M + Na]+ 532.2271, found 532.2287.
2,4,5,6-tetra-O-Acetyl-3-O-azidoethyl-1-O-levulinoyl-D-myo-inositol (18):
Compound 18 (284 mg, 81% for 2 steps) was prepared from 17 (350 mg, 0.68 mmol) by the same procedure described for the synthesis of 13. Rf = 0.55 (EtOAc-hexane 2:1). 1H NMR (600 MHz, CDCl3) δ: 5.68 (t, J = 3.0 Hz, 1 H, H-2), 5.51 (t, J = 10.2 Hz, 1 H, H-6), 5.42 (t, J = 10.2 Hz, 1 H, H-4), 5.15 (t, J = 10.2 Hz, 1 H, H-5), 4.99 (dd, J = 10.2, 3.0 Hz, 1 H, H-1), 3.81–3.78 (m, 1 H), 3.61 (dd, J = 10.2, 3.0 Hz, 1 H, H-3), 3.55–3.52 (m, 1 H), 3.31–3.27 (m, 2 H, -CH2CH2-), 2.81–2.42 (m, 4 H, -Lev), 2.21 (s, 3 H), 2.17 (s, 3 H), 2.06 (s, 6 H), 2.02 (s, 3 H). 13C NMR (150 MHz, CDCl3) δ: 205.83, 171.57, 170.08, 169.87, 169.82, 169.68, 76.19, 71.07, 70.83, 69.49, 69.24, 69.18, 66.76, 50.71, 37.56, 29.58, 27.70, 20.77, 20.67, 20.56, 20.47. HR ESI-TOF MS (m/z): calcd for C21H29N3O12Na [M + Na]+ 538.1649, found 538.1658.
2,4,5,6-tetra-O-Acetyl-3-O-azidoethyl-D-myo-inositol (3):
Compound 3 (197 mg, 93%) was prepared from 18 (260 mg, 0.51 mmol) by the same procedure described for the synthesis of 4. Rf = 0.45 (EtOAc-hexane 2:1). 1H NMR (600 MHz, CDCl3) δ: 5.66 (t, J = 3.0 Hz, 1 H, H-2), 5.36 (t, J = 10.2 Hz, 1 H, H-5), 5.30 (t, J = 10.2 Hz, 1 H, H-6), 5.12 (t, J = 10.2 Hz, 1 H, H-4), 3.88–3.85 (m, 1 H), 3.80 (dd, J = 10.2, 2.4 Hz, 1 H, H-1), 3.55–3.50 (m, 2 H), 3.34–3.30 (m, 2 H, -CH2CH2-), 2.77 (s, 1 H, -OH), 2.21 (s, 3 H), 2.07 (s, 3 H), 2.05 (s, 6 H), 2.02 (s, 3 H). 13C NMR (150 MHz, CDCl3) δ: 171.07, 170.54, 170.03, 169.79, 76.60, 72.69, 70.98, 70.81, 69.48, 69.35, 69.13, 50.79, 20.89, 20.74, 20.67, 20.51. HR ESI-TOF MS (m/z): calcd for C16H29N3O10Na [M + Na]+ 440.1281, found 440.1291.
para-Hydroxymethylphenylamine Nα,Nε-diacetyl-L-lysine amide (22):
To a solution of Nα,Nε-diacetyl-L-lysine (21, 1.0 g, 4.35 mmol) in DMF (40 mL) were added HATU (2.48 g, 6.52 mmol) and DIPEA (1.51 mL, 8.7 mmol). After the solution was stirred at rt for 1 h, PABA (535 mg, 4.35 mmol) was added and the reaction mixture was stirred at rt for another day before concentrated. The residue was subjected to silica gel column chromatography (CH3OH-CH2Cl2 1:10) to give 32 (1.19 g, 82%) as a yellow solid. Rf = 0.45 (CH3OH-CH2Cl2 1:5). 1H NMR (500 MHz, CD3OD) δ: 7.56 (d, J = 8.5 Hz, 2 H), 7.32 (d, J = 8.5 Hz, 2 H), 4.57 (s, 2 H), 4.46 (dd, J = 8.5, 5.5 Hz, 1 H), 3.21–3.15 (m, 2 H), 2.03 (s, 3 H), 1.92 (s, 3 H), 1.89–1.82 (m, 1 H), 1.78–1.71 (m, 1 H), 1.59–1.52 (m, 2 H), 1.50–1.41 (m, 2 H). 13C NMR (125 MHz, CD3OD) δ: 176.02, 175.93, 175.36, 141.32, 141.18, 131.14, 123.91, 67.38, 58.18, 42.84, 42.71, 35.49, 35.45, 32.61, 26.83, 25.21, 25.04. HR ESI-TOF MS (m/z): calcd for C17H25N3O4Na [M + Na]+ 358.1743, found 358.1745.
2,4,5,6-tetra-O-Acetyl-3-O-azidoethyl-1-(para-nitrophenyloxycarbonyl)-D-myo-inositol (19):
To a solution of 3 (280 mg, 0.67 mmol) in pyridine (8 mL) was added p-nitrophenyl chloroformate (403 mg, 2.01 mmol). After the solution was stirred at rt for 8 h, it was filtered and concentrated. The residue was subjected to silica gel column chromatography (EtOAc-hexane 1:3) to give 19 (293 mg, 75%) as a white solid. Rf = 0.35 (EtOAc-hexane 1:2). 1H NMR (600 MHz, CDCl3) δ: 8.30 (d, J = 8.8 Hz, 2 H), 7.41 (d, J = 8.8 Hz, 2 H), 5.94 (s, 1 H, H-2), 5.59 (t, J = 10.1 Hz, 1 H, H-6), 5.49 (t, J = 10.0 Hz, 1 H, H-4), 5.18 (t, J = 9.8 Hz, 1 H, H-5), 4.86 (dd, J = 10.5, 2.3 Hz, 1 H, H-1), 3.85–3.79 (m, 1 H, -OCH2CH2-), 3.67 (dd, J = 10.1, 2.3 Hz, 1 H, H-3), 3.61 (ddd, J = 10.1, 6.4, 3.7 Hz, 1 H, -OCH2CH2-), 3.38–3.28 (m, 2 H, -OCH2CH2-), 2.26 (s, 3 H, -Ac), 2.09 (s, 6 H, -Ac), 2.05 (s, 3 H, -Ac). 13C NMR (150 MHz, CDCl3) δ: 170.45, 169.91, 169.60, 169.40, 155.14, 151.71, 145.78, 125.38, 121.85, 75.85, 74.34, 70.90, 70.65, 69.78, 69.07, 66.17, 50.74, 20.77, 20.67, 20.61, 20.45. HR ESI-TOF MS (m/z): calcd for C23H26N4O14Na [M + Na]+ 605.1343, found 605.1355.
2,3,5,6-tetra-O-Acetyl-4-O-azidoethyl-1-(para-nitrophenyloxycarbonyl)-D-myo-inositol (20):
Compound 20 (163 mg, 78%) was prepared from 4 (150 mg, 0.36 mmol) by the same procedure described for the synthesis of 19. Rf = 0.45 (EtOAc-hexane 2:1). 1H NMR (600 MHz, CDCl3) δ: 8.28 (d, J = 9.3 Hz, 2 H), 7.38 (d, J = 9.3 Hz, 2 H), 5.80 (t, J = 2.9 Hz, 1 H), 5.49 (t, J = 10.2 Hz, 1 H), 5.19 (t, J = 9.8 Hz, 1 H), 5.07 (dd, J = 10.3, 2.9 Hz, 1 H), 4.98 (dd, J = 10.5, 2.9 Hz, 1 H), 3.92 (t, J = 10.0 Hz, 1 H), 3.78 (dddd, J = 32.8, 10.1, 6.2, 3.8 Hz, 2 H), 3.41–3.26 (m, 2 H), 2.23 (s, 3 H), 2.12 (s, 3 H), 2.10 (s, 3 H), 2.08 (s, 3 H). 13C NMR (150 MHz, CDCl3) δ: 169.90, 169.48, 169.37, 155.16, 151.36, 145.69, 125.34, 121.77, 73.76, 72.04, 71.64, 69.83, 69.52, 67.82, 50.99, 20.71, 20.62, 20.60. HR ESI-TOF MS (m/z): calcd for C23H26N4O14Na [M + Na]+ 605.1343, found 605.1351.
2,4,5,6-tetra-O-Acetyl-3-O-azidoethyl-1-[para-(Nα,Nε-diacetyl-L-lysinamido)benzyloxycarbonyl)-D-myo-inositol (1):
To a solution of 22 (311 mg, 0.93 mmol) and 19 (180 mg, 0.31 mmol) in dry pyridine (5 mL) was added DMAP (37.7 mg, 0.31 mmol). After the reaction mixture was stirred at 60 °C for 2 d, it was concentrated and the residue was subjected to flush silica gel column chromatography (CH3OH-CH2Cl2 1:15) to give 1 (192.5 mg, 80%) as a yellow solid. Rf = 0.50 (CH3OH-CH2Cl2 1:5). 1H NMR (600 MHz, CD3OD) δ: 7.60 (d, J = 8.3 Hz, 2 H), 7.34 (d, J = 8.3 Hz, 2 H), 5.84 (s, 1 H, H-2), 5.43 (t, J = 10.0 Hz, 1 H, H-6), 5.35 (t, J = 10.0 Hz, 1 H, H-4), 5.25 (t, J = 9.8 Hz, 1 H, H-5), 5.14 (q, J = 12.1 Hz, 2 H, PhCH2), 5.08 (dd, J = 10.4, 2.6 Hz, 1 H, H-1), 4.48–4.40 (m, 1 H, -AcHNCH2-), 3.92 (dd, J = 10.1, 2.5 Hz, 1 H, H-3), 3.84–3.77 (m, 1 H, -OCH2CH2-), 3.61 (ddd, J = 10.3, 6.6, 3.7 Hz, 1 H, -OCH2CH2-), 3.31 (dd, J = 12.1, 8.4 Hz, 2 H, -OCH2CH2-), 3.18 (t, J = 6.9 Hz, 2 H, -AcHNCH2-), 2.19 (s, 3 H, -Ac), 2.05 (s, 3 H, -Ac), 2.03 (s, 3 H, -Ac), 1.98 (s, 3 H, -Ac), 1.92 (s, 3 H, -Ac), 1.90 (s, 3 H, -Ac), 1.85 (dd, J = 15.1, 5.1 Hz, 1 H), 1.80–1.70 (m, 1 H), 1.61–1.53 (m, 2 H), 1.53–1.38 (m, 2 H). 13C NMR (150 MHz, CD3OD) δ: 172.00, 171.84, 171.49, 170.22, 170.19, 169.93, 169.86, 153.97, 138.58, 131.07, 128.74, 119.92, 75.38, 72.74, 70.97, 70.93, 69.69, 69.50, 69.25, 67.12, 54.12, 50.51, 38.74, 31.47, 28.65, 22.84, 21.15, 21.01, 19.36, 19.21, 19.05, 19.03. HR ESI-TOF MS (m/z): calcd for C34H46N6O15Na [M + Na]+ 801.2919, found 801.2944.
2,3,5,6-tetra-O-Acetyl-4-O-azidoethyl-1-[para-(Nα,Nε-diacetyl-L-lysinamido)benzyloxycarbonyl)-D-myo-inositol (2):
Compound 2 (129 mg, 82%) was prepared from 20 (118 mg, 0.20 mmol) and 3 equivalents of 22 by the same procedure described for the synthesis of 1. Rf = 0.55 (CH3OH-CH2Cl2 1:5). 1H NMR (600 MHz, CD3OD) δ: 7.59 (d, J = 8.5 Hz, 2 H), 7.33 (d, J = 8.6 Hz, 2 H), 5.73 (t, J = 2.9 Hz, 1 H, H-2), 5.40 (t, J = 10.1 Hz, 1 H, H-6), 5.29 (t, J = 9.7 Hz, 1 H, H-5), 5.18 (dd, J = 2.9, 1.3 Hz, 1 H, H-3), 5.17–5.08 (m, 3 H, H-1 and Ph-CH2-), 4.44 (dd, J = 8.6, 5.7 Hz, 1 H, -AcHNCH2-), 3.97–3.90 (m, 1 H, H-4), 3.87–3.74 (m, 2 H, -OCH2CH2-), 3.36–3.30 (m, 2H, -OCH2CH2-), 3.18 (t, J = 7.0 Hz, 2 H, -AcHNCH2-), 2.18 (s, 3 H, -Ac), 2.08 (s, 3 H, -Ac), 2.06 (s, 3 H, -Ac), 2.03 (s, 3 H, -Ac), 1.92 (s, 3 H, -Ac), 1.89 (s, 3 H, -Ac), 1.86 (ddd, J = 13.6, 7.9, 4.1 Hz, 1 H), 1.79–1.70 (m, 1 H), 1.60–1.53 (m, 2 H), 1.52–1.38 (m, 2 H). 13C NMR (150 MHz, CD3OD) δ: 171.99, 171.83, 171.47, 170.18, 170.09, 170.00, 169.97, 153.89, 138.57, 131.05, 128.81, 119.92, 77.30, 72.28, 71.97, 71.41, 70.46, 69.95, 69.54, 68.11, 54.12, 50.86, 38.75, 31.49, 28.65, 22.84, 21.17, 21.04, 19.36, 19.29, 19.10. HR ESI-TOF MS (m/z): calcd for C34H46N6O15Na [M + Na]+ 801.2919, found 801.2938.
Biological assays of the synthetic inositol derivatives:
LS174T, HepG2, and IMR-90 cells were cultured in Eagle’s minimum essential medium (EMEM) supplemented with 10% of fetal bovine serum (FBS) and 100 U/mL of penicillin-streptomycin; MCF-7 and HEK293 cells were cultured in Dulbecco’s modified eagle medium (DMEM) supplemented with 10% of FBS and 100 U/mL of penicillin-streptomycin. The culture conditions were 37 °C under an atmosphere of 5% CO2 and 95% air for 3–4 d. Then, a pallet of 1.25 × 10⁶ cells were transferred into 4 mL of 10% FBS/DMEM supplemented with or without the inositol derivative (50–200 μM) in a culture dish, and the dish was incubated at 37 °C for 48 h. Next, the cells were peeled using a 1 mM EDTA solution in PBS and harvested by centrifugation at 700 rpm for 8 min. The cells were resuspended in FACS buffer and treated with DBCO-Cy5 (50 μM) at 37 °C for 1 h. The reaction was quenched with 1 mL of ice-cooled FACS buffer and the cells were washed 3–6 times with PBS and then with FACS buffer. Finally, the cells were resuspended in 300 μL of FACS buffer and analyzed with an Attune™ NxT flow cytometer using a red excitation laser (638 nm wavelength).
For the experiment involving PI-PLC: After MCF-7 cells were cultured with 1 (200 μM) for 48 h, harvested, and then washed as described above, they were resuspended in 1 mL of PBS buffer supplemented with CaCl2 and MgCl2 (5 mM) and incubated with 0.8 U of PI-PLC (from Bacillus cereus, Invitrogen, USA) at 37 °C for 1 h with shaking at 150 rpm.45 Thereafter, the cells were harvested, washed and subjected to teaction with DBCO-Cy5 as described above.
For fluorescence microscopy study, to each well of a 24-well clear bottom plate containing 1 mL of 10% FBS/DMEM were added ca. 104 MCF-7 or IMR-90 cells, and the plate was cultured at 37 °C for 2 d with or without azido sugar 1. The cells adhered to the plate bottom were fixed with 4% paraformaldehyde for 15 min, washed 3 times with 2% BSA/PBS, and then subjected to reaction with DBCO-Cy5 (25 μM) at 37 °C for 1 h, as described above. The resultant cells were treated with DAPI (200 nM) for 5 min, and finally analyzed with a Zeiss LSM700 fluorescence microscopy. The wavelengths of lights used to excite DAPI and APC were 405 nm and 639 nm, respectively.
Supplementary Material
Acknoledgement:
This work was supported by an NIH/NIGMS grant (R35 GM131686). The MS instrument used for this work was funded by NIH (S10 OD021758).
References:
- 1.Ferguson MA, Homans SW, Dwek RA and Rademacher TW, Science, 1988, 239, 753–759. [DOI] [PubMed] [Google Scholar]
- 2.Elortza F, Nühse TS, Foster LJ, Stensballe A, Peck SC and Jensen ON, Mol. Cell Proteomics, 2003, 2, 1261–1270. [DOI] [PubMed] [Google Scholar]
- 3.Low MG and Saltiel AR, Science, 1988, 239, 268–275. [DOI] [PubMed] [Google Scholar]
- 4.Low MG, FASEB J, 1989, 3, 1600–1608. [DOI] [PubMed] [Google Scholar]
- 5.Nosjean O, Briolay A and Roux B, Biochim. Biophys. Acta, 1997, 1331, 153–186. [DOI] [PubMed] [Google Scholar]
- 6.Paulick MG and Bertozzi CR, Biochemistry, 2008, 47, 6991–7000. [DOI] [PMC free article] [PubMed] [Google Scholar]
- 7.Lewis RA, Austen KF and Soberman RJ, N. Engl. J. Med, 1990, 323, 645–655. [DOI] [PubMed] [Google Scholar]
- 8.van der Schoot CE, Huizinga TW, van ‘t Veer-Korthof ET, Wijmans R, Pinkster J and von dem Borne AE, Blood, 1990, 76, 1853–1859. [PubMed] [Google Scholar]
- 9.Volarević S, Burns CM, Sussman JJ and Ashwell JD, Proc. Natl. Acad. Sci. USA, 1990, 87, 7085–7089. [DOI] [PMC free article] [PubMed] [Google Scholar]
- 10.Loertscher R and Lavery P, Transpl. Immun, 2002, 9, 93–96. [DOI] [PubMed] [Google Scholar]
- 11.Kasahara K and Sanai Y, Glycoconj. J, 2000, 17, 153–162. [DOI] [PubMed] [Google Scholar]
- 12.Varma Y and Hendrickson T, Chembiochem, 2010, 11, 623–636. [DOI] [PubMed] [Google Scholar]
- 13.Ferguson MA and Williams AF, Annu. Rev. Biochem, 1988, 57, 285–320. [DOI] [PubMed] [Google Scholar]
- 14.Udenfriend S and Kodukula K, Annu. Rev. Biochem, 1995, 64, 563–591. [DOI] [PubMed] [Google Scholar]
- 15.Kinoshita T, Cell Cycle, 2014, 13, 1838–1839. [DOI] [PMC free article] [PubMed] [Google Scholar]
- 16.Kinoshita T and Fujita M, J. Lipid Res, 2016, 57, 6–24. [DOI] [PMC free article] [PubMed] [Google Scholar]
- 17.Fujita M and Kinoshita T, FEBS Lett, 2010, 584, 1670–1677. [DOI] [PubMed] [Google Scholar]
- 18.Brown D and Waneck GL, J. Am. Soc. Nephrol, 1992, 3, 895–906. [DOI] [PubMed] [Google Scholar]
- 19.Yeh ET, Kamitani T and Chang HM, Semin. Immunol, 1994, 6, 73–80. [DOI] [PubMed] [Google Scholar]
- 20.Dolezal S, Hester S, Kirby PS, Nairn A, Pierce M and Abbott KL, Cancer Biomark, 2014, 14, 55–62. [DOI] [PMC free article] [PubMed] [Google Scholar]
- 21.Wu G, Guo Z, Chatterjee A, Huang X, Rubin E, Wu F, Mambo E, Chang X, Osada M, Sook Kim M, Moon C, Califano JA, Ratovitski EA, Gollin SM, Sukumar S, Sidransky D and Trink B, Cancer Res, 2006, 66, 9829–9836. [DOI] [PubMed] [Google Scholar]
- 22.Zhao P, Nairn AV, Hester S, Moremen KW, O’Regan RM, Oprea G, Wells L, Pierce M and Abbott KL, J. Biol. Chem, 2012, 287, 25230–25240. [DOI] [PMC free article] [PubMed] [Google Scholar]
- 23.Nakakido M, Tamura K, Chung S, Ueda K, Fujii R, Kiyotani K and Nakamura Y, Int. J. Oncol, 2016, 49, 868–876. [DOI] [PMC free article] [PubMed] [Google Scholar]
- 24.Nagpal JK, Dasgupta S, Jadallah S, Chae YK, Ratovitski EA, Toubaji A, Netto GJ, Eagle T, Nissan A, Sidransky D and Trink B, Mod. Pathol, 2008, 21, 979–991. [DOI] [PMC free article] [PubMed] [Google Scholar]
- 25.Guo Z, Linn JF, Wu G, Anzick SL, Eisenberger CF, Halachmi S, Cohen Y, Fomenkov A, Hoque MO, Okami K, Steiner G, Engles JM, Osada M, Moon C, Ratovitski E, Trent JM, Meltzer PS, Westra WH, Kiemeney LA, Schoenberg MP, Sidransky D and Trink B, Nat. Med, 2004, 10, 374–381. [DOI] [PubMed] [Google Scholar]
- 26.Cordero EM, Nakayasu ES, Gentil LG, Yoshida N, Almeida IC and da Silveira JF, J. Proteome Res, 2009, 8, 3642–3652. [DOI] [PMC free article] [PubMed] [Google Scholar]
- 27.Cortes LK, Vainauskas S, Dai N, McClung CM, Shah M, Benner JS, Corrêa IR, VerBerkmoes NC and Taron CH, Proteomics, 2014, 14, 2471–2484. [DOI] [PMC free article] [PubMed] [Google Scholar]
- 28.Lu L, Gao J and Guo Z, Angew. Chem. Int. Ed, 2015, 54, 9679–9682. [DOI] [PMC free article] [PubMed] [Google Scholar]
- 29.Ueki N, Lee S, Sampson NS and Hayman MJ, Nat. Commun, 2013, 4, 2735. [DOI] [PubMed] [Google Scholar]
- 30.Chang PV, Dube DH, Sletten EM and Bertozzi CR, J. Am. Chem. Soc, 2010, 132, 9516–9518. [DOI] [PMC free article] [PubMed] [Google Scholar]
- 31.Wang H, Wang R, Cai K, He H, Liu Y, Yen J, Wang Z, Xu M, Sun Y, Zhou X, Yin Q, Tang L, Dobrucki IT, Dobrucki LW, Chaney EJ, Boppart SA, Fan TM, Lezmi S, Chen X, Yin L and Cheng J, Nat. Chem. Biol, 2017, 13, 415–424. [DOI] [PMC free article] [PubMed] [Google Scholar]
- 32.Jang JH, Lee H, Sharma A, Lee SM, Lee TH, Kang C and Kim JS, Chem. Commun, 2016, 52, 9965–9968. [DOI] [PubMed] [Google Scholar]
- 33.Ueki N, Wang W, Swenson C, McNaughton C, Sampson NS and Hayman MJ, Theranostics, 2016, 6, 808–816. [DOI] [PMC free article] [PubMed] [Google Scholar]
- 34.Saxon E, Luchansky SJ, Hang HC, Yu C, Lee SC and Bertozzi CR, J. Am. Chem. Soc, 2002, 124, 14893–14902. [DOI] [PubMed] [Google Scholar]
- 35.Gemma E, Lahmann M and Oscarson S, Carbohydr. Res, 2005, 340, 2558–2562. [DOI] [PubMed] [Google Scholar]
- 36.Pozsgay V, Carbohydr. Res, 1992, 235, 295–302. [DOI] [PubMed] [Google Scholar]
- 37.Tanaka S, Saburi H, Ishibashi Y and Kitamura M, Org. Lett, 2004, 6, 1873–1875. [DOI] [PubMed] [Google Scholar]
- 38.Tiede A, Bastisch I, Schubert J, Orlean P and Schmidt RE, Biol. Chem, 1999, 380, 503–523. [DOI] [PubMed] [Google Scholar]
- 39.Ferguson MAJ, Biochem. J, 1992, 284, 297–300. [DOI] [PMC free article] [PubMed] [Google Scholar]
- 40.Sambamurti K, Sevlever D, Koothan T, Refolo LM, Pinnix I, Gandhi S, Onstead L, Younkin L, Prada CM, Yager D, Ohyagi Y, Eckman CB, Rosenberry TL and Younkin SG, J. Biol. Chem, 1999, 274, 26810–26814. [DOI] [PubMed] [Google Scholar]
- 41.Raghupathy R, Anilkumar AA, Polley A, Singh PP, Yadav M, Johnson C, Suryawanshi S, Saikam V, Sawant SD, Panda A, Guo Z, Vishwakarma RA, Rao M and Mayor S, Cell, 2015, 161, 581–594. [DOI] [PMC free article] [PubMed] [Google Scholar]
- 42.Laughlin ST, Agard NJ, Baskin JM, Carrico IS, Chang PV, Ganguli AS, Hangauer MJ, Lo A, Prescher JA and Bertozzi CR, Method Enzymol, 2006, 415, 230–250. [DOI] [PubMed] [Google Scholar]
- 43.Kerra WG and Colucci F, J. Innate Immun, 2011, 3, 249–257. [DOI] [PMC free article] [PubMed] [Google Scholar]
- 44.Tolias KF and Cantley LC, Chem. Phys. Lipids, 1999, 98, 69–77. [DOI] [PubMed] [Google Scholar]
- 45.Kukulansky T, Abramovitch S and Hollander N, J. Immunol, 1999, 162, 5993–5997. [PubMed] [Google Scholar]
Associated Data
This section collects any data citations, data availability statements, or supplementary materials included in this article.