

Abstract
Objective:
To estimate the average incremental health care expenditures associated with habitual long and short duration of sleep as compared to healthy/average sleep duration.
Data Source:
Medical Expenditure Panel Survey (MEPS) data (2012; N=6,476) linked to the 2010–2011 National Health Interview Survey (NHIS).
Study Design:
Annual differences in health care expenditures are estimated for habitual long and short duration sleepers as compared to average duration sleepers using two-part logit generalized linear regression models.
Principal findings:
Habitual short duration sleepers reported an additional $1,400 in total unadjusted health care expenditures compared to people with average sleep duration (p<0.01). After adjusting for demographics, socioeconomic factors, and health behavior factors, this difference remained significant with an additional $1,278 in total healthcare expenditures over average duration sleepers (p<0.05). Long duration sleepers reported even higher, $2,994 additional health care expenditures over average duration sleepers. This difference in health care expenditures remained significantly high ($1,500, p<0.01) in the adjusted model. Expenditure differences are more pronounced for inpatient hospitalization, office expenses, prescription expenses and home health care expenditures.
Conclusion:
Habitual short and long sleep duration is associated with higher health care expenditures, which is consistent with the association between unhealthy sleep duration and poorer health outcomes.
Keywords: Sleep, health care costs, medical expenditures, health care services
INTRODUCTION
Over one-third of adults in the United States (US) sleep either less than seven hours or more than eight hours over a 24-hour period.1 Short (less than seven hours) and long (more than eight hours) sleep durations (hereon termed unhealthy sleep durations) are associated with several chronic health conditions such as cardio metabolic and cardiovascular disease.1,2,3 A recent study using 2004–2013 National Health Interview Survey (NHIS) data found that US adults who had been told by their doctor or other health professional that they had hypertension were more likely to have a stroke if their sleep duration over a 24-hour period was short or long.4 Studies show that there is a repeated observance of a U shaped relationship between sleep duration and health outcomes, and unlike popular belief, longer duration of sleep has also been associated with adverse health outcomes.1–4, 19–24 Hence, we encompass short and long durations of sleep as unhealthy sleep duration in our study.
Several mechanisms have been put forth to explain the association between unhealthy sleep (short or long sleep) and adverse health outcomes. Sleep deprivation and inadequate sleep, proxies for short sleep duration, have been linked to impaired glucose tolerance5–7, obesity8, and cardiovascular diseases.9 Lifestyle behaviors, such as drinking, smoking, and physical activity, as well as employment and socioeconomic status, are also associated with unhealthy sleep duration.2 Although studies have found a consistent relationship between sleep duration and several health behaviors and outcomes, few studies have assessed the association of unhealthy sleep duration patterns with health care utilization or expenditures.10 In this study we aim to assess if there is any association between unhealthy sleep duration and health care costs using cross-sectional data. Increasing awareness about the importance of healthy sleep duration is important not only for individuals who do not get healthy sleep but also for employers, payers, and health care delivery systems given their interest in health care management and population health.
This study uses 2012 data from 6,476 participants in Panels 16 and 17 of the Medical Expenditure Panel Survey (MEPS) linked to data from the NHIS for 2010 and 2011 (where sample respondents for MEPS were selected) to analyze how sleep duration is related to average annual health care expenditures for adults in the US. Data on short (less than seven hours), healthy/average (between seven and eight hours), and long (more than eight hours) sleep durations were obtained from the NHIS, while data on annual health care expenditures (total expenditures as well as office-based, hospital outpatient, hospital inpatient, emergency department, prescription, and other expenditures) were obtained from the MEPS.
METHODS
Study Setting and Population
Data for this study came from the 2012 MEPS linked to the 2010–2011 NHIS. Administered by the Agency for Healthcare Research and Quality (AHRQ), MEPS is a nationally representative sample survey of the civilian non-institutionalized population, including individuals, families, their medical providers, and employers which collects detailed information on health care utilization and expenditures. The data analyzed here came from the Household Component (HC) of MEPS which consists of detailed household interviews that collect information on demographics, employment status, income, insurance coverage, health conditions, health care service access, satisfaction with care, health care utilization, medical expenditures, and payment sources.11
Each year a new panel of households is sampled for the MEPS, and an overlapping panel design is used. For each panel, information is gathered about each individual in the participating households during five rounds of interviews occurring over a two-year period.12 MEPS Longitudinal Files contain household data collected during all five rounds of interviewing over the two-year period for a given panel of respondents. Longitudinal Files for Panels 16 and 17 were combined to obtain data for a full calendar year (2012) for use in the current study.
While MEPS focuses on health care utilization, health conditions, medical expenditures, and the source of payment for health care services, the NHIS focuses on the health status and health behaviors of the civilian, non-institutionalized population of the US. This large multi-purpose health survey is conducted by the National Center for Health Statistics (NCHS), Centers for Disease Control and Prevention (CDC). The NHIS sample size varies from year to year, with approximately 39,000 households surveyed annually.13
Given that the household component of MEPS is drawn from a subsample of households that participated in the prior year’s NHIS, we were able to directly link MEPS to NHIS and, thus, obtain a more comprehensive picture of survey participants. The MEPS Self-Administered Questionnaire (SAQ) is fielded annually and is designed to collect a variety of health status and health care quality measures of adults. All adults, ages 18 and older in MEPS households were asked to complete an SAQ. Our study includes only those respondents who provided SAQ data for both years. Respondents with health care expenditures greater than $200,000 were considered outliers and excluded from our sample. The sample also excluded any respondents with missing data for our variables of interest. Our final analytic sample included 6,476 (16.6 percent of total respondents) adults aged 18 years and older. This sample is nationally representative of 58,537,655 adults when point estimates are weighted and adjusted to the US non-institutionalized population. Figure 1 shows the flow diagram for our study sample.
Figure 1:
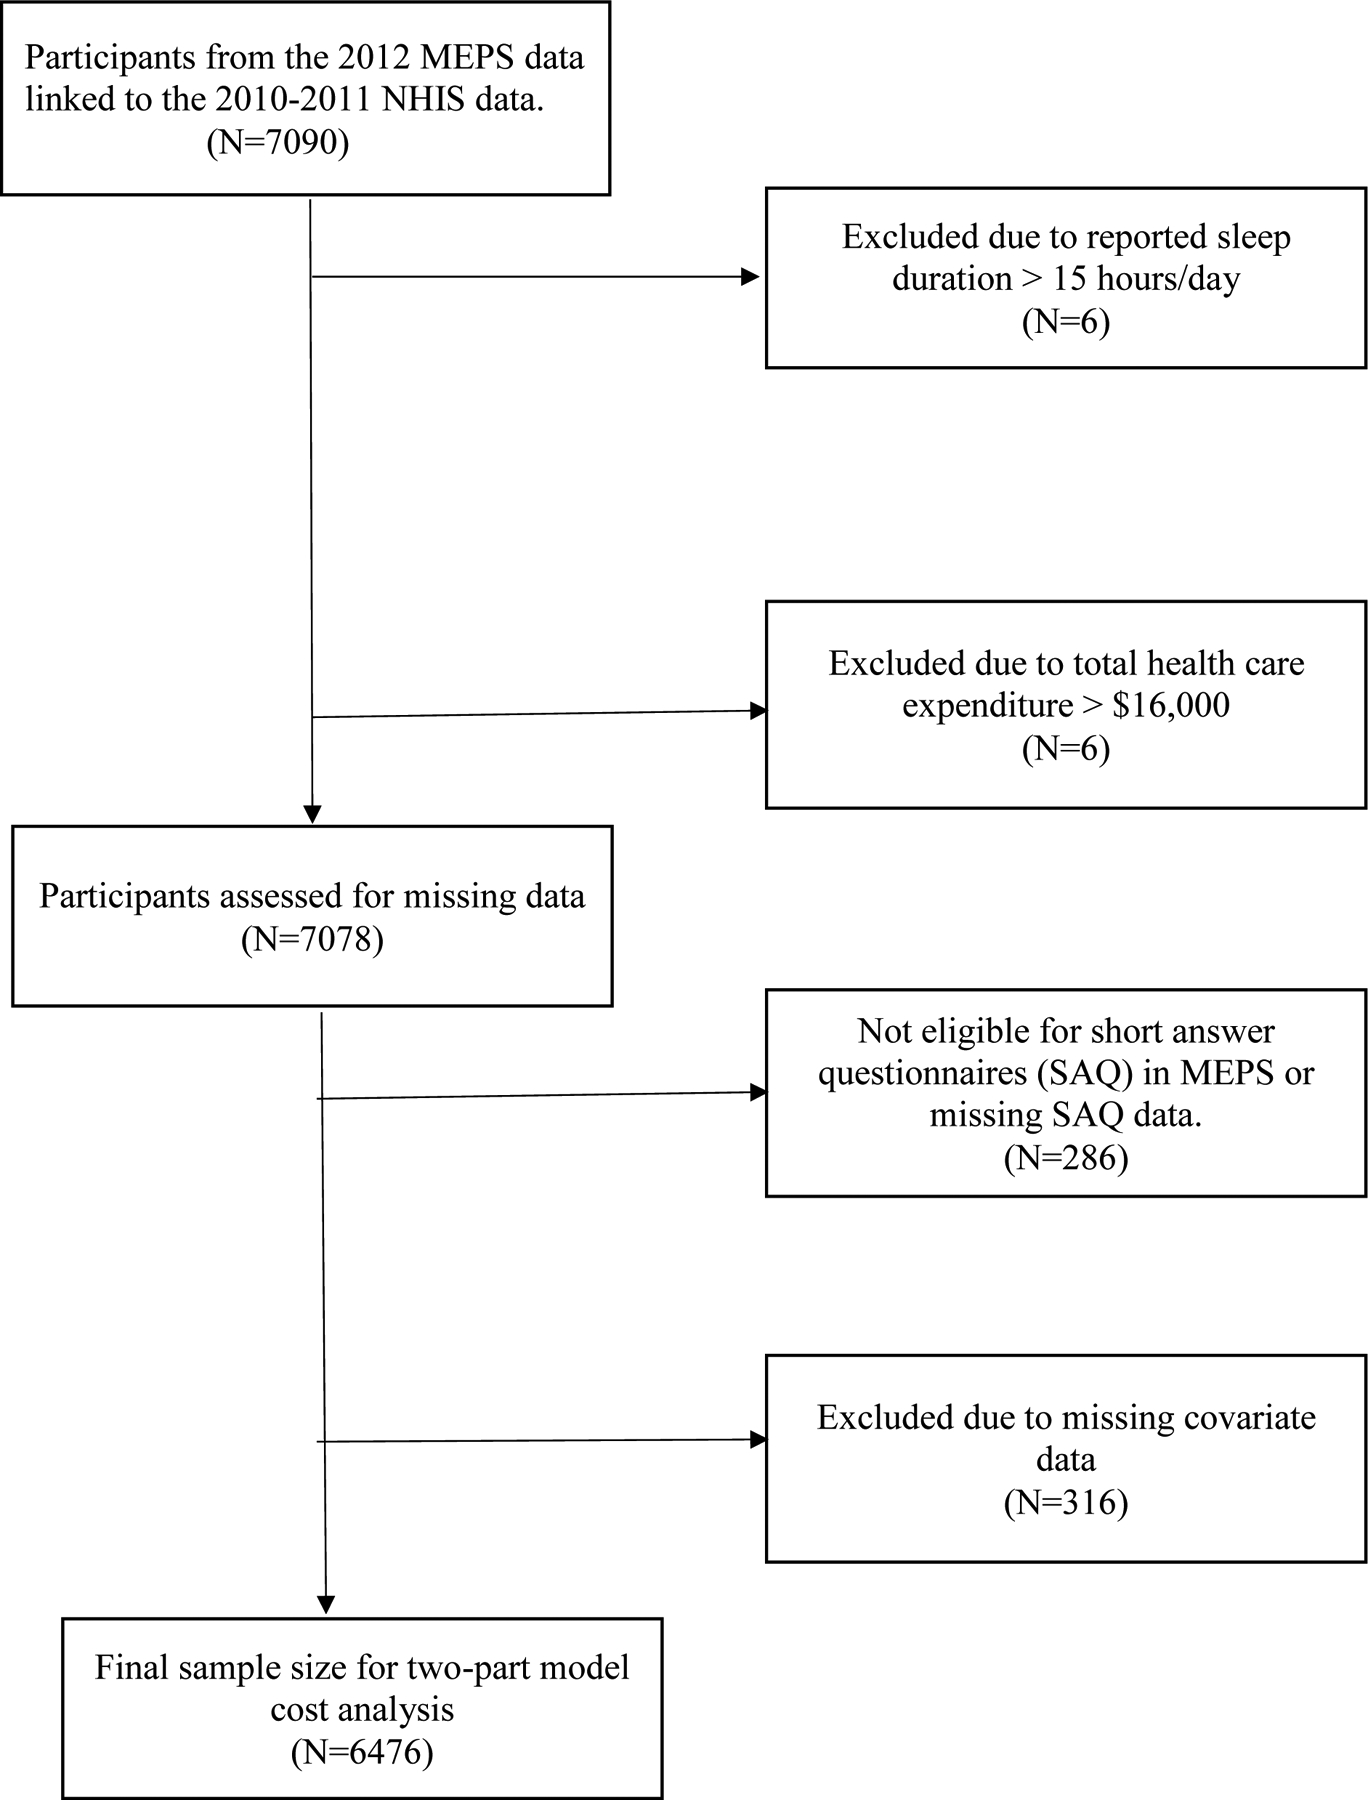
Flow diagram for the study sample.
Measures
Dependent Variables –
Our primary outcome variables were health care service use and associated costs during the study period. Health care services included total costs as well as component costs, such as office-based visits, hospital outpatient visits, inpatient care, emergency department visits, prescription medication, home health care, and other expenditures (e.g., expenditures for dental care, vision aids, and other medical supplies and equipment).
Independent Variable –
Sleep duration was measured based on the response of participants to the following NHIS question: “On average, how many hours of sleep do you get in a 24-hour period?” Respondents were asked to enter hours of sleep in whole numbers, rounding 30 minutes (1/2 hour) or more up to the next whole hour and dropping 29 or fewer minutes. We re-coded sleep duration into “short duration (< 7 hours)”, “healthy/average duration (7–8 hours)”, and “long duration (9–15 hours)”. Respondents who indicated that they slept more than 15 hours were excluded.
Model Covariates –
A MEPS panel indicator was included in the models to adjust for any differences between the two panels in the study. Several covariates were included in the models to adjust for potential confounders in the relationship between sleep duration and health care expenditures. These covariates included sociodemographic variables (age, sex, race/ethnicity, education, poverty, marital status, health insurance, perceived general health status, and mental health status), lifestyle and health behavior variables (BMI category, smoking), and comorbidities (high blood pressure, diabetes, stroke, cancer, any heart condition, and any respiratory condition). We included these covariates because they have been shown to be related to sleep duration and health care costs.1–9,20,21,23 Table A (in appendix) describes the association observed between each covariate and sleep duration in the literature.
Statistical Analyses
Frequencies and measures of central tendency were used to explore our sample population and assess the distribution of covariates for short, average, and long duration of sleep. Pearson and Spearman correlations were used to investigate the unadjusted association between covariates and the three categories of sleep duration.
Our health care expenditure data included several individuals with zero costs (N=1,235) and the distribution of costs for individuals with positive expenditures was highly right-skewed, therefore, we utilized multivariate two-part models for mixed discrete-continuous outcomes to analyze our data. In the first part, a logit model was used to estimate the probability of having any positive (non-zero) expenditures. In the second part, a generalized linear model with gamma distribution and a log link function was used for predicting annual health care spending conditional on having positive expenditures.14 Stepwise models were generated based on the incremental adjustment of covariates. Unadjusted models included sleep duration as a primary predictor variable along with a MEPS panel indicator. Models were then sequentially adjusted for: 1) demographics that included sex (male or female), age (18–44, 45–54, 55–64, 65–74, 75+), race/ethnicity (Hispanic, White non-Hispanic, Black non-Hispanic, Other/Multiracial), marital status (married, widowed, separated/divorced, never married); 2) socioeconomic factors that included health insurance coverage (private, public, uninsured), education (no degree/GED, high school/any college, bachelors, masters/post grad/professional degree), federal poverty level category (0% to 199%, 200% to less than 400%, and 400% or higher federal poverty levels); 3) lifestyle and health behavior factors that included smoking (smokers, non-smokers); and 4) health status and chronic conditions that included BMI (not overweight, overweight, obese class 1, obese class 2 and above), self-reported general health status (excellent/good, fair/poor), self-reported mental health status (excellent/good, fair/poor), high blood pressure (yes or no), diabetes (yes or no), stroke (yes or no), cancer (yes or no), any heart condition (yes or no), and any respiratory condition (yes or no).
For each category of sleep duration (short, average, and long sleep), coefficients from the two-part model were used to estimate health care expenditures for each category of sleep duration while adjusting for all other covariates using recycled predictions.15–18 Average predicted costs and 95% confidence intervals were reported for all three categories of sleep duration. We also calculated the difference in estimates of health care expenditures for people who reported short and long sleep duration versus those who reported average sleep duration and the statistical significance of these differences were measured using Pearson chi-square tests. All analyses were conducted using Stata SE (version 15) and were adjusted for the complex survey design of MEPS. Expenditures were reported in 2012 US dollars.
RESULTS
Table 1 presents the distribution of all covariates used in the study for all included respondents and by sleep duration category. The sample of respondents was about equally split between Panel 16 and Panel 17 participants in MEPS. Almost 45 percent of respondents were between the ages of 18–44, about half (49.2 percent) were whites, 43.6 percent were married, and 56.8 percent were females. Approximately 56.5 percent had at least a high school/college degree, 58.1 percent had private insurance and 41.7 percent reported being below the 200 percent federal poverty level. Participants also reported a wide range of behavioral and medical risk factors. Approximately 34.9 percent of the sample were overweight, and 18.6 percent reported a history of smoking. Few reported having a history of chronic health conditions such as stroke (4.2 percent), diabetes (10.5 percent), respiratory conditions (11.1 percent), heart conditions (14.3 percent), and cancer (10.7 percent) but 37.1 percent reported having a history of high blood pressure. Average sleep duration was reported by 62.6 percent of the weighted sample, while the rest of the sample reported either short sleep duration (29.4 percent) or long sleep duration (8.2 percent).
Table 1:
Covariate Distribution in Total and by Sleep duration category. All Proportions Account for the Complex Survey Design of the Medical Expenditure Panel Survey (N =6,476)
| Total (%) | Short duration (29.3%) | Medium duration (62.6%) | Long duration (8.2%) | p-value | |
|---|---|---|---|---|---|
| Covariates | |||||
| Panel | |||||
| Sixteen | 50.10% | 29.40% | 61.30% | 9.30% | 0.0275 |
| Seventeen | 49.90% | 29.10% | 63.70% | 7.20% | |
| Sex | |||||
| Male | 43.20% | 29.40% | 63.00% | 7.60% | 0.4132 |
| Female | 56.80% | 29.10% | 62.20% | 8.70% | |
| Age | |||||
| 18–44 | 44.40% | 29.50% | 63.20% | 7.30% | <0.001 |
| 45–54 | 18.60% | 32.70% | 61.90% | 5.40% | |
| 55–64 | 16.50% | 30.70% | 63.50% | 5.80% | |
| 65–74 | 11.50% | 26.20% | 61.80% | 12.10% | |
| 75+ | 9.00% | 24.00% | 60.70% | 15.30% | |
| Race | |||||
| Hispanic | 22.20% | 26.90% | 64.40% | 8.70% | <0.001 |
| White non-Hispanic | 49.20% | 27.80% | 63.70% | 8.50% | |
| Black non-Hispanic | 20.40% | 40.40% | 52.50% | 7.00% | |
| Other/Multi-racial | 8.20% | 29.40% | 65.20% | 5.40% | |
| Marital status | |||||
| Married | 43.60% | 27.60% | 65.90% | 6.50% | <0.001 |
| Widowed | 8.70% | 24.60% | 60.10% | 15.30% | |
| Separated/Divorced | 20.20% | 34.40% | 58.70% | 6.90% | |
| Never Married | 27.50% | 30.00% | 60.50% | 9.60% | |
| Poverty level | |||||
| 0–199% FP | 41.70% | 32.60% | 55.50% | 11.80% | <0.001 |
| 200-<400 FP | 28.40% | 27.90% | 64.40% | 7.70% | |
| 400%+ FP | 30.00% | 27.50% | 67.00% | 5.40% | |
| Health Insurance | |||||
| Any Private | 58.10% | 27.90% | 65.60% | 6.50% | <0.001 |
| Public | 23.60% | 31.80% | 54.80% | 13.40% | |
| Uninsured | 18.30% | 32.30% | 59.20% | 8.50% | |
| Education | |||||
| No Degree/GED | 16.60% | 29.70% | 55.50% | 14.80% | <0.001 |
| High School/Any College | 56.50% | 32.20% | 59.30% | 8.50% | |
| Bachelors | 17.00% | 25.70% | 68.60% | 5.70% | |
| Masters/Post Grad/Professional degree | 9.90% | 21.80% | 73.30% | 4.90% | |
| Stroke | |||||
| No | 95.80% | 29.40% | 62.60% | 7.90% | 0.0125 |
| Yes | 4.20% | 25.40% | 60.70% | 13.80% | |
| Diabetes | |||||
| No | 89.50% | 29.20% | 63.20% | 7.60% | |
| Yes | 10.50% | 30.00% | 57.00% | 13.00% | |
| High Blood pressure | |||||
| No | 62.90% | 27.60% | 65.20% | 7.30% | <0.001 |
| Yes | 37.10% | 32.10% | 58.30% | 9.60% | |
| Any respiratory conditions | |||||
| No | 88.90% | 28.40% | 63.50% | 8.00% | 0.002 |
| Yes | 11.10% | 35.40% | 55.40% | 9.20% | |
| Any heart condition | |||||
| No | 85.70% | 28.60% | 63.70% | 7.80% | 0.0027 |
| Yes | 14.30% | 32.90% | 56.90% | 10.20% | |
| Cancer | |||||
| No | 89.30% | 29.90% | 62.90% | 7.20% | <0.001 |
| Yes | 10.70% | 25.30% | 60.00% | 14.70% | |
| Perceived Health Status | |||||
| Excellent to Good | 84.40% | 27.70% | 64.70% | 7.60% | <0.001 |
| Fair to Poor | 15.60% | 38.90% | 49.40% | 11.60% | |
| Perceived Mental health status | |||||
| Excellent to Good | 91.20% | 28.60% | 63.80% | 7.60% | <0.001 |
| Fair to Poor | 8.80% | 36.10% | 49.00% | 14.90% | |
| BMI category | |||||
| Not overweight | 32.50% | 25.80% | 65.70% | 8.60% | <0.001 |
| Overweight | 34.90% | 29.20% | 63.30% | 7.50% | |
| Obese Class I | 19.20% | 31.10% | 60.50% | 8.40% | |
| Obese Class II+ | 13.40% | 36.30% | 55.10% | 8.60% | |
| Smoking | |||||
| No | 81.40% | 27.40% | 64.70% | 7.90% | <0.001 |
| Yes | 18.60% | 37.40% | 53.40% | 9.30% |
Table 1 presents the distribution of all covariates used in the study for all included respondents and by sleep duration category using Pearson’s correlation coefficient.
Percentages may not total 100 due to rounding.
Abbreviations:
BMI = body mass index
FPL = Federal Poverty Level
MEPS = Medical Expenditure Panel Survey
There was no significant association between sleep duration and sex (p = .4132). However, sleep duration was significantly associated with all other covariates (p < .05). For example, 40.4 percent of non-Hispanic Blacks reported short sleep duration, while the prevalence of short sleep duration was below 30 percent for all other racial/ethnic groups. People in the age group of 45–54 reported the highest percentage (32.7 percent) of short sleep duration while short sleep prevalence was below 31 percent in all other age groups. A high percentage of respondents who reported excellent to good general health status also reported average sleep duration (64.7 percent). Similarly, most respondents who reported excellent to good mental health status also reported average sleep duration (63.8 percent). About 37.4 percent of smokers reported short sleep duration compared to 27.4 percent of non-smokers.
Figure 2 reports the difference in average annual health care expenditures between short vs. medium sleep duration (top half of the figure) and long vs. medium sleep duration (bottom half of the figure). The top and bottom end of each vertical column represent the 95% confidence interval, with the point estimate of differential expenditure included in the middle of each vertical bar. Average annual unadjusted and adjusted expenditures were higher for short and long sleep durations compared to average sleep duration. Thus, people reporting short sleep duration had significantly higher unadjusted total average annual health care expenditures compared to people with average sleep duration (difference=$1,400; 95 percent CI: $275, $2,525; p < .01). This difference in unadjusted total annual expenditures was larger between long and average sleep durations (difference=$2,994; 95 percent CI: $1,457, $4,531; p < .0001). After adjusting for demographics, socioeconomic, and health behavior factors, the difference in the average annual health care expenditures between short and average sleep duration decreased. However, short sleepers still had statistically significant higher average annual expenditures compared to average sleepers (difference=$1,278; $36, $2,520; p < 0.05). The difference between the average annual health care expenditures of long sleepers and average sleepers remained significantly higher in this adjusted model (difference=$1,500; $369, $2,632; p < 0.01). After we adjusted for all covariates (including chronic health conditions), the difference in expenditures between sleep categories remained high, however, it did not reach statistical significance. The differences in total annual expenditures were $989 (95 percent CI: -$322, $2,299; p=0.1383) between short and average sleep duration and $867 (95 percent CI: -$255, $1,989; p=0.1291) between long and average sleep duration.
Figure 2:

Difference in Average Annual Health Care Expenditures
Table 2 presents the average annual unadjusted and adjusted estimated health care expenditures by health service category for each sleep duration group. It also reports the difference in average expenditures and 95 percent confidence intervals for short and long sleep durations as compared to average sleep duration discussed above. There were significant increases in average annual unadjusted expenditures between long and average sleep durations within the office-based, hospital inpatient, prescription medication, and home health care service categories (office based difference=$461; 95 percent CI: $47, $876; p <0.05: hospital inpatient difference=$952.43; 95 percent CI: $66, $1839; p <0.05: prescription medication difference=$873; 95 percent CI: $444, $1302; p <0.01: home health care difference=$518; 95 percent CI: $83, $953; p <0.05). However, the differences were narrow and not statistically significant for all adjusted models.
Table 2:
Average Annual Health Care Expenditures Associated with categorized sleep in terms of duration (medium, short & long), in Total and by Service Category, in 2012 U.S. Dollars. Ninety-Five Percent Confidence Intervals in Parentheses. Unadjusted Averages include only the MEPS Panel as a Covariate. Averages Are Adjusted for Panel, Demographics, Socioeconomic, Health conditions, and Health Behavior Covariates (N =6,476)
| Medium duration (N=3964) | Short duration (N=1942) | Long duration (N=570) | ||
|---|---|---|---|---|
| Total | Unadjusted Average | $4733 (4300–5166) | $6133 (5098–7169) | $7727 (6130–9325) |
| Increase over Medium duration of sleep | NA | $1,400 (275–2525) †† | $2,994 (1457–4531) †† | |
| Adjusted for demographics | $4768 (4331–5200) | $6334 (5087–7581) | $6759 (5425–8093) | |
| Increase over Medium duration of sleep | NA | $1566 (180–2951) † | $1991 (689–3292) † | |
| Adjusted for demographics, socioeconomic & health behavior factors | $4885 (4437–5332) | $6165 (5049–7276) | $6385 (5220–7550) | |
| Increase over Medium duration of sleep | NA | $1,278 (36–2520) † | $1,500 (369–2632) †† | |
| Adjusted for demographics, socioeconomic factors and health conditions | $5054 (4556–5552) | $6043 (4905–7180) | $5921 (4866–6976) | |
| Increase over Medium duration of sleep | NA | $989 (−322–2299) | $867 (−255–1989) | |
| Office-based | Unadjusted Average | $1288 (1147–1428) | $1351 (1153–1549) | $1749 (1357–2141) |
| Increase over Medium duration of sleep | NA | $63 (−139–266) | $461 (47–876) † | |
| Adjusted for demographics | $1295 (1158–1431) | $1407 (1216–1599) | $1521 (1206–1837) | |
| Increase over Medium duration of sleep | NA | $113 (−69–295) | $227 (−106–559) | |
| Adjusted for demographics, socioeconomic factors | $1265 (1240–1627) | $1433 (1240–1627) | $1627 (1292–1962) | |
| Increase over Medium duration of sleep | NA | $168 (−15–351) | $362 (22–702) † | |
| Adjusted for demographics, socioeconomic factors and chronic conditions | $1295 (1164–1427) | $1396 (1201–1592) | $1540 (1230–1850) | |
| Increase over Medium duration of sleep | NA | $101 (−77–279) | $245 (−81–571) | |
| Hospital outpatient | Unadjusted Average | $401 (300–502) | $513 (393–634) | $593 (255–931) |
| Increase over Medium duration of sleep | NA | $112 (−26–250) | $192 (−146–530) | |
| Adjusted for demographics | $399 (303–495) | $524 (402–647) | $591 (296–886) | |
| Increase over Medium duration of sleep | NA | $126 (−5–256) | $192 (−92–477) | |
| Adjusted for demographics, socioeconomic factors | $406 (310–502) | $506 (392–620) | $567 (289–845) | |
| Increase over Medium duration of sleep | NA | $99 (−25–224) | $161 (−108–430) | |
| Adjusted for demographics, socioeconomic factors and chronic conditions | $406 (313–500) | $500 (383–616) | $469 (278–661) | |
| Increase over Medium duration of sleep | NA | $94 (−35–222) | $63 (−127–253) | |
| Hospital inpatient | Unadjusted Average | $1181 (957–1406) | $1915 (1110–2721) | $2134 (1258–3009) |
| Increase over Medium duration of sleep | NA | $734 (−116–1585) | $952 (66–1839) † | |
| Adjusted for demographics | $1212 (988–1436) | $1909 (1226–2591) | $1893 (1027–2760) | |
| Increase over Medium duration of sleep | NA | $697 (−9–1403) | $682 (−205–1568) | |
| Adjusted for demographics, socioeconomic factors | $1254 (1023–1485) | $1790 (1205–2375) | $1664 (1007–2321) | |
| Increase over Medium duration of sleep | NA | $536 (−75–1146) | $410 (−249–1069) | |
| Adjusted for demographics, socioeconomic factors and chronic conditions | $1308 (1065–1550) | $1657 (1130–2184) | $1574 (989–2159) | |
| Increase over Medium duration of sleep | NA | $349 (−211–909) | $266 (−333–865) | |
| Emergency Department | Unadjusted Average | $171 (142–200) | $252 (162–341) | $214 (146–283) |
| Increase over Medium duration of sleep | NA | $81 (−21–182) | $43 (−35–121) | |
| Adjusted for demographics | $176 (149–203) | $241 (178–303) | $207 (142–272) | |
| Increase over Medium duration of sleep | NA | $65 (−3–132) | $31 (−41–103) | |
| Adjusted for demographics, socioeconomic factors | $179 (152–206) | $237 (180–295) | $201 (138–264) | |
| Increase over Medium duration of sleep | NA | $59 (−2–119) | $22 (−45–89) | |
| Adjusted for demographics, socioeconomic factors and chronic conditions | $190 (161–218) | $215 (167–263) | $193 (130–256) | |
| Increase over Medium duration of sleep | NA | $25 (−28–79) | $3 (−64–70) | |
| Prescription | Unadjusted Average | $1128 (988–1267) | $1424 (1243–1606) | $2001 (1569–2432) |
| Increase over Medium duration of sleep | NA | $297 (64–529) † | $873 (444–1302) †† | |
| Adjusted for demographics | $1119 (987–1251) | $1476 (1280–1672) | $1955 (1388–2522) | |
| Increase over Medium duration of sleep | NA | $357 (117–596) †† | $836 (265–1407) †† | |
| Adjusted for demographics, socioeconomic factors | $1153 (1015–1291) | $1440 (1247–1633) | $1808 (1368–2249) | |
| Increase over Medium duration of sleep | NA | $287 (46–528) † | $655 (207–1103) †† | |
| Adjusted for demographics, socioeconomic factors and chronic conditions | $1288 (1127–1449) | $1348 (1162–1534) | $1728 (1266–2189) | |
| Increase over Medium duration of sleep | NA | $60 (−169–289) | $439 (−55–934) | |
| Other (expenditures for dental care, vision aids, and other medical supplies and equipment) | Unadjusted Average | $414 (362–466) | $450 (304–595) | $369 (291–447) |
| Increase over Medium duration of sleep | NA | $35 (−118–189) | $ −45 (−139–48) | |
| Adjusted for demographics | $410 (361–458) | $476 (332–619) | $336 (271–401) | |
| Increase over Medium duration of sleep | NA | $66 (−80–212) | $ −74 (−152–4) | |
| Adjusted for demographics, socioeconomic factors | $399 (353–445) | $493 (352–635) | $367 (299–436) | |
| Increase over Medium duration of sleep | NA | $94 (−47–236) | $ −32 (−110–46) | |
| Adjusted for demographics, socioeconomic factors and chronic conditions | $401 (356–446) | $481 (351–611) | $389 (312–465) | |
| Increase over Medium duration of sleep | NA | $80 (−48–207) | $−13 (−95–70) | |
| Home health care | Unadjusted Average | $150 (86–214) | $228 (90–366) | $668 (230–1105) |
| Increase over Medium duration of sleep | NA | $78 (−75–231) | $518 (83–953) † | |
| Adjusted for demographics | $136(79–194) | $244 (105–383) | $642 (248–1036) | |
| Increase over Medium duration of sleep | NA | $108 (−39–255) | $506 (114–899) † | |
| Adjusted for demographics, socioeconomic factors | $201 (115–287) | $259 (131–386) | $692 (284–1099) | |
| Increase over Medium duration of sleep | NA | $58 (−70–185) | $491 (86–895) † | |
| Adjusted for demographics, socioeconomic factors and chronic conditions | $220 (115–325) | $269 (130–409) | $832 (336–1327) | |
| Increase over Medium duration of sleep | NA | $49 (−72–170) | $611 (126–1096) † |
Analyses account for the complex survey design of the MEPS
Demographics covariates were age, sex, race, and marital status. Socioeconomic covariates were insurance coverage category, education category, poverty category. Health behavior included smoking. Health status and chronic condition indicators were BMI category, general health status, mental health status, blood pressure, diabetes, stroke, cancer, any heart condition, and any respiratory condition.
Difference significant at α=0.01 level.
Difference significant at α=0.05 level.
BMI = body mass index; MEPS = Medical Expenditure Panel Survey; NA = Not applicable
The differences in adjusted and unadjusted annual average expenditures between short and average sleep durations were smaller—and sometimes less significant across different service categories compared to those between long and average sleep durations. Nonetheless, people reporting short sleep duration still had higher unadjusted and adjusted average health expenditures compared to those with average sleep duration across all service categories.
DISCUSSION
Findings from the current study indicate that individuals who reported habitual short or long sleep have higher overall and specific annual medical expenditures compared to individuals who reported habitual average sleep. We found that short sleepers had higher overall medical expenditures as well as higher emergency department, hospital inpatient and outpatient expenditures. Particularly, short sleepers who had a chronic health condition had higher medical expenditures than average and long sleepers. Long sleepers had higher incremental annual medical costs than average sleepers. The incremental costs remained high even after adjusting for chronic health conditions. Compared to average and short sleepers, long sleepers had the highest office-based, prescription, and home healthcare expenditures. Overall, our findings highlight the existence of substantial differences in health care expenditures between short, average, and long sleepers in the US.
Short sleepers, compared to average sleepers, had significantly higher total average annual health care expenditures. One possible explanation for the high medical costs among short sleepers is rooted in overwhelming evidence that short sleep duration is associated with increased risk for poor health outcomes.5–9 However, the incremental difference in health care costs between average and unhealthy sleepers (long and short sleepers) does not reach statistical significance when adjusted for chronic health conditions and we can argue that what may unify all three sleep categories is the concept of sleep quality. It may be that short, average/healthy, and long sleepers who have chronic health conditions experience poor sleep quality, which may exacerbate their illness and increase their risk for a comorbid medical condition which will likely drive up costs.22
Sleep category and domain specific medical expenses may reflect profiles of health
In trying to make sense as to why long sleepers had higher office-based, prescription, and home health care expenditures, we conjecture that this may be reflective of an individual who incurs substantial expenses to manage a chronic health condition that may not require urgent or acute care like in an emergency department visit. This idea is consistent with previous work highlighting the concomitant effects of long sleep and existing chronic health conditions.1, 20 The habitual long sleep duration that chronically ill individuals experience may be due to their medical symptoms or medication side effects. Conversely, short sleepers may have higher emergency department, hospital inpatient, and outpatient expenses partly because the type of medical conditions they are more prone to have are acute or event based (such as myocardial infarction, strokes, respiratory conditions) and will require more urgent and frequent care, as seen in emergency departments and inpatient and outpatient settings.23 These findings are pivotal for optimizing health care services for these individuals.
Unhealthy sleep (short/long sleep duration) associated with high medical costs in the US
The US spent over $3 trillion on health care in 2016 and on average $9,237 per individual—the highest per capita level of health care expenditures in the world.27, 28 Despite spending the most, the US does not rank well in its population health outcomes.29, 30 Although improving health care delivery and services can drastically reduce medical costs, preventive strategies (where individuals lead healthier lifestyles by having a healthy diet, staying active, managing stress, and sleeping a healthy amount of time) as well as early detection and treatment of chronic health conditions might reduce costs even more. Based on our findings, we argue that unhealthy sleep (short or long sleep durations) may be one lifestyle behavior that might be responsible for high medical expenditures. Habitual unhealthy sleep and sleep disorders which are directly and indirectly linked with adverse health may be responsible for higher medical expenditures. In addition, unhealthy sleep may exacerbate adverse health conditions, increasing the risk of developing multiple medical comorbidities that further drive up health care costs.25, 26 Improving sleep at the population level may curb or reduce medical costs in the US.
Improving sleep to reduce medical expenditures
We suggest several strategies to ameliorate the unhealthy sleep-medical expenditure link. First, since a fair amount of unhealthy sleep may be attributed to sleep disorders, we suggest that individuals who report sleep disturbances should be screened for insomnia and obstructive sleep apnea and seek timely and proper treatment to avoid adverse health consequences. Second, we suggest that health care providers and payers assist patients, who have a chronic health condition, improve their sleep through health and lifestyle education.
Limitations
Our findings should be interpreted with caution considering several limitations. We are precluded from making any strong causal claims between unhealthy sleep duration (short or long sleep durations) and medical costs given the structure of the linked NHIS/MEPS data and the cross-sectional study design. We also were unable to assess other sleep parameters outside of sleep duration (e.g., sleep quality and the amount of rapid eye movement sleep often linked to restorative functions of sleep) that are associated with adverse health conditions. We were unable to assess the confounding effects of sleep disorders in our models, which might affect general and specific medical expenditures. We did not adjust for geography in our analysis as the census region categories in our data are highly aggregated and, thus, difficult to interpret in a meaningful way. There are also important sociological and socioeconomic determinants of sleep that are unmeasured confounders (e.g., detailed family composition, types of shift jobs) and that may be related to short sleep. Our findings did not adjust for the performance of multiple tests; thus, concerns about type 1 error may also lead to important findings not being considered significant or important. It is also possible that the analyses presented ignores interactions among covariates and substitutions among different components of care. Lastly, MEPS does not collect information for over-the-counter prescription medications; thus, total expenditures in our study are likely underestimated.
CONCLUSION
Many Americans experience unhealthy sleep durations and are affected by several corollary chronic health conditions. Our study assessed the additional health care costs incurred by having habitual short or long sleep duration compared to average sleep duration. These findings are particularly timely and important in an era when health care providers, payers, and patients are striving to reduce costs without sacrificing the quality of care. We argue that our findings should be viewed cautiously as we are not trying to ‘pathologize’ short or long sleep durations as diseases, like hypertension or diabetes. Such an approach can be misused for risk stratification in actuarial models and thus may unduly discriminate against individuals who are habitual short or long sleepers.
Supplementary Material
Funding statement:
This study is supported, in part, by the National Institutes of Health (NIH) under grant numbers R25HL105444, R01MD004113, R01AG056531, K01HL135452, K07AG052685, and R01HL14206, R01HL141427. The contents of this publication are solely the responsibility of the authors and do not necessarily represent the official views of the NIH.
Footnotes
Conflict of interest : The authors declare no conflict of interest
REFERENCES
- 1.Buxton OM, Marcelli E. Short and long sleep are positively associated with obesity, diabetes, hypertension, and cardiovascular disease among adults in the United States. Social science & medicine. 2010;71(5):1027–1036. [DOI] [PubMed] [Google Scholar]
- 2.Krueger PM, Friedman EM. Sleep duration in the United States: a cross-sectional population-based study. American journal of epidemiology. 2009;169(9):1052–1063. [DOI] [PMC free article] [PubMed] [Google Scholar]
- 3.Meng L, Zheng Y, Hui R. The relationship of sleep duration and insomnia to risk of hypertension incidence: a meta-analysis of prospective cohort studies. Hypertension Research. 2013;36(11):985. [DOI] [PMC free article] [PubMed] [Google Scholar]
- 4.Akinseye O, Ojike N, Williams SK, et al. Increased risk of stroke among hypertensive patients with abnormally short sleep duration: analysis of the national health interview survey. Journal of the American Society of Hypertension. 2015;9(4):e3. [Google Scholar]
- 5.Gangwisch JE. Epidemiological evidence for the links between sleep, circadian rhythms and metabolism. Obesity reviews. 2009;10(s2):37–45. [DOI] [PMC free article] [PubMed] [Google Scholar]
- 6.Gottlieb DJ, Punjabi NM, Newman AB, et al. Association of sleep time with diabetes mellitus and impaired glucose tolerance. Archives of internal medicine. 2005;165(8):863–867. [DOI] [PubMed] [Google Scholar]
- 7.Spiegel K, Leproult R, Van Cauter E. Impact of sleep debt on metabolic and endocrine function. The lancet. 1999;354(9188):1435–1439. [DOI] [PubMed] [Google Scholar]
- 8.Gangwisch JE, Malaspina D, Boden-Albala B, Heymsfield SB. Inadequate sleep as a risk factor for obesity: analyses of the NHANES I. Sleep. 2005;28(10):1289–1296. [DOI] [PubMed] [Google Scholar]
- 9.Newman AB, Enright PL, Manolio TA, Haponik EF, Wahl PW. Sleep disturbance, psychosocial correlates, and cardiovascular disease in 5201 older adults: the Cardiovascular Health Study. Journal of the American Geriatrics Society. 1997;45(1):1–7. [DOI] [PubMed] [Google Scholar]
- 10.Hillman D, Mitchell S, Streatfeild J, Burns C, Bruck D, Pezzullo L. The economic cost of inadequate sleep. Sleep. 2018. [DOI] [PubMed] [Google Scholar]
- 11.Medical Expenditure Panel Survey Background. https://meps.ahrq.gov/mepsweb/about_meps/survey_back.jsp. Accessed July 24, 2018.
- 12.Medical Expenditure Panel Survey Content Summary of the Household Interview. https://meps.ahrq.gov/mepsweb/survey_comp/hc_data_collection.jsp. Accessed July 24, 2018.
- 13.NHIS - About the National Health Interview Survey. https://www.cdc.gov/nchs/nhis/about_nhis.htm. Published April 9, 2018. Accessed July 24, 2018.
- 14.Belotti F, Deb P, Manning WG, Norton EC. twopm: Two-part models. Stata J. 2015;15(1):3–20. [Google Scholar]
- 15.Stockbridge EL, Suzuki S, Pagán JA. Chronic pain and health care spending: an analysis of longitudinal data from the Medical Expenditure Panel Survey. Health services research. 2015;50(3):847–870. [DOI] [PMC free article] [PubMed] [Google Scholar]
- 16.Greene WH. Econometric Analysis. Pearson Education India; 2003.
- 17.Basu A, Polsky D, Manning WG. Use of Propensity Scores in Non-Linear Response Models: The Case for Health Care Expenditures. National Bureau of Economic Research; 2008. [Google Scholar]
- 18.Martin BI, Gerkovich MM, Deyo RA, et al. The association of complementary and alternative medicine use and health care expenditures for back and neck problems. Medical care. 2012;50(12):1029. [DOI] [PMC free article] [PubMed] [Google Scholar]
- 19.Patel SR, Malhotra A, Gottlieb DJ, White DP, Hu FB. Correlates of long sleep duration. Sleep. 2006;29(7):881–889. [DOI] [PMC free article] [PubMed] [Google Scholar]
- 20.Stamatakis KA, Punjabi NM. Long sleep duration: a risk to health or a marker of risk? Sleep medicine reviews. 2007;11(5):337–339. [DOI] [PMC free article] [PubMed] [Google Scholar]
- 21.Stranges S, Dorn JM, Shipley MJ, et al. Correlates of short and long sleep duration: a cross-cultural comparison between the United Kingdom and the United States: the Whitehall II Study and the Western New York Health Study. American journal of epidemiology. 2008;168(12):1353–1364. [DOI] [PMC free article] [PubMed] [Google Scholar]
- 22.Zee PC, Turek FW. Sleep and health: everywhere and in both directions. Archives of internal medicine. 2006;166(16):1686–1688. [DOI] [PubMed] [Google Scholar]
- 23.Cappuccio FP, Cooper D, D’elia L, Strazzullo P, Miller MA. Sleep duration predicts cardiovascular outcomes: a systematic review and meta-analysis of prospective studies. European heart journal. 2011;32(12):1484–1492. [DOI] [PubMed] [Google Scholar]
- 24.Youngstedt SD, Kripke DF. Long sleep and mortality: rationale for sleep restriction. Sleep medicine reviews. 2004;8(3):159–174. [DOI] [PubMed] [Google Scholar]
- 25.Cizza G, Marincola P, Mattingly M, et al. Treatment of obesity with extension of sleep duration: a randomized, prospective, controlled trial. Clinical trials. 2010;7(3):274–285. [DOI] [PMC free article] [PubMed] [Google Scholar]
- 26.Leproult R, Deliens G, Gilson M, Peigneux P. Beneficial impact of sleep extension on fasting insulin sensitivity in adults with habitual sleep restriction. Sleep. 2015;38(5):707–715. [DOI] [PMC free article] [PubMed] [Google Scholar]
- 27.Dieleman JL, Campbell M, Chapin A, et al. Future and potential spending on health 2015–40: development assistance for health, and government, prepaid private, and out-of-pocket health spending in 184 countries. The Lancet. 2017;389(10083):2005–2030. [DOI] [PMC free article] [PubMed] [Google Scholar]
- 28.Dieleman J, Campbell M, Chapin A, et al. Evolution and patterns of global health financing 1995–2014: development assistance for health, and government, prepaid private, and out-of-pocket health spending in 184 countries. The Lancet. 2017;389(10083):1981–2004. [DOI] [PMC free article] [PubMed] [Google Scholar]
- 29.Davis K, Stremikis K, Squires D, Schoen C. Mirror, mirror on the wall. How the performance of the US Health care system compares internationally New York: CommonWealth Fund. 2014. [Google Scholar]
- 30.Squires DA. The US health system in perspective: a comparison of twelve industrialized nations. Issue Brief (Commonwealth Fund). 2011; 16:1–14. [PubMed] [Google Scholar]
Associated Data
This section collects any data citations, data availability statements, or supplementary materials included in this article.