

Abstract
Objectives
Zenker's diverticulum is associated with reduced cricopharyngeal compliance and abnormal intrabolus pressure. However, it is unclear how the pharynx compensates for these deficits. Developments in manometric technology have improved our ability to capture pharyngeal pressure events. This study aims to describe the pharyngeal‐upper esophageal sphincter (UES) pressure profile during swallowing in patients with Zenker's diverticulum.
Methods
High‐resolution manometry was performed on 11 patients with symptomatic Zenker's diverticulum and 11 age‐ and sex‐matched healthy controls during 10 mL liquid swallowing tasks. Pharyngeal and UES pressure magnitudes, durations, and integrals were compared between patients and controls using independent t tests. Other manometric parameters, including residual UES pressure at the time of maximum tongue base pressure and pharyngeal‐UES pressure gradient, were also evaluated. A case example using three‐dimensional high‐resolution manometry is presented.
Results
Compared with healthy controls, patients with Zenker's diverticulum exhibited pressure abnormalities in the UES region. While baseline and pre‐opening maximum pressures were not different, residual pressures were elevated (P = .001). Pharyngeal‐UES pressure gradients did not differ between the two groups.
Conclusion
This study used high‐resolution manometry to characterize pharyngeal pressure dynamics in patients with Zenker's diverticulum. The changes occurring at the cricopharyngeus appear to result in persistent UES pressurization during UES opening, rather than high tonic resting pressure. Pharyngeal‐UES pressure gradients, critical to bolus passage, were also preserved in this patient population.
Level of Evidence
3b.
Keywords: manometry, upper esophageal sphincter, Zenker's diverticulum
This study uses high‐resolution manometry to describe the pharyngeal‐upper esophageal sphincter (UES) pressure profile during swallowing in patients with Zenker's diverticulum compared with healthy controls. In patients with Zenker's diverticulum, persistent UES pressurization by the cricopharyngeus during UES opening was observed, as was preservation of the pressure gradient critical to bolus passage.
1. INTRODUCTION
Zenker's diverticulum is a rare, acquired pulsion diverticulum of the posterior hypopharyngeal mucosa that manifests clinically as progressive oropharyngeal dysphagia. As the diverticulum enlarges, individuals can experience varying degrees of food regurgitation, halitosis, cough, foreign body sensation, and sensation of obstruction to bolus passage. 1 In some cases, material from the diverticulum can build up and spill into the airway, compromising swallow safety. 2 Eventually, dysphagia secondary to Zenker's diverticulum can lead to weight loss, aspiration pneumonia, and poor quality of life. 3
Conventional pharyngeal manometry, in conjunction with videofluoroscopy, has been useful in the study of this patient population to provide some insights into the pathogenesis of Zenker's diverticulum. 4 , 5 , 6 In the presence of natural pharyngeal wall weakness, structural impairment in cricopharyngeal segment opening and subsequent high hypopharyngeal intrabolus pressure cause pharyngeal wall outpouching. 5 , 7 Anatomic manifestations of aberrant muscle compliance include the detection of fibrotic and degenerative changes within the cricopharyngeal muscle fibers. 8 , 9 , 10 As it is a predominantly geriatric disease, age‐related changes in muscle and swallowing function may also be relevant. 11
Other functional abnormalities in upper esophageal sphincter (UES) physiology have been proposed as contributory factors to the pathogenesis of dysphagia in patients with Zenker's diverticulum; namely, variations in basal resting pressure, as well as coordination and extent of UES relaxation during bolus flow. 4 Although evidence of these phenomena has been inconsistent, most studies demonstrate adequate UES relaxation and either equivocal or lower baseline pressures among patients compared to healthy controls. 6 , 12 , 13
The relatively recent development of high‐resolution manometry (HRM) has resolved many technical difficulties encountered with traditional pharyngeal manometry. 4 , 14 , 15 Specifically, HRM allows for data acquisition along the length of the entire pharynx at a high spatial and temporal resolution. HRM spatiotemporal plots provide a comprehensive visual representation of multiregional pressure patterns during different stages of a swallow (Figure 1). 14 Circumferential pressure is also now incorporated within the output of standard HRM technology, and the use of more advanced three‐dimensional HRM systems allows for the preservation and analysis of radial data. 14 , 16 Accompanying technological development, evolution in the understanding of the specific asymmetric pharyngeal pressure patterns has also significantly improved the evaluation of pharyngo‐esophageal pressure pathophysiology. 17 , 18
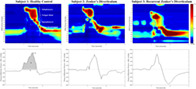
FIGURE 1.
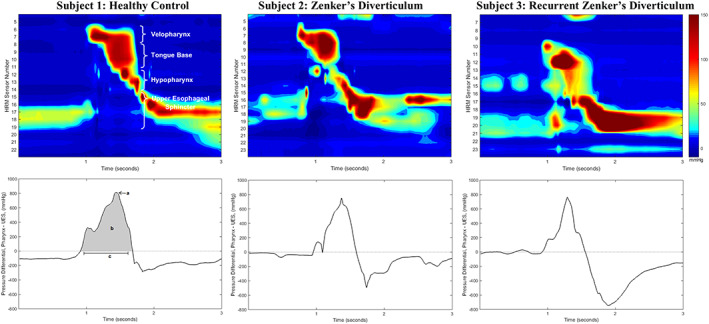
Example spatiotemporal plots (top row) and pressure gradient waveforms (bottom row) of 10 mL thin liquid swallows from three different study subjects: a healthy control, a patient with newly diagnosed 1 cm Zenker's diverticulum, and a patient with 4 cm Zenker's diverticulum recurrence. Pressure gradient waveforms are calculated as the summation of pharyngeal pressures minus upper esophageal sphincter (UES) pressures. Gradient values below 0 mm Hg illustrate low pharyngeal pressure amplitude and/or high UES pressures; values above 0 mm Hg indicate high pharyngeal and/or low UES pressures. Parameters analyzed included: A, maximum pressure gradient (mm Hg); B, pressure gradient integral (mm Hg*seconds); and C, duration of gradient above 0 mm Hg (seconds)
The aim of this study was to describe the pharyngeal swallowing pressure profile in a group of individuals with Zenker's diverticulum compared to age‐ and sex‐matched healthy controls using HRM. We hypothesized that patients with Zenker's diverticulum would exhibit elevated UES opening pressures and compensatory pharyngeal clearance pressures. A case example using 3D‐HRM in a patient with Zenker's diverticulum is also presented to describe circumferential pressure abnormalities. In doing so, our goal was to build on the understanding of the pathophysiology of dysphagia secondary to Zenker's diverticulum.
2. MATERIALS AND METHODS
All aspects of this study were approved by the University of Wisconsin‐Madison Institutional Review Board and subjects gave consent before participation. Eleven patients with a primary diagnosis of Zenker's diverticulum were included in the study (6 males, 5 females; mean ± SD age: 72 ± 15 years). Diagnosis was based on clinical documentation by the patient's otolaryngologist at the University of Wisconsin‐Madison Hospitals and Clinics (including the senior author of this manuscript). Demographic and clinical data were extracted retrospectively by members of the study team. Data from 11 age‐ and sex‐matched healthy controls (6 males, 5 females; mean ± SD age 67 ± 11 years), selected from our lab's normative HRM database, were included for comparison. Control subjects had no documented history of gastrointestinal, respiratory, or neurological pathologies.
A solid‐state, high‐resolution manometer (ManoScan360 High‐Resolution Manometry System, Medtronic, Minneapolis, Minnesota) with an outer diameter of 4.2 mm was used. Thirty‐six pressure sensors are spaced along the length and receive input from 12 circumferentially placed sectors. This yields an average pressure data set with a fidelity of 2 mm Hg. Catheter calibration was completed before each use, as per manufacturer's instructions, to record pressures between −20 and 600 mm Hg, at a sampling rate of 50 Hz. All participants were asked to withhold from eating for 4 hours and drinking for 2 hours prior to taking part in the study to minimize the effects of satiety. To lubricate the catheter and anesthetize the nasal cavity, less than 1 mL of topical 2% viscous lidocaine hydrochloride was coated onto both the outer surface of the catheter and internal naris before instrumentation. The catheter was then inserted transnasally until its distal aspect was positioned past the UES high‐pressure zone. Difficulty in manometric instrumentation in patients with Zenker's diverticulum has been reported, due to catheter coiling in the pouch. 4 , 19 , 20 In two study subjects, failure to capture the high‐pressure zone of the UES due to large diverticulum precluded inclusion of UES regional pressure measures in analysis. After insertion, subjects were allowed approximately 5 minutes to adjust to the catheter before completion of 2 or 3 cued swallows with a 10 mL thin liquid bolus as tolerated. Boluses were delivered to the oral cavity via syringe, with the head held in a neutral position. Participants were then cued to swallow and pressures were recorded.
An automated analysis program 21 , 22 and customized Matlab program (Mathworks Inc., Natick, Massachusetts) 23 were used to analyze pharyngeal pressure parameters. Regions of interest were defined using recognized characteristics of manometric traces described previously 16 , 24 , 25 (Figure 1). The velopharynx region includes the two or three most superior sensors with bimodal, swallowing‐related pressure waveforms. The tongue base region is identified as a unimodal pressure wave initiated after the more rostral velopharynx, and prior to the hypopharyngeal clearance wave. Hypopharyngeal pressure waves are particularly complex in shape, with a single clearance wave and other inconsistent smaller intrabolus and postswallow pressure waves. 18 In each of these regions, three variables were calculated (maximum pressure, duration of pressure activity above baseline, and pressure integral). 16
The unique pressure behavior generated within the UES region is captured by sensors directly inferior to the hypopharynx. 15 UES residual pressure, measured at the time point of maximum tongue base pressure, was extracted as a measure of downstream resistance during pharyngeal contraction. 26 Mean preswallow baseline pressure, captures UES resting pressure over a one‐second interval, 2 seconds before pre‐opening maximum pressure. 23 The following previously described UES regional parameters were also evaluated: maximum pre‐opening pressure, maximum postclosure pressure, nadir pressure (averaged over 0.25 seconds), and nadir pressure duration. 16 , 23 , 25
Global swallow parameters, including total swallow duration, calculated between onset of velopharyngeal pressure and maximum postclosure UES pressure, as well as pharyngeal contractile integral, the summation of velopharyngeal, tongue base, and hypopharyngeal pressure integrals, were analyzed. 23 , 27 Measurements of swallowing pressure gradient, or the pressure differential between the pharyngeal and UES regions, were also calculated for each swallow by subtracting UES pressures from summated velopharyngeal, tongue base and hypopharyngeal pressures (Figure 1). Specific gradient variables included (a) maximum pressure gradient, or the magnitude of pressure difference above zero mm Hg; (b) integral of pressure gradient, an estimation of overall difference above 0 mm Hg during a swallow; and (c) duration of pressure gradient above 0 mm Hg, a measure of the time duration over which bolus propulsion is favored. These measurements illustrate relative differences in contraction vs distension forces during a swallow and may be important in ensuring swallowing coordination and efficiency. 23
IBM SPSS Statistics Version 23 was used for all statistical analyses. Data are presented as mean ± SE, unless otherwise stated. Independent sample t tests were used to compare pressure variables between age‐ and sex‐matched patients with Zenker's diverticulum and healthy controls. Bonferroni correction was used to account for multiple comparisons, therefore an α = .0025 (.05/20 comparisons) was used to define significance. To determine if disease recurrence affected pressure parameters in this small study population, parameters were compared between new and recurrent cases using independent t tests. Cohen's effect sizes were also calculated, with a large effect size defined as d = 0.8. 28
2.1. Case example: 3D‐HRM in a patient with Zenker's diverticulum
A 63‐year‐old male with a primary diagnosis of Zenker's diverticulum and a three‐year history of progressive dysphagia to solid foods underwent manometry with a 3D‐HRM catheter to evaluate circumferential pressure patterns generated in the pharynx and UES. The purpose of including this single patient example is that 3D‐HRM offers additional information beyond that which is obtained with typical HRM, but is not yet widely available. Past medical history was negative for other gastrointestinal, respiratory, or neurological disease, as well as any previous surgical or radiation procedures to the head and neck. Physical examination was unremarkable. Videofluoroscopy revealed cricopharyngeal prominence and an approximately 2 cm Zenker's diverticulum. Adequate velopharyngeal closure and tongue base retraction were exhibited on video swallow evaluation, with evidence of piriform sinus stasis.
A solid state, 4.2 mm diameter Manoscan 3D‐HRM manometer (Given Imaging, Deluth, Georgia) was calibrated prior to use, as per manufacturer's recommendations. This catheter has 44 pressure sensors in total, 12 of which record 3D pressure data from eight radial pressure sectors placed at 45° increments. 17 , 18 Concurrent continuous videofluoroscopy was captured in the lateral plane (OEC 9000, General Electric, Fairfield, Connecticut) to assist in catheter placement and positioning and correlate sensor position with manometric data. Video recordings were taken at 30 frames per second on a DVD + RW for offline analysis (DVO‐1000MD, Sony Park Ridge, New Jersey). Procedural steps for catheter insertion were as described previously. Swallows of 10 mL thin liquid barium boluses (Varibar, Bracco Diagnostics, Monroe Township, New Jersey) with the head held in a neutral position were performed to measure circumferential pressure patterns within the tongue base, hypopharynx and UES regions. Due to the limited length of the 3D section of the catheter, it was not possible to simultaneously evaluate the velopharynx with these specialized sensors; velopharynx pressure data were thus captured with circumferentially averaged HRM sensors as described above.
3. RESULTS
Based on Morton‐Bartney's classification, 29 diverticulum sizes included 4 small, 2 medium, and 5 large (range:1‐6 cm). Dysphagia severity on videofluoroscopy was represented by a seven‐point dysphagia severity rating scale based upon the American Speech‐Language Hearing (ASHA) Functional Communication Measure for Swallowing 30 and in this patient population ranged from mild to moderate (two not documented). All patients reported consuming an oral diet on presentation. Four patients had undergone previous surgery for a Zenker's diverticulum years prior to this presentation and had developed recurrence (2 with endoscopic stapling, 1 with endoscopic diverticulotomy and myotomy, and 1 with transcervical diverticulotomy and myotomy followed by endoscopic stapling 9 years later). Date of last surgical procedure ranged from 2 to 9 years prior to presentation, and recurrent diverticulum varied in size from small to large.
Summary data for pressure and duration parameters are presented in Table 1. Scatter plots for pharyngeal, UES, and global pressures are provided in Figures 2, 3, 4, respectively. No differences were found between patients with Zenker's diverticulum and healthy controls for velopharyngeal, tongue base, and hypopharyngeal parameters.
TABLE 1.
Summary statistics for swallowing pressure parameters during 10 mL swallowing tasks for healthy controls and patients with Zenker's diverticulum
| REGION | PARAMETER | Controls (n = 11) | Zenker's diverticulum | P value | |||
|---|---|---|---|---|---|---|---|
| All (n = 11) | <2 cm (n = 4) | 2–4 cm (n = 2) | >4 cm (n = 5) | ||||
| Velopharynx | Maximum pressure (mm Hg) | 213 ± 24 | 245 ± 27 | 206 ± 6 | 330 ± 83 | 236 ± 40 | >.05 |
| Duration above baseline (s) | .84 ± .06 | .77 ± .09 | .71 ± .05 | 1.13 ± .41 | .68 ± .07 | >.05 | |
| Integral pressure (mm Hg*s) | 173 ± 20 | 196 ± 36 | 144 ± 26 | 410 ± 34 | 151 ± 29 | >.05 | |
| Tongue base | Maximum pressure (mm Hg) | 135 ± 8 | 140 ± 12 | 153 ± 14 | 180 ± 8 | 120 ± 16 | >.05 |
| Duration above baseline (s) | .48 ± .03 | .50 ± .03 | .50 ± .10 | .53 ± .06 | .49 ± .04 | >.05 | |
| Integral pressure (mm Hg*s) | 93 ± 11 | 106 ± 12 | 103 ± 13 | 112 ± 19 | 112 ± 19 | >.05 | |
| Hypopharynx | Maximum pressure (mm Hg) | 197 ± 22 | 234 ± 33 | 224 ± 46 | 378 ± 90 | 190 ± 34 | >.05 |
| Duration above baseline (s) | .39 ± .04 | .43 ± .03 | .39 ± .22 | .38 ± .01 | .46 ± .04 | >.05 | |
| Integral pressure (mm Hg*s) | 70 ± 11 | 86 ± 12 | 80 ± 40 | 116 ± 22 | 78 ± 8 | >.05 | |
| Upper Esophageal sphincter | Residual Pressure (mm Hg) | 15 ± 2 | 40 ± 6 | 44 ± 13 | 41 ± 6 | 37 ± 9 | .001* |
| Pre‐opening maximum (mm Hg) | 145 ± 20 | 120 ± 22 | 140 ± 39 | 62 ± 1.5 | 134 ± 36 | >.05 | |
| Postclosure maximum (mm Hg) | 301 ± 24 | 328 ± 48 | 282 ± 61 | 303 ± 60 | 302 ± 60 | >.05 | |
| Nadir pressure—0.25 s (mm Hg) | 10 ± 2 | 10 ± 2 | 8 ± .8 | 14 ± 11 | 10 ± 3 | >.05 | |
| Nadir duration (s) | .53 ± .04 | .49 ± .03 | .51 ± .03 | .52 ± .14 | .46 ± .06 | >.05 | |
| Baseline pressure (mm Hg) | 62 ± 17 | 35 ± 5 | 36 ± 12 | 35 ± 10 | 34 ± 9 | >.05 | |
| Global parameters | Swallow duration | .94 ± .06 | .87 ± .08 | .76 ± .04 | 1.13 ± .35 | .82 ± .07 | >.05 |
| Pharyngeal integral | 307 ± 22 | 410 ± 52 | 340 ± 57 | 656 ± 21 | 339 ± 37 | >.05 | |
| Maximum gradient (mm Hg) | 678 ± 55 | 846 ± 91 | 780 ± 113 | 1145 ± 322 | 746 ± 82 | >.05 | |
| Integral gradient (mm Hg*s) | 25 187 ± 2988 | 30 496 ± 4833 | 23 367 ± 7634 | 51 900 ± 6066 | 25 140 ± 2504 | >.05 | |
| Duration above 0 mm Hg (s) | .79 ± .06 | 1.24 ± .28 | .67 ± .06 | 1.13 ± .27 | 1.71 ± .54 | >.05 | |
Note: All data reported as mean ± SE. Manometric data for subjects with Zenker's diverticulum are presented as an average of all Zenker's diverticulum subjects, as well as values differentiated by size of diverticulum. Results of independent t tests for each variable between controls and all patients with Zenker's diverticulum are reported with corresponding P values (highlighted). Significance was determined (*) if P ≤ .0025 (0.05/20).
Abbreviations: s, seconds; UES, upper esophageal sphincter.
FIGURE 2.
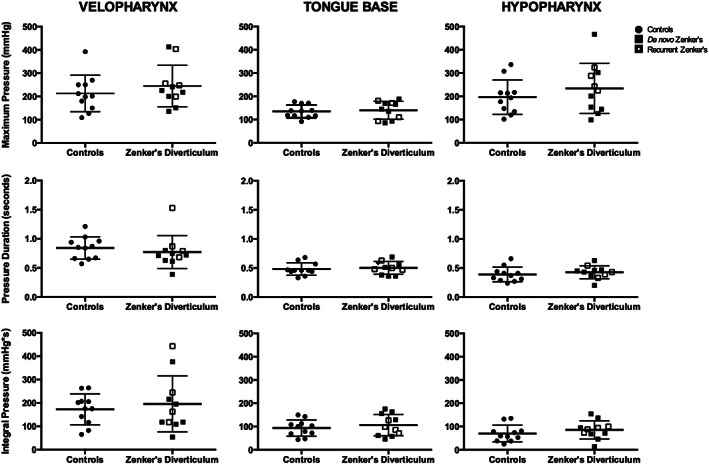
Velopharyngeal, tongue base, and hypopharyngeal pressure parameters. Column scatter plots summarize differences in maximum pressure, pressure duration, and pressure integral between controls and patients with Zenker's diverticulum in the three pharyngeal regions: velopharynx, tongue base, and hypopharynx. No significant differences were identified between controls and patients with Zenker's diverticulum. Patient's with de‐novo and recurrent Zenker's diverticulum illustrated by filled vs partially filled squares, respectively. Horizontal lines specify mean values and SD
FIGURE 3.
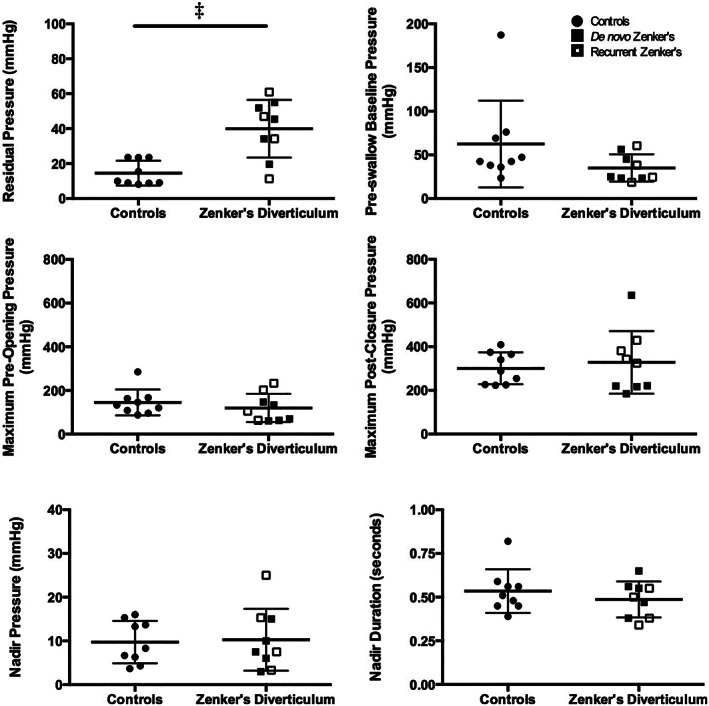
Upper esophageal sphincter pressure parameters. Column scatter plots illustrate comparisons of UES residual pressure at the time point of tongue base maximum pressure, preswallow baseline pressure, maximum preswallow and postswallow pressures, nadir pressure over 0.25 seconds, and nadir duration, between controls and patients with Zenker's diverticulum in the upper esophageal sphincter (UES) region. Differences were identified in residual pressure at the time point of tongue base maximum pressure between the two groups. Patient's with de‐novo and recurrent Zenker's diverticulum illustrated by filled vs partially filled squares, respectively. Horizontal lines specify mean values and SD. ‡ P ≤ .001
FIGURE 4.
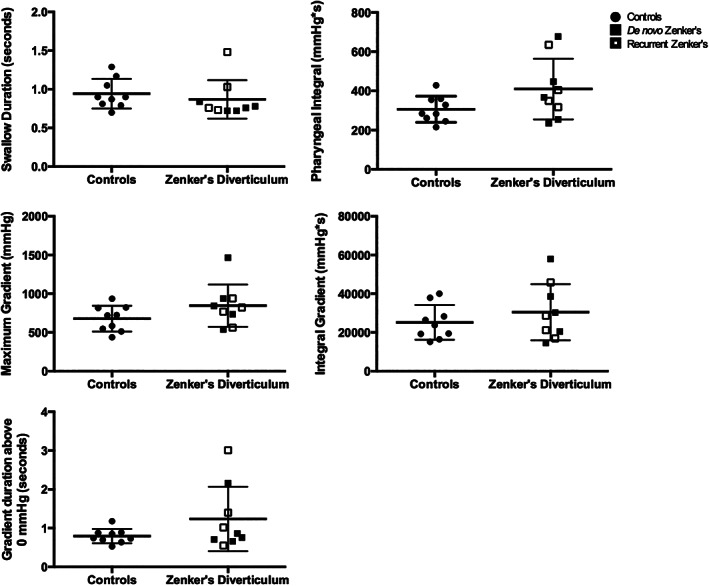
Global swallowing pressure parameters. Column scatter plots summarize the lack of overall differences in global pressure parameters between controls and patients with Zenker's diverticulum, specifically in swallow duration, pharyngeal integral, maximum pressure gradient, integral pressure gradient, and duration of gradient above 0 mm Hg. Patient's with de‐novo and recurrent Zenker's diverticulum illustrated by filled vs partially filled squares, respectively. Horizontal lines specify mean values and SD
Findings at the UES were of greater interest. First, there was no significant difference in baseline pressure between controls and patients with Zenker's diverticulum. While there was no difference in pre‐opening or postclosure maximum pressure, residual pressure was higher in patients with Zenker's diverticulum compared to controls (t (11) = 4.241, P = .001; Cohen's d = 2.0). No significant differences between patients with Zenker's diverticulum and healthy controls were found for total swallow duration, pharyngeal integral, or pressure gradient parameters. Finally, patients with recurrent Zenker's diverticulum exhibited pressure profiles not significantly different from those with de novo disease.
In the case using 3D‐HRM, assessment of spatiotemporal plots created from circumferentially averaged data suggested adequate pharyngeal clearance pressurization (Figure 5). Evidence of slightly elevated UES intrabolus pressure was present. Circumferential pressure waveforms in the tongue base were composed of typical unimodal pressure waves in all directions, with similar pressure distribution compared to healthy controls. 18 Similarly, the pattern of hypopharyngeal pressure asymmetry was as previously reported, 18 with higher anterior‐posterior compared to lateral pressures. In the UES, nadir pressures normally exhibit some circumferential asymmetry with higher anterior‐posterior pressures. 17 However, in this case, individual radial pressure waves during UES opening depicted abnormally pronounced posterior contributions to circumferential opening pressures. Post‐opening pressures were also largely posterior‐based. This correlates to posterior cricopharyngeal impression visualized on videofluoroscopic imaging, and discounts symmetric circumferential UES dysfunction in this case.
FIGURE 5.
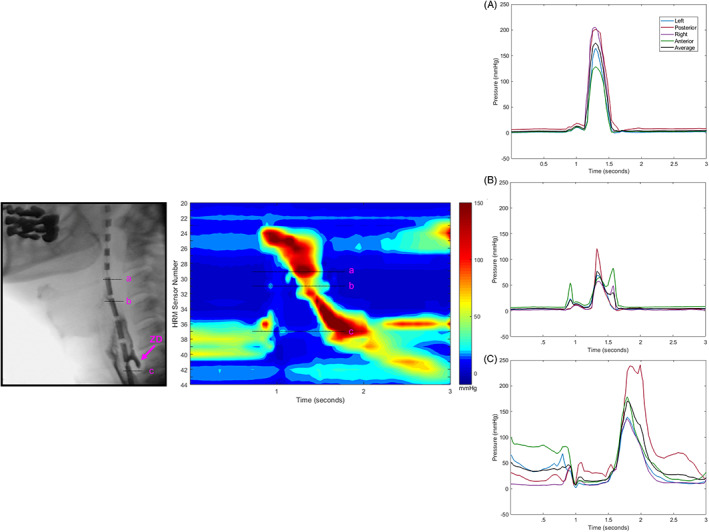
Application of three‐dimensional high‐resolution manometry (3D‐HRM) in a patient with Zenker's diverticulum. Lateral videofluoroscopy still frame and a spatiotemporal plot of a 10 mL bolus swallow is illustrated, with radial pressure traces from individual sensor levels in, A, the tongue base region; B, the hypopharynx; and C, the caudal upper esophageal sphincter (UES) region. Each sensor generates an output of eight individual radial pressure traces, which are collapsed into four regions by pairs: left‐lateral, posterior, right‐lateral, and anterior. The circumferential average is calculated to allow for comparison of directions to standard HRM pressure traces. Abnormally high posterior pressures are illustrated within UES nadir pressures. ZD, Zenker's diverticulum
4. DISCUSSION
When swallowing 10 mL of thin liquid, this group of patients with Zenker's diverticulum produced comparable pharyngeal clearance pressures to healthy controls, indicating the capacity of the pharynx to generate adequate driving forces above the level of the incompletely opening UES and weak hypopharynx. Importantly, the finding of adequate pharyngeal functioning validates the rejection of weakness in pharyngeal pressure generation as a contributory factor to dysphagia in our study group. Two patients exhibited notably higher velopharyngeal regional pressure measures, with slightly elevated hypopharyngeal pressures, compared to controls. Although this was not observed uniformly across all patients, we hypothesize that high pharyngeal pressures in these individuals may signify an intrinsic compensatory propulsive force, as seen in other situations that stress the system, 16 to direct a bolus both out of the hypopharyngeal diverticulum and through a poorly compliant cricopharyngeus. One limitation to evaluating compensatory pressure may be bolus pressurization, limiting the ability to differentiate between contact and intrabolus pressure. Future study should use simultaneous videofluoroscopy and HRM with impedance, and correlate imaging analyses with pressure data to look specifically at pharyngeal compensatory responses to different UES pathologies.
The primary treatment modality to improve swallowing function in patients with Zenker's diverticulum is surgery. 11 , 31 Procedures are often completed in symptomatic patients after years of slow diverticular growth, with the goal of eliminating diverticular bolus retention, as well as improving bolus flow and relieving outflow obstruction. 11 In the context of relatively normal underlying pharyngeal function above the cricopharyngeus, as demonstrated in this study, it is unsurprising that excellent rates of symptom resolution following cricopharyngeal myotomy in this patient population are reported. 32 Future investigation of pharyngeal contractile HRM pressures as a predictor of successful outcomes following myotomy may be useful.
Overall, patients in this study demonstrated adequate cricopharyngeal relaxation and similar preswallow pressures compared to controls, which supports previous work using conventional manometry. 5 , 6 Additional evaluation of UES manometric pressures revealed inconsistent degrees of outflow obstruction between patients, with subtle areas of high pressurization appreciated in the UES region on spatiotemporal plots during opening (Figure 1). Abnormalities in UES opening pressures were most consistently observed within residual pressure measures, with higher pressures exhibited by patients as compared to controls. This variation in pressure likely depicts a state of abnormal UES opening, in combination with the presence of differing extents of cricopharyngeal prominence which may or may not be found in these patients. Furthermore, this finding validates the use of multiple UES opening metrics in addition to nadir pressure, which was not significantly different than healthy controls in the present study. Interestingly, no differences were seen in UES baseline or relaxation pressures between de novo patients and those with previous surgery.
In the healthy swallower, bolus movement occurs from areas of high pressure to low pressure. 24 Patients with Zenker's diverticulum demonstrated relatively normal pressure gradients. Thus, compensatory changes in pressure at the velopharynx, tongue base, and rostral hypopharynx promote bolus passage past the incompletely relaxed cricopharyngeus. This may also predispose to diverticulum development.
Important limitations of this study include the small sample size and the heterogeneity of the patient group, which included mild and moderate sized de novo diverticulum and patients with recurrent disease. In the future, with a larger sample size, correlation of pharyngeal pressure changes with diverticulum size may elicit additional information about the progression of compensatory and UES pressure changes over time in this patient population. Additionally, while patients included in the study complained of dysphagia symptomatology, they all maintained an oral diet with mild to moderate clinical swallowing impairment and had relatively small diverticula. This was due to patient recruitment, as well as practical difficulty in bypassing very large diverticula with an HRM catheter. As such, our findings may not relate to those who have had a long‐term presence of a large diverticulum who may exhibit a reduction in pharyngeal contractility. Future studies should also consider evaluation of multiple bolus consistencies and volumes, especially those that may challenge the system and reveal additional functional differences.
5. CONCLUSION
In this study, we applied HRM to a group of patients with Zenker's diverticulum who, overall, exhibited intact pharyngeal contractility. Pressure gradients were preserved, regardless of diverticulum size, suggesting that pharyngeal weakness is not a contributory factor to dysphagia in the early stages of diverticulum development. Patients in this study also exhibited increased UES residual pressure without any increase in baseline pressure, thus reflecting restricted cricopharyngeal opening rather than a tonically hypercontracted cricopharyngeus.
CONFLICT OF INTEREST
The authors have no conflicts of interest to declare.
MEETING INFORMATION
Annual Meeting of the ABEA, Combined Otolaryngology Spring Meetings, National Harbor, MD, April 19th, 2018.
ACKNOWLEDGMENTS
We would like to thank Suzan Abdelhalim, MD, for her assistance in data collection and Glen Leverson, PhD, biostatistician, for his consultation on statistical analysis. We would also like to acknowledge the clinical speech language pathologists at the University of Wisconsin‐Madison Voice and Swallow Clinic, Madison, Wisconsin (Jodi Hernandez, MS, CCC‐SLP, BCS‐S, Jamie Mayer, CCC‐SLP, Stevie Marvin, CCC‐SLP, BCS‐S; Kathleen Huber MS, CCC‐SLP; and Rachael Kammer, MS, CCC‐SLP) for their assistance in manometric data collection of the Zenker's diverticulum patient population. This study and its authors were supported by the National Institutes of Health grants R33 DC011130, T32 DC009401 (S.P.R), and T32 GM007507 (C.A.J).
Rosen SP, Jones CA, Hoffman MR, Knigge MA, McCulloch TM. Pressure abnormalities in patients with Zenker's diverticulum using pharyngeal high‐resolution manometry. Laryngoscope Investigative Otolaryngology. 2020;5:708–717. 10.1002/lio2.434
Funding information NIH Clinical Center, Grant/Award Numbers: R33 DC011130, T32 DC009401, T32 GM007507
BIBLIOGRAPHY
- 1. Dissard A, Gilain L, Pastourel R, Mom T, Saroul N. Functional results in endoscopic Zenker's diverticulum surgery. Eur Ann Otorhinolaryngol Head Neck Dis. 2017;134(5):309‐313. [DOI] [PubMed] [Google Scholar]
- 2. Siddiq MA, Sood S, Strachan D. Pharyngeal pouch (Zenker's diverticulum). Postgrad Med J. 2001;77(910):506‐511. [DOI] [PMC free article] [PubMed] [Google Scholar]
- 3. Cook IJ. Clinical disorders of the upper esophageal sphincter. GI Motility online 2006. https://www.nature.com/gimo/contents/pt1/full/gimo37.html.
- 4. Fulp SR, Castell DO. Manometric aspects of Zenker's diverticulum. Hepatogastroenterology. 1992;39(2):123‐126. [PubMed] [Google Scholar]
- 5. Cook IJ, Gabb M, Panagopoulos V, et al. Pharyngeal (Zenkers) diverticulum is a disorder of upper esophageal sphincter opening. Gastroenterology. 1992;103(4):1229‐1235. [DOI] [PubMed] [Google Scholar]
- 6. Knuff TE, Benjamin SB, Castell DO. Pharyngoesophageal (Zenker's) diverticulum: a reappraisal. Gastroenterology. 1982;82(4):734‐736. [PubMed] [Google Scholar]
- 7. Zaninotto G, Costantini M, Boccu C, et al. Functional and morphological study of the cricopharyngeal muscle in patients with Zenker's diverticulum. Br J Surg. 1996;83(9):1263‐1267. [PubMed] [Google Scholar]
- 8. Cook IJ, Jamieson GG, Blumberg P, Shaw D, Dent J. Pathogenesis and treatment of Zencker's diverticulum. Chir Mem Acad Chir. 1990;116(8–9):673‐678. [PubMed] [Google Scholar]
- 9. Venturi M, Bonavina L, Colombo L, et al. Biochemical markers of upper esophageal sphincter compliance in patients with Zenker's diverticulum. J Surg Res. 1997;70(1):46‐48. [DOI] [PubMed] [Google Scholar]
- 10. Cook IJ, Blumbergs P, Cash K, Jamieson GG, Shearman DJ. Structural abnormalities of the cricopharyngeus muscle in patients with pharyngeal (Zenker's) diverticulum. J Gastroenterol Hepatol. 1992;7(6):556‐562. [DOI] [PubMed] [Google Scholar]
- 11. Martino R, McCulloch T. Therapeutic intervention in oropharyngeal dysphagia. Nat Rev Gastroenterol Hepatol. 2016;13(11):665‐679. [DOI] [PubMed] [Google Scholar]
- 12. Cook IJ, Blumbergs P, Cash K, Jamieson GG, Shearman DJ. Structural abnormalities of the cricopharyngeus muscle in patients with pharyngeal (Zenkers) diverticulum. J Gastroenterol Hepatol. 1992;7(6):556‐562. [DOI] [PubMed] [Google Scholar]
- 13. Frieling T, Berges W, Lubke HJ, Enck P, Wienbeck M. Upper esophageal sphincter function in patients with Zenker's diverticulum. Dysphagia. 1988;3(2):90‐92. [DOI] [PubMed] [Google Scholar]
- 14. Fox MR, Bredenoord AJ. Oesophageal high‐resolution manometry: moving from research into clinical practice. Gut. 2008;57(3):405‐423. [DOI] [PubMed] [Google Scholar]
- 15. Jones CA, Ciucci MR, Hammer MJ, McCulloch TM. A multisensor approach to improve manometric analysis of the upper esophageal sphincter. Laryngoscope. 2016;126(3):657‐664. [DOI] [PMC free article] [PubMed] [Google Scholar]
- 16. Hoffman MR, Mielens JD, Ciucci MR, Jones CA, Jiang JJ, McCulloch TM. High‐resolution manometry of pharyngeal swallow pressure events associated with effortful swallow and the Mendelsohn maneuver. Dysphagia. 2012;27(3):418‐426. [DOI] [PMC free article] [PubMed] [Google Scholar]
- 17. Meyer JP, Jones CA, Walczak CC, McCulloch TM. Three‐dimensional manometry of the upper esophageal sphincter in swallowing and nonswallowing tasks. Laryngoscope. 2016;126(11):2539‐2545. [DOI] [PMC free article] [PubMed] [Google Scholar]
- 18. Rosen SP, Jones CA, McCulloch TM. Pharyngeal swallowing pressures in the base‐of‐tongue and hypopharynx regions identified with three‐dimensional manometry. Laryngoscope. 2017;127(9):1989‐1995. [DOI] [PMC free article] [PubMed] [Google Scholar]
- 19. Ellis FH Jr, Schlegel JF, Lynch VP, Payne WS. Cricopharyngeal myotomy for pharyngo‐esophageal diverticulum. Ann Surg. 1969;170(3):340‐349. [DOI] [PMC free article] [PubMed] [Google Scholar]
- 20. Kodicek J, Creamer B. A study of pharyngeal pouches. J Laryngol Otol. 1961;75:406‐411. [DOI] [PubMed] [Google Scholar]
- 21. Geng ZX, Hoffman MR, Jones CA, McCulloch TM, Jiang JJ. Three‐dimensional analysis of pharyngeal high‐resolution manometry data. Laryngoscope. 2013;123(7):1746‐1753. [DOI] [PMC free article] [PubMed] [Google Scholar]
- 22. Jones CA, Hoffman MR, Geng Z, Abdelhalim SM, Jiang JJ, McCulloch TM. Reliability of an automated high‐resolution manometry analysis program across expert users, novice users, and speech‐language pathologists. J Speech Lang Hear Res: JSLHR. 2014;57(3):831‐836. [DOI] [PMC free article] [PubMed] [Google Scholar]
- 23. Rosen SP, Abdelhalim SM, Jones CA, McCulloch TM. Effect of body position on pharyngeal swallowing pressures using high‐resolution manometry. Dysphagia. 2018;33(3):389‐398. [DOI] [PMC free article] [PubMed] [Google Scholar]
- 24. Walczak CC, Jones CA, McCulloch TM. Pharyngeal pressure and timing during bolus transit. Dysphagia. 2016;31(1):104‐114. [DOI] [PMC free article] [PubMed] [Google Scholar]
- 25. Nativ‐Zeltzer N, Logemann JA, Zecker SG, Kahrilas PJ. Pressure topography metrics for high‐resolution pharyngeal‐esophageal manofluorography‐a normative study of younger and older adults. Neurogastroenterol Motil: Off J Eur Gastrointest Motil Soc. 2016;28(5):721‐731. [DOI] [PMC free article] [PubMed] [Google Scholar]
- 26. Jones C, Abdelhalim S, McCulloch T. Relationships between upper esophageal sphincter opening and nadir pressures in patients with dysphagia and healthy controls. 7th European Society for Swallowing Disorders Congress; 2017; Barcelona, Spain.
- 27. O'Rourke A, Humphries K, Lazar A, Martin‐Harris B. The pharyngeal contractile integral is a useful indicator of pharyngeal swallowing impairment. Neurogastroenterol Motil: Off J Eur Gastrointest Motil Soc. 2017;29(12):e13144 10.1111/nmo.13144. [DOI] [PMC free article] [PubMed] [Google Scholar]
- 28. Lakens D. Calculating and reporting effect sizes to facilitate cumulative science: a practical primer for t‐tests and ANOVAs. Front Psychol. 2013;4:863. [DOI] [PMC free article] [PubMed] [Google Scholar]
- 29. Morton RP, Bartley JR. Inversion of Zenker's diverticulum: the preferred option. Head Neck. 1993;15(3):253‐256. [DOI] [PubMed] [Google Scholar]
- 30. National Outcomes Measurement System (NOMS) . Adult Speech‐Language Pathology User's Guide. Rockville, MD: American Speech‐Language‐Hearing Association; 2003. [Google Scholar]
- 31. Johnson CM, Postma GN. Zenker diverticulum—which surgical approach is superior? JAMA Otolaryngol–Head Neck Surg. 2016;142(4):401‐403. [DOI] [PubMed] [Google Scholar]
- 32. Crescenzo DG, Trastek VF, Allen MS, Deschamps C, Pairolero PC. Zenker's diverticulum in the elderly: is operation justified? Ann Thorac Surg. 1998;66(2):347‐350. [DOI] [PubMed] [Google Scholar]