Abstract
Quantifying the effect of vital resources on transcription (TX) and translation (TL) helps to understand the degree to which the concentration of each resource must be regulated for achieving homeostasis. Utilizing the synthetic TX-TL system, we study the impact of nucleotide triphosphates (NTPs) and magnesium (Mg2+) on gene expression. Recent observations of the counter-intuitive phenomenon of suppression of gene expression at high NTP concentrations have led to the speculation that such suppression is due to the consumption of resources by TX, hence leaving fewer resources for TL. In this work, we investigate an alternative hypothesis: direct suppression of the TL rate via stoichiometric mismatch in necessary reagents. We observe NTP-dependent suppression even in the early phase of gene expression, contradicting the resource-limitation argument. To further decouple the contributions of TX and TL, we performed gene expression experiments with purified messenger RNA (mRNA). Simultaneously monitoring mRNA and protein abundances allowed us to extract a time-dependent translation rate. Measuring TL rates for different Mg2+ and NTP concentrations, we observe a complex resource dependence. We demonstrate that TL is the rate-limiting process that is directly inhibited by high NTP concentrations. Additional Mg2+ can partially reverse this inhibition. In several experiments, we observe two maxima of the TL rate viewed as a function of both Mg2+ and NTP concentration, which can be explained in terms of an NTP-independent effect on the ribosome complex and an NTP-Mg2+ titration effect. The non-trivial compensatory effects of abundance of different vital resources signal the presence of complex regulatory mechanisms to achieve optimal gene expression.
Keywords: cell-free systems, in vitro synthetic biology, RNA aptamer, translation rate, homeostasis
1. Introduction
Escherichia coli cell-free transcription–translation (TX-TL) systems (1–7) provide promising tools for characterizing genetic networks in a minimally complex environment and have been proposed as a technique for large-scale industrial synthesis of bioproducts ranging from synthetic fuels to drugs (8). As a design tool, this technique allows biological engineers to explore genetic circuits in an analogous way to that in which electrical engineers use breadboards to understand electronic circuits. From a fundamental biology standpoint, the greater control provided over experimental conditions allows one to obtain a quantitative understanding of gene expression dynamics.
The experimental conditions in the TX-TL expression system must be precisely calibrated for optimal expression. Not only do various ion concentrations need to be accurately prescribed but even resources such as nucleotide triphosphates (NTPs) have to be optimized carefully for significant expression to occur. Our understanding of the resource requirements of gene expression is challenged by the observation that gene expression decreases with NTP concentration, once NTP is increased beyond a certain threshold (9). This phenomenon is unexpected, because higher amounts of NTPs imply a greater source of energy available for TX and TL. Siegal-Gaskins et al. (9) speculate that increased NTP levels enhance transcriptional activity and thus exhaust most of the present NTPs. As a result, very little resources remain for TL to proceed, explaining the reduction of gene expression. In our investigations, we contrast this hypothesis with a simpler explanation involving a direct suppression of gene expression, specifically that of the translation rate as a function of the overabundance of certain reagents.
In our system, which has no significant protein degradation mechanism, conversion of adenosine triphosphate (ATP) to adenosine diphosphate (ADP) and the subsequent rise of ADP/ATP ratio (10) slow down protein production rates. A few hours into the experiment, this slowdown causes protein levels to saturate. Analyzing the gene expression profile thus requires us to be cognizant of the temporal dependence of TX and, particularly, TL rates. We have developed methods of extracting such time-dependent rates.
One could reasonably believe that at times prior to saturation, resource limitation is peripheral to the underlying dynamics of gene expression. Therefore, monitoring the protein and RNA levels at early times as a function of NTP and other reagents allows us to differentiate protein level suppression at high NTP concentrations. In general, we will use this experimental strategy to explore the landscape of resource dependence in the TX-TL system.
2. Materials and methods
2.1 Cell-free reaction conditions
Crude extract was prepared from BL21-Rosetta 2 strain, following the protocol of Sun et al. (6). Basic cell-free reactions consist of a crude cell extract from E. coli (which contains endogenous TX-TL machinery, mRNA and protein degradation enzymes plus all the soluble proteins), buffer and DNA. The amino acid mix was prepared following the protocol from (11). All the experiments shown here were performed using the same batch of extract preparation to avoid variation between different batches. Reactions were carried out in a 10- µl volume using 1–2 nM plasmid, 10–20 µM malachite green (MG) to simultaneously monitor the RNA production. The reaction temperature was set to 29°C. Experiments were run for 14–20 h with readings taken every 20 min, so that green fluorescent protein (GFP) and RNA expression dynamics could be monitored over a long period of time.
2.2 Monitoring RNA production
Messenger RNA production was monitored using a plasmid provided by Dr. Murray’s lab, which consists of a 35-bp (MGapt) aptamer sequence incorporated in the 3′ untranslated region of the fluorescent protein reporter gene, 15 bases downstream of the stop codon and capable of binding the dye MG and produces fluorescence signal that can be measured at 650 nm wavelength. Fluorescence measurements were made in a total of six wells for each condition in a Biotek plate reader at 20-min intervals using excitation/emission wavelengths set at 610/650 nm (MGapt) and 485/525 nm (deGFP). Error bars indicate standard error over six replicates. The reported protein production at each time point represents a 20-min time interval.
2.3 Plasmids and bacterial strains
Plasmids used in our study are pBEST-Pr-GFP-MG (Addgene name Pr-deGFP-MGapt, Addgene plasmid #67734) for protein and mRNA measurement, and pIVEX-pT7-GFP-MG (Addgene name PT7-deGFP-MGapt, Addgene plasmid #67741) for mRNA preparation. These plasmids are described in (9). More information on these and links to their sequence and other info are given in the Supplementary Table S1. Plasmids were a kind gift from Dr. Murray’s lab. BL21-Rosetta 2 strain for making crude extract was obtained from Novagen. Plasmid DNAs used for measuring protein and mRNA production were prepared using Qiagen Plasmid Midi prep kits.
2.4 mRNA preparation
First polymerase chain reaction (PCR) was performed on pIVEX2.3 PT7-deGFP-MGapt plasmid using T7 promoter and T7 terminator primers obtained from IDT. The linear PCR was used as starting material for setting up TX reactions using T7 RNA polymerase (Cellscript).
3. Results and discussion
We begin by examining the time-dependent gene expression profiles for increasing NTP concentrations. We use a plasmid described in Siegal-Gaskins et al. (9) with a built-in RNA aptamer (35-bp MGapt sequence), which contains a binding pocket for MG dye and a fluorescent protein for accomplishing the simultaneous measurement of mRNA and protein. The result of a typical experiment is shown in Figure 1.
Figure 1.
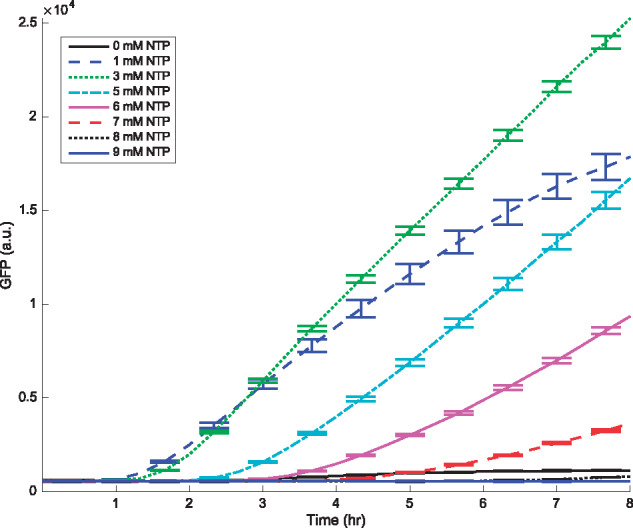
Translation kinetics demonstrating the GFP protein production for various NTP concentrations with DNA as the starting material. Data are measured every 20 min, while error bars, denoting the standard error of the mean, are plotted for every other data point for clarity. Mean and standard error are calculated over six replicates. Concentrations of Mg2+ and K+ are 18 mM and 91 mM, respectively.
Figure 1 shows the time evolution of protein production as measured by GFP fluorescence for various NTP concentrations. We illustrate only the initial 8 h of the experiment, prior to saturation. Notice that protein production at early times is suppressed by increasing the amounts of NTP. This observation conflicts with the hypothesis that resource limitation is driven by high transcriptional activity causing lower protein production. However, to further understand the roles of TX and of TL, we proceeded to perform the experiments with the process of TX eliminated. We describe these experiments subsequently.
We purified the mRNA from the plasmid mentioned earlier. Similar to the TX and TL process described previously, we measured the protein expression from purified mRNA added to the reaction mixture, in the absence of DNA. Therefore, in this experiment, the only processes affecting gene expression are mRNA decay and the time-dependent translation rate. The MG binding 35-bp aptamer allows us to measure the mRNA levels, whereas GFP fluorescence gives us access to protein abundance. The resulting mRNA and protein profiles are shown in Figures 2 and 3, respectively. Messenger RNA profiles in Figure 2 show approximate exponential decay, as expected.
Figure 2.
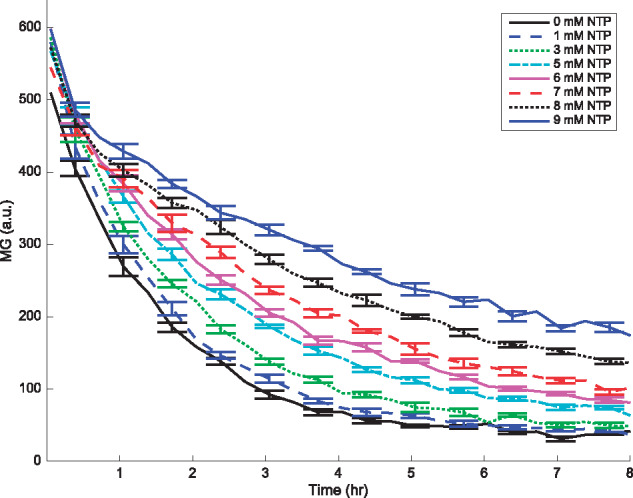
RNA decay profile for various NTP concentrations as a function of time, with mRNA as the starting material. Data are measured every 20 min, while error bars, denoting the standard error of the mean, are plotted for every other data point. Mean and standard error are calculated over six replicates. Concentrations of Mg2+ and K+ are 18 mM and 91 mM, respectively.
Figure 3.
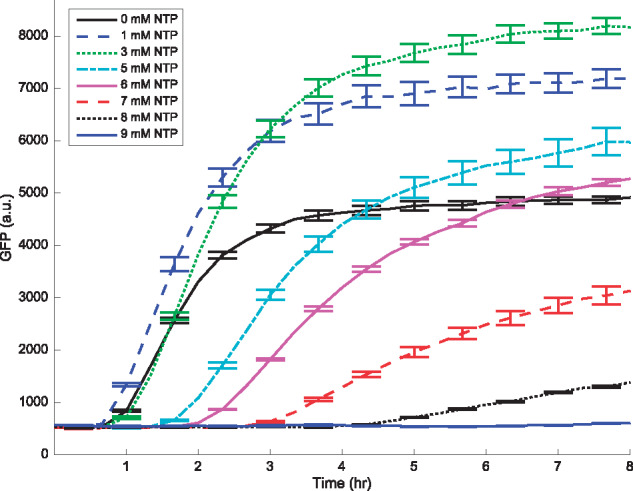
Translation kinetics showing the GFP protein production for various NTP concentrations with mRNA as the starting material. Data are measured every 20 min, while error bars, denoting the standard error of the mean, are plotted for every other data point. Mean and standard error are calculated over six replicates. Concentrations of Mg2+ and K+ are 18 mM and 91 mM, respectively.
Using both the mRNA and protein profiles, we extract time-dependent TL rates, following methods similar to those appearing in Siegal-Gaskins et al. (9) from 2014. We assume that GFP (g) and MG (m) are related to protein (p) and mRNA (r) expression as follows:
| (1) |
| (2) |
Here g0, m0 are parameters accounting for autofluorescence and, in general, vary between experiments, whereas α, β are proportionality constants that convert between fluorescence measurements and the corresponding protein or mRNA concentrations. Importantly, we assume that α and β are fixed constants, independent of the experiment under consideration. Note that since mRNA is unstable and undergoing approximate exponential decay (see Figure 2), we can estimate m0 as the final temporal measurement of m for each experiment.
The fundamental quantity of interest is the (generally) time-varying TL rate . Since only TL is occurring, we assume that the rate of protein production is directly proportional to the amount of mRNA r(t) at time t:
| (3) |
To estimate , we must first relate it to the observed quantities g and m. Defining
| (4) |
| (5) |
where is the protein concentration as a function of M, one can show (for details, including justification that is well defined, see Appendix) that G(M) satisfies the following ordinary differential equation (ODE):
| (6) |
Since α and β are constants across experiments, equation (6) implies that can be used as a proxy for the TL rate kp. Thus, to analyze the qualitative effects of Mg2+ and NTP on TL, we compute slopes in the G-M plane. See Figure 4 for a sample calculation, which we describe in the following.
Figure 4.
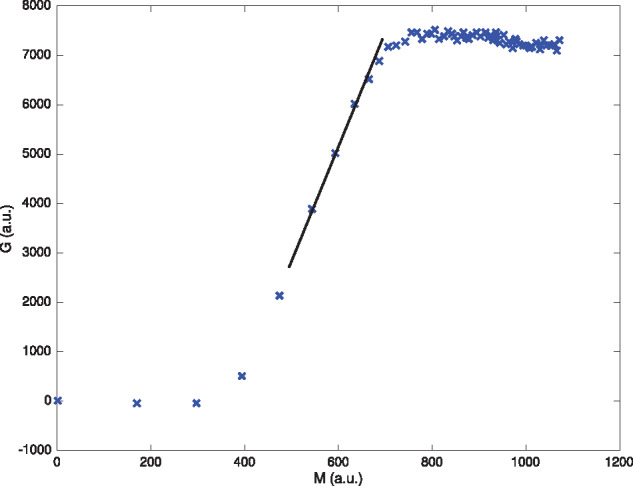
The change in protein versus the integral of the mRNA profile at 21 mM Mg2+ and no additional NTP. For most replicates and Mg2+/NTP concentrations, we observe a clear region of nearly constant translation rate. The extracted rate (i.e. slope) for this experiment is shown via the black solid line.
We also note that the quantity M(t) had been defined in a previous study (9) and can be interpreted as proportional to the amount of protein produced, assuming a constant TL rate [see the definition in equation (4)]. Thus, plotting G against M, we obtain a measure of the instantaneous TL rate.
To calculate the translation rate (technically ) for each experiment, we observe the following general phenomenon. For all replicates, we observe a lag time t0 (see, e.g. Figure 1 or 3), where protein levels appear to be approximately constant. Assuming this signal is generated by autofluorescence (background emission from other biomolecules) and thus is not due to production of the GFP-tagged protein of our interest, TL is yet to start in earnest. This is verified in the G-M plane as in Figure 4, where a slope of approximately zero is observed initially. Afterwards, there exists a regime where translation occurs at a constant rate, which can be taken as proportional to via equation (6). Toward the end of each experiment, protein level saturates and again the slope of G(M) approaches zero. The initial TL rate is thus taken, in this work, as the slope of G(M) in the region of approximate linear growth. This behavior, taken together with that of the early and late regimes, implies that the slope should be largest during the period of linear growth, although some exceptions exist due to noise and the difficulty in computing derivatives with discrete data. To that end, we exclude early and late data from TL rate extraction, where these effects are most noticeable. The basis for our algorithm for computing kp is then the following: transform to the (M, G) plane, compute moving windows of fixed length (five data points were used, but the results are robust to this value), use a least-squares regression to fit a line to the data and measure the translation rate kp as the maximum value over all such moving windows.
To verify that TL occurs, at least on an intermediate time window, at an approximately constant rate, we plot the GFP-MG (i.e. protein-RNA) translation data in the (G, M) plane for each experiment (each NTP and Mg2+ is performed with six replicates). For a demonstrative example, see the plot in Figure 4; all 384 experiments are similar. Blue crosses represent experimental data points. In each case, we observe rapid linear growth between regions of slower growth; the initial slow growth corresponds to the experimental delay, which implies approximately no change in protein production: , while the latter to the diminished mRNA concentration in the well (i.e. saturation). This approximately linear regime is where we measure the translation rate kp via a least-squares regression (slope of black line). Note that the clustering of data points for large M values is due to the fact that the transformation is not an isometry. As time t increases, the decay of mRNA (Figure 2) implies that the total amount of mRNA (measured via M) stabilizes.
Before describing the results, we offer a brief discussion of the initial lag and its impact on our analysis. We believe it arises from an initial formation of molecules necessary for processes such as translation, as well as system calibration to initial mixing and temperature change. We expect our fluorescence measurements to be linear in the number of molecules, on average, in the low signal limit, so we do not anticipate a delay originating from the sensitivity limit of the optical measurement. Also, we have noticed that this delay varies slightly for runs on different days with different samples. If the reactions were reliable and it was only due to machine sensitivity, we would have expected the delays to be consistent.
We argue that our conclusions are robust to this phenomenon. Since our analysis only depends on changes in protein levels, our extracted TL rates from the intermediate time range do not depend on the early-phase dynamics. Thus, even if we allow for the possibility that the lag has to do with a sensitivity limit to small protein amounts, our results arise from differences in strong fluorescence signals associated with detectable protein levels. Also, in our major experiments, where the initial material is mRNA, the lag times are typically smaller than the analogous experiments with DNA as initial material, for comparable levels of NTP and Mg2+.
The computed translation rate is plotted against both NTP and Mg2+ concentrations in Figure 5, confirming our hypothesis that additional NTP is directly inhibiting translation.
Figure 5.
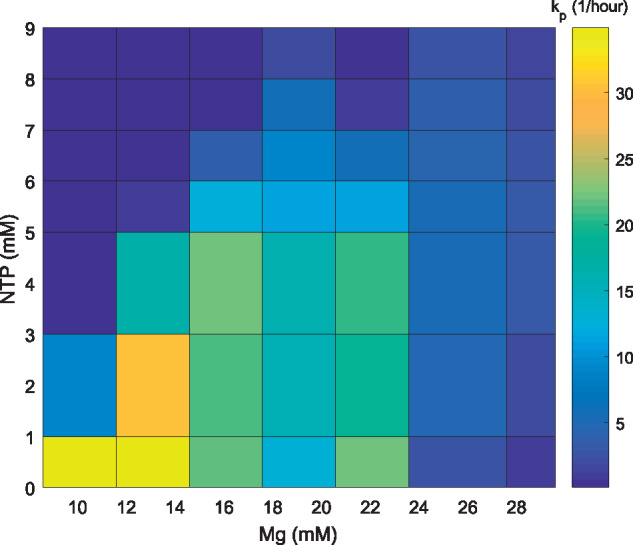
Surface plot showing the translation rate as a function of various NTP and Mg2+ concentrations.
Analyzing Figure 5, we observe a complex interdependence between Mg2+ and NTP concentrations on the TL rate dynamics. Specifically, for each value of NTP, two distinct maxima exist as a function of Mg2+. As the NTP concentration increases, one of these maxima shifts to increasing values of Mg2+. Recalling that NTP-Mg2+ is the biologically relevant complex, we have developed a phenomenological model to explain this maxima shifting. For the discussion of multiple maxima, see below.
In this model, a greater amount of NTP requires a greater amount of Mg2+ to be functional. Otherwise, the free NTP, unbound to Mg2+, ‘poisons’ the TL system. Initially, this may appear unintuitive in our experimental system, because the total concentration of NTP (a few mMs) is two to three times smaller than the total Mg2+ concentrations, with dissociation constant on the order of 0.01 mM (12). However, we recall that TL is affected not by the total ion concentration but instead by the free ions in the solution. Nierhaus (13) have shown the binding of ribosomes to a significant fraction of Mg2+ and K+, thereby leaving very little cytosolic ions available.
Let us consider the competition for Mg2+ between NTP and other species, such as ribosomes, with binding sites for the ion. Assume that the competitors of NTP have the same Mg2+ binding affinity . We can now consider two extreme regimes, which relate the values of with a typical Mg2+ binding affinity of an NTP, . If , then Mg2+ will first bind to the competitors and only the remaining ions would be available for binding to NTP. For the concentrations considered in this work, this condition is equivalent to the total concentration of Mg2+ available to NTP being reduced by a fixed amount. Conversely, leads to a fixed fraction of non-NTP bound Mg2+ to be free, the remainder being bound to competitors. In the first scenario, added NTP requires almost equal increase in concentration of Mg2+ for partial reversal of TL suppression, a stoichiometric requirement. In the second case, one needs to add more Mg2+ to observe the same effect, since unbound sites from the weak competitors would bind to some of the additional Mg2+. Examining our data, the ratio of added Mg2+ to added NTP, for TL rescue, seems to be approximately 1:1. Also the NTP-Mg2+ compensation seems to be occurring for additional Mg2+ about a certain amount, approximately 10 mM. These observations provide evidence for the first scenario; specifically that approximately 10 mM of Mg2+ is strongly bound to competitor molecules. The concentration of Mg2+ available for binding with NTP to form NTP-Mg2+ complex, which is central to gene expression (14), is therefore treated as an available total concentration in our mathematical model. In other words, available magnesium is the difference of total and bound (sequestered) magnesium, and , respectively:
The above observation suggests that is approximately constant, which we now assume for the remainder of the work.
More precisely, we assume that the translation rate takes the following general form:
| (7) |
Here [NTP-Mg2+] denotes the concentration of the NTP-Mg2+ complex and is the driver of translation. The above expression represents the competition at the binding site between the unbound NTP and NTP-Mg2+ molecules, with b and c denoting (relative) inverse dissociation constants and a the maximum possible TL rate. We also have included a completely phenomenological Mg2+-dependent suppression of the form , since it is known that Mg2+ in abundance will inhibit TL (15–17).
To calculate the concentrations used in the above formula, we assume all reactions are in equilibrium, and thus concentrations can be calculated via a steady-state analysis. We have the following association–dissociation reaction between Mg2+ and NTP:
from which we can calculate the concentration of [NTP-Mg2+] as a function of total concentrations , and the dissociation constant . In general, we can show that for each total concentration of NTP, the above will possess a unique relative maximum in , which increases as the total amount of NTP is increased. A sample plot is included in Figure 6 for demonstrative purposes.
Figure 6.
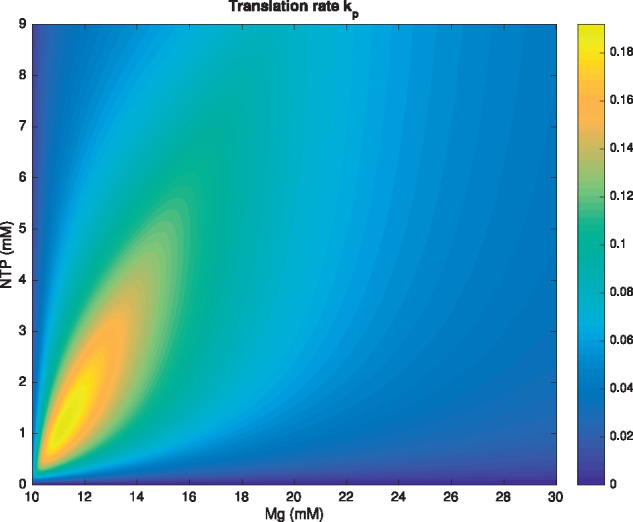
Heat map showing the translation rate as a function of total NTP and total Mg2+ concentrations for the one maximum model (7). [Mg2+]Bound is assumed to be 10 mM.
The previous model does not capture the two-peak structure of the data sets. We believe that there are two distinct influences of Mg2+ on TL. One of these has to do with NTP titration, as described previously. The other involves the stabilization of RNA and other molecules involved in translation (13,18) and that effect has an optimal concentration requirement. The superposition of two such effects could then lead to two local maxima. Disentangling these two effects from the experimental data is indeed an interesting question.
Several processes that did not get explicitly modeled are worth considering more explicitly in future work. Aminoacyl-transfer RNA synthetases (aaRS’s) rely on both ATP and Mg2+ to function, which could give rise to complex NTP and Mg2+ dependencies in gene expression. Furthermore, different synthetases seem to require a varying number of Mg2+ ions for each ATP (19). At present, we do not understand the 1:1 compensation effect in that framework, and further detailed studies of quantitative models including aminoacylation effects [see (20)] are needed.
Another possible mechanism of NTP-dependent suppression of TL is that accumulated inorganic phosphate depletes Mg2+ levels and leads to reduced ribosome activity through 16 S rRNA cleavage in E. coli cell-free (21,22). This mechanism indeed has the same qualitative effect of removal of free Mg2+ leading to inhibited TL. However, in the experiments of Failmezger et al. (22), 16S rRNA degrades steadily with the timescale of hours. If this was the main effect in our experimental conditions, we would have expected to observe a steady decrease in translation rate. Since we instead measure translation occurring at a nearly constant rate over a time span of several hours, we are not confident this mechanism explains the main observation in our data.
Basic cellular processes like TX and TL require many resources. As we try to build synthetic gene regulation networks, we need to understand competition for resources giving rise to limitations and trade-offs. Both mathematical modeling and experimental studies are directed toward elucidation of this issue (23,24,9). In the system studied, we provide evidence that suppression of gene expression due to added NTP is not primarily due to competition between TX and TL as has been proposed in (9), but we suggest that the limitation of available free Mg2+ plays a role in this suppression. This suggestion is based on the observation that the suppression due to additional NTP is partly relieved by adding more Mg2+. In general, because of the non-trivial interaction between different resources, more studies need to be done scanning multiple parameters simultaneously, while monitoring a particular phenotype.
Finally, the fine-tuning needed in the TX-TL raises questions regarding the optimization of gene expression in vivo. Our knowledge of sensing and controlling levels of crucial reagents in the cell is currently incomplete at best, although quite a bit is known about homeostasis of ATP levels (25). These synthetic biology studies therefore provide an important impetus for furthering our understanding.
Supplementary data
Supplementary Data are available at SYNBIO Online.
Supplementary Material
Acknowledgements
The authors thank Vincent Noireaux and members of the Murray lab for useful discussions and materials. They also thank Honghua Li, Paul Manowitz, Youyi Peng, Scot Stenroos and William Welsh for valuable support during the experimental work.
Appendix
In this section, we formally derive equation (6). Assume that the mRNA concentration r(t) > 0 for all t in each experiment and that translation can be described by (3):
Equations (2) and (4) imply that
so that , i.e. M is an increasing function of t. Thus, M(t) is invertible, and we can solve
on some interval . Note that as r(t) is exponentially decreasing, although this is not strictly necessary. Furthermore, we can compute the derivative of this function via the inverse function theorem:
| (8) |
Defining the GFP marker as a function of M,
is thus well-defined, and we can compute its derivative using the chain rule:
Equation (1) implies that , equation (3) that , and equation (8) provides the last term on the right-hand side. Canceling yields the expression
which is precisely (6), as desired.
Funding
Office of Naval Research (ONR, in part) [N00014-13-1-0074].
Conflict of interest statement. None declared.
References
- 1. Shimizu Y., Inoue A., Tomari Y., Suzuki T., Yokogawa T., Nishikawa K., Ueda T. (2001) Cell-free translation reconstituted with purified components. Nat Biotechnol, 19, 751.. [DOI] [PubMed] [Google Scholar]
- 2. Noireaux V., Bar-Ziv R., Libchaber A. (2003) Principles of cell-free genetic circuit assembly. Proc Natl Acad Sci U S A, 100, 12672–12677. [DOI] [PMC free article] [PubMed] [Google Scholar]
- 3. Noireaux V., Libchaber A. (2004) A vesicle bioreactor as a step toward an artificial cell assembly. Proc Natl Acad Sci U S A, 101, 17669–17674. [DOI] [PMC free article] [PubMed] [Google Scholar]
- 4. Noireaux V., Maeda Y.T., Libchaber A. (2011) Development of an artificial cell, from self-organization to computation and self-reproduction. Proc Natl Acad Sci U S A, 108, 3473–3480. [DOI] [PMC free article] [PubMed] [Google Scholar]
- 5. Shin J., Noireaux V. (2012) An e. coli cell-free expression toolbox: application to synthetic gene circuits and artificial cells. ACS Synth Biol, 1, 29–41. [DOI] [PubMed] [Google Scholar]
- 6. Sun Z.Z., Hayes C., Shin A., Caschera J.F., Murray R.M., Noireaux V. (2013) Protocols for implementing an escherichia coli based TX-TL cell-free expression system for synthetic biology. J Vis Exp, 79, e50762. [DOI] [PMC free article] [PubMed] [Google Scholar]
- 7. Kuruma Y., Ueda T. (2015) The pure system for the cell-free synthesis of membrane proteins. Nat Protoc, 10, 1328. [DOI] [PubMed] [Google Scholar]
- 8. Biotechnology: cell-free biotech will make better products. The Economist, May 6, 2017.
- 9. Siegal-Gaskins D., Tuza Z.A., Kim J., Noireaux V., Murray R.M. (2014) Gene circuit performance characterization and resource usage in a cell-free “breadboard”. ACS Synth Biol, 3, 416–425. [DOI] [PubMed] [Google Scholar]
- 10. Caschera F., Noireaux V. (2014) Synthesis of 2.3 mg/ml of protein with an all escherichia coli cell-free transcription-translation system. Biochimie, 99, 162–168. [DOI] [PubMed] [Google Scholar]
- 11. Caschera F., Noireaux V. (2015) Preparation of amino acid mixtures for cell-free expression systems. Biotechniques, 58, 40–43. [DOI] [PubMed] [Google Scholar]
- 12. Rose I.A. (1968) The state of Magnesium in cells as estimated from the adenylate kinase equilibrium. Proc Natl Acad Sci USA, 61, 1079–1086. [DOI] [PMC free article] [PubMed] [Google Scholar]
- 13. Nierhaus K.H. (2014) Mg2+, K+, and the ribosome. J Bacteriol, 196, 3817–3819. [DOI] [PMC free article] [PubMed] [Google Scholar]
- 14. Wolf F.I., Cittadini A. (2003) Chemistry and biochemistry of Magnesium. Mol Aspects Med, 24, 3–9. [DOI] [PubMed] [Google Scholar]
- 15. Zagŏrski W., Filipowicz W., Wodnar A., Leonowicz A., Zagŏrska L., Szafranski P. (1972) The effect of Magnesium-ion concentration on the translation of phage-f2 RNA in a cell-free system of escherichia coli. Eur J Biochem, 25, 315–322. [DOI] [PubMed] [Google Scholar]
- 16. Brandi L., Fabbretti A., La Teana A., Abbondi M., Losi D., Donadio S., Gualerzi C.O. (2006) Specific, efficient, and selective inhibition of prokaryotic translation initiation by a novel peptide antibiotic. Proc Natl Acad Sci USA, 103, 39–44. [DOI] [PMC free article] [PubMed] [Google Scholar]
- 17. Lancaster A.M., Jan E., Sarnow P. (2006) Initiation factor-independent translation mediated by the hepatitis C virus internal ribosome entry site. RNA, 12, 894–902. [DOI] [PMC free article] [PubMed] [Google Scholar]
- 18. Lightfoot D.A. (1988) Magnesium-dependence of in vitro translation programmed by gene-specific mRNAs. Nucleic Acids Res, 16, 4164. [DOI] [PMC free article] [PubMed] [Google Scholar]
- 19. Airas R.K. (1996) Differences in the Magnesium dependences of the class I and class II aminoacyl-trna synthetases from escherichia coli. FEBS J, 240, 223–231. [DOI] [PubMed] [Google Scholar]
- 20. MatsuuraTanimura T., Hosoda N., Yomo K.T., (2017) Reaction dynamics analysis of a reconstituted escherichia coli protein translation system by computational modeling. Proc Natl Acad Sci U S A, 114, E1336–E1344. [DOI] [PMC free article] [PubMed] [Google Scholar]
- 21. Kim T-W., Kim D-M., Choi C-Y. (2006) Rapid production of milligram quantities of proteins in a batch cell-free protein synthesis system. J Biotechnol, 124, 373–380. [DOI] [PubMed] [Google Scholar]
- 22. Failmezger J., Nitschel R., Sánchez-Kopper A., Kraml M., Siemann-Herzberg M., Wieden H.-J. (2016) Site-specific cleavage of ribosomal RNA in escherichia coli-based cell-free protein synthesis systems. PLoS One, 11, e0168764.. [DOI] [PMC free article] [PubMed] [Google Scholar]
- 23. Borkowski O., Ceroni F., Stan G.B., Ellis T. (2016) Overloaded and stressed: whole-cell considerations for bacterial synthetic biology. Curr Opin Microbiol, 33, 123–130. [DOI] [PubMed] [Google Scholar]
- 24. Gyorgy A., Del Vecchio D.. Limitations and trade-offs in gene expression due to competition for shared cellular resources In: IEEE 53rd Annual Conference on Decision and Control (CDC), 2014 .IEEE, Los Angeles, CA, USA: P. 5431–5436. [Google Scholar]
- 25. Hara K.Y., Kondo A. (2015) ATP regulation in bioproduction. Microb Cell Fact, 14, 198. [DOI] [PMC free article] [PubMed] [Google Scholar]
Associated Data
This section collects any data citations, data availability statements, or supplementary materials included in this article.


