Abstract
Objective:
To describe the characteristic imaging features of focal nodular marrow hyperplasia (FNMH).
Methods and materials:
Retrospective review of all patients with a diagnosis of FNMH between January 2007 and September 2019.
Results:
The study included 53 patients, 7 males and 46 females with a mean age of 58 years (range 12–95 years). All had MRI with conventional spin echo sequences showing a poorly defined round/oval lesion with mild T1W iso/hyperintensity compared to skeletal muscle, low T2W turbo spin echo (TSE) signal intensity (SI) compared to marrow fat and variable SI on STIR, but never associated with reactive marrow oedema. All 53 patients had follow-up MRI, with all lesions remaining stable or partially resolving. In-phase (IP) and out-of-phase (OP) chemical shift imaging (CSI) was obtained in 31 of these, with 28 (90.3%) showing >20% SI drop on the OP sequence, while 3 (9.7%) demonstrated <20% SI drop. CT was available in 26 cases, 17 (65.4%) showing mild medullary sclerosis. Single-photon emission computed tomography CT (SPECT-CT) was available in four cases and Flourodeoxyglucose positron emission tomography CT (FDG PET-CT) in 2, all showing increased uptake. Focal uptake was also seen in three of eight patients who had undergone whole body bone scintigraphy. Only one lesion was biopsied, confirming FNMH.
Conclusion:
The imaging appearances of FNMH have been described on various modalities, particularly MRI with emphasis on the role of IP and OP CSI typically demonstrating >20% SI reduction. FNMH should be recognised and treated as a 'do not touch' lesion which does not require biopsy or prolonged follow-up.
Advances in knowledge:
We describe and clarify the imaging characteristics of FNMH on MRI, including CSI, CT and various nuclear medicine modalities. An imaging algorithm is suggested for allowing a non-invasive diagnosis.
Introduction
Focal nodular marrow hyperplasia (FNMH) is a rare condition which refers to localised proliferation of hyperplastic haematopoietic marrow.1,2 Although an entirely benign entity, it has the imaging appearances of a pseudo-tumour and can result in diagnostic uncertainty when identified as a new lesion in a patient with known primary malignancy. The diagnostic approach for such indeterminate lesions has traditionally been follow-up MRI showing no change or reduction in size, thus excluding a metastasis.1,3–5 Therefore, the imaging diagnosis has usually been one of 'exclusion' based on sequential imaging, rather than focusing on a single MRI study. This is unsatisfactory in the setting of known malignancy, potentially resulting in patient anxiety due to prolonged follow-up, or harm due to unnecessary needle biopsy. Several case reports have described the entity of FNMH mimicking a metastasis in patients with known cancer, the diagnosis being established either by image-guided needle biopsy or by surgical resection.6–11 In these cases, MRI demonstrated oval lesions with reduced T1W SI compared to marrow, but usually of higher SI than skeletal muscle or intervertebral disc. The lesions also showed reduced T2W SI compared to marrow, but variable SI on fat suppressed T2W FSE sequences or short tau inversion recovery (STIR) sequences. The details of these cases are presented in Table 1.
Table 1.
Summary of the clinical presentation, imaging findings and treatment of focal nodular marrow hyperplasia (FNMH) in the current literature
| Reference | Patient details | Presentation | Imaging | Subsequent investigations and treatment |
|---|---|---|---|---|
| Bordalo-Rodrigues et al6 | 77 M | Lung cancer, underwent whole body FDG PET for staging. | PET CT-T8 vertebral body uptake. MRI- 2×2 cm low T1 lesion in T8 (but higher than disk signal). Not seen on T2 FS. | CT-guided T8 biopsy showed FNMH. Pulmonary lesion alone resected. |
| Pui et al7 | 37 M | Left proximal tibial osteosarcoma. Patient had further knee pain following preoperative chemotherapy | MRI - new 2 cm oval lesion in left mid-femur. Lesion isointense to muscle on T1 and T2 FS images. CT-focal intramedullary sclerosis with no corresponding bone scan uptake. | Patient refused biopsy of mid-femur lesion. High above knee amputation of primary tumour and femoral lesion. Histology of the latter revealed FNMH. |
| Chow et al8 | 14 M | Pain and swelling left proximal tibia. | Osteosarcoma left proximal tibia. MRI-possible skip metastasis 7 cm below tumour in anterior tibial cortex. Isointense to muscle T1, high T2 FS SI. CT-no lesion. Bone scan-no uptake. | Tumour excision including distal tibial lesion had chemotherapy followed by left total knee replacement. Histology of distal lesion confirmed FNMH. |
| 7 M | Left distal thigh pain | MRI-left distal femoral osteosarcoma. Possible skip metastasis in left proximal femur. MRI-hyperintense to muscle T1, hyperintense T2FS, mild post-gad enhancement. PET CT-no uptake. Bone scan-normal. | Proximal femur biopsy showed FNMH. Patient has segmental resection excluding proximal lesion. | |
| 17 M | Right knee pain for 3 months. | Right distal femoral osteosarcoma. Bone scan- uptake in T10 and right lesser trochanter. MRI- low T1, high T2 FS lesions. CT-Faint T10 sclerosis. All thought to be metastases. | Right total knee replacement. Lesser trochanter lesion excised. T10 lesion excised with bone graft and spinal fusion. Both showed FNMH. | |
| 14 M | Right thigh swelling 1 month. | Osteosarcoma right femoral diaphysis. MRI-further proximal femoral lesion, no mention of MRI features. | Biopsy of proximal femoral lesion-FNMH. Had chemotherapy followed by limb salvage surgery. | |
| 42 M | Left femur subtrochanteric fracture after trivial injury. | PET-CT showed uptake at fracture site with marrow infiltration-Ewing sarcoma. Also showed uptake in mid-femur. MRI-not described. Bone scan-normal. | Had segmental resection including mid-femoral lesion. Histology of latter-FNMH. | |
| Shigematsu et al9 | Eight males (average age 64) all with vertebral body lesions. Only one was localised. |
Six patients had known malignancy but were asymptomatic; two had low back pain; five thoracic spine location; three lumbar spine location. |
All eight vertebral body lesions suspicious for metastases on MRI. All were hypointense to marrow on T1 and T2. 3/4 hyperintense and 1/4 isointense on STIR. All eight lesions had higher than normal SUV max on FDG PET CT (range 2.09–3.06). 5/8 showed no uptake on bone scan. 7/8 showed subtle high attenuation on CT compared to normal marrow. |
All eight cases diagnosed as hyperplastic haematopoietic bone marrow (HHBM) following CT biopsy. |
| Tanaka et al10 | 66 M | Ca oesophagus | L3 vertebral body lesion. Low SI on T1W and T2W. Increased activity on FDG-PET | CT-guided biopsy revealed hypercellular marrow. |
| Yasuda et al11 | 63 M | Ca oesophagus | FDG-PET showed lesions in sternum and sacrum. MRI showed low SI on T1 and T2W sequences. | Biopsy of sternum revealed bone marrow hyperplasia. |
As opposed to FNMH, diffuse red marrow hyperplasia is a relatively common occurrence in the setting of increased haematopoietic demand such as chronic anaemia, malignancy, excessive sporting activity, cigarette smoking, obesity and various medical conditions including diabetes and its imaging appearances have been extensively reviewed. MRI demonstrates symmetrical reduction of T1W marrow SI with interdigitating areas of fat, which typically spares the sub-articular bone and has characteristic locations such as the spine, pelvis and proximal humeral and femoral metaphyses. The marrow SI is typically higher than skeletal muscle.1–5
The senior author has encountered many cases of FNMH, either as an incidental lesion on MRI, or as a suspected metastasis presenting for further evaluation to the Musculoskeletal or Spinal Oncology multidisciplinary team meeting (MDTM) in patients with known cancer. The aim of the current study is to review the imaging appearances across all modalities but particularly MRI, highlighting features which may help identify a lesion as FNMH without the need for biopsy or prolonged follow-up.
Methods and materials
The study was approved by the Local Research and Innovation Service of The Institute of Orthopaedics, with no requirement for informed patient consent.
The Radiology Information System was searched from January 2007 to September 2019 for all patients with a suggested diagnosis of FNMH based on reports of the senior author, who had 13 years experience of musculoskeletal tumour imaging at the start of the review period and 25 years experience by the end. This yielded 72 results. For the purposes of this study, a diagnosis of FNMH was made based on any of the following criteria:
A lesion with MRI features consistent with previous reports of FNMH (Table 1), which had a minimum of 6 months MRI follow-up and showed no progression. The MRI features included a round/oval lesion which was hypointense to marrow fat but hyperintense or isointense to skeletal muscle on T1W TSE, mildly hypointense to marrow fat on T2W FSE, and either mildly hyperintense or isointense to marrow fat on STIR.
A lesion with MRI features consistent with FNMH, as described above without 6 months follow-up, which showed >20% SI reduction on OP compared to IP chemical shift imaging (CSI), confirming a relatively high fat content but showing no features of an atypical haemangioma or marrow oedema. Atypical haemangioma is characterised by the ‘polka-dot’ sign seen on CT and often on axial T2W FSE MRI, but is absent in FNMH. Vertebral marrow oedema is most commonly seen in endplaterelated disc degeneration, due to Schmorl’s nodes, or related to acute benign compression fractures and not centrally within the vertebral body as in FNMH.
A lesion with a histologically confirmed diagnosis of FNMH.
Clinical data collected included age, sex, history of previous malignancy and skeletal distribution of the lesion.
MRI techniques varied since many cases were referred from external hospitals to the Musculoskeletal or Spinal Oncology Services for further evaluation. Spinal MRI studies undertaken at our institution typically comprised sagittal T1W TSE, T2W FSE and STIR sequences together with axial T1W TSE and T2W FSE sequences, with the addition of a coronal T2W FSE sequence in the lumbar spine. Studies of the pelvis and limbs typically comprised coronal T1W TSE and STIR sequences, sagittal T2W FSE sequences, and axial proton density-weighted FSE (PDW FSE) and spectral adiabatic inversion recovery (SPAIR) sequences. The SI of the lesion was compared to skeletal muscle on T1W TSE sequences and to bone marrow on T2W FSE and STIR sequences, being recorded as hyperintense, isointense or hypointense. Maximum lesion size was also measured. The tumour margin was classified as well-defined or poorly defined, and any surrounding reactive marrow oedema (‘halo sign’) was noted. The presence of a single or several central fatty signal foci within the lesion (‘bulls-eye sign’) was also recorded. For spinal cases, the location of the lesion within the vertebral body was determined from sagittal images (anterior 1/3, mid-1/3 or posterior 1/3) and from coronal images (central or paracentral).
From January 2018, T1W gradient echo CSI was added, images being obtained on a 3T MRI unit with the following parameters: TR = 340 ms; TE (IP) = 2.2 ms, TE (OP) = 1.1 ms. The SI drop between the IP and OP sequences was calculated according to the following formula, as previously reported12–14 :
| % SI drop = [SIIP – SIOP / SIIP] x100 |
A SI drop of >20% was taken as being consistent with FNMH as long as the lesion had no other imaging features to suggest a diagnosis of atypical haemangioma or reactive marrow oedema.12–14 The length of time from initial MRI studies to the last available follow-up MRI study was documented, as were any changes in lesion morphology or SI characteristics.
Available CT studies were assessed for the presence of medullary sclerosis at the location of the lesion, which was determined initially by visual inspection. In cases where there was no appreciable marrow sclerosis, Hounsfield units were measured within circular regions of interest (ROI) at the site of the lesion and in equivalent locations in the adjacent vertebrae. Focal uptake on 99mTc-whole body bone scintigraphy, FDG PET-CT and SPECT-CT was recorded when available, and histology results of any cases that were biopsied were noted.
All data were taken initially from the original imaging reports, but all cases were also re-reviewed by a musculoskeletal radiology fellow. Any discrepancies were resolved by consensus with the senior author.
Results
From the initial 72 patients, 19 were excluded since they did not fulfil the diagnostic criteria listed above. This left 53 patients, 7 males and 46 females with a mean age of 58 years (range 12–95 years). In 19 cases, the lesion was identified incidentally on MRI being undertaken at our institution for various reasons, while 34 cases were identified from the musculoskeletal and spinal oncology MDTM following referral from external hospitals for investigation of a possible bone neoplasm or metastasis. A past medical history of malignancy was present in 15 of 53 patients (28.3%), the commonest being breast (n = 3), myxofibrosarcoma (n = 4) and spindle cell sarcoma (n = 2). None of these patients had undergone any systemic treatment at the time of imaging review. Regarding the initial MRI studies, 64.8% were performed externally on a 1.5T MRI scanner and referred to the MDT for a radiological opinion. Most had a follow-up MRI study at our institution using a 3T MRI unit.
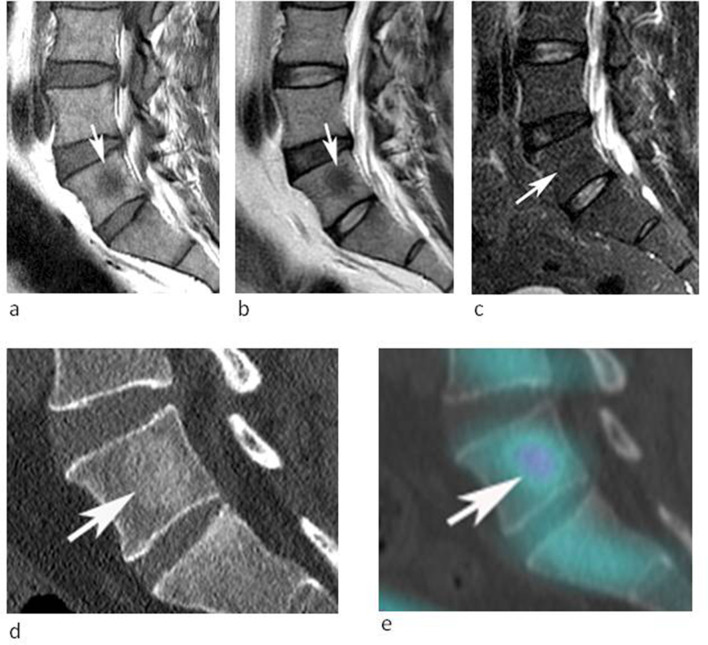
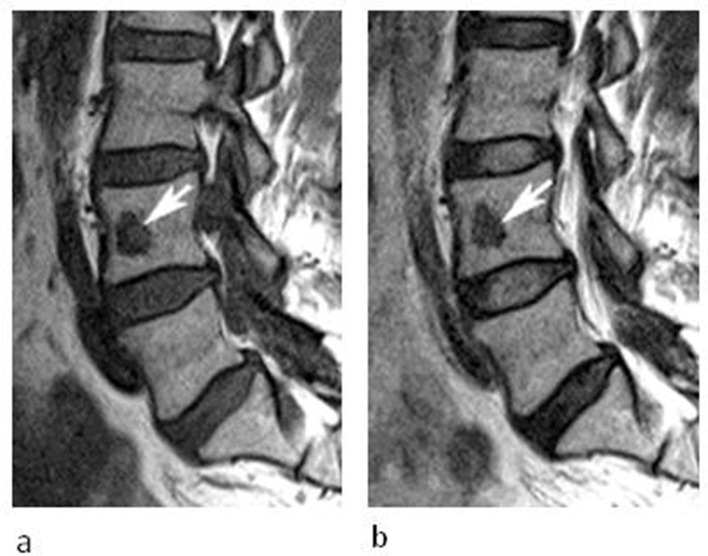
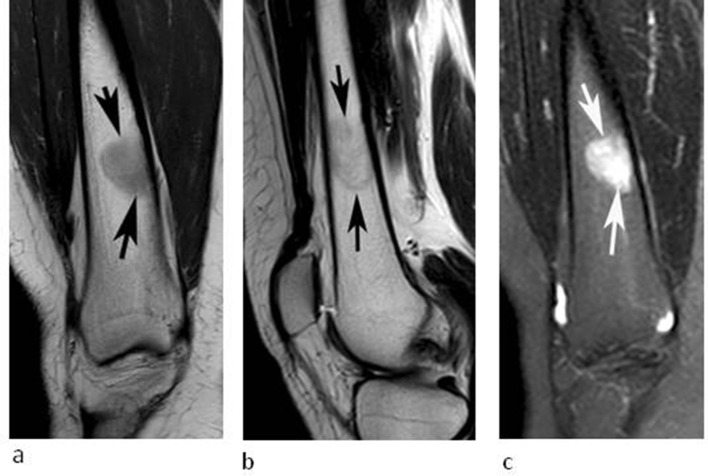
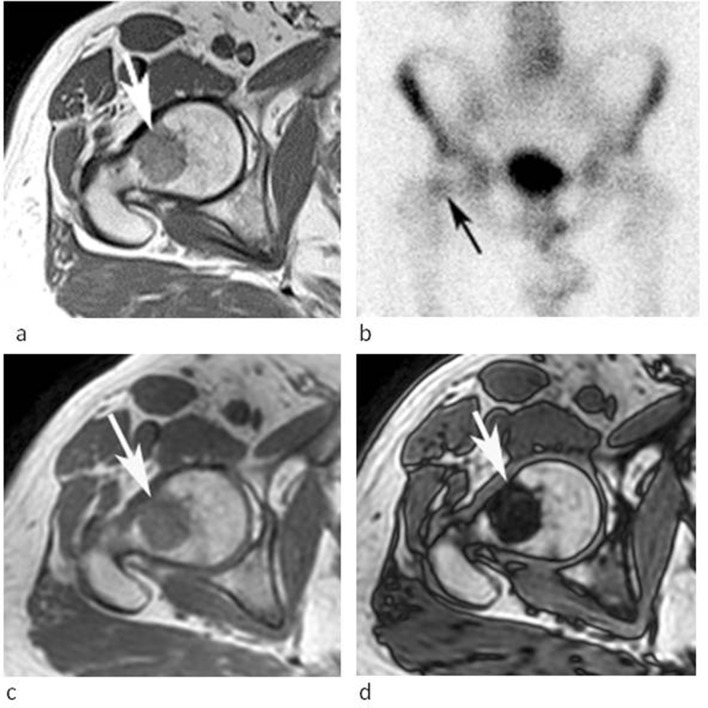
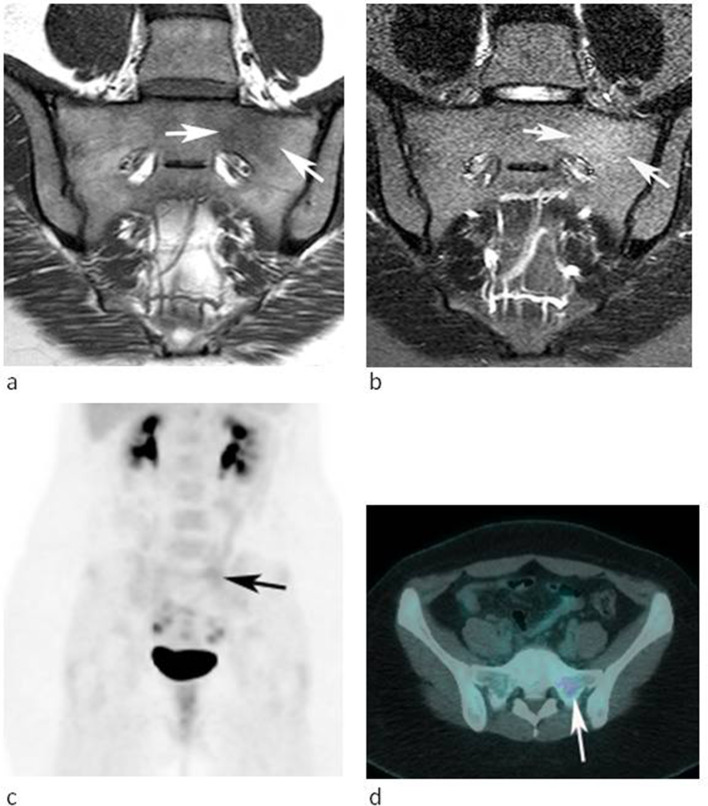
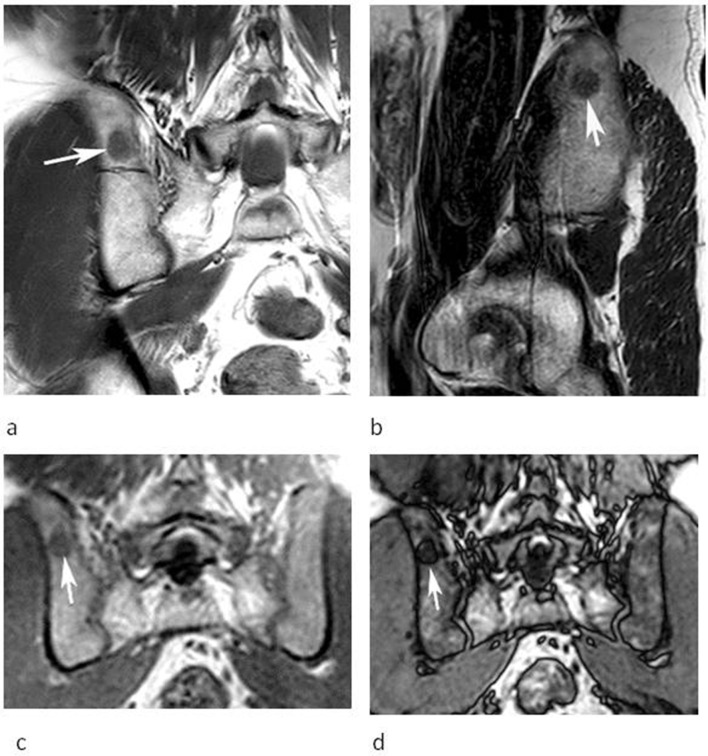
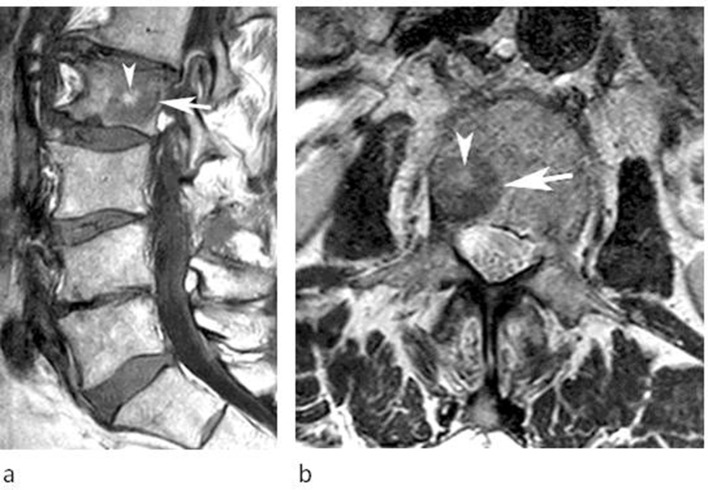
The location of the 53 lesions is presented in Table 2. Most cases arose in the spine (58.5 %), with just over half being in the lumbar spine (Figures 1 and 2), followed by the femur (11.3 %) (Figures 3 and 4), sacrum (15.1 %) (Figure 5) and ilium (5.7%) (Figure 6). Poorly defined margins were recorded in 50 lesions (94.3 %) (Figures 1a, b, 5a, b, 6a and b) while three cases were well-demarcated (Figure 2). No cases displayed the ‘halo-target sign’ (Figure 1c), and only three cases exhibited the ‘bulls-eye sign’ (Figure 7). The average lesion size on MRI was 18 mm (range 8–55 mm), with most having an oval or circular morphology (Figures 1, 3 and 6).
Table 2.
Distribution of focal nodular marrow hyperplasia (FNMH) lesions within the skeleton
| Location | Number of patients (N = 53) |
|---|---|
| Lumbar vertebrae | 22 (41.5%) |
| Thoracic vertebrae | 8 (15.1%) |
| Cervical vertebrae | 1 (1.9%) |
| Ilium | 3 (5.7%) |
| Acetabulum | 3 (5.7%) |
| Femur | 6 (11.3%) |
| Sacrum | 8 (15.1%) |
| Tibia | 1 (1.9%) |
| Humerus | 1 (1.9%) |
Figure 1.
53-year-old male being investigated for low back pain. (a) Sagittal T1W TSE, (b) T2W FSE and (c) STIR MR images demonstrate a poorly defined spherical lesion with reduced T1W and T2W SI (arrows) in the centre of the L5 vertebral body. The lesion is not identified on STIR. Note the absence of peri-lesional oedema (arrow-c). (d) Sagittal CT MPR demonstrates mild medullary sclerosis at the site of the lesion (arrow). (e) Sagittal SPECT-CT MPR demonstrates mild increased activity (arrow).
Figure 2.
A 50-year-old female being investigated for low back pain. (a) Sagittal T1W TSE and (b) T2W FSE MR images demonstrate a well-defined oval lesion with reduced T1W and T2W SI (arrows) in the anterior third of the L4 vertebral body. The lesion was isointense to skeletal muscle on T1.
Figure 3.
A 32-year-old female referred for investigation of a lesion in the right distal femur initially identified on a knee MRI study undertaken for pain and swelling. (a) Coronal T1W TSE, (b) sagittal T2W FSE and (c) coronal STIR MRI demonstrate an oval lesion (arrows) which is hyperintense to skeletal muscle on T1, hypointense to marrow on T2 and hyperintense on STIR. CSI (not shown) demonstrated 30% SI drop on the OP sequence.
Figure 4.
A 72-year-old male referred for biopsy of a lesion in the right proximal femur initially identified on an MRI study undertaken to stage prostate cancer. (a) Axial T1W TSE MR image demonstrates an irregular lesion in the femoral neck which is mildly hyperintense to skeletal muscle (arrow). (b) Bone scan demonstrates mild increased activity in the lesion (arrow). (c) IP and (d) OP CSI demonstrates prominent SI reduction on the OP sequence (arrows), which was calculated at 78% indicating a high fat content and allowing a non-invasive diagnosis of FNMH.
Figure 5.
A 28-year-old female referred for further investigation of a marrow abnormality in the left sacral ala found incidentally. (a) Coronal oblique T1W TSE and (b) STIR MR images demonstrate a poorly defined lesion which is slightly hyperintense to muscle on T1 and mildly hyperintense to marrow on STIR (arrows). (c) Coronal FDG-PET MIP and (d) axial-fused PET-CT images demonstrate mild increased activity. The lesion was stable over 25 months.
Figure 6.
A 54-year-old male referred for further investigation of a marrow abnormality in the right posterior ilium found incidentally. (a) Coronal T1W TSE and (b) sagittal T2W FSE MR images demonstrate a poorly defined oval lesion which is slightly hyperintense to muscle on T1 and hypointense to marrow on T2 (arrows). (c) Coronal IP and (d) OP CSI demonstrate SI reduction on the OP image (arrows) calculated at 55% confirming a high-fat content and allowing a non-invasive diagnosis of FNMH.
Figure 7.
An 82-year-old female being investigated for low back pain. (a) Sagittal T1W TSE and (b) axial T2W FSE MRIs showing a lesion in the posterior right side of the L2 vertebra (arrows) with a central area of fat SI (arrowheads) consistent with the ‘bulls-eye sign’.
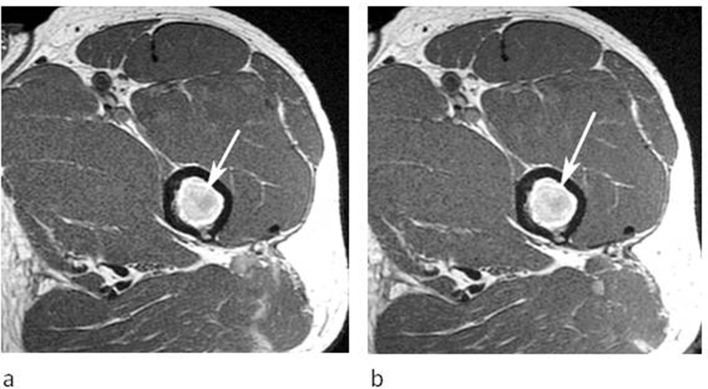
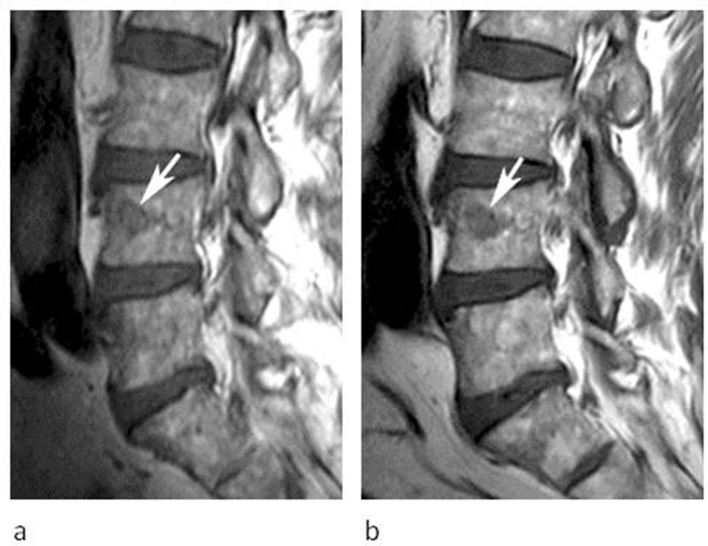
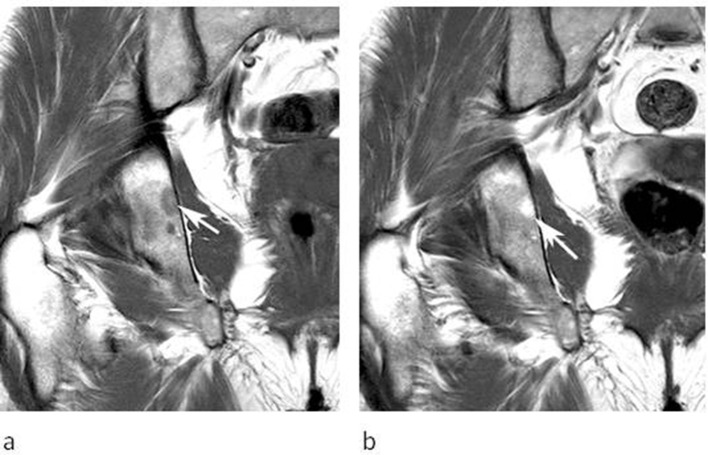
Table 3 highlights the MRI SI characteristics of the 53 cases. Most lesions were hyperintense to skeletal muscle on T1W TSE sequences (Figures 3a–6a) and were never hypointense. Almost all lesions were hypointense to marrow on T2W FSE sequences (Figures 1b–3b and 6b), while just over half were mildly hyperintense to marrow on STIR (Figures 3b and 5b), the remainder appearing isointense and therefore were not identified (Figure 1c). In three cases, post-gadolinium sequences were available, all three showing no enhancement (Figure 8). Follow-up MRI studies were available in all 53 cases, with a mean interval of 14.6 months (range 6–102 months) between initial and final studies. In no case did the lesion increase in size, while in 50 (94.3 %), it remained stable (Figure 9) and 3 (5.6 %) showed a variable degree of resolution (Figure 10).
Table 3.
MRI signal characteristics of focal nodular marrow hyperplasia (FNMH)
| Signal intensity | Hypointense | Isointense | Hyperintense |
|---|---|---|---|
| T1W (cf skeletal muscle) | 0 (0%) | 12 (22.2%) | 41 (77.4%) |
| T2W (cf marrow) | 52 (98.1%) | 1 (1.9%) | 0 (0%) |
| STIR (cf marrow) | 0 (0%) | 22 (40.7%) | 31 (58.5%) |
Figure 8.
A 43-year-old male referred for further investigation of a marrow abnormality identified in the left proximal femur. (a) Axial T1W TSE and (b) post-contrast T1W TSE MR images demonstrate a round lesion which is hyperintense to muscle on T1 (arrow-a) and shows no enhancement following contrast (arrow-b).
Figure 9.
A 71-year-old male being investigated for low back pain. (a) Sagittal T1W TSE MRI demonstrates an irregular lesion in the L4 vertebral body (arrow). (b) Follow-up sagittal T1W TSE MRI shows a stable appearance (arrow) after 23 months.
Figure 10.
A 36-year-old female being investigated for a soft tissue mass in the left groin. (a) Coronal T1W TSE MRI demonstrates a small lesion in the right ischium (arrow). (b) Follow-up coronal T1W TSE MRI shows conversion to fatty marrow (arrow) after 44 months.
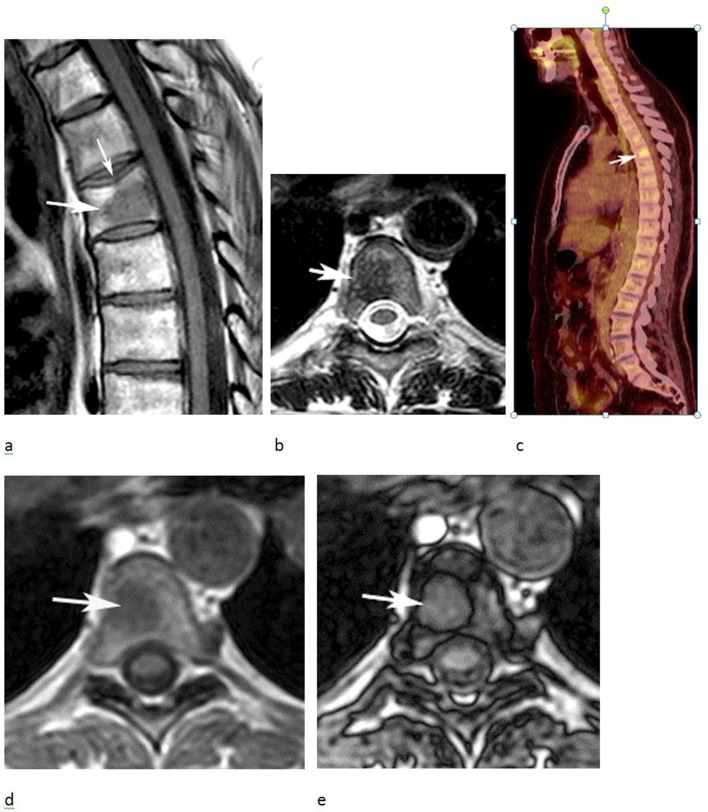
IP and OP CSI were available in 31 of 53 (58.5 %) cases. The mean SI drop on the OP sequence was 48% (range 1.8–88%) (Figures 4c, d, 6c and d). Three cases (5.7%) showed a SI drop <20%. The first case was in the left sacral ala, and this showed overt marrow sclerosis on CT with no change in morphology over 13 months follow-up. The second case was in the T5 vertebral body in a patient with previous cervical cancer and was associated with a healed superior endplate compression fracture. This was the only biopsy proven case of FNMH, histology revealing cellular marrow constituents with 5–10% increase in blast cells. The lesion was also active on FDG-PET (Figure 11). The third case was in the L3 vertebral body with 19% SI drop. However, this demonstrated faint sclerosis on CT and remained stable on a 10-month follow-up MRI study.
Figure 11.
A 61-year-old female with previous cervical cancer who developed a lesion in T5. (a) T1W TSE and (b) axial T2W FSE MRIs show a fairly well-defined intermediate-to-low SI lesion in T5 (arrows). Note the healed superior endplate fracture (thin arrow-a). (c) FDG-PET study demonstrates increased activity (arrow). (d) IP and (e) OP CSI showed only 7.8% SI drop within the lesion (arrows). CT-guided needle biopsy was therefore performed and demonstrated hyperplastic red marrow. The lesion remained stable over a period of 27 months.
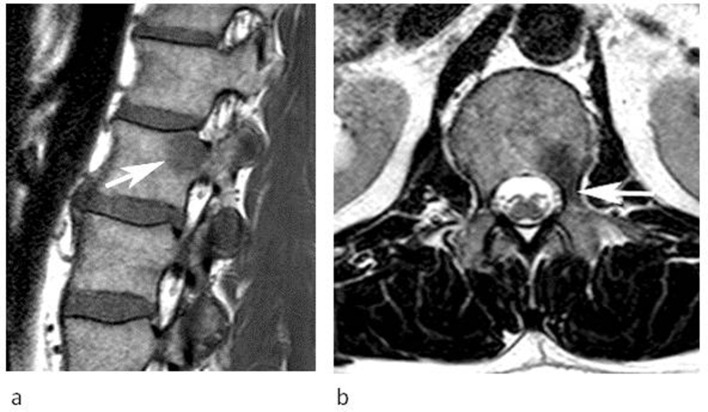
Regarding FNMH lesion location in the spine (n = 31), 4 (12.9%), 18 (58.1%) and 9 (29%) were seen in the anterior (Figure 2), middle (Figures 1 and 9) and posterior (Figure 12) thirds of the vertebral body, respectively, while 72% of lesions were in a paracentral location (Figures 1, 2, 9 and 11). Three of the nine (31%) lesions within the posterior third of the vertebral body also involved the pedicle (Figure 12).
Figure 12.
A 50-year-old male referred for investigation of a lesion in the L1 vertebra. (a) Sagittal T1W TSE and (b) axial T2W FSE MRIs demonstrate a lesion in the left posterior third of the vertebral body extending into the pedicle (arrows). The SI characteristics are classical for FNMH. The lesion remained stable over 6 months.
Table 4 highlights the CT, whole body bone scan, SPECT-CT and FDG-PET CT appearances of the current series. Of the 26 cases that had CT studies available, 17 (65.4%) showed sclerosis, 15 (57.7%) demonstrating obvious medullary sclerosis (Figure 1d), and 2 (7.7%) in which medullary sclerosis was only evident after measuring HU in the ROIs and comparing with adjacent vertebrae. Four and two cases underwent SPECT-CT and FDG PET-CT, respectively, at the referring hospitals, all showing increased uptake in the area of concern (Figures 1e, 5c and d), while three of eight (37.5%) patients with whole body bone scintigraphy showed focal uptake (Figure 4b).
Table 4.
CT, bone scan, SPECT-CT and FDG-PET CT imaging characteristics of focal nodular marrow hyperplasia (FNMH)
| CT (n = 26) | Bone scan (n = 8) | SPECT-CT (n = 4) | FDG-PET CT (n = 2) | ||||
|---|---|---|---|---|---|---|---|
| Obvious medullary sclerosis | 15 (57.7%) |
Increased uptake | 3 (37.5%) |
Increased uptake | 4 (100%) |
Increased uptake (one case SUV max 3.7) |
2 (100%) |
| Raised HU (ROI) | 2 (7.7%) |
||||||
| No sclerosis | 9 (34.6%) |
No uptake | 5 (62.5%) |
No uptake | 0 (0%) |
No uptake | 0 (0%) |
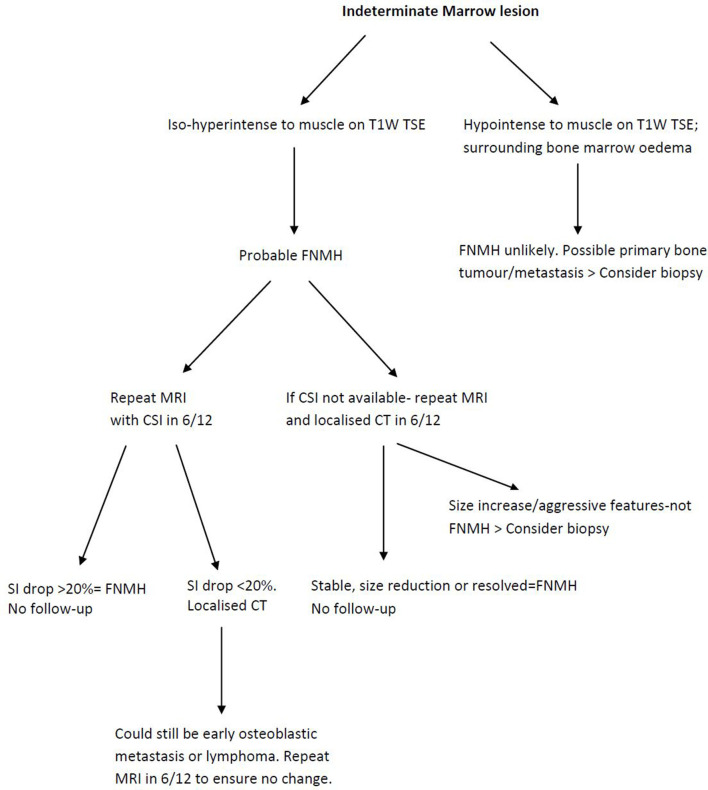
A suggested algorithm for assessing an indeterminate marrow lesion is presented in Figure 13.
Figure 13.
Imaging algorithm for indeterminate marrow lesions using MRI, chemical shift imaging and CT.
Discussion
To our knowledge, there are only six peer-reviewed published articles specifically discussing the imaging features of FNMH as opposed to diffuse marrow reconversion, totalling 10 cases. All except Chow et al8 and Shigematsu et al9 are isolated case reports as outlined in Table 1. Although Shigematsu et al9 described eight cases of marrow hyperplasia, only a single case was an isolated lesion consistent with FNMH. All patients had an underlying cancer diagnosis, and the area of FNMH was biopsied or resected to exclude a metastasis. In the current series, 44 (83 %) patients were over 50-year-old and only nine (16.7 %) less than 18-year-old, while just over one-fifth of patients had a known history of cancer. From literature review, the youngest age of a biopsy proven case of FNMH was a 14-year-old boy with osteosarcoma.8 Our results agree with current literature that FNMH is rarely seen in the paediatric population, which is to be expected since the various causes of marrow reconversion are prevalent in the older age group. Even in the paediatric cases discussed by Chow et al, all patients had an underlying bone sarcoma.8 Diffuse or nodular marrow reconversion is known to occur in patients on chemotherapy receiving granulocyte-colony stimulating factor (GCSF), again more common in the older age group and imaging appearances should not be mistaken for progressive/recurrent disease.15 None of the cases with a past medical history of cancer underwent any systemic treatment at the time of imaging review such as chemo-radiotherapy. This can potentially mimic FNMH in that small areas of fat signal can be seen within bone, implying a healing response in metastatic deposits.16
Consistent with previous reports,9 the spine was the commonest site of FNMH in the current series, with 57.4% of cases occurring in the vertebrae. The thoracic (14.8%) and lumbar (40.7%) regions were most commonly involved, but the sacrum (14.8%) was also a relatively frequent site. However, as illustrated in Table 2, there were also a wide variety of extra spinal locations, most commonly the femur (11.3%) and pelvic bones (11.4%). Therefore, FNMH should also be considered in the differential diagnosis of indeterminate marrow lesions occurring outside the spine.
Table 1 highlights inconsistencies in the current literature for accurately defining the SI characteristics FNMH. FNMH is widely reported to show low T1 SI compared to adjacent bone marrow, but only a few articles comment on its SI compared to skeletal muscle. Vande Berg et al stated that focal red marrow shows lower T1W SI than yellow marrow, but higher than muscle or intervertebral disc.1,17 A similar statement was made by Hwang et al4 who found it a useful distinguishing feature from marrow infiltration. As most primary bone tumours and metastatic deposits also show low T1W SI relative to marrow, confusion may arise resulting in potential misdiagnosis. In the current series, all lesions showed low T1W TSE SI relative to marrow, but importantly all were isointense (22.2%) or hyperintense (77.4%) to adjacent skeletal muscle as highlighted in Table 3. Only three cases in Table 1 definitively report these T1W SE SI characteristics when compared to skeletal muscle. Therefore, we propose using skeletal muscle as the internal standard for T1W SE SI reference. This has been previously suggested as a reliable way of differentiating marrow hyperplasia from marrow infiltration, with a high sensitivity, specificity and accuracy.17 All lesions bar one showed low T2W FSE SI compared to adjacent bone marrow. This is the current T2W SI reference standard for marrow lesions, and we propose this remains so. Table 1 also indicates varied STIR SI for FNMH. In the current series, 58.5% of lesions were mildly hyperintense to marrow, while 40.7% were isointense and therefore not visible. The reason for this variation is unclear, but one possibility is that lesions with no increased STIR SI represent a more fibrotic and less haematopoietically active form of FNMH. A few cases exhibited very prominent STIR hyperintensity, perhaps being more haematopoietically active. To the best of our knowledge, there is no literature commenting on histological variations of FNMH. Most MRI studies were performed externally on a 1.5T scanner, with the majority of follow-up studies performed at our institution on a 3T scanner. It is reported that imaging at 3T provides better contrast visualisation between normal and abnormal marrow.18 As skeletal muscle is the internal reference standard for SI comparison, it can be used to differentiate between infiltrative marrow, normal marrow and FNMH with higher accuracy at 3T compared to 1.5T.18
The 'bull's-eye sign' refers to one or more foci of fat in the centre of a hypointense bone lesion thought to be characteristic of red marrow, reflecting the centrifugal pattern of red-to-yellow marrow conversion.19 Alyas et al described FNMH in the spine to be mainly within areas rich in red marrow (e.g., sub-cortical and around the basi-vertebral vein), appearing slightly elongated with a high T1W central spot and slightly fuzzy edges.20 In our series, only 3 of 31 FNMH vertebral body lesions exhibited a definite central ‘bull's eye sign’, questioning its value. The majority showed varying amounts of inter-digitating yellow marrow dispersed throughout the lesion rather than centrally.
With regard to vertebral location, 12.9, 58.1 and 29% of all spinal lesions where seen in the anterior, central and posterior thirds of the vertebral body, respectively. This may be a useful finding to aid differentiation of FNMH from metastatic lesions, which tend to be located in the posterior aspect of the vertebral body just anterior to the pedicle.21 Pedicle involvement is traditionally considered an indicator of malignancy but was seen in 31% of FNMH cases involving the posterior vertebral body. Peri-lesional oedema was never seen, which is an important discriminator on T2W/STIR sequences between FNMH and osteoblastic metastases. Such marginal oedema results in a ‘halo-target sign’ consisting of a hyperintense rim around a lesion of low SI on T2W sequences, which is highly specific for osteoblastic metastases.19 Conventional MRI sequences are also useful in analysing lesion morphology. In the current series, most lesions were relatively small with a mean maximal dimension of just under 2 cm. Most were slightly poorly defined and oval/circular in shape. All except three cases had slightly poorly defined margins. Sharp margins have been attributed to advanced and well-established marrow reconversion, and poorly defined margins if the reconversion process is limited.22 Other than osteoblastic metastases, the main differential diagnosis for FNMH on MRI includes atypical haemangioma and benign notochordal tumour (BNCT). Atypical haemangioma can be differentiated based on T2W/STIR SI characteristics, being hyperintense to marrow.23 Regarding haemangiomas of the cases that had CT, none showed the typical trabeculated/polka dot pattern.23 BNCT can also manifest mild medullary sclerosis on CT, but typically exhibits homogeneously low T1W and high T2W SI similar to nucleus pulposus, differing from the described MRI SI characteristics of FNMH.24 Other causes of focal medullary sclerosis include early-phase osteoblastic lymphoma and carcinoid metastases.25,26 Early-phase osteoblastic lymphoma could manifest as mild sclerosis on CT, mimicking atypical FNMH with a SI drop < 20% on OP CSI. Thus, a further MRI in 6 months should be done ensuring no change in the suspected lesion (Figure 13).
The Dixon technique has been available for over 20 years and is of great value for the assessment of indeterminate marrow lesions.27–29 It is based on CSI using IP and OP sequences to quantify the amount of fat in a lesion as manifest by the degree of SI drop between the sequences, a SI drop >20% at 1.5T on OP images typically taken as the cutoff value indicating the presence of residual fat.12–14 This is seen in marrow disorders which contain residual marrow fat, such as marrow hyperplasia, bone marrow oedema of any cause and atypical vertebral haemangiomas.29 Conversely, neoplastic marrow infiltration replaces marrow fat and will show <20% SI drop on the OP images at 1.5T.12–14 CSI was performed in 31 cases from the current series, with 28 (90.3%) showing >20% SI drop on OP images, supporting the diagnosis of FNMH due to its relatively high-fat content. Douis et al14 described the use of CSI in 57 indeterminate spinal lesions based on conventional spin echo MRI. Of these, 45 were considered to be benign with approximately 50% confirmed by histology, and the remainder appearing stable on follow-up. Using a cut-off of 20% SI drop, CSI had a sensitivity of 91.7%, specificity of 72.7% and overall accuracy of 82.5% in determining a spinal lesion as benign. They also illustrated a case which had classical conventional MRI features of FNMH showing 27.1% SI drop on OP CSI.
Similarly, Kohl et al13 analysed pelvic marrow lesions using CSI compared to biopsy results, describing similar specificity, sensitivity and diagnostic accuracy values to Douis et al. However, only one biopsied case represented FNMH, and the specific imaging characteristics were not reported. In the current study, CSI was used in 31 cases with all but three showing SI drop >20% on OP CSI, the average SI drop being 48%. Of the three cases that displayed SI drop <20% on OP CSI, two showed medullary sclerosis on CT and one was associated with a healed benign compression fracture. Van Vucht et al showed that CSI SI drop on OP images can be unreliable in healing fractures and sclerotic lesions, presumably due to the susceptibility effect of trabecular bone.29,30 As FNMH contains a variable amount of fat, CSI is an ideal diagnostic technique, but we are unaware of any studies specifically analysing the diagnostic accuracy of CSI for FNMH. However, based on the current study, we propose that all indeterminate marrow lesions on conventional spin echo MRI should be re-imaged with CSI and considered benign if the SI drop on OP images is >20% whilst remaining stable on conventional SE imaging at a 6-month interval (Figure 13). Lesions with features suggestive of FNMH on conventional SE sequences but showing SI drop <20% should have localised CT to assess for medullary sclerosis. The combined information gained from CSI and CT should be sufficient to confidently diagnose FNMH without the requirement for needle biopsy. We have proposed an imaging algorithm for diagnosing FNMH based on MRI, CSI and CT appearances (Figure 13). This is currently the imaging pathway for indeterminate marrow lesions in our institution.
Diagnosing a lesion as FNMH, especially in the setting of known primary malignancy avoids unnecessary biopsy and/or surgery. The literature review summarised in Table 1 showed that five patients underwent avoidable or excessive surgical procedures for lesions which turned out to be FNMH. The impact of misdiagnosis can therefore alter management significantly, especially if the lesion is remote from the primary tumour site. CSI should also avoid the need for serial imaging follow-up over many years, which undoubtedly adds to patient anxiety and imaging burden on the radiology department.
Almost two-thirds of cases imaged with CT showed evidence of mild poorly defined medullary sclerosis. This is consistent with previous reports.10,31 Medullary sclerosis may contribute to the reduced SI of FNMH seen on T2W TSE and STIR sequences, as well as accounting for <20% SI drop on OP CSI.
All cases with SPECT-CT and whole-body FDG PET-CT showed increased uptake. Bordalo-Rodrigues et al6 and Shigematsu et al9 have described focal areas of red marrow in the spine showing uptake on FDG PET-CT which has been attributed to glucose transport up-regulation and metabolism in cells in regions of FNMH. However, osseous metastases also show FDG PET-CT uptake which can cause potential confusion. Shigematsu et al9 suggested that if the SUVmax of a bone lesion was greater than 3.6, the lesion should be considered metastatic. In our series, one case had a SUVmax of 3.7. Shigematsu et al9 also described FNMH as having no uptake on bone scintigraphy. However, almost all cases that underwent CT showed sclerosis, and the authors state that it is unclear why the lesions did not exhibit increased uptake. Two of their cases showed restricted diffusion on MRI, and they speculate that variations in the amount of intra-lesional cellularity could account for differences in osteoblastic reaction, and therefore 99mTc-MDP tracer uptake. Three of eight (37.5%) cases in the current series showed increased uptake on bone scintigraphy, with two appearing sclerotic on CT. Thus, some FNMH lesions appear 'cold' while others are 'hot' on bone scintigraphy. FNMH showing increased uptake on SPECT-CT is also reported, with one case report using indium chloride tracer.10 Indium is a known target for bone marrow but has traditionally been used in bone scintigraphy rather than SPECT-CT. Iron radionuclides are ideal physiologically but unsuitable given their high energy radiation. Indium has a similar biological behaviour to iron, but with more desirable energy characteristics making it suitable for clinical use.10
The current study has several limitations. The results are based on a combination of review of imaging reports by senior radiologists and re-review of imaging by a musculoskeletal radiology fellow and therefore there was no inter-observer correlation of imaging features. Moreover, the retrospective nature has resulted in analysing many external MRI scans referred for review in the musculoskeletal and spinal oncology MDTM, with variable image quality and sequences. The large number of external referrals illustrates the difficulty in making the diagnosis of this benign lesion. However, a T1W TSE, T2W FSE and STIR sequence were available in all cases. A more significant limitation is that only one case had histological confirmation of FNMH, the remaining cases diagnosed by imaging alone based on comparison with previously reported imaging features. However, this was supported by a stable appearance in those lesions with a minimum of 6-month follow-up, a criterion that has been used previously to define the benign nature of an indeterminate marrow lesion.14 Following the introduction of CSI at our institution, the additional finding of >20% SI drop on OP images was taken as being diagnostic of FNMH when there were no other features to suggest a diagnosis of atypical haemangioma. The combination of the above findings made it very difficult to justify needle biopsy.
In conclusion, FNMH represents localised prominent hypertrophy of red marrow which can mimic a primary bone tumour or metastasis. Unlike diffuse marrow hyperplasia, the imaging features have not been previously well-documented. The current series demonstrates that FNMH is fairly commonly encountered in the setting of a musculoskeletal or spinal oncology service and can occur in a wide variety of skeletal locations. The conventional spin echo MRI SI characteristics and morphology have been described, as have the appearances on CT and various nuclear medicine techniques. Also, the potential for CSI to confirm a diagnosis of FNMH due to its relatively high-fat content has been emphasised.
Contributor Information
Ramanan Rajakulasingam, Email: ramanan.rajakulasingam1@nhs.net.
Asif Saifuddin, Email: asif.saifuddin@nhs.net.
REFERENCES
- 1.Vande Berg BC, Lecouvet FE, Galant C, Maldague BE, Malghem J. Normal variants and frequent marrow alterations that simulate bone marrow lesions at MR imaging. Radiol Clin North Am 2005; 43: 761–70. doi: 10.1016/j.rcl.2005.01.007 [DOI] [PubMed] [Google Scholar]
- 2.Nouh MR, Eid AF. Magnetic resonance imaging of the spinal marrow: basic understanding of the normal marrow pattern and its variant. World J Radiol 2015; 7: 448–58. doi: 10.4329/wjr.v7.i12.448 [DOI] [PMC free article] [PubMed] [Google Scholar]
- 3.Vande Berg BC, Lecouvet FE, Galant C, Simoni P, Malghem J. Normal variants of the bone marrow at MR imaging of the spine. Semin Musculoskelet Radiol 2009; 13: 087–96. doi: 10.1055/s-0029-1220879 [DOI] [PubMed] [Google Scholar]
- 4.Hwang S, Panicek DM. Magnetic resonance imaging of bone marrow in oncology, part 1. Skeletal Radiol 2007; 36: 913. doi: 10.1007/s00256-007-0309-3 [DOI] [PubMed] [Google Scholar]
- 5.Del Grande F, Farahani SJ, Carrino JA, Chhabra A. Bone marrow lesions: a systematic diagnostic approach. Indian J Radiol Imaging 2014; 24: 279–87. doi: 10.4103/0971-3026.137049 [DOI] [PMC free article] [PubMed] [Google Scholar]
- 6.Bordalo-Rodrigues M, Galant C, Lonneux M, et al. Focal nodular hyperplasia of the hematopoietic marrow simulating vertebral metastasis on FDG positron emission tomography. AJR Am J Roentgenol 2007; 180: 669–71. [DOI] [PubMed] [Google Scholar]
- 7.Pui MH, Tan MH, Kuan JH, Pho RW. Haematopoietic marrow hyperplasia simulating transarticular SKIP metastasis in osteosarcoma. Australas Radiol 1995; 39: 303–5. doi: 10.1111/j.1440-1673.1995.tb00299.x [DOI] [PubMed] [Google Scholar]
- 8.Chow LTC, Ng AWH, Wong SKC. Focal nodular and diffuse haematopoietic marrow hyperplasia in patients with underlying malignancies: a radiological mimic of malignancy in need of recognition. Clin Radiol 2017; 72: 265.e7–365. doi: 10.1016/j.crad.2016.10.015 [DOI] [PubMed] [Google Scholar]
- 9.Shigematsu Y, Hirai T, Kawanaka K, Shiraishi S, Yoshida M, Kitajima M, et al. Distinguishing imaging features between spinal hyperplastic hematopoietic bone marrow and bone metastasis. AJNR Am J Neuroradiol 2014; 35: 2013–20. doi: 10.3174/ajnr.A4012 [DOI] [PMC free article] [PubMed] [Google Scholar]
- 10.Tanaka T, Gobara H, Inai R, Iguchi T, Tada A, Sato S, et al. A case of focal bone marrow reconversion mimicking bone metastasis: The value of 111Indium Chloride. Acta Med Okayama 2016; 70: 285–9. doi: 10.18926/AMO/54505 [DOI] [PubMed] [Google Scholar]
- 11.Yasuda H, Shimura T, Okigami M, Yoshiyama S, Ohi M, Tanaka K, et al. Esophageal cancer with bone marrow hyperplasia mimicking bone metastasis: report of a case. Case Rep Oncol. 2016;. ; 9: 679–84. Sep-DeceCollection2016. doi: 10.1159/000449525 [DOI] [PMC free article] [PubMed] [Google Scholar]
- 12.Disler DG, McCauley TR, Ratner LM, Kesack CD, Cooper JA. In-Phase and out-of-phase MR imaging of bone marrow: prediction of neoplasia based on the detection of coexistent fat and water. AJR Am J Roentgenol 1997; 169: 1439–47. doi: 10.2214/ajr.169.5.9353477 [DOI] [PubMed] [Google Scholar]
- 13.Kohl CA, Chivers FS, Lorans R, Roberts CC, Kransdorf MJ. Accuracy of chemical shift MR imaging in diagnosing indeterminate bone marrow lesions in the pelvis: review of a single institution's experience. Skeletal Radiol 2014; 43: 1079–84. doi: 10.1007/s00256-014-1886-6 [DOI] [PubMed] [Google Scholar]
- 14.Douis H, Davies AM, Jeys L, Sian P. Chemical shift MRI can aid in the diagnosis of indeterminate skeletal lesions of the spine. Eur Radiol 2016; 26: 932–40. doi: 10.1007/s00330-015-3898-6 [DOI] [PubMed] [Google Scholar]
- 15.Altehoefer C, Bertz H, Ghanem NA, Langer M. Extent and time course of morphological changes of bone marrow induced by granulocyte-colony stimulating factor as assessed by magnetic resonance imaging of healthy blood stem cell donors. J Magn Reson Imaging 2001; 14: 141–6. doi: 10.1002/jmri.1164 [DOI] [PubMed] [Google Scholar]
- 16.Padhani AR, Gogbashian A. Bony metastases: assessing response to therapy with whole-body diffusion MRI. Cancer Imaging 2011; 11 Spec No A ((1A): S129–45Spec No A. doi: 10.1102/1470-7330.2011.9034 [DOI] [PMC free article] [PubMed] [Google Scholar]
- 17.Carroll KW, Feller JF, Tirman PF. Useful internal standards for distinguishing infiltrative marrow pathology from hematopoietic marrow at MRI. J Magn Reson Imaging 1997; 7: 394–8. doi: 10.1002/jmri.1880070224 [DOI] [PubMed] [Google Scholar]
- 18.Zhao J, Krug R, Xu D, Lu Y, Link TM. Mri of the spine: image quality and normal-neoplastic bone marrow contrast at 3 T versus 1.5 T. AJR Am J Roentgenol 2009; 192: 873–80. doi: 10.2214/AJR.08.1750 [DOI] [PubMed] [Google Scholar]
- 19.Schweitzer ME, Levine C, Mitchell DG, Gannon FH, Gomella LG. Bull's-eyes and halos: useful Mr discriminators of osseous metastases. Radiology 1993; 188: 249–52. doi: 10.1148/radiology.188.1.8511306 [DOI] [PubMed] [Google Scholar]
- 20.Alyas F, Saifuddin A, Connell D. Mr imaging evaluation of the bone marrow and marrow infiltrative disorders of the lumbar spine. Magn Reson Imaging Clin N Am 2007; 15: 199–219. doi: 10.1016/j.mric.2007.03.002 [DOI] [PubMed] [Google Scholar]
- 21.Algra PR, Heimans JJ, Valk J, Nauta JJ, Lachniet M, Van Kooten B, et al. Do metastases in vertebrae begin in the body or the pedicles? imaging study in 45 patients. AJR Am J Roentgenol 1992; 158: 1275–9. doi: 10.2214/ajr.158.6.1590123 [DOI] [PubMed] [Google Scholar]
- 22.Levine CD, Schweitzer ME, Ehrlich SM. Pelvic marrow in adults. Skeletal Radiol 1994; 23: 343–7. doi: 10.1007/BF02416990 [DOI] [PubMed] [Google Scholar]
- 23.Hoyle JM, Layfield LJ, Crim J. The lipid-poor hemangioma: an investigation into the behavior of the "atypical" hemangioma. Skeletal Radiol 2020; 49: 93–100. doi: 10.1007/s00256-019-03257-2 [DOI] [PubMed] [Google Scholar]
- 24.Tateda S, Hashimoto K, Aizawa T, Kanno H, Hitachi S, Itoi E, et al. Diagnosis of benign notochordal cell tumor of the spine: is a biopsy necessary? Clin Case Rep 2018; 6: 63–7. doi: 10.1002/ccr3.1287 [DOI] [PMC free article] [PubMed] [Google Scholar]
- 25.Lim CY, Ong KO. Imaging of musculoskeletal lymphoma. Cancer Imaging 2013; 13;):: 448–5711;. doi: 10.1102/1470-7330.2013.0036 [DOI] [PMC free article] [PubMed] [Google Scholar]
- 26.Manoli RS, Barthelemy CR. Osteolytic and osteoblastic metastases due to carcinoid tumors. Clin Nucl Med 1980; 5: 102–5. doi: 10.1097/00003072-198003000-00004 [DOI] [PubMed] [Google Scholar]
- 27.Dreizin D, Ahlawat S, Del Grande F, Fayad LM. Gradient-Echo in-phase and opposed-phase chemical shift imaging: role in evaluating bone marrow. Clin Radiol 2014; 69: 648–57. doi: 10.1016/j.crad.2014.01.027 [DOI] [PubMed] [Google Scholar]
- 28.Pezeshk P, Alian A, Chhabra A. Role of chemical shift and Dixon based techniques in musculoskeletal MR imaging. Eur J Radiol 2017; 94: 93–100. doi: 10.1016/j.ejrad.2017.06.011 [DOI] [PubMed] [Google Scholar]
- 29.van Vucht N, Santiago R, Lottmann B, Pressney I, Harder D, Sheikh A, et al. The Dixon technique for MRI of the bone marrow. Skeletal Radiol 2019; 48: 1861–74. doi: 10.1007/s00256-019-03271-4 [DOI] [PubMed] [Google Scholar]
- 30.van Vucht N, Santiago R, Pressney I, Saifuddin A. Anomalous signal intensity increase on out-of-phase chemical shift imaging: a manifestation of marrow mineralisation? Skeletal Radiol 2020;20 Mar 2020[Epub ahead of print]. doi: 10.1007/s00256-020-03420-0 [DOI] [PubMed] [Google Scholar]
- 31.Okuyama C, Higashi T, Ishizu K, Nakamoto R, Takahashi M, Kusano K, et al. Bone Pseudometastasis on 18F-FDG PET in Japanese patients with esophageal cancer. Clin Nucl Med 2019; 44: 771–6. doi: 10.1097/RLU.0000000000002625 [DOI] [PubMed] [Google Scholar]


