Abstract
Objective:
To explore the value of related parameters in monoexponential, biexponential, and stretched-exponential models of diffusion-weighted imaging (DWI) in differentiating metastases and myeloma in the spine.
Methods:
53 metastases and 16 myeloma patients underwent MRI with 10 b-values (0–1500 s/mm2). Parameters of apparent diffusion coefficient (ADC), true diffusion coefficient (D), pseudo-diffusion coefficient (D*), perfusion fraction (f), the distribution diffusion coefficient (DDC), and intravoxel water diffusion heterogeneity (α) from DWI were calculated. The independent sample t test and the Mann–Whiney U test were used to compare the statistical difference of the parameter values between the two. Receiver operating characteristics (ROC) curve analysis was used to identify the diagnostic efficacy. Then substituted each parameter into the decision tree model and logistic regression model, identified meaningful parameters, and evaluated their joint diagnostic performance.
Results:
The ADC, D, and α values of metastases were higher than those of myeloma, whereas the D* value was lower than that of myeloma, and the difference was significant (p < 0.05); the area under the ROC curve for the above parameters was 0.661, 0.710, 0.781, and 0.743, respectively. There was no significant difference in the f and DDC values (p > 0.05). D and α were found to conform to the decision tree model, and the accuracy of model diagnosis was 84.1%. ADC and α were found to conform to the logistic regression model, and the accuracy was 87.0%.
Conclusion:
The 3 models of DWI have certain values indifferentiating metastases and myeloma in spine, and the diagnostic performance of ADC, D, α and D*was better. Combining ADC with α may markedly aid in the differential diagnosis of the two.
Advances in knowledge:
Monoexponential, biexponential, and stretched-exponential models can offer additional information in the differential diagnosis of metastases and myeloma in the spine. Decision tree model and logistic regression model are effective methods to help further distinguish the two.
Introduction
Metastases and myeloma are commonly seen malignant tumors in spine, which are common in the elderly and both present as single or multiple lesions. The conventional imaging manifestations of the two are similar. Moreover, spine bears the weight of the human body, when bone destruction occurs, that compression changes can easily develop, which makes the imaging signs of spinal tumors more atypical in nature and further increases the difficulty of diagnosis.1–5 However, the treatment and prognosis of metastases and myeloma differ. Hence, the correct diagnosis and more appropriate differential diagnosis are vital in these cases.6–9
MRI is increasingly being applied in various systems of the body, owing to its excellent soft-tissue contrast. Diffusion-weighted imaging (DWI) is an important component of MRI functional imaging. DWI can indicate the pathological and physiological information of the lesion on the basis of the microscopic mobility of water by measuring the apparent diffusion coefficient (ADC) value, this represents a monoexponential model. However, the ADC generated by the monoexponential model may be susceptible to tissue microcirculation perfusion, and does not accurately reflect the diffusion limitation of the molecules.10 Biexponential model, which using a more sophisticated approach to describe the relationship between signal attenuation in tissues with increasing b-value, would enable quantitative parameters that separately reflect tissue diffusivity and tissue microcapillary perfusion to be estimated.11,12 Moreover, some researchers believe that the biexponential model reflects the motion of two proton pools, and thus lacks objectivity and does not consider the effect of phase shifts, eddy currents, and other factors. Therefore, Bennett et al.13 proposed the use of a stretched-exponential model. The intravoxel diffusion rate measured by the DWI of the stretched-exponential model is more consistent with the diffusion heterogeneity and multi-interval of water molecules in living tissues; hence, the model reflects the diffusion condition of the motion of continuously distributed water molecules in the microenvironment interval.14
At present, the monoexponential model, biexponential model, and stretched-exponential model are widely used in the qualitative diagnosis and differential diagnosis of craniocerebral and body lesions, but are only rare used in spinal lesions. In the present study, we aimed to assess the differential diagnosis value of monoexponential, biexponential, and stretched-exponential models of DWI between metastases and myeloma in the spine.
Methods and materials
Patients
Patients with suspected metastases or myeloma in the spine who underwent conventional MRI examinations from March 2016 to March 2018 were selected to undergo DWI with multiple b-values, after informed consent was obtained. The inclusion criterion was as follows: biopsy or surgical pathology confirmed the presence of metastases or myeloma in the spine. The exclusion criteria were as follows: history of interventional therapy such as radiotherapy, chemotherapy, or radiofrequency ablation before the examination; large image artifacts due to poor patient cooperation; presence of smaller lesions (<1 cm in diameter), resulting in inaccurate measurements; and lack of pathological results. Thus, a total of 69 patients were finally enrolled (43 males and 26 females; average age, 56.8 ± 9.2 years).53 patients (32 males and 21 females, with an average age of 56.8 ± 8.1) with metastatic tumorwere enrolled. Primary tumors were liver cancer (1 case), lung adenocarcinoma (25 cases), prostate cancer (4 cases), thyroid cancer (2 cases), renal clear cell carcinoma (8 cases), gastric cancer (2 cases), rectal cancer (3 cases), breast cancer (6 cases), and esophageal cancer (2 cases). There were 22 cases of single lesion and 31 cases of multiple lesions. There were 16 cases of myeloma (11 males and 5 females, with an average age of 56.8 ± 12.4), 9 cases of single lesions, and 7 cases of multiple lesions. The age difference between the two groups was not statistically significant (t = 0.075, p = 0.941).
MRI scanning sequence
Imaging was performed using the GE Healthcare Discovery 750 3.0 T MR scanner and 8-channel cervical, thoracic and lumbar (CTL) combined coil. Conventional sequence scanning was used to help locate the lesion. The conventional sequence scanning parameters were tabulated in Table 1. For patients with multiple lesions, the largest diameter lesion was selected for DWI scanning.
Table 1.
Parameters of MR conventional sequence scanning
| Sequence | TR/TE (ms) | FOV (cm) | ST (mm) | Matrix | BW (±kHz) |
|---|---|---|---|---|---|
| FRFSE T2WI ax | 2800–4341/98–142 | 20 × 20–36 × 36 | 3.0 | 288 × 288 | 62.5 |
| FST T1WI sag | 500–642/8–11 | 28 × 28–36 × 36 | 3.0 | 320 × 320 | 62.5 |
| IDEAL T2WI sag | 3000/69 | 28 × 28–36 × 36 | 3.0 | 320 × 192 | 83.3 |
| FRFSE T2WI FS | 2409–3100/88–98 | 28 × 28–36 × 36 | 3.0 | 320 × 224 | 50.0 |
TR/TE: repetition time/echo time; FOV: field of view; ST:slice thickness; BW: bandwidth; ax: axial view; sag: sagittal view.
DWI was performed via axial free-breathing spin-echo echoplanar imaging (SE-EPI), with the following parameters: TR/TE, 3000/64 ms; slice thickness, 4.0 mm; intersection gap, 0.4 mm; bandwidth, 250.0 kHz; field of view, 24 × 24 cm; matrix, 128 × 64. A parallel imaging factor of 3 was used, along with 10 b-values (0, 20, 50, 100, 150, 200, 400, 800, 1200, and 1500 s/mm2). The number of excitation (NEX) was 2, 2, 2, 1, 1, 1, 2, 4, 6, and 8. The acquisition time was 252 s.
Image analysis
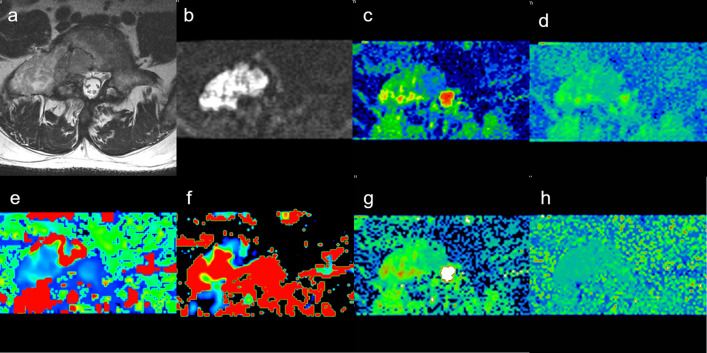
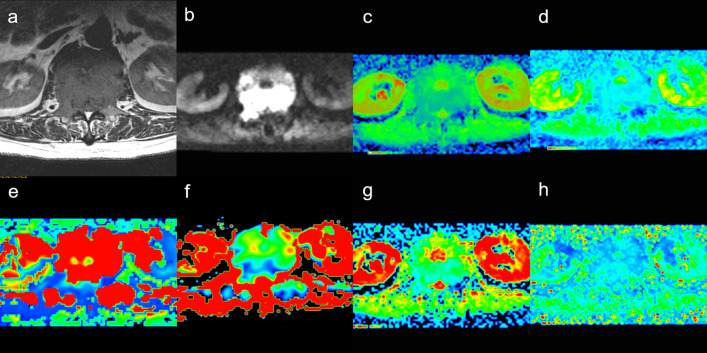
Two radiologists with 10 and 8 years of experience in the diagnosis of skeletal system diseases respectively reviewed the images with the GE AW4.5 workstation. The observers had access to all MR images to assist in locating the lesions and verifying the lesion boundaries. The region of interest was placed on the high signal area of the axis on DWI (b = 1200 or 1500 s/mm2), which ranged from 0.5 to 1.0 cm2, avoiding lesion edge and hemorrhage, necrosis, calcification, and cystoid degeneration in the lesions.The Functool MADC software of the workstation was used to generate the ADC, true diffusion coefficient (D), pseudo-diffusion coefficient (D*), perfusion fraction (f), the distribution diffusion coefficient (DDC), and intravoxel water diffusion heterogeneity (α) values with the b-value DWI sequence(Figure 1 is pseudo-color diagrams of the parameters of metastases. Figure 2 is of myeloma).
Figure 1.
Male, 55 years old, L5 metastases from adenocarcinoma of lung. (a) T2WI showing bone metastases ofvertebrae. (b) Mapping of the signal intensity of the lesion was high when b = 1200 s/mm2. (c) The average ADC value was 0.100 × 10⁻³ mm2/s. (d) Mapping of the estimated value of the D parameter, the average value in the lesion was 0.813 × 10⁻³ mm2/s. (e) Mapping of the estimated value of the D* parameter, the average value was 5.500 × 10⁻³ mm2/s. (f) Mapping of the perfusion-related diffusion fraction (f) with a value of 23.3%. (g) Mapping of the estimated value of the DDC parameter, the average value was 1.050 × 10⁻³ mm2/s. (h) Intravoxel water diffusion heterogeneity (α) value was 0.805. ADC, apparent diffusion coefficient.
Figure 2.
Male, 60 years old, L4 myeloma. (a) T2WI showing bone destrction ofvertebrae. (b) Mapping of the signal intensity of the lesion was high when b = 1200 s/mm2. (c) The average ADC value was 0.092 × 10⁻³ mm2/s. (d) Mapping of the estimated value of the D parameter, the average value in the lesion was 0.668 × 10⁻³ mm2/s. (e) Mapping of the estimated value of the D* parameter, the average value was 23.800 × 10⁻³ mm2/s. (f) Mapping of the perfusion-related diffusion fraction (f) with a value of 19.8%. (g) Mapping of the estimated value of the DDC parameter, the average value was0.918 × 10−3 mm2/s. (h) intravoxel water diffusion heterogeneity (α) value was 0.591. ADC, apparent diffucions coefficient.
The monoexponential model usually collects the signal strength of high and low b-values, and calculates the ADC value that reflects the diffusion data of water molecules in the living body. The formula is as follows:
| (1) |
The formula for the biexponential model is as follows:
| (2) |
D is the tissue diffusivity (D/slow ADC) that reflects the simple movement of water molecules in the tissue (units: mm2/s). D* is a pseudo-diffusion coefficient (D*/fast ADC) that is associated with microcirculation perfusion in tissues, and is affected by geometrical capillary shapes and blood flow velocity (units:mm2/s). f is the perfusion fraction (f) and presents the proportion of microcirculation perfusion in the whole voxel signal attenuation process.15
The formula for the stretched-exponential model is as follows:
| (3) |
| DDC is a distributed diffusion coefficient (DDC), which can be considered as a conforming parameter of the continuous distribution of each ADC weighted by the volume fraction of water molecules (mm2/s). α reflects the diffusion heterogeneity of water molecules in voxels, ranging from 0 to 1. When the value of α is closer to 1, the stretched-exponential model is closer to the monoexponential model, indicating that the diffusion component is single and the homogeneity is high.13 |
Statistical analysis
Statistical analysis was performed using SPSS 23.0 (Chicago, IL) software. The Kolmogorov–Smirnov test was used to analyze the normal distribution of quantitative parameters. Then with the Levene test for variance homogeneity analysis. Two independent samples t-tests were usedto compare normal distribution data, and the Mann–Whitney U-test was used to compare nonnormal distribution parameters from DWI (ADC, D, D*, DDC,α) between metastases and myelomalesioins. Moreover, receiver operating characteristics (ROC) analysis was performed to evaluate the ability of each parameter in the differential diagnosis of metastases and myeloma. p < 0.05 was considered statistically significant. Multivariate analysis employed a decision tree model and logistic model to select significant variables. The growth pattern of the tree was selected (classification regression tree; CAT), with a maximum tree depth of 5, number of parent nodes as 10, and number of child nodes as 5; the tree was trimmed to prevent over fitting, and the maximum risk difference (standard error) was set to 1. The logistic regression models used binary logistic regression with the Backward Stepwise (Wald) method, 0.05 as the entry criterion, and 0.1 as the exclusion criterion.
Interobserver agreement for the diffusion parameter measurements was assessed by using the intraclass correlation coefficient (ICC) and was interpreted as follows: 0.00–0.20, poor agreement; 0.21–0.40, fair agreement; 0.41–0.60, moderate agreement; 0.61–0.80, good agreement; and 0.81–1.00, excellent agreement.
Results
Interobserver agreement
The ADC, D, D*, f, and α values showed excellent intra- and interobserver agreements (ICC, 0.845–0.980, all p < 0.001) (Table 2).
Table 2.
Intra- and interobserver agreement of different model parameters measurement
| Intraobserver ICC(95% CI) | Interobserver ICC(95% CI) | ||||
|---|---|---|---|---|---|
| Parameter | ICC | 95% CI | ICC | 95% CI | p-value |
| ADC | 0.916 | 0.851, 0.953 | 0.845 | 0.741, 0.910 | <0.001* |
| D | 0.978 | 0.962, 0.988 | 0.958 | 0.926, 0.976 | <0.001* |
| D* | 0.980 | 0.965, 0.989 | 0.961 | 0.933, 0.965 | <0.001* |
| f | 0.947 | 0.906, 0.970 | 0.900 | 0.829, 0.942 | <0.001* |
| DDC | 0.964 | 0.937, 0.980 | 0.931 | 0.881, 0.961 | <0.001* |
| α | 0.969 | 0.946, 0.983 | 0.941 | 0.897,m0.966 | <0.001* |
ADC, apparent diffusion coefficient; D, true diffusion coefficient; D*, pseudo diffusion coefficient; f, perfusion fraction; DDC, distributed diffusion coefficient; α, intravoxel water diffusion heterogeneity; ICC, intraclass correlation coefficient; CI, confidence interval. *p < 0.05.
Univariate analysis
The distribution characteristics of the parameters for metastases and myeloma, and the comparison between the groups are shown in Table 3. The ADC value, D value, and α value of metastases were higher than those of myeloma, and the differences were statistically significant. The D* value of metastases was less than that of myeloma, and the difference was significant. The f values of metastases and myeloma were close, and the differences were not significant. The DDC value of the metastases was greater than that of the myeloma, and the difference was not significant.
Table 3.
Comparison of different model parameters, including ADC, D, D*, f, DDC, and α, between metastases and myeloma (`X ± S)
| Parameter | Metastases | Myeloma | P |
|---|---|---|---|
| ADC (10−3mm2/s) | 1.0 ± 0.30 | 0.8 ± 0.24 | 0.034 |
| D (10−3mm2/s) | 0.8 ± 0.19 | 0.7 ± 0.15 | 0.012 |
| D* (10−3mm2/s) | 15.0 ± 13.9 | 23.1 ± 13.8 | 0.04 |
| f | 0.22 ± 0.09 | 0.22 ± 0.04 | 0.95 |
| DDC (10−3mm2/s) | 1.0 ± 0.3 | 0.9 ± 0.2 | 0.137 |
| α | 0.75 ± 0.11 | 0.66 ± 0.09 | 0.00 |
ADC, apparent diffusion coefficient; D, true diffusion coefficient; D*, pseudo diffusion coefficient; f, perfusion fraction; DDC, distributed diffusion coefficient; α, intravoxel water diffusion heterogeneity;
Unless otherwise noted, data are means ± standard deviations.
The efficacy of DWI parameters for the differential diagnosis of metastases and myeloma is shown in Table 4. Among these, D and α are more valuable in identifying metastases and myeloma, as compared to several other parameters. For D, with an α cut-off point of 0.67 × 10⁻³ mm2/s, the diagnostic sensitivity is 69.8% and specificity is 75%. With an α cut-off point of 0.74, the sensitivity and specificity of diagnosis were 68.0 and 93.8%, respectively. For D*, with an α cut-off point of 8.4 × 10⁻³ mm2/s, the diagnostic sensitivity is 93.8% and specificity is 49.0% (Figure 3).
Table 4.
Efficacy of DWI parameters in the differential diagnosis of metastases and myeloma
| Quantitative | AUC | Parameter cut-off value | Sensitivity (%) | Specificity (%) |
|---|---|---|---|---|
| ADC (10−3mm2/s) | 0.661 | 0.92 | 56.6 | 81.3 |
| D (10−3mm2/s) | 0.710 | 0.67 | 69.8 | 75.0 |
| D* (10−3mm2/s) | 0.257 | 15.0 | 34.0 | 43.8 |
| α | 0.781 | 0.74 | 68.0 | 93.8 |
α, intravoxel water diffusion heterogeneity;ADC, apparent diffusion coefficient; D*, pseudo-diffusion coefficient; D, true diffusion coefficient.
Figure 3.
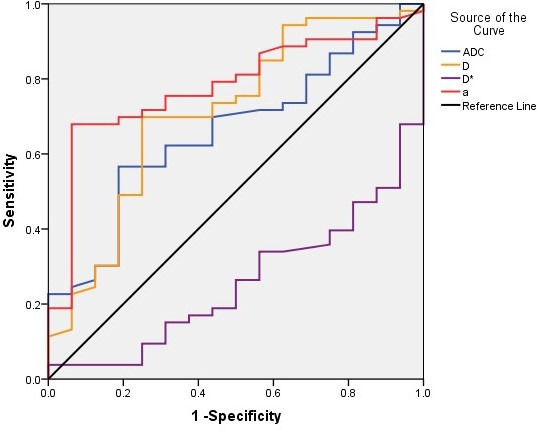
Sensitivity and specificity curves of quantitative DWI parameters for the differential diagnosis of metastases and myeloma. The area under the curve for α, D, ADC and D* was significantly, whereas that for α was the largest. ADC, apparent diffusion coefficient; DWI, diffusioin-weighted imaging.
Decision tree model and logistic regression model for the multivariate analysis of the differential diagnosis of myeloma and metastases.
Decision tree model
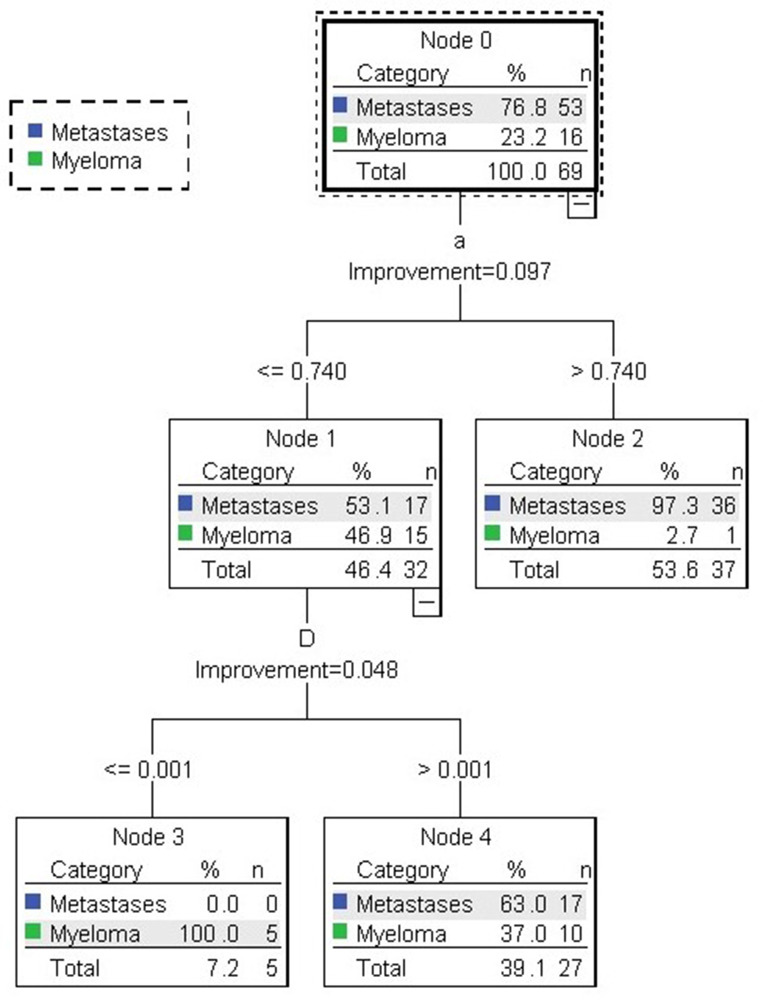
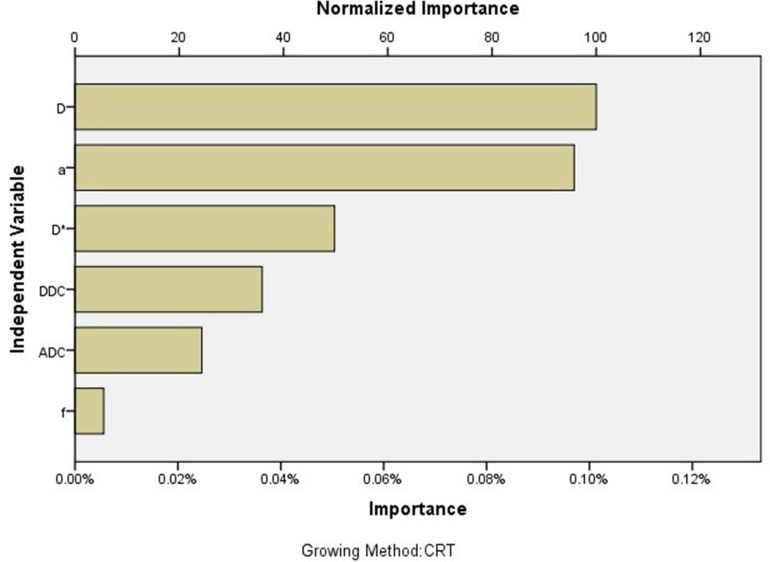
Using ADC, D, D*, f, and α as independent variables, and group as the dependent variable (Group 1 for metastases and Group 2 for myeloma) for decision tree analysis, the growth pattern of the tree was selected (classification regression tree; CAT), with a maximum tree depth of 5, number of parent nodes as 10, and number of child nodes as 5; the tree was trimmed to prevent over fitting, and the maximum risk difference (standard error) was set to 1. The decision tree model is shown in Figure 4, and α and D were the independent variables selected into the tree. The maximum tree depth was 2, the number of nodes was 5, and the number of terminal nodes was 3. The accuracy of the decision tree model for the discrimination of metastases was 100%, the accuracy of the model for the discrimination of myeloma was 31.3%, and overall accuracy was 84.1% (Table 5). The contribution of each parameter to the differential diagnosis of metastases and myeloma is shown in Figure 5.
Figure 4.
Decision tree model identifying metastases and myeloma. In the first layer of the decision tree, 36/53 cases of metastases were selected by factor α and in the next layer, 17/53 cases of metastases and 5/16 cases of myeloma were further selected by factor D.
Table 5.
The accuracy of the decision tree model in predicting myeloma and metastases
| Predicted outcome | |||
|---|---|---|---|
| Metastases | Myeloma | Overall accuracy | |
| Metastases | 53 | 0 | 100% |
| Myeloma | 11 | 5 | 31.3% |
| Total | 92.8% | 7.2% | 84.1% |
Figure 5.
The contribution of each parameter to the decision tree model; the contribution of D was largest, followed by α.
Logistic regression model
The logistic regression models used binary logistic regression with the Backward Stepwise (Wald) method, 0.05 as the entry criterion, and 0.1 as the exclusion criterion. The variables that eventually entered the model included ADC (p = 0.004) and α (p = 0.001). The accuracy rates of using this model to diagnose metastases and myeloma were 96.2 and 56.2%, respectively. The overall accuracy of the model was 87.0%.
The variables α and D selected by the decision tree model were used as independent variables, and tumor classification was used as the dependent variable in the binary logistic regression equation. The selected method was inputted, and the accuracy of the model for the diagnosis of metastases and myeloma was 96.2 and 56.2%, respectively. The accuracy of the model overall was 79.7%.
The predicted values and predicted probabilities generated by the above two regression equations were analyzed by the ROC curve, and the areas under the curve were 0.831 and 0.779, respectively (Figure 6).
Figure 6.
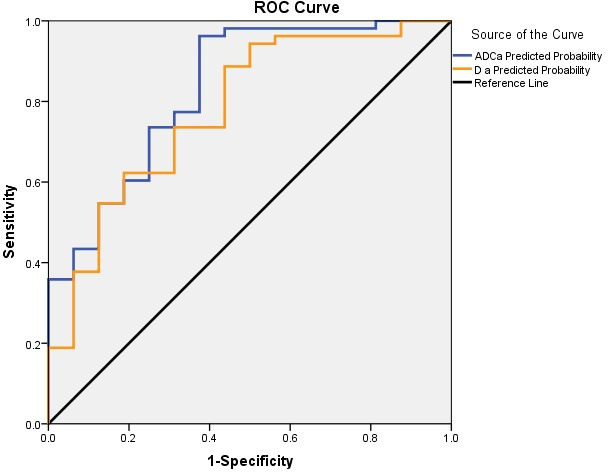
Sensitivity and specificity curves of ADC combined with α and D combined with α for the differential diagnosis of metastases and myeloma; the area under the curve for ADC combined with α was greater than that for D combined with α. ADC, apparent diffusion coefficient; ROC, receiver operating characteristic.
Discussion
In recent years, the use of multi b-value DWI in the clinical setting is becoming more common, and multiple functional parameters have derived from different post-processing models, which indirectly reflect the abnormal proliferation of tissue cells and the generation of new blood vessels, and can thus help distinguish different tumors.15 However, both biexponential and the stretched-exponential models have been widely used in the qualitative diagnosis and differential diagnosis of craniocerebral and body lesions, but have only been rarely reported in spinal lesions. This is may be due to the close relationship between the spine and adjacent tissues, and the image artifact is obvious due to peripheral respiratory movements and large vascular pulsations of the heart. In this study, the field of view in the direction of smaller phase encoding is used to reduce the image reading time, which relatively increases the bandwidth in the direction of the phase encoding line and finally increases the spatial resolution, reduces image artifacts and deformation, thus ensuring that the lesion can be observed in detail, the region of interest can be accurately selected, and the values of the various parameters can be easily determined. In our study, 10 b values were used, with b = 0,20,50,100,150,200 s/mm2 for low b values and b = 400,800,1200,1500 s/mm2 for high b values. Sufficiently low b values (<200 mm2/s)improves the extraction of perfusion-sensitive information, however, too many b values would result in overly long measurement times and would therefore be clinically unfeasible. The number and value of b values used in our study were similar to those in recent studies.16–18
Our results suggest that the differences in the ADC value, the biexponential model-derived D value, D* value and Stretched-exponential Model-derived α value of metastases and myeloma were significant. In theory, the D value obtained after removing the perfusion factor can more accurately reflect the dispersion of water molecules in different tissues, as compared to the ADC value.15 In the present study, compared to the ADC value, the D value derived from the biexponential model exhibited higher efficiency in the differential diagnosis of spinal metastases and myeloma. This finding is consistent with the research results of Sungmin Woo19 who examined the different histological grades of hepatocellular carcinoma, as well as with those of Bai20 who studied multiple b-value DWI in high- and low-grade gliomas. Bai found that the ADC and D values of high-grade gliomas were less than those of low-grade gliomas, which may be related to the higher cell density of high-grade gliomas and limited diffusion of water molecules. However, the D* value (representing the extent of perfusion) was higher in high-grade gliomas than in low-grade gliomas, which was believed to be related to the higher microvascular density of high-grade gliomas. In the present study, the ADC and D values of metastases were higher than those of myeloma, possibly due to the larger cell density of myeloma. On actual measurements, we found that the stability of D* was not good, which may be related to the influence of noise variation on the D* value. Some studies also showed that the D* value was sensitive to pulse pressure changes.21 Some studies found that the reproducibility of D* values was poor.22 However, the reproducibility of D* values in our studies was excellent according to the intraclass correlation coefficient analysis. In the stretched-exponential model, the DDC and α values of the metastases were higher than those of the myeloma, although only the α value was significantly different in the differential diagnosis of the two tumors. Bai et al20 believed that the α value in the stretched-exponential model was more meaningful than the other diffusion coefficients, such as the ADC value and D value, in terms of efficiently identifying high- and low-grade gliomas, consistent with that noted in the present study. Studies indicate that when tissues contain a large number of tiny cystic lesions, necrosis, hemorrhage, or interstitial component hyperplasia, the tissue heterogeneity is higher.22,23 Compared with myeloma, metastases are more prone to hemorrhage, necrosis, and cystic lesions.24 Hence, theoretically, metastases should have higher heterogeneity and lower α values, inconsistent with the results of this study. However, studies have also found that high-grade tumors have more complex vascular structures and inhomogenous cell morphology, which would result in higher tissue heterogeneity.20,22 Lang's study showed that myelomas had more abundant blood vessels and more complex vascular structure than metastases,25 which could explain the lower α value of myelomas relative to that of metastases. In addition, the α value reflects the heterogeneity of water molecule diffusion in the tumor tissue, and should include the entire tumor lesion as much as possible, including areas of cystic changes, necrosis, hemorrhage, and calcification. However, we avoided these regions when selecting the region of interest, which could explain our results.
After assessing the differential diagnostic efficacy of each parameter in the monoexponential, biexponential, and stretched-exponential models for metastases and myeloma, we believe that a multiparameter model can be established by selecting ≥2 meaningful parameters for a better joint diagnosis and to further improve the efficiency of differential diagnosis of the two tumors. Therefore, we used a decision tree model and logistic regression model. The decision tree model and logistic regression model are often used to establish disease prediction models, with data mining algorithms with strong causal inference capabilities; these are already widely used in the medical field.26–28 The meaningful variables selected by the decision tree model were D and α; and the overall prediction accuracy of the model was 84.1%. In the logistic regression model, the variables that were finally included in the model were ADC and α, and the overall prediction accuracy of the model was 87.0%. Moreover, we found that the prediction results of the logistic regression model were closer to the actual condition. D and α were included into the logistic regression equation, and a new logistic regression model was generated. The accuracy rates of the joint models that combined D with α for metastases and myeloma were 96.2 and 25.0%, respectively. The prediction values and prediction probabilities generated by the above two regression equations (ADC combined with α and D combined with α) were analyzed using an ROC curve, and the areas under the curve were found to be 0.831 and 0.779, respectively. These findings suggest that ADC combined with α is more valuable for the differential diagnosis of metastases and myeloma. On multivariate analysis, we found that none of the models were effective in the diagnosis of myeloma, which may be attributed to the small sample size for myeloma. In a future study, a greater number of cases with myeloma should be included, which could increase the diagnostic efficiency.
The present study has certain limitations. First, we excluded tumors <1 cm in diameter, which was necessary to avoid inaccurate measurements of various related parameters. Second, due to the limitations in the professional expertise of the research institute, fewer patients with myeloma were enrolled. Third, values were measured after manually delineating the region of interest. The region of interest was placed on the solid component of the tumor to calculate the average value. Although this may be a suitable technique, it may not be appropriate for assessing tumor heterogeneity.
In conclusion, we found that monoexponential, biexponential, and stretched-exponential models can offer additional information, relative to conventional MRI, in the differential diagnosis of metastases and myeloma in the spine. The diagnostic efficacy of α and D values was better than that of ADC, although the diagnostic efficacy of ADC combined with α was much better.
Footnotes
Funding: This study has received funding by National Natural Science Foundation of China (81971578,81701648) ,Beijing Natural Science Foundation(Z190020) and Clinical key project of Peking University Third Hospital (BYSY2018044, BYSY2018007).
Contributor Information
Xiaoying Xing, Email: xingxiaoying221@163.com.
Jiahui Zhang, Email: 2469824941@qq.com.
Yongye Chen, Email: chenyongye1995@163.com.
Qiang Zhao, Email: qiangzhao@163.com.
Ning Lang, Email: langning800129@126.com.
Huishu Yuan, Email: huishuy@sina.com.
REFERENCES
- 1.Aebi M. Spinal metastasis in the elderly. Eur Spine J 2003; 12 Suppl 2: S202–13. doi: 10.1007/s00586-003-0609-9 [DOI] [PMC free article] [PubMed] [Google Scholar]
- 2.Molina CA, Gokaslan ZL, Sciubba DM. Diagnosis and management of metastatic cervical spine tumors. Orthop Clin North Am 2012; 43: 75–87. doi: 10.1016/j.ocl.2011.08.004 [DOI] [PubMed] [Google Scholar]
- 3.Nottebaert M, von Hochstetter AR, Exner GU, Schreiber A. Metastatic carcinoma of the spine. A study of 92 cases. Int Orthop 1987; 11: 345–8. doi: 10.1007/BF00271312 [DOI] [PubMed] [Google Scholar]
- 4.Steinmetz MP, Mekhail A, Benzel EC. Management of metastatic tumors of the spine: strategies and operative indications. Neurosurg Focus 2001; 11: 1–6. doi: 10.3171/foc.2001.11.6.3 [DOI] [PubMed] [Google Scholar]
- 5.Vincent Rajkumar S. Multiple myeloma: 2014 update on diagnosis, risk-stratification, and management. Am J Hematol 2014; 89: 999–1009. doi: 10.1002/ajh.23810 [DOI] [PubMed] [Google Scholar]
- 6.Laufer I, Rubin DG, Lis E, Cox BW, Stubblefield MD, Yamada Y, et al. The NOMS framework: approach to the treatment of spinal metastatic tumors. Oncologist 2013; 18: 744–51. doi: 10.1634/theoncologist.2012-0293 [DOI] [PMC free article] [PubMed] [Google Scholar]
- 7.Moehler TM, Hawighorst H, Neben K, Egerer G, Hillengass J, Max R, et al. Bone marrow microcirculation analysis in multiple myeloma by contrast-enhanced dynamic magnetic resonance imaging. Int J Cancer 2001; 93: 862–8. doi: 10.1002/ijc.1421 [DOI] [PubMed] [Google Scholar]
- 8.Schairer WW, Carrer A, Sing DC, Chou D, Mummaneni PV, Hu SS, et al. Hospital readmission rates after surgical treatment of primary and metastatic tumors of the spine. Spine 2014; 39: 1801–8. doi: 10.1097/BRS.0000000000000517 [DOI] [PubMed] [Google Scholar]
- 9.Sundaresan N, Boriani S, Okuno S. State of the art management in spine oncology: a worldwide perspective on its evolution, current state, and future. Spine 2009; 34(22 Suppl): S7–20. doi: 10.1097/BRS.0b013e3181bac476 [DOI] [PubMed] [Google Scholar]
- 10.Koh D-M, Collins DJ. Diffusion-Weighted MRI in the body: applications and challenges in oncology. AJR Am J Roentgenol 2007; 188: 1622–35. doi: 10.2214/AJR.06.1403 [DOI] [PubMed] [Google Scholar]
- 11.Zhang S-xing, Jia Q-jun, Zhang Z-ping, Liang C-hong, Chen W-bo, Qiu Q-hui, et al. Intravoxel incoherent motion MRI: emerging applications for nasopharyngeal carcinoma at the primary site. Eur Radiol 2014; 24: 1998–2004. doi: 10.1007/s00330-014-3203-0 [DOI] [PMC free article] [PubMed] [Google Scholar]
- 12.Lemke A, Laun FB, Klauss M, Re TJ, Simon D, Delorme S, et al. Differentiation of pancreas carcinoma from healthy pancreatic tissue using multiple b-values: comparison of apparent diffusion coefficient and intravoxel incoherent motion derived parameters. Invest Radiol 2009; 44: 769–75. doi: 10.1097/RLI.0b013e3181b62271 [DOI] [PubMed] [Google Scholar]
- 13.Bennett KM, Schmainda KM, Bennett RT, Rowe DB, Lu H, Hyde JS. Characterization of continuously distributed cortical water diffusion rates with a stretched-exponential model. Magn Reson Med 2003; 50: 727–34. doi: 10.1002/mrm.10581 [DOI] [PubMed] [Google Scholar]
- 14.Kwee TC, Galbán CJ, Tsien C, Junck L, Sundgren PC, Ivancevic MK, et al. Comparison of apparent diffusion coefficients and distributed diffusion coefficients in high-grade gliomas. J Magn Reson Imaging 2010; 31: 531–7. doi: 10.1002/jmri.22070 [DOI] [PMC free article] [PubMed] [Google Scholar]
- 15.Le Bihan D, Breton E, Lallemand D, Aubin ML, Vignaud J, Laval-Jeantet M. Separation of diffusion and perfusion in intravoxel incoherent motion MR imaging. Radiology 1988; 168: 497–505. doi: 10.1148/radiology.168.2.3393671 [DOI] [PubMed] [Google Scholar]
- 16.Chandarana H, Lee VS, Hecht E, Taouli B, Sigmund EE. Comparison of biexponential and monoexponential model of diffusion weighted imaging in evaluation of renal lesions: preliminary experience. Invest Radiol 2011; 46: 285–91. doi: 10.1097/RLI.0b013e3181ffc485 [DOI] [PubMed] [Google Scholar]
- 17.Wirestam R, Borg M, Brockstedt S, Lindgren A, Holtås S, Ståhlberg F. Perfusion-related parameters in intravoxel incoherent motion MR imaging compared with CBV and CBF measured by dynamic susceptibility-contrast Mr technique. Acta Radiol 2001; 42: 123–8. doi: 10.1080/028418501127346459 [DOI] [PubMed] [Google Scholar]
- 18.Koh D-M, Collins DJ, Orton MR. Intravoxel incoherent motion in body diffusion-weighted MRI: reality and challenges. AJR Am J Roentgenol 2011; 196: 1351–61. doi: 10.2214/AJR.10.5515 [DOI] [PubMed] [Google Scholar]
- 19.Woo S, Lee JM, Yoon JH, Joo I, Han JK, Choi BI. Intravoxel incoherent motion diffusion-weighted MR imaging of hepatocellular carcinoma: correlation with enhancement degree and histologic grade. Radiology 2014; 270: 758–67. doi: 10.1148/radiol.13130444 [DOI] [PubMed] [Google Scholar]
- 20.Bai Y, Lin Y, Tian J, Shi D, Cheng J, Haacke EM, et al. Grading of gliomas by using Monoexponential, biexponential, and stretched exponential diffusion-weighted MR imaging and diffusion Kurtosis MR imaging. Radiology 2016; 278: 496–504. doi: 10.1148/radiol.2015142173 [DOI] [PMC free article] [PubMed] [Google Scholar]
- 21.Federau C, Hagmann P, Maeder P, Müller M, Meuli R, Stuber M, et al. Dependence of brain intravoxel incoherent motion perfusion parameters on the cardiac cycle. PLoS One 2013; 8: e72856–56. doi: 10.1371/journal.pone.0072856 [DOI] [PMC free article] [PubMed] [Google Scholar]
- 22.Kwee TC, Galbán CJ, Tsien C, Junck L, Sundgren PC, Ivancevic MK, et al. Intravoxel water diffusion heterogeneity imaging of human high-grade gliomas. NMR Biomed 2010; 23: 179–87. doi: 10.1002/nbm.1441 [DOI] [PMC free article] [PubMed] [Google Scholar]
- 23.Winfield JM, deSouza NM, Priest AN, Wakefield JC, Hodgkin C, Freeman S, et al. Modelling DW-MRI data from primary and metastatic ovarian tumours. Eur Radiol 2015; 25: 2033–40. doi: 10.1007/s00330-014-3573-3 [DOI] [PMC free article] [PubMed] [Google Scholar]
- 24.Moulton JS, Blebea JS, Dunco DM, Braley SE, Bisset GS, Emery KH. Mr imaging of soft-tissue masses: diagnostic efficacy and value of distinguishing between benign and malignant lesions. AJR Am J Roentgenol 1995; 164: 1191–9. doi: 10.2214/ajr.164.5.7717231 [DOI] [PubMed] [Google Scholar]
- 25.Lang N, Su M-Y, Yu HJ, Lin M, Hamamura MJ, Yuan H. Differentiation of myeloma and metastatic cancer in the spine using dynamic contrast-enhanced MRI. Magn Reson Imaging 2013; 31: 1285–91. doi: 10.1016/j.mri.2012.10.006 [DOI] [PMC free article] [PubMed] [Google Scholar]
- 26.Wang Y, Simon MA, Bonde P, Harris BU, Teuteberg JJ, Kormos RL, et al. Decision tree for adjuvant right ventricular support in patients receiving a left ventricular assist device. J Heart Lung Transplant 2012; 31: 140–9. doi: 10.1016/j.healun.2011.11.003 [DOI] [PMC free article] [PubMed] [Google Scholar]
- 27.Batterham PJ, Christensen H, Mackinnon AJ. Modifiable risk factors predicting major depressive disorder at four year follow-up: a decision tree approach. BMC Psychiatry 2009; 9: 75. doi: 10.1186/1471-244X-9-75 [DOI] [PMC free article] [PubMed] [Google Scholar]
- 28.Fine JD, Johnson LB, Tien H, Suchindran C, Bauer EA, Carter DM, et al. Classification and Regression Tree (Cart) Statistical Technique for Diagnosis of Major Types of Inherited Epidermolysis-Bullosa (Eb) - a Split Sample Analysis of the National Eb Registry Dataset. J Invest Dermatol 1994; 103: 846–8. [Google Scholar]


